Article

Unveiling Temporal Cyclicities in Seismic b-Values and Major Earthquake Events in Japan by Local Singularity Analysis and Wavelet Methods

1
School of Earth Science and Engineering, Sun Yat-sen University, Zhuhai 519080, China
2
School of Earth Science and Resources, China University of Geosciences, Beijing 130087, China
3
State Key Lab of Geological Processes and Mineral Resources, China University of Geosciences, Beijing 100083, China
4
DDE Frontier Science Center, China University of Geosciences, Beijing 100083, China
*
Author to whom correspondence should be addressed.
Fractal Fract. 2024, 8(6), 359; https://doi.org/10.3390/fractalfract8060359
Submission received: 5 May 2024 / Revised: 9 June 2024 / Accepted: 10 June 2024 / Published: 17 June 2024
(This article belongs to the Section Engineering)

Abstract

:
Studying the temporal characteristics of earthquake activity contributes to enhancing earthquake prediction capabilities. The seismic b-value is a key indicator describing the relationship between seismic frequency and magnitude. This study investigates the correlation between the occurrence of major earthquakes and seismic b-values using earthquake activity records in Japan from 1990 to 2023. Local singularity analysis and wavelet analysis of earthquake frequency and b-value time series reveal significant 5-year periodic features in seismic activity in Japan. Furthermore, our research identifies that this periodicity is also prominent in major earthquakes with magnitudes of 7 and above. Additionally, through a detailed analysis of the cross-correlation between seismic b-values and the occurrence time of major earthquakes, we uncover a notable pattern: major earthquakes often occur approximately two years after the peak of seismic b-values. This discovery offers a new perspective on earthquake prediction and may play a crucial role in future earthquake early warning systems.

1. Introduction

Earthquakes, as natural phenomena of sudden energy release within the Earth, possess significant destructive power and elusive unpredictability. Japan, situated in the Circum-Pacific seismic belt, experiences frequent seismic activity with considerable hazards. Studying the temporal characteristics of earthquake activity contributes to enhancing earthquake prediction capabilities, providing crucial evidence for optimizing disaster prevention and mitigation strategies, and reducing seismic disaster risks.
The frequency of earthquakes, along with their magnitudes, and the relationship between them are essential indicators for assessing the intensity of earthquake occurrences. Frequency refers to the number of earthquakes happening in a specific area, while magnitude represents the quantified measure of earthquake intensity, typically denoted using Richter scale levels.
In the mid-20th century, Gutenberg and Richter proposed the Gutenberg-Richter relationship between number and magnitude of earthquakes [1] as:
logN = a − bM,
This equation introduces the b-value as a parameter describing the relationship between earthquake frequency and magnitude. A higher b-value indicates a relatively higher frequency of smaller earthquakes compared to larger ones. This relationship aids seismologists in better understanding the patterns and trends of seismic activity, aiding in earthquake prediction. Therefore, earthquake frequency and related features, including magnitude and b-value, are crucial indicators for evaluating the intensity and likelihood of earthquake occurrences.
Previous research suggests that the b-value can serve as a significant indicator of stress levels within a region [2,3,4,5], with its variations providing vital information about crustal stress accumulation and release [6,7]. Studies employing the b-value method on past seismic events indicate that temporal changes in the b-value can be considered precursors to major earthquake activity [8,9,10,11,12,13].
Japan, as one of the regions with the most frequent seismic activities, serves as an excellent area for studying earthquakes. Regarding the temporal characteristics of seismic activities in Japan, scholars have conducted research from various perspectives. For instance, Sidorin examined the diurnal cycle characteristics of seismic activities with different energy levels in Japan. This research, by utilizing the improved Rayleigh-Schuster method and Lomb-Scargle periodogram, reveals the diurnal periodicity of seismic activities in Japan, indicating the notable midday effect [14]. Lyubushin predicted seismic hazards by observing the temporal variation characteristics of low-frequency seismic noise. In this study, the author utilized seismic noise data spanning 57 days to analyze seismic activities. The paper proposed that the time intervals between earthquake events can be estimated using the periodic structure of natural fluctuations in seismic hazard, suggesting a period of approximately 2.5 years [15]. Tanaka analyzed 29 earthquake events in the Japan Sea trench area and obtained the frequency spectrum of earthquake occurrence through Fast Fourier Transform. The results showed that earthquakes above magnitude 6.0 in the study area depict a periodic feature of approximately 9 years, and the periodicity of earthquake activities above magnitude 7.5 is even more significant [16].
Other examples of employing various methods for exploring the temporal characteristics of seismic activity through time series analysis include but not limited to utilization of the fixed-event-number method, which provides ample sample sizes for computation but may lack the ability to capture the time-varying characteristics of seismic activity [17], Bayesian methods that relies heavily on prior knowledge which leverage adaptability and probability modeling to improve the smoothing effect caused by traditional fixed-window signal processing [9]. From the above review we can see there are substantial studies of temporal characteristics of earthquakes in Japan with significant discoveries of cyclicity of earthquakes in various time scales such as midday, 2.5 years and 9 years. These works proved possibility of revealing cyclicity of earthquakes which is essential for temporal prediction of earthquakes. However, there are still lack of full understanding of the cyclicity of earthquakes in the study area. More researches are still needed to show temporal treading of earthquakes. New methods should be encouraged to explore the field.
Local singularity analysis (LSA) is a relatively new high-pass filtering method with multiscale invariance, capable of effectively capturing significant and abrupt variations in data occurring within a finite time or space range [18]. Due to various superimposed and interfering factors, such changes sometimes manifest weakly and gently, making them difficult to detect, yet they often contain rich information. Effectively enhancing and amplifying such weak and difficult-to-identify signals provides researchers with a unique and powerful tool, enabling them to delve deeper into the dynamic evolution patterns and inherent structural characteristics of complex systems. When conducting local singularity analysis, nonlinear filtering techniques are typically employed. The uniqueness of such techniques lies in their ability to effectively remove trend changes caused by nonlinear factors from intricate signals, thereby allowing periodic fluctuations or other key features hidden behind these trends to be clearly revealed. Local singularity analysis is often used in the preprocessing of data for time series spectrum analysis, such as Fourier transforms or wavelet transforms, with results showing significant improvements in the analysis of preprocessed time series data [19].
The local singularity analysis have been successfully utilized to explore complex and nonlinear extreme geological events and geological processes, especially in the field of geochemistry [20,21]. For instance, local singularity analysis method has been applied to the analysis of global zircon U-Pb ages which uncovers the evolutionary process of the continental crust [18].
Earthquakes are a type of extreme geological event. By applying local singularity analysis to evaluate the spatio-temporal distribution of earthquakes, we can gain a deeper understanding of their mechanisms. In this study, we innovatively use local singularity analysis methods on both seismic frequency data and temporal series analysis of the b-value. We calculate and present the time-varying periodic changes in secondary seismic activities using wavelet analysis. Additionally, we explore the relationship between the seismic b-value and the occurrence time of large earthquakes through cross-correlation analysis. Unlike traditional approaches, our study adopts a novel perspective by utilizing interdisciplinary mathematical models and methods to uncover the temporal characteristics of seismic activities. Our findings offer a new and effective method for predicting earthquake activity patterns in Japan with greater accuracy.

2. Data and Methods

In this study, we utilized earthquake catalog data from the International Seismological Centre (ISC) (https://www.isc.ac.uk/ (accessed on 10 April 2024)) and the United States Geological Survey (USGS) (https://www.usgs.gov/ (accessed on 10 April 2024)), freely available for the years 1990 to 2023. As of 1 April 2024, earthquake records from the JMA earthquake catalog database of the International Seismological Centre were available for the period 1 January 1990, to 31 December 2022. Data for the period 1 January 2023, to 31 December 2023, were sourced from the USGS. After integration and cleaning, a total of 132,559 records of earthquakes with a magnitude of 3 and above were obtained, as depicted in Figure 1.
To reveal the temporal patterns in seismic b-values and major earthquake events, we employed the least squares method to calculate the monthly, quarterly, and annual average earthquake occurrence frequencies, as well as the b-values representing the frequency-magnitude relationship, for the Japan region from 1990 to 2023. Specifically, we computed these parameters for 408 months, 136 quarters, and 34 years.
The b-value calculated by the least squares method is:
b = n M i lgN i M i lgN i M i 2 n M i 2 ,
In this formula, Mi is the magnitude range, Ni is the number of earthquakes with magnitude greater than or equal to Mi in the corresponding range, and n is the total number of ranges. The root mean square error of linear fitting is expressed as:
σ = i = 1 n lgN i lgN i ^ 2 n ,
Subsequently, we conducted local singularity analysis [10] to calculate the local singularity indices for both earthquake frequency and b-values. To quantify the fractal nature of earthquake frequency and b-values, we investigate how the total number of data points, denoted as μ(ε), within a sampling box B(ε) of radius ε grows according to a power-law:
μ ( ε )   =   B ε du ε α ,
Derive its fractal density and its singularity index as follows [18]:
ρ ( ε ) = μ ε ε   = c ε Δ α ,
log [ ρ ( ε ) ] = log ( c ) Δ α log ε ,
Here, Δ α (1 − α ) represents the exponent of power-law function (5) which is termed singularity index measuring the degree of singularity of density when scale ε → 0. The value of Δ α can be estimated as the slop of the linear fitting by least square between values of log(ρ(ε)) and log(ε) The value c is a constant term.
According to the concept of fractal density and singularity, when Δ α   > 0, the density ρ(ε) shows positive anomaly with shape peak while the measuring scale approaches to infinitely small, when Δ α < 0, the density ρ(ε) approaches to zero while the measuring scale approaches to infinitely small, whereas Δ α = 0, the density ρ(ε) approaches to a constant while the measuring scale approaches to infinitely small. The situation of Δ α = 0, corresponds to normal density ρ(ε), whereas Δ α   0 corresponds to singularity. The significance of least square fitting for estimating the singularity are usually very high, for example, the determination coefficient of the least square regression calculated for the paper are all above 95% so through the paper it will not need to show the statistics to demonstrate the spastically significance of the analysis. More information about the tectnique can be found in [18].
Next, wavelet analysis was employed to the LSA processed data to determine the temporal periodic characteristics of earthquake occurrence frequency and b-values [19,22] and we utilized the obtained wavelet scaleograms and global wavelet power spectra to assess the periodic features of seismic activity. Setting the sample spacing as Δ t, the time series x( t i ) with a length of N can be expressed as follows [23]:
W ( s ) = Δ t s j = 0 N 1 x t i ψ Δ t j i s ,
Here, ψ is the mother wavelet, s is the scale expansion factor, and i represents the position movement. Subsequently, Gaussian transformation is performed using non-orthogonal and complex functions to obtain:
ψ ( t ) = π 1 / 4 e i ω t e 1 / 2 t 2 ,
where ω is the nondimensional frequency.
Additionally, we employed wavelet cross-correlation analysis [24] to determine the correlation coefficients between the b-value sequence and the occurrence of large-scale earthquake activity. Given two time series X and Y, the cross wavelet transform is:
W i XY = W i X s   ·   W i Y s
Then the wavelet cross-correlation can be expressed as:
R 2 s = S W i XY s s 2 S ( W i X s 2 / s )   ·   S ( W i Y s 2 / s )   ,
where S refers to the smoothing operator defined by the type of wavelet used, and R2 has a value range from 0 to 1, similar to the meaning of the traditional correlation coefficient, which can be understood as confidence.

3. Results

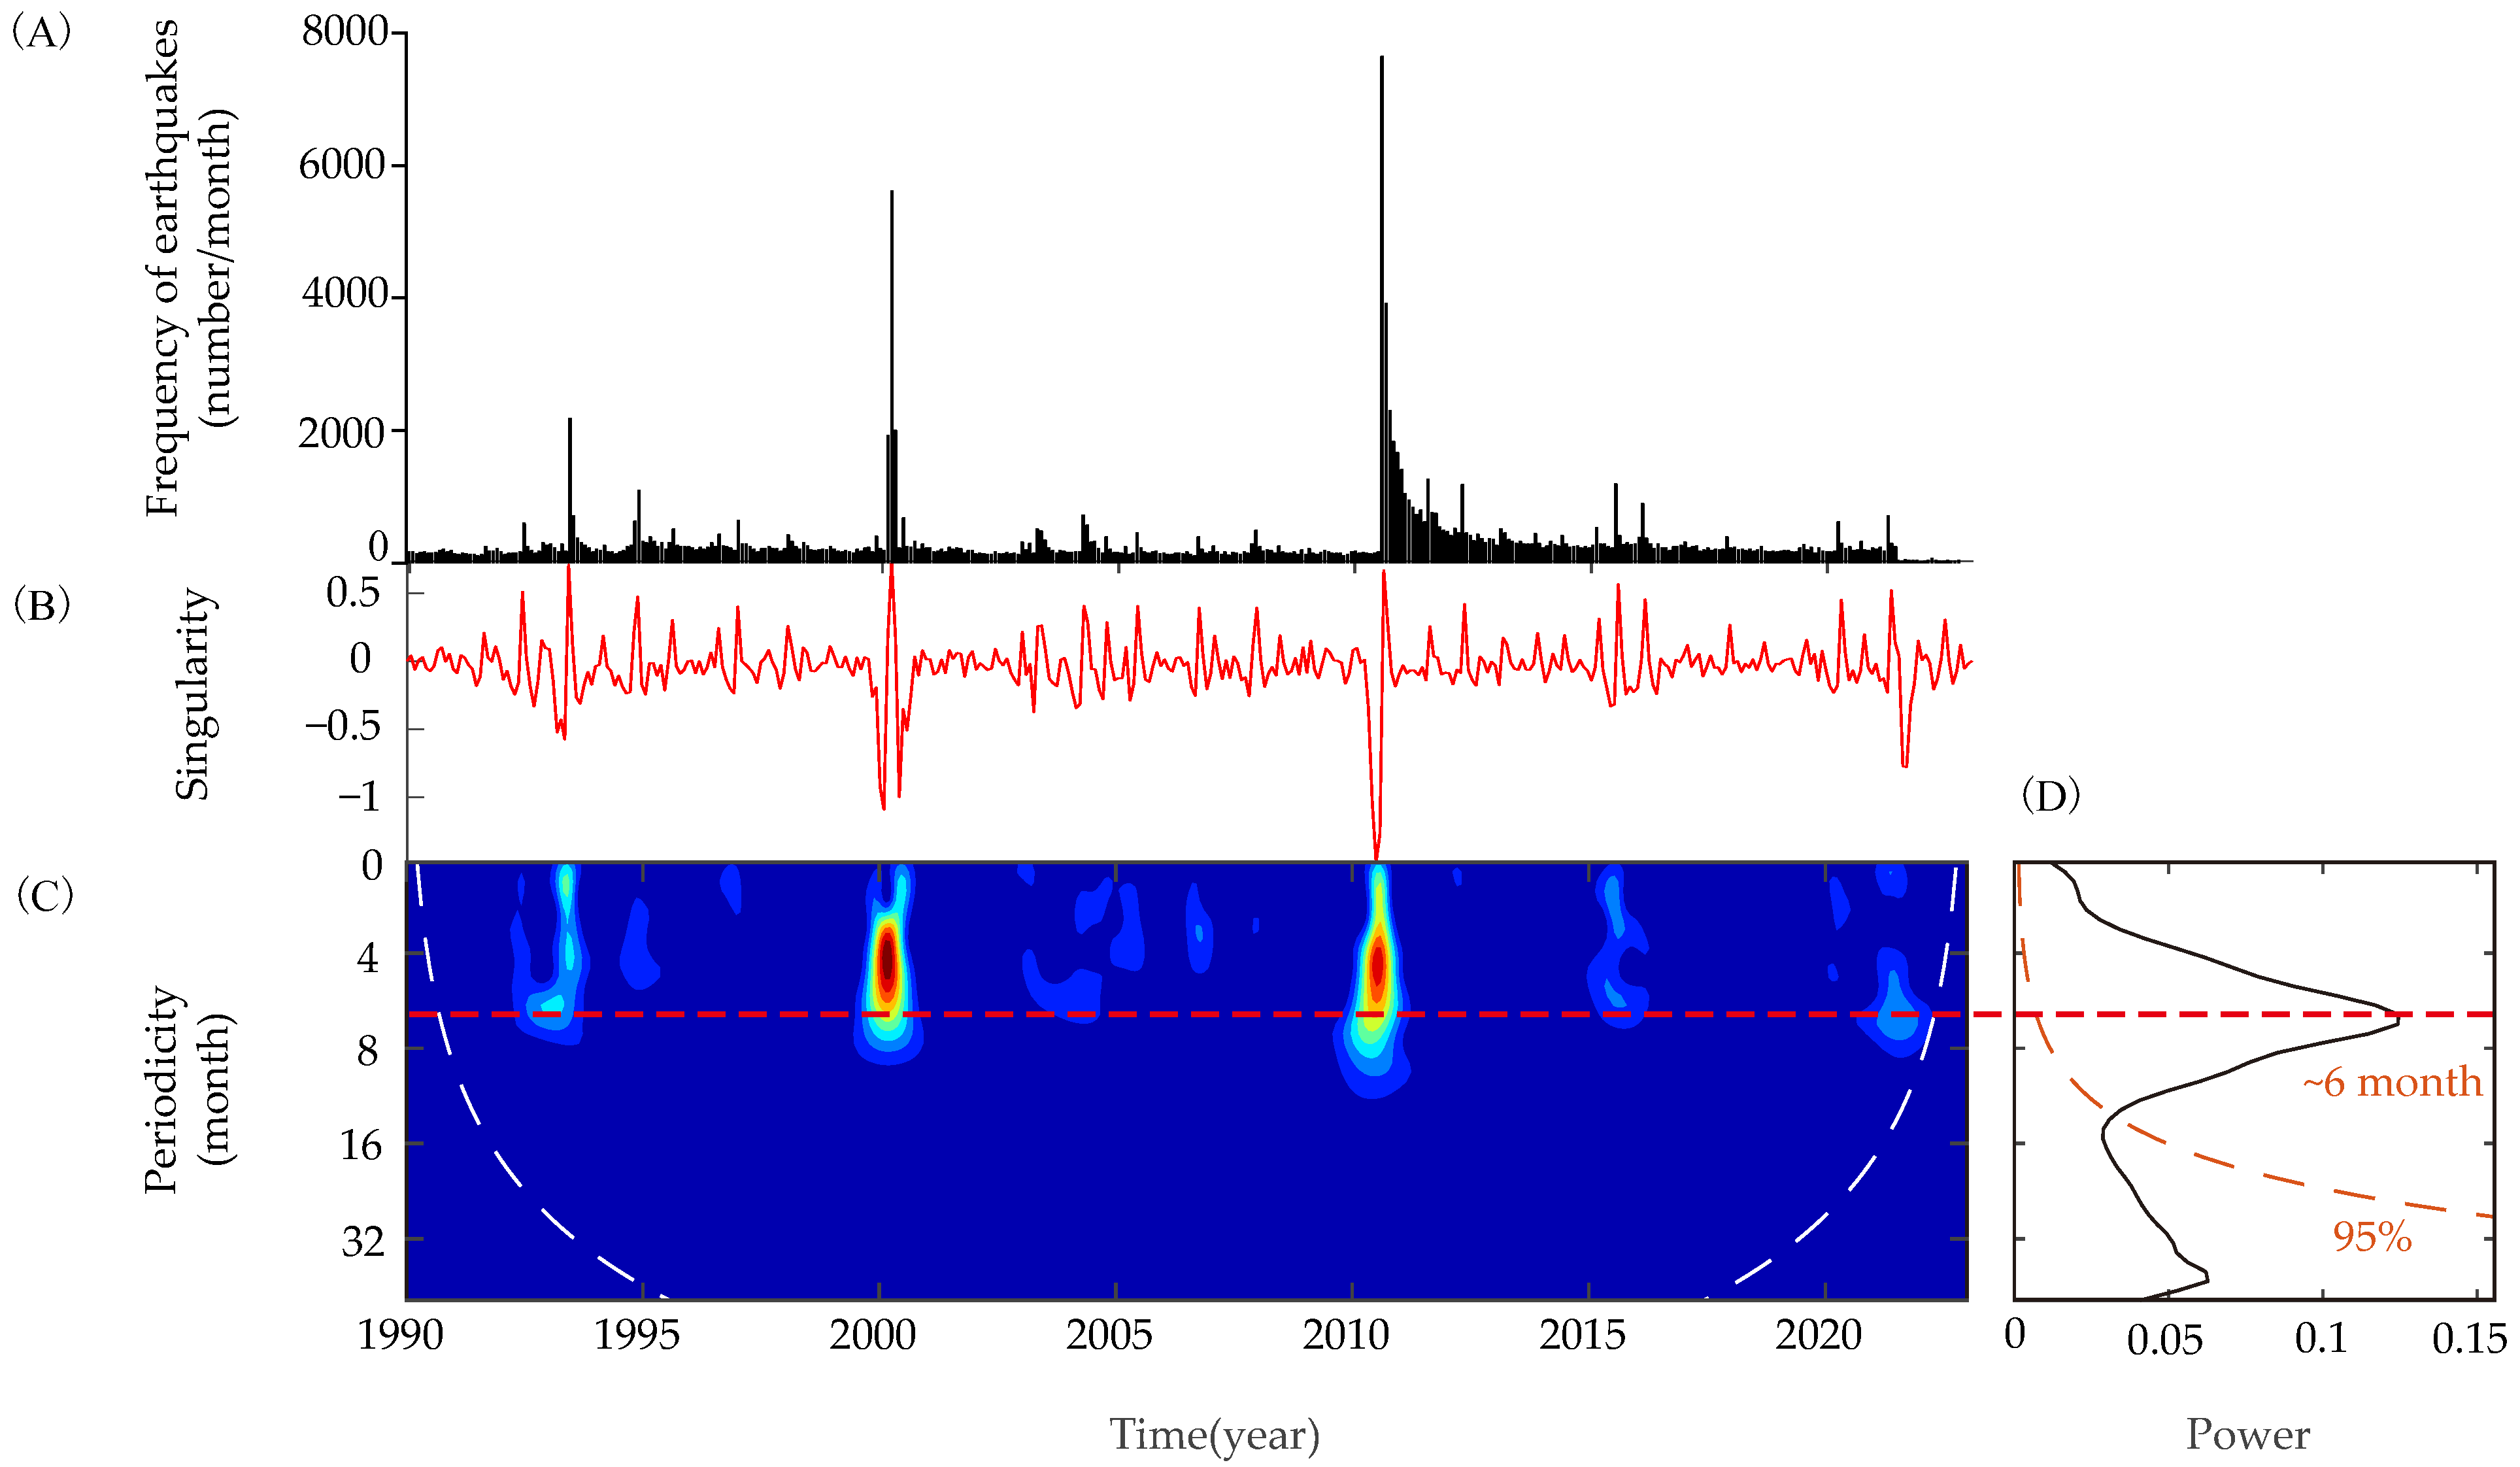
The time series analysis of monthly average earthquake occurrence frequencies and calculated b-values from 1990 to 2023, covering 408 months, revealed notable patterns. The trends in earthquake frequency variations are shown in Figure 2A. Using window sizes of 5 (Δt = 1, 3, 5, 7, 9 months), we calculated the local singularity indices of the earthquake frequency sequence according to Equation (6), with results shown in Figure 2B. Furthermore, wavelet analysis was conducted on the time series of local singularity indices (Figure 2B), as shown in Figure 2C,D. It can be observed that seismic activity in the Japan region from 1990 to 2023 exhibits certain periodic characteristics on a monthly time scale, with a periodicity of 6 month.
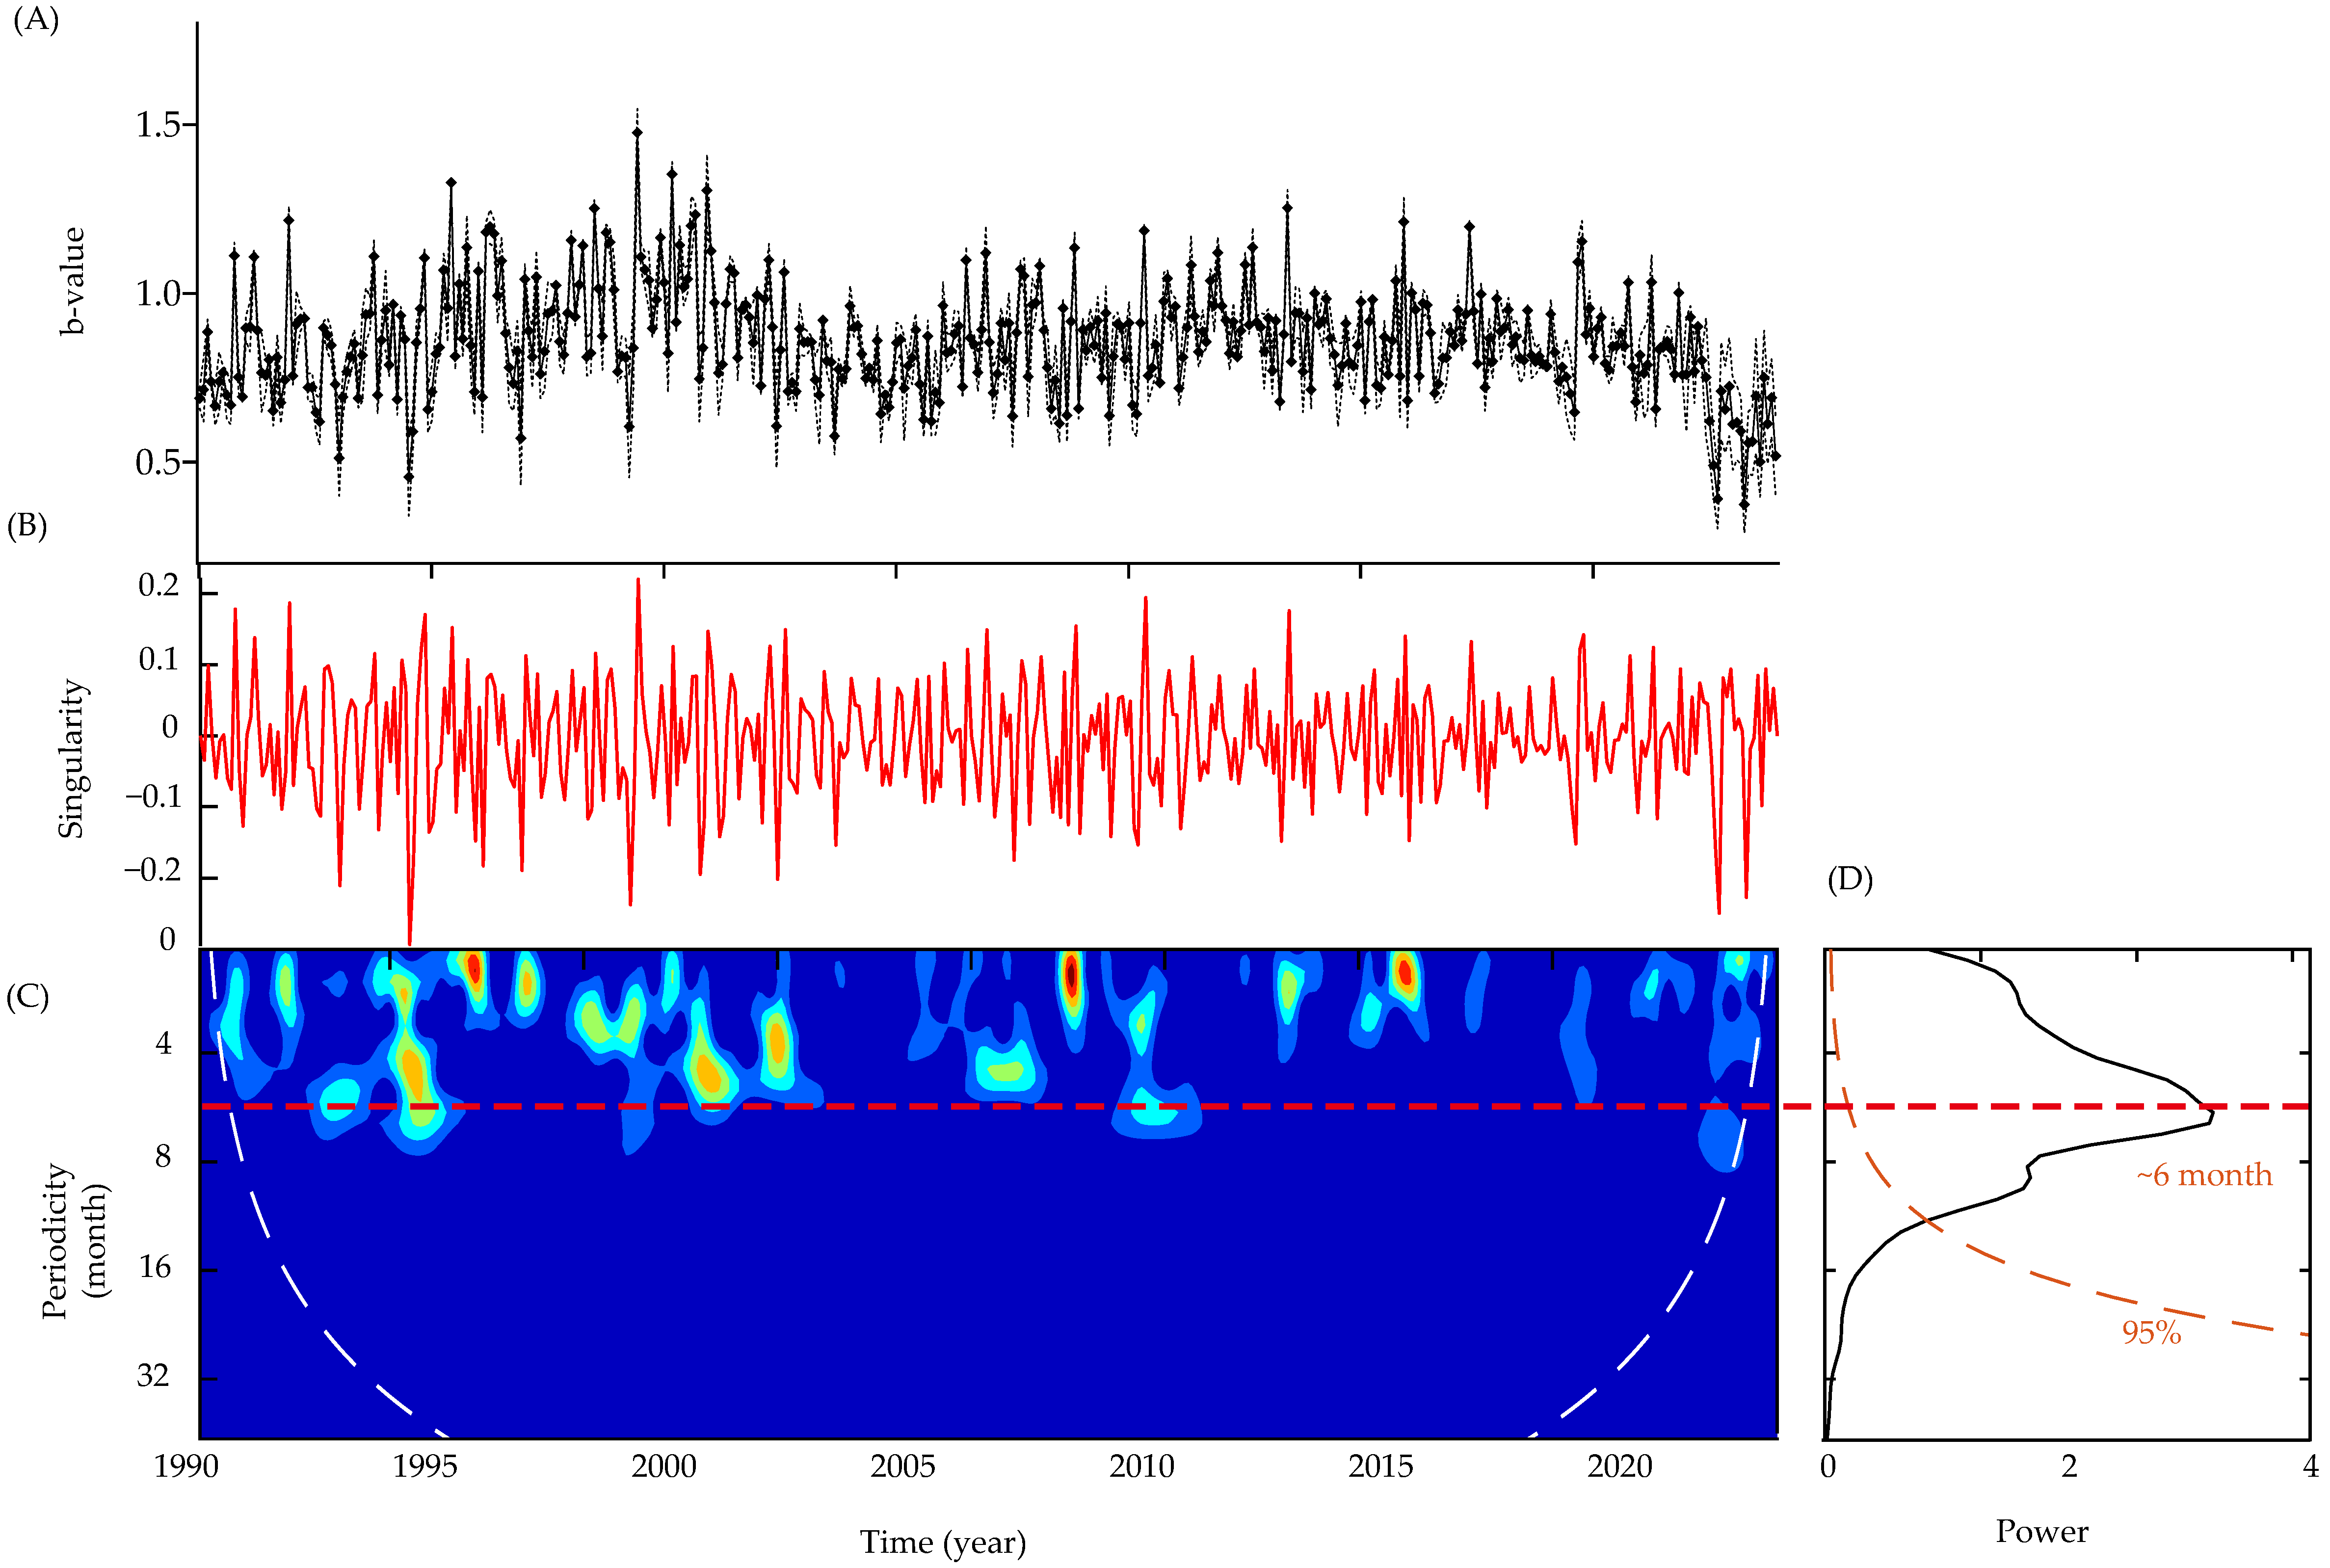
To compare the results of earthquake frequency with b-values, we computed the b-values for the relationship between earthquake frequency and magnitude on a monthly basis, forming a time series of b-values. Subsequently, we conducted local singularity index calculations analyses based on this b-value time series and then wavelet transform on the local singularity indices, as depicted in Figure 3. Earthquake magnitudes were categorized in increments of 0.5 from 3 to 8.5, generating two sets of data: earthquake frequency and magnitude. Using the least squares method, we fitted these two sets of data to obtain the b-values for each month (the slope of the fitting line between the logarithm of frequency and magnitude). The computed b-value results are shown in Figure 3A. Subsequently, using window sizes of 5 (Δt = 1, 3, 5, 7, 9 months), we calculated the local singularity indices of the b-value sequence, with results depicted in Figure 3B. Furthermore, we conducted wavelet analysis on the time series of local singularity indices, with results presented in Figure 3C,D. It is evident from the time series analysis results that the local singularity indices based on the earthquake b-value sequence in the wavelet transform plot also confirm the periodicity of seismic activity, consistent with the periodicity results obtained from the time series based on earthquake frequency calculations.
Using the same method, we conducted time series analysis on 136 quarters from 1990 to 2023. The local singularity index calculations were based on earthquake frequency with windows sizes of 1 to 5 quarters with an increment of a quarter or 3 months and a maximum interval of 15 months. A total of five intervals of different sizes were utilized. Subsequently wavelet transform was applied, and the results (Figure 4) suggest periodicity in seismic activity, with a period of approximately 6 quarters.
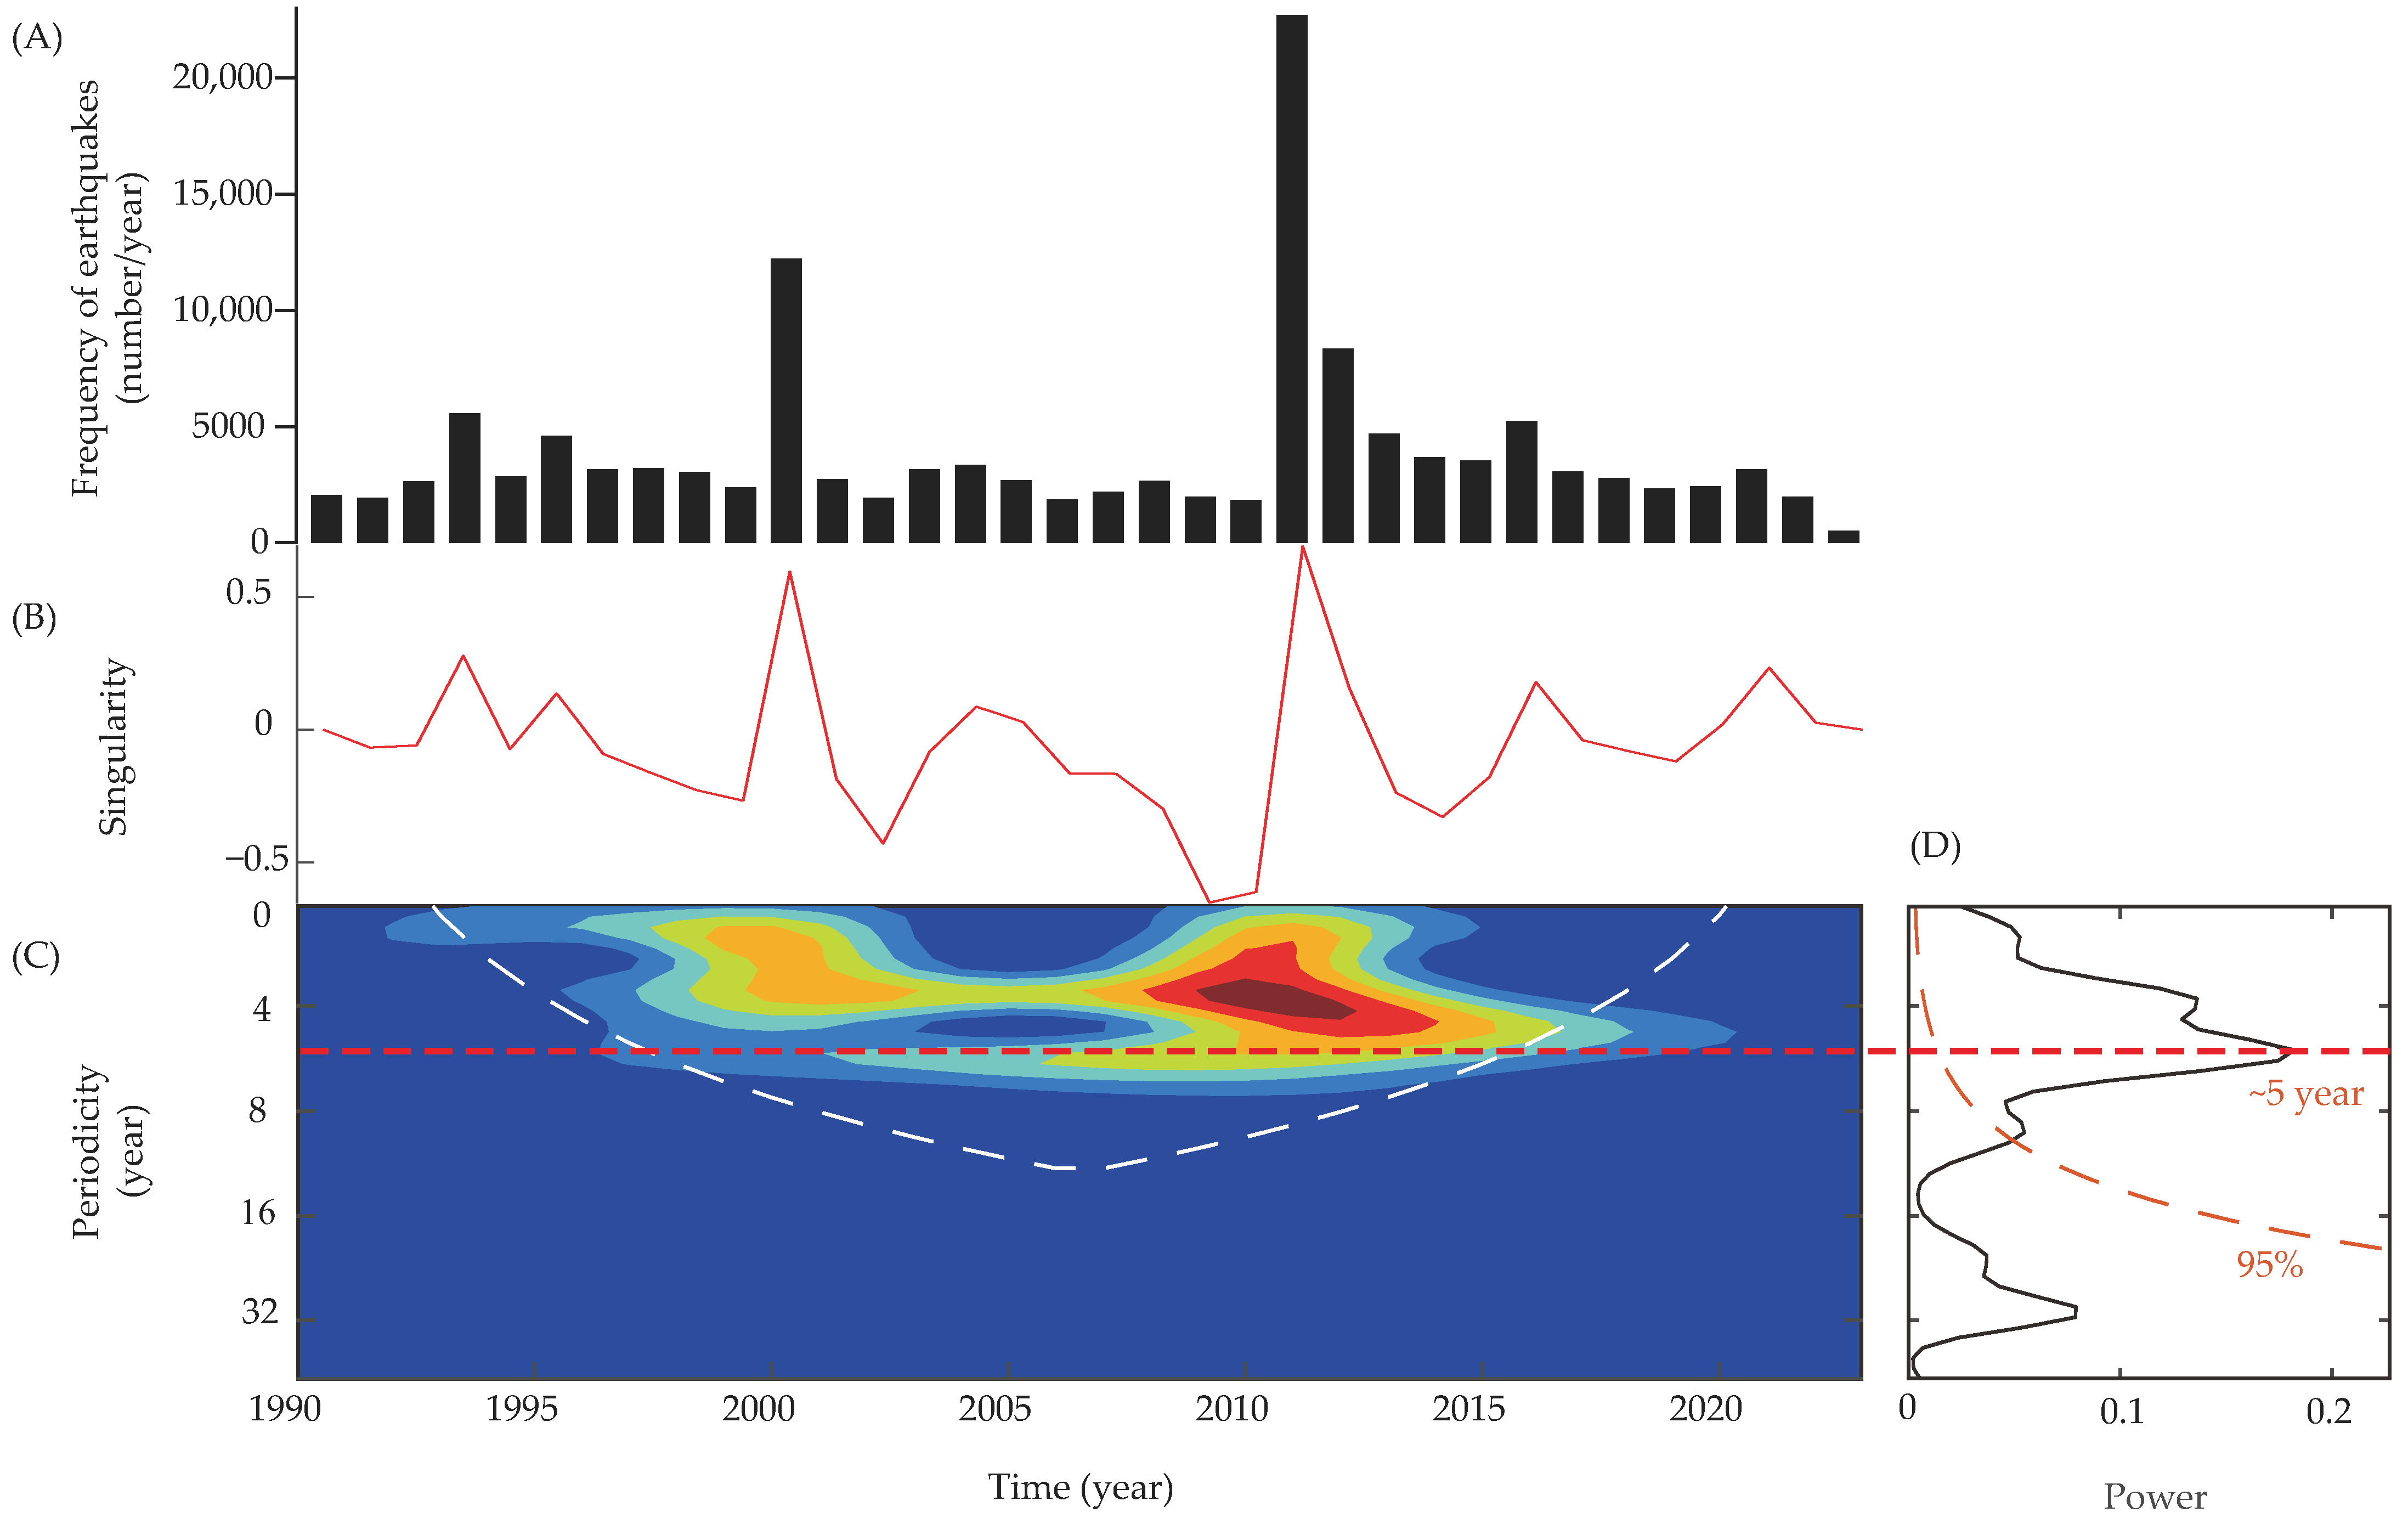
The same time series analysis methods were applied to the annual earthquake frequency data for the Japan region from 1990 to 2023, covering a period of 34 years. The local singularity indices were computed from the frequency sequence with five window sizes from 1 year with an increment of 2 years and a maximum interval of 9 years. Subsequently, wavelet transform was applied, and the results are depicted in Figure 5. The results clearly indicate a 5-year periodicity in seismic activity in the Japan region. Furthermore, compared to the analyses conducted on monthly and quarterly data, the wavelet scaleogram in Figure 5 demonstrates more pronounced energy representation.

4. Discussion

4.1. Time Series Analysis of Earthquake Frequency

The results of the local singularity index analysis based on earthquake frequency and the b-values both demonstrate that the singularity index effectively reflects frequency anomalies and complexities. Its variations sensitively capture changes in seismic activity over time. Furthermore, wavelet analysis clearly reveals the periodicity of earthquake activity. These results suggest that combining singularity indices with wavelet transforms could be an effective observational and early warning tool for earthquakes in the Japan region, aiding in monitoring and predicting changes in seismic activity trends. Previous studies have applied singularity indices to assess earthquake energy release [25]. When evaluating seismic activity, using the local singularity index as a diagnostic tool is significantly superior to traditional methods. Rooted in multifractal theory, the local singularity index allows for a comprehensive analysis of seismic activity characteristics from multiple perspectives, aiding in the thorough analysis of periodic changes in earthquake time series. Moreover, this index is highly sensitive to capturing subtle anomalies in earthquake activity, facilitating the acquisition of comprehensive information on seismic frequency distributions and effectively revealing cyclic patterns, thereby aiding in efficient early warning and risk mitigation strategies associated with earthquakes.

4.2. Time Series Analysis of Earthquake Frequency-Magnitude Relationship (b-Values)

From the physical perspective of earthquake b-values, they can represent the stress release characteristics of a specific region over a specific period. Higher b-values indicate more frequent release of stress from smaller earthquakes. The b-value reflects the relationship between earthquake frequency and magnitude rather than frequency itself, thus characterizing earthquake distribution features from different dimensions. The local singularity calculated based on earthquake frequency distribution represents more frequent seismic activity, whereas the local singularity calculated based on the b-value sequence represents anomalies in seismic magnitude variations (b-values). Similarly, the wavelet analysis of the b-value sequence also demonstrates the periodicity of seismic activity, which is consistent with the results obtained from the time series of earthquake frequency. It is worth noting that the quarterly cycle based on earthquake frequency calculations is 6 quarters or 18 months, while the cycle calculated based on the b-values is 5 quarters or 15 months. This might be associated with statistical error in the calculation of b-values. The 6 months and 5 year cycles calculated from both time series data are entirely consistent. Moreover, in the wavelet scaleogram, it is evident that the periodicity results are more significant when analyzing annual earthquake data.
In order to compare the results obtained on b-values for monthly, quarterly, and annual earthquake data, the three wavelet scaleograms are shown in Figure 6. It is evident that within the range of 1995 to 2011, the energy distribution in the wavelet scaleogram is significantly denser, indicating more pronounced cyclic characteristics of earthquakes during this period. However, after 2011, the distribution becomes sparser, suggesting a less prominent cyclic pattern in seismic activity. In March 2011, Japan experienced a powerful 9.0 magnitude earthquake, one of the strongest in nearly 35 years. This earthquake triggered widespread regional horizontal movements and continued horizontal slip in Northeast Asia [26,27], significantly altering the regional motion dynamics and leading to noticeable deformation post-earthquake [28,29,30]. These deformations may have altered the stress field in the Japan region, as reflected in the b-values, which represent the underground stress state [4], and manifested in the wavelet scaleogram obtained through periodic analysis based on b-values. Therefore, we hypothesize that there may be distinct cyclic characteristics in seismic periods before and after 2011 when conducting future statistical analyses of earthquake cycles.

4.3. Analysis of Major Earthquake Temporal Characteristics

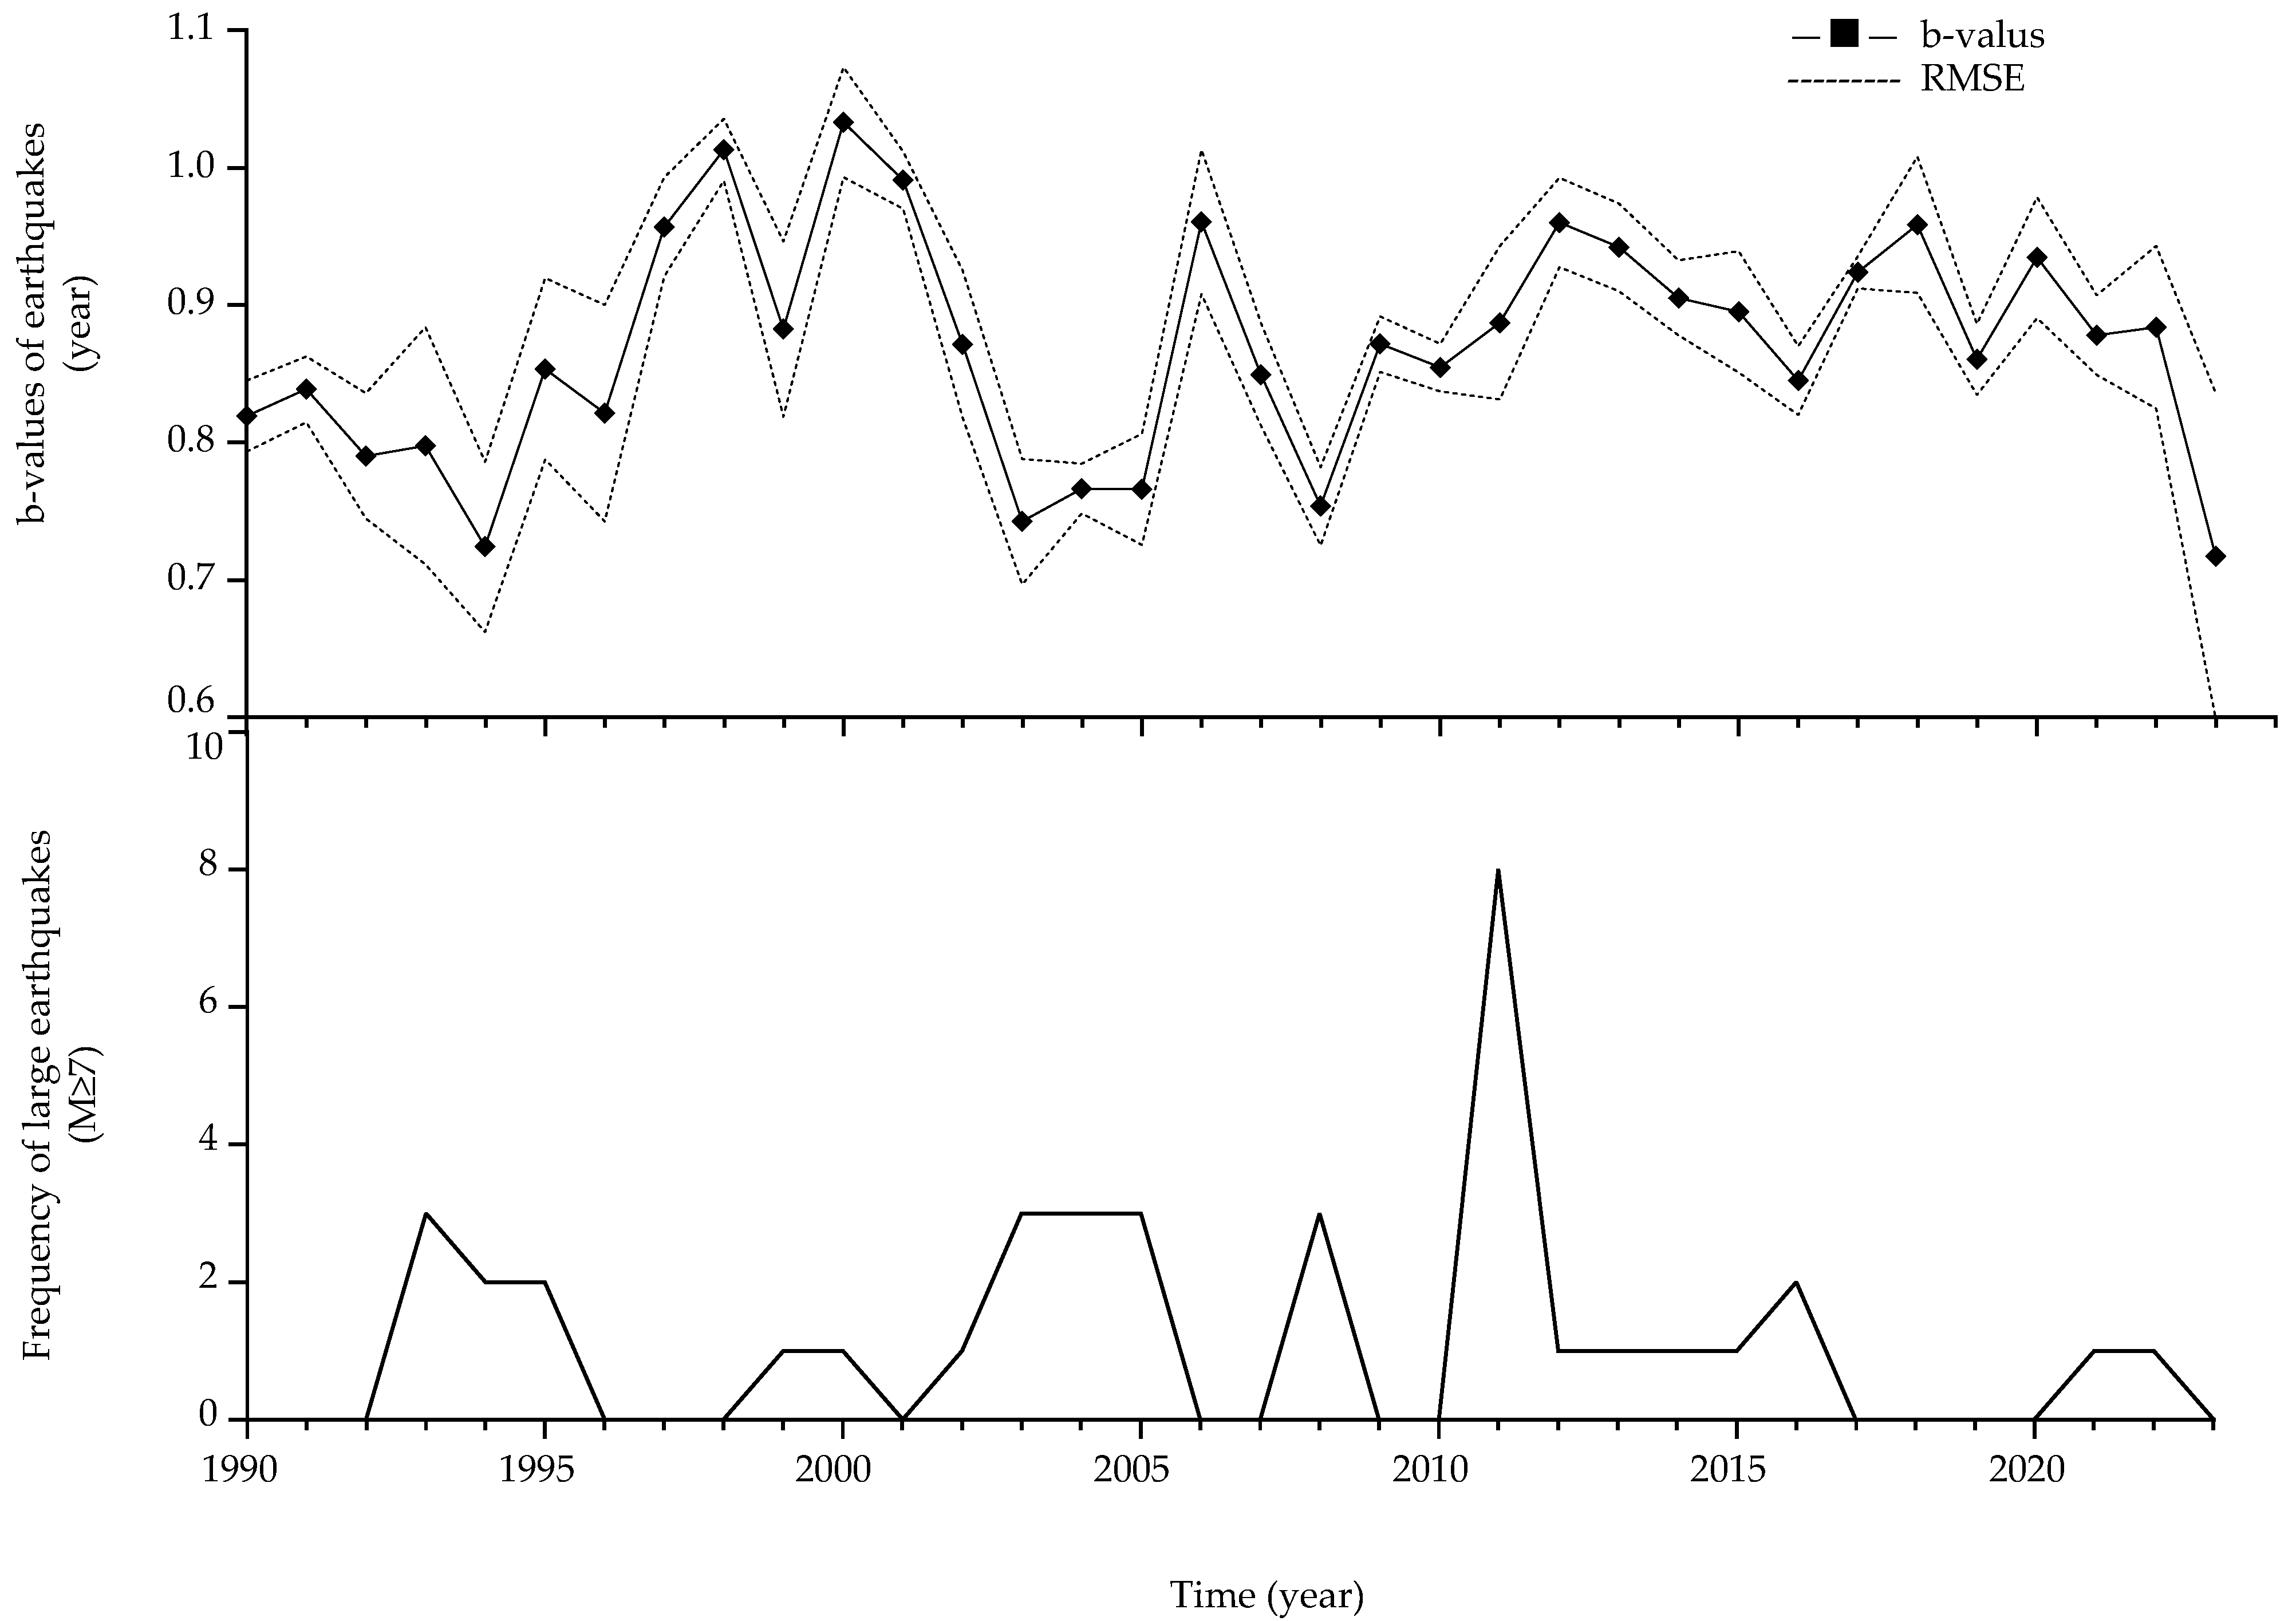
The current study also found a potential relationship between the occurrence of major earthquakes and earthquake b-values. We extracted data on earthquakes with a magnitude of 7 or higher from 1990 to 2023, conducted frequency statistics, and compared the results with earthquake b-values. The results (Figure 7) indicate a negative correlation between earthquake b-values and the frequency of major earthquakes. Previous studies have also linked the occurrence of earthquakes to the spatial distribution of b-values, suggesting that earthquakes are more likely to occur in areas with low b-values [31,32]. However, our focus is primarily on the predictability of earthquakes over time. It is important to note that this negative correlation is more apparent in overall statistical trends rather than strict monotonic relationships.
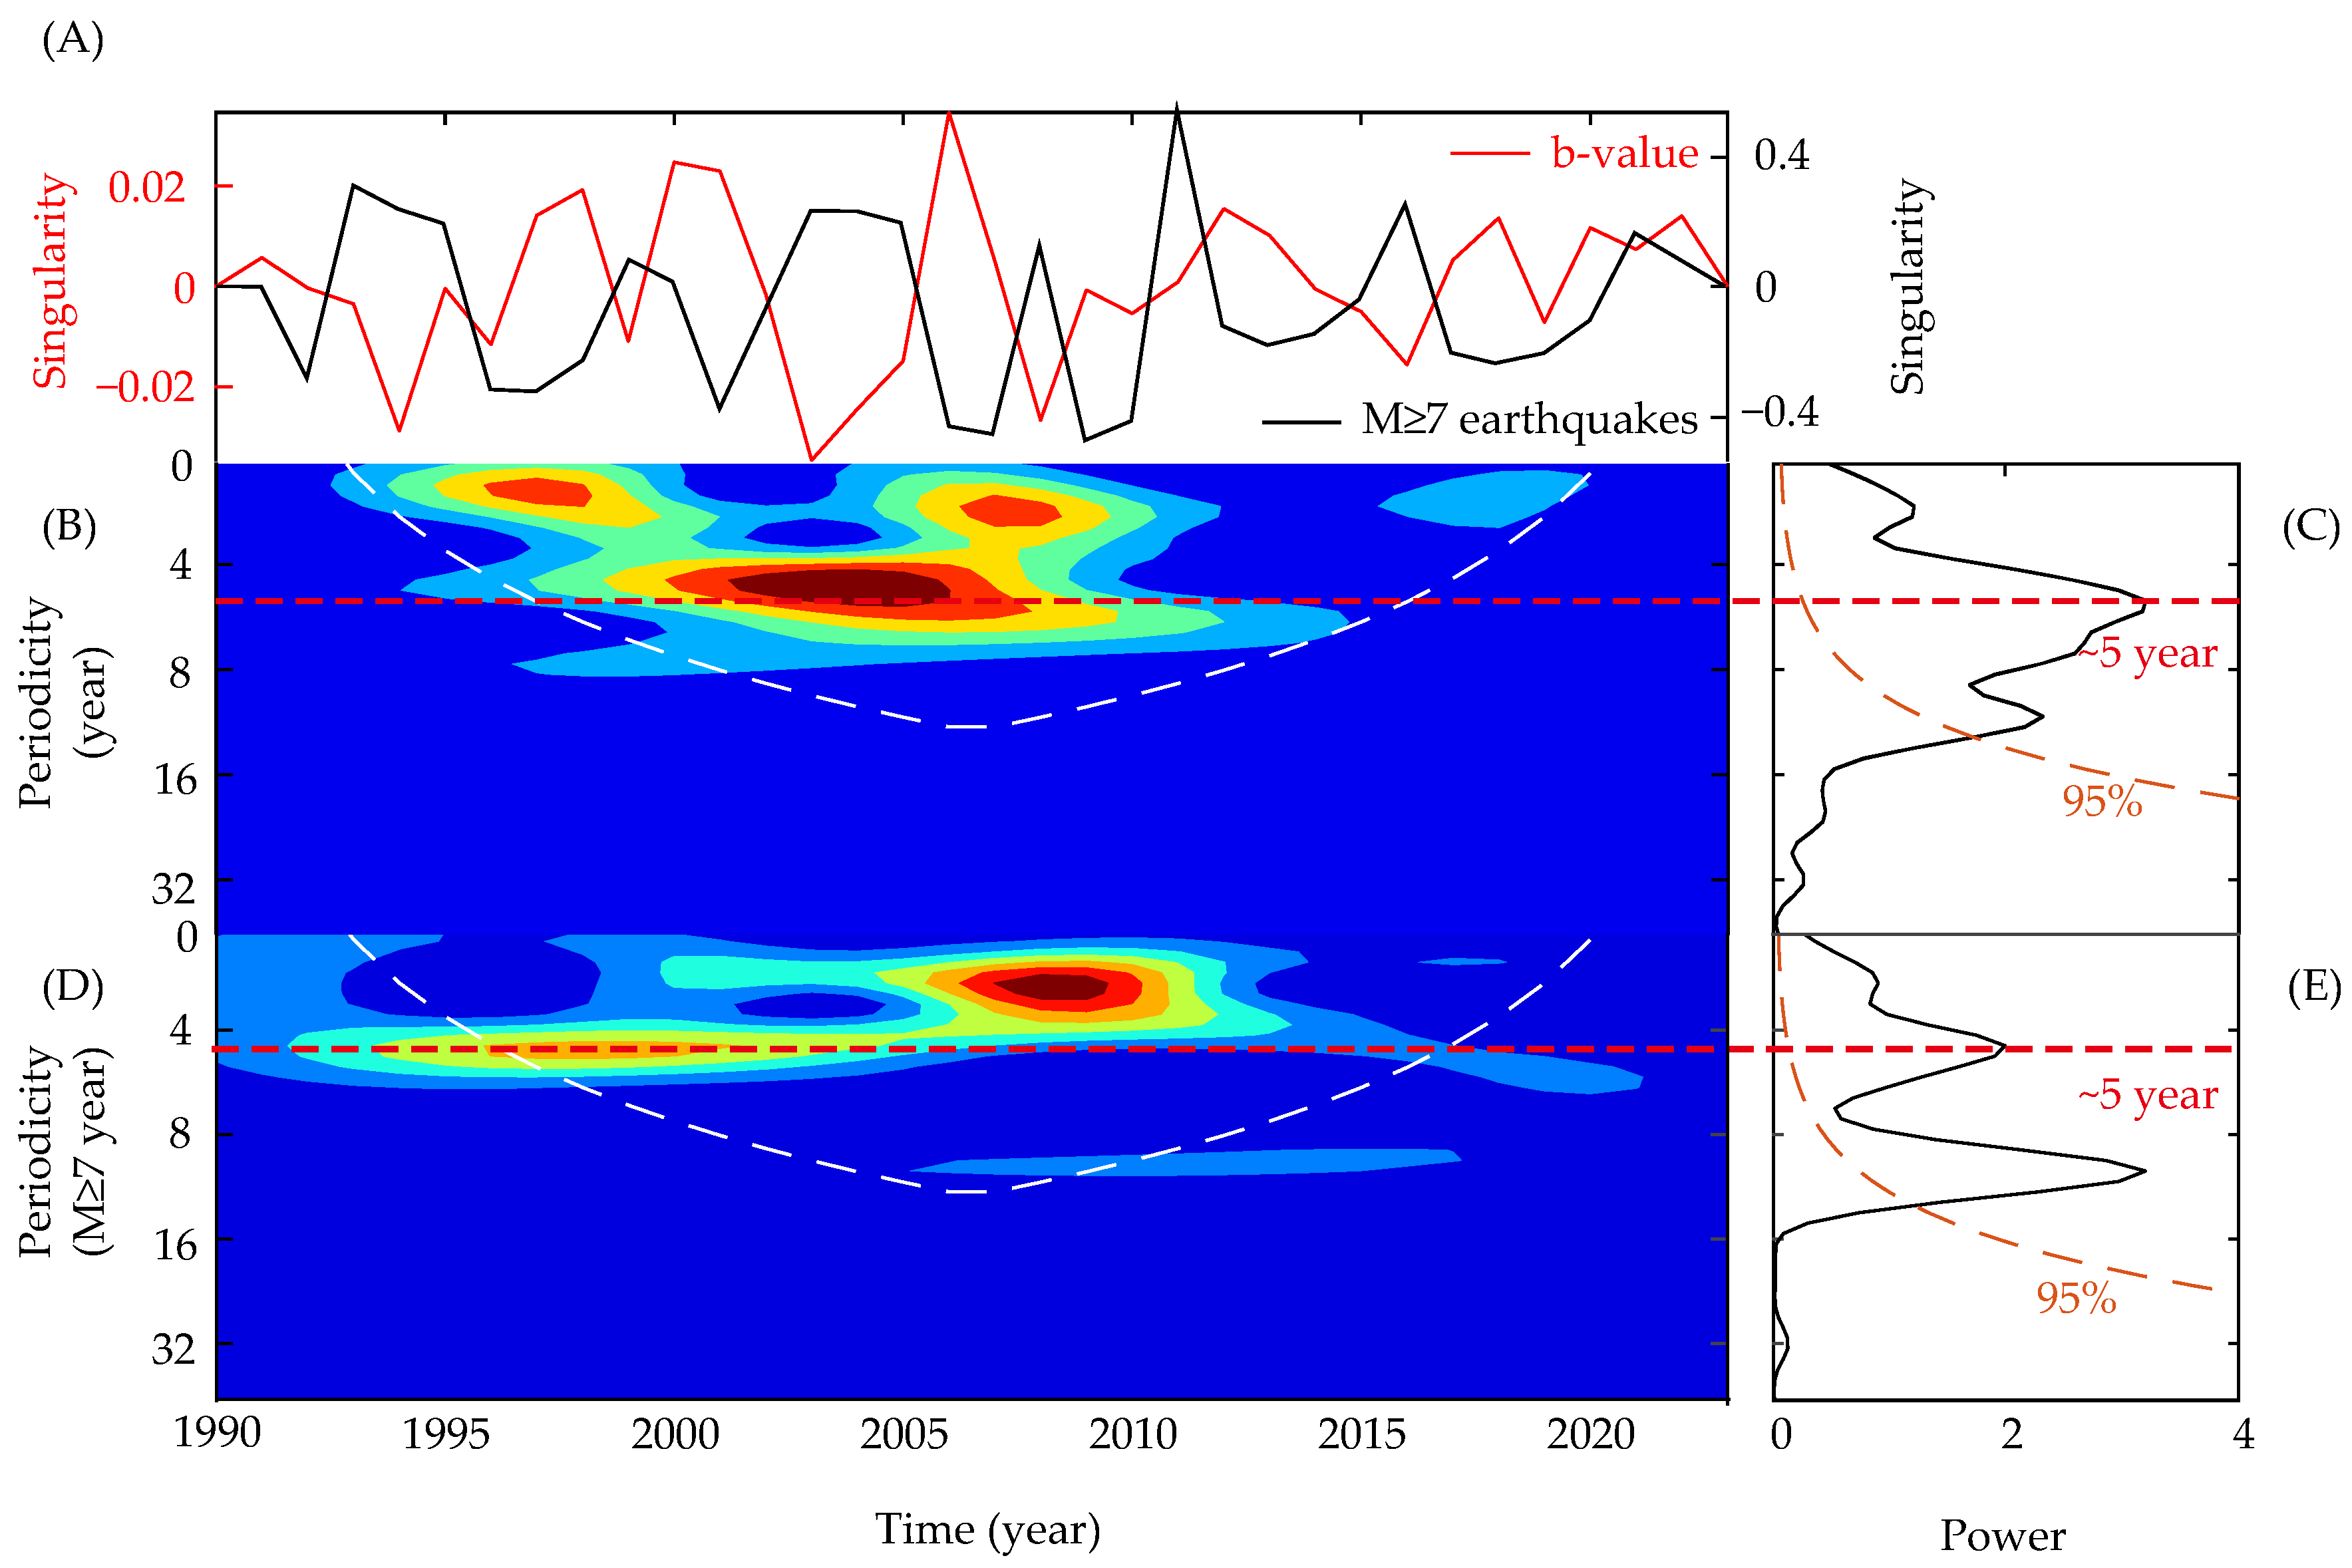
To further investigate the association among earthquake b-values, the frequency of major earthquakes, and seismic periodicity, we conducted the cross-correlation analysis and the results are shown in Figure 8. The results indicate that earthquakes with a magnitude of 7.0 or higher also exhibit a 5-year cyclic pattern (Figure 8D,E), and the positive peak singularity of the frequency of earthquakes with a magnitude of 7.0 or higher are highly correlated with the negative peak singularity of earthquake b-values. These indicate that the singularity identified from the peaks of frequency of earthquakes are temporally correlated with the singularity identified from the valleys of b-values of earthquakes.
Major earthquakes with a magnitude of 7.0 or higher share the same cyclic characteristics as overall seismic activity, implying a close relationship between the occurrence of high-magnitude earthquakes in Japan and the long-term accumulation and periodic release of crustal stress. This cyclic pattern is not only reflected in the majority of seismic events but is also prominent in major earthquakes. Several factors may contribute to this result: firstly, high-intensity earthquakes play a crucial role in crustal destruction and stress release [33,34]. Situated at the junction of multiple tectonic plates, the buildup and release of crustal stress through earthquakes are natural responses of Japan’s geological structure. Earthquakes with a magnitude of 7.0 or higher, due to their powerful magnitude and significant energy release, cause considerable damage to the crust and have a pronounced impact on seismic activity patterns. Seismic activity occurs at high levels also trigger more small sized earthquakes; while minor seismic activity in Japan is frequent but limited in impact, high-magnitude earthquakes, although less frequent, contribute significantly to overall seismic activity once they occur [35,36].
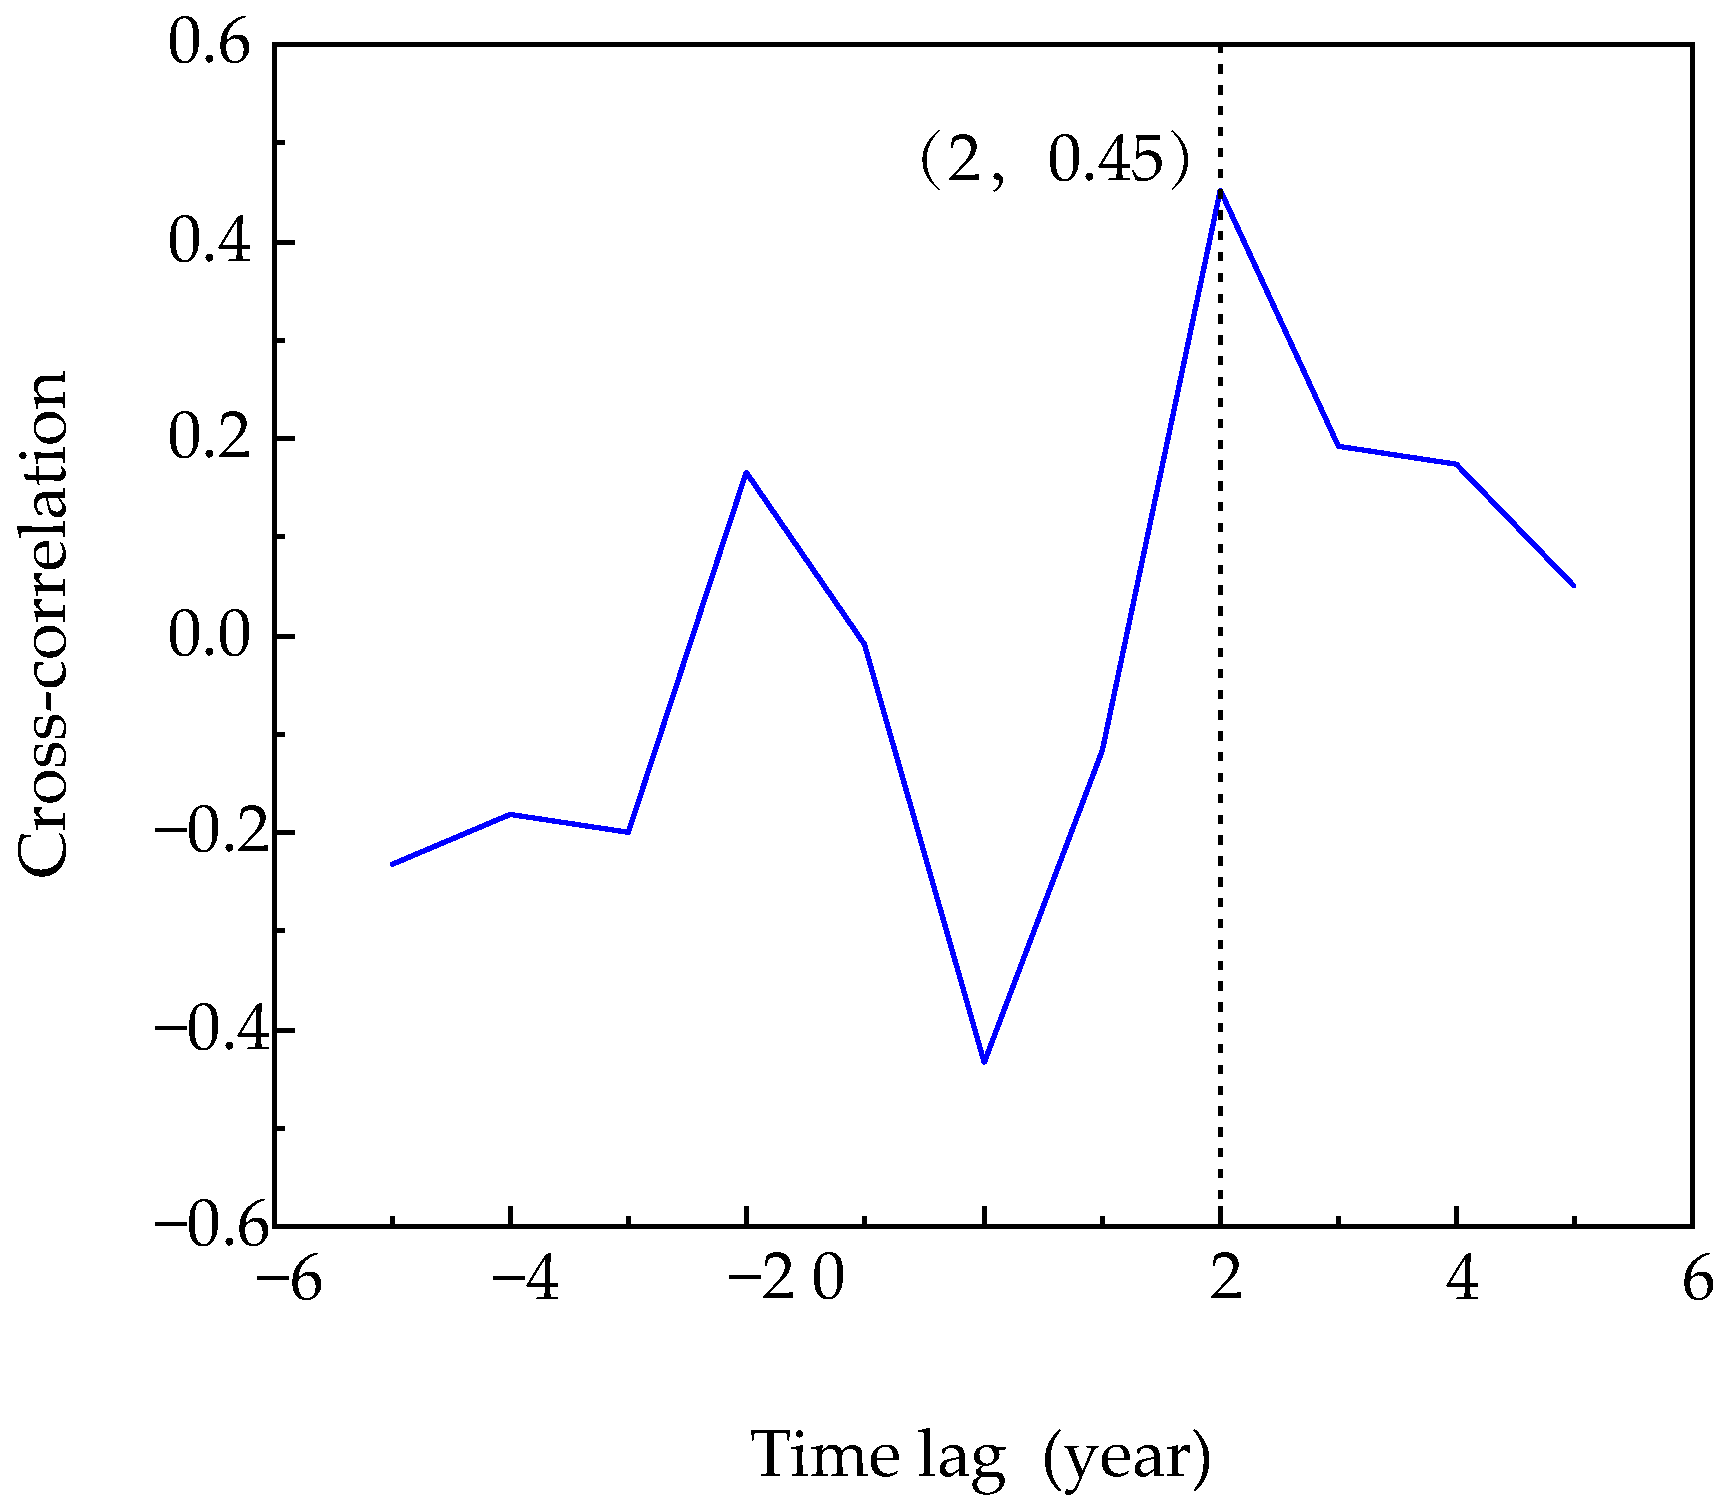
Further cross-correlation and time lag analysis between earthquake b-values and the frequency of earthquakes with a magnitude of 7.0 or higher (Figure 9) indicate that the occurrence of major earthquakes lags behind the peak of earthquake b-values by approximately 2 years. When the b-value reaches its low peak, it indicates that crustal stress accumulation has reached a high level. However, major earthquakes usually occur after the low peak of the b-value, indicating a time delay between stress concentration and actual earthquake occurrence. One possible reason for this phenomenon is the transient disturbances caused by instantaneous changes in crustal stress, which may lead to deformation or rupture of rocks that are in a critical state at a distance [37], thus causing a delay in earthquake occurrence. This delay feature can provide important signals for earthquake prediction.

5. Conclusions and Remarks

Due to the complexity and variability of seismic activity, accurate prediction of earthquakes is challenging. Both earthquake frequency and the relationship between frequency and magnitude are parameters that characterize seismic activity, but each has its limitations in quantifying changes in earthquake intensity. Therefore, in practical earthquake prediction, it is important to consider multiple parameters rather than relying solely on single parameter. In this study, we introduced the local singularity analysis and wavelet analysis methods to conduct time series analysis of seismic activity in Japan. We calculated the singularity of earthquake events based on changes in earthquake frequency and b-values, highlighting the dynamic characteristics of seismic activity. Subsequently, we applied wavelet analysis to the “filtered” data to further denoise and enhance the signals, avoiding interference from various noise sources in earthquake data. Our approach effectively revealed signal characteristics in both time and frequency domains, demonstrating good performance in understanding the complexity and dynamic nature of seismic signals.
Our results indicate that seismic activity in Japan, including earthquakes with magnitudes of 7.0 or higher, exhibits a 5-year periodicity, which is influenced by regional stress fields and stress states. Earthquake activity with magnitudes of 7.0 or higher in Japan also shows a 5-year periodicity, typically occurring around 2 years after the low peak in b-values. This implies that the occurrence of major earthquakes is closely related to changes in regional stress conditions and has a certain degree of time delay. The discovery of this time lag can provide new insights for earthquake prediction efforts. We reasonably hypothesize that there is a significant likelihood of an earthquake with a magnitude of 7.0 or above occurring in Japan between 2023 and 2028.
Although we have identified corresponding temporal characteristics of seismic activity in the Japanese region, this study also has some limitations. Primarily, it focused on exploring the temporal attributes of seismic activity without encompassing the development of earthquake prediction models. Furthermore, our research was specifically conducted in the Japanese region with limited temporal data from 1990 to now, leaving open the question of whether the similar results can be reproduced in in other regions or even globally. More thorough statistical evaluations of the results with more geological background information should be conducted. These are all directions worthy of further exploration in the future.

Author Contributions

Conceptualization, S.L. and Q.C.; methodology, Q.C., S.L. and Y.Z.; software, Y.Z.; validation, S.L. and Q.C.; formal analysis, S.L.; investigation, S.L.; data curation, S.L.; writing—original draft preparation, S.L.; writing—review and editing, Y.Z. and Q.C.; visualization, Y.Z.; supervision and project administration, Q.C. All authors have read and agreed to the published version of the manuscript.

Funding

This work was jointly supported by the National Natural Science Foundation of China (Grant No. 42050103), the Guangdong Province Introduced Innovative R&D Team of Big Data—Mathematical Geosciences and Extreme Geological Events Team (2021ZT09H399).

Data Availability Statement

Our data are the free earthquake directory on the official websites International Seismological Centre (ISC) (https://www.isc.ac.uk/ (accessed on 10 April 2024)) and the United States Geological Survey (USGS) (https://www.usgs.gov/ (accessed on 10 April 2024)).

Acknowledgments

The authors thank the editor and reviewers for critically reviewing the manuscript and for their constructive comments. Graduate student Xinkun Yang is also acknowledged for his assistance in data processing.

Conflicts of Interest

The authors declare no conflicts of interest.

References

  1. Gutenberg, B.; Richter, C.F. Frequency of earthquakes in California. Bull. Seismol. Soc. Am. 1944, 34, 185–188. [Google Scholar] [CrossRef]
  2. Mogi, K. Study of the elastic shocks caused by the fracture of heterogeneous materials and its relation to earthquake phenomena. Bull. Earthq. Res. Inst. 1962, 40, 831–853. [Google Scholar]
  3. Mogi, K. Magnitude-frequency relation for elastic shocks accompanying fractures of various materials and some related problems in earthquakes (2nd Paper). Bull. Earthq. Res. Univ. Tokyo 1963, 40, 831–853. [Google Scholar]
  4. Scholz, C.H. The frequency-magnitude relation of microfracturing in rock and its relation to earthquakes. Bull. Seismol. Soc. Am. 1968, 58, 399–415. [Google Scholar] [CrossRef]
  5. Wyss, M.; Schorlemmer, D.; Wiemer, S. Mapping asperities by minima of local recurrence time: San Jacinto-Elsinore fault zones. J. Geophys. Res. Solid Earth 2000, 105, 7829–7844. [Google Scholar] [CrossRef]
  6. Schorlemmer, D.; Wiemer, S.; Wyss, M. Variations in earthquake-size distribution across different stress regimes. Nature 2005, 437, 539–542. [Google Scholar] [CrossRef] [PubMed]
  7. Gui, Z.; Bai, Y.L.; Wang, Z.J.; Li, T.F. Seismic b-value anomalies in the Sumatran region: Seismotectonic implications. J. Asian Earth Sci. 2019, 173, 29–41. [Google Scholar] [CrossRef]
  8. Chen, X.; Li, Y.; Chen, L. The characteristics of the b-value anomalies preceding the 2004 Mw9.0 Sumatra earthquake. Geomat. Nat. Hazards Risk 2022, 13, 390–399. [Google Scholar] [CrossRef]
  9. Fiedler, B.; Hainzl, S.; Zöller, G.; Holschneider, M. Detection of Gutenberg-Richter b-value changes in earthquake time series. Bull. Seismol. Soc. Am. 2018, 108, 2778–2787. [Google Scholar] [CrossRef]
  10. Lacidogna, G.; Borla, O.; De Marchi, V. Statistical Seismic Analysis by b-Value and Occurrence Time of the Latest Earthquakes in Italy. Remote Sens. 2023, 15, 5236. [Google Scholar] [CrossRef]
  11. Suyehiro, S. Difference between aftershocks and foreshocks in the relationship of magnitude to frequency of occurrence for the great Chilean earthquake of 1960. Bull. Seismol. Soc. Am. 1966, 56, 185–200. [Google Scholar] [CrossRef]
  12. Gorgun, E. Analysis of the b-values before and after the 23 October 2011 Mw7.2VanErci, Turkeyearthquake. Tectonophysics 2013, 603, 213–221. [Google Scholar] [CrossRef]
  13. Sharma, V.; Biswas, R. Spatio-temporal variation in b-value prior to the 26 November 2021 Mizoram earthquake of northeastIndia. Geol. J. 2022, 57, 5361–5373. [Google Scholar] [CrossRef]
  14. Sidorin, A.Y. Features of the diurnal periodicity of earthquakes in Japan. Seism. Instrum. 2014, 50, 246–267. [Google Scholar] [CrossRef]
  15. Lyubushin, A.A. Cyclic properties of seismic noise and the problem of predictability of the strongest earthquakes in Japanese Islands. Atmos. Ocean. Phys. 2018, 54, 1460–1469. [Google Scholar] [CrossRef]
  16. Tanaka, Y. An approximately 9-yr-period variation in seismicity and crustal deformation near the Japan Trench and a consideration of its origin. Geophys. J. Int. 2014, 196, 760–787. [Google Scholar] [CrossRef]
  17. Hutton, K.; Woessner, J.; Hauksson, E. Earthquake Monitoring in Southern California for Seventy-Seven Years (1932–2008). Bull. Seismol. Soc. Am. 2010, 100, 423–446. [Google Scholar] [CrossRef]
  18. Cheng, Q. Singularity analysis of global zircon U-Pb age series and implication of continental crust evolution. Gondwana Res. 2017, 51, 51–63. [Google Scholar] [CrossRef]
  19. Chen, G.; Cheng, Q. Cyclicity and Persistence of Earth’s Evolution Over Time Wavelet and Fractal Analysis. Geophys. Res. Lett. 2018, 45, 8223–8230. [Google Scholar] [CrossRef]
  20. Cheng, Q.M. Mathematical Geosciences: Local Singularity Analysis of Nonlinear Earth Processes and Extreme Geo-Events. In Handbook of Mathematical Geosciences; Springer: Berlin/Heidelberg, Germany, 2018; pp. 179–208. [Google Scholar]
  21. Chen, Z.; Cheng, Q.; Chen, J.; Xie, S. A novel iterative approach for mappingocal singularities from geochemical data. Nonlinear Process. Geophys. 2007, 14, 317–324. [Google Scholar] [CrossRef]
  22. Chen, G.; Zhang, H. Wavelets in Geosciences. In Encyclopedia of Mathematical Geosciences; Springer International Publishing: Cham, Switzerland, 2021; pp. 1–11. [Google Scholar]
  23. Mallat, S. A Wavelet Tour of Signal Processing. Comput. Music. J. 2007, 31, 83–85. [Google Scholar]
  24. Torrence, C.; Compo, G.P. A Practical Guide to Wavelet Analysis. Bull. Am. Meteorol. Soc. 1997, 79, 61. [Google Scholar] [CrossRef]
  25. Cheng, Q.; Sun, H. Variation of singularity of earthquake-size distribution with respect to tectonic regime. Geosci. Front. 2018, 9, 453–458. [Google Scholar] [CrossRef]
  26. Ozawa, S.; Nishimura, T.; Suito, H.; Kobayashi, T.; Tobita, M.; Imakiire, T. Coseismic and postseismic slip of the 2011 magnitude-9 Tohoku-Oki earthquake. Nature 2011, 475, 373–376. [Google Scholar] [CrossRef] [PubMed]
  27. Yu, H.Y.; Zhao, L.; Liu, Y.J.; Ning, J.Y.; Chen, Q.F.; Lin, J. Stress adjustment revealed by seismicity and earthquake focal mechanisms in northeast China before and after the 2011 Tohoku-Oki earthquake. Tectonophysics 2016, 666, 23–32. [Google Scholar] [CrossRef]
  28. Shao, Z.G.; Zhan, W.; Zhang, L.P.; Xu, J. Analysis of the Far-Field Co-seismic and Post-seismic Responses Caused by the 2011 MW 9.0 Tohoku-Oki Earthquake. Pure Appl. Geophys. 2016, 173, 411–424. [Google Scholar] [CrossRef]
  29. Wang, M.; Shen, Z.K. Present-Day Crustal Deformation of Continental China Derived From GPS and Its Tectonic Implications. J. Geophys. Res.-Solid Earth 2020, 125, e2019JB018774. [Google Scholar] [CrossRef]
  30. Zhao, Q.; Fu, G.Y.; Wu, W.W.; Liu, T.; Su, L.N.; Su, X.N.; Shestakov, N.V. Spatial-temporal evolution and corresponding mechanism of the far-field post-seismic displacements following the 2011 M w 9.0 Tohoku earthquake. Geophys. J. Int. 2018, 214, 1774–1782. [Google Scholar] [CrossRef]
  31. Gong, W.; Chen, H.; Gao, Y.; Li, Q.; Sun, Y. A test on methods for Mc estimation and spatial-temporal distribution of b-value in the eastern Tibetan Plateau. Front. Earth Sci. 2024, 12, 1335938. [Google Scholar] [CrossRef]
  32. Prasad, S.; Singh, C. Evolution of b-values before large earthquakes of mb ≥6.0 in the Andaman region. Geol. Acta 2015, 13, 205–210. [Google Scholar]
  33. Wu, W.; Long, F.; Liang, M.; Wei, Y.; Sun, W.; Chen, X.; Zhao, J. Spatial and Temporal Variations in Earthquake Stress Drops between the 2008 Wenchuan and 2013 Lushan Earthquakes. Acta Geol. Sin. (Engl. Ed.) 2020, 94, 1635–1650. [Google Scholar] [CrossRef]
  34. Zhao, G.M.; Wu, Z.H.; Liu, Y.H. Fault interaction, stress triggering and differential response of active faults in the southeastern margin of Qinghai-Tibet Plateau. Geol. Bull. 2014, 4, 470–484. [Google Scholar]
  35. Li, C.L. Re-estimate of Major Earthquake Activity in Surrounding Areas after the M-S 6.6 Jinghe Earthquake in Xinjiang, 2017. Pure Appl. Geophys. 2019, 176, 563–576. [Google Scholar] [CrossRef]
  36. Wyss, M.; Wiemer, S. Change in the probability for earthquakes in southern California due to the Landers magnitude 7.3 earthquake. Science 2000, 290, 1334–1338. [Google Scholar] [CrossRef]
  37. David, B.; Julia, M.; Yannick, C. Geometrically controlled slow slip enhanced by seismic waves: A mechanism for delayed triggering. Earth Planet. Sci. Lett. 2021, 554, 116695. [Google Scholar]
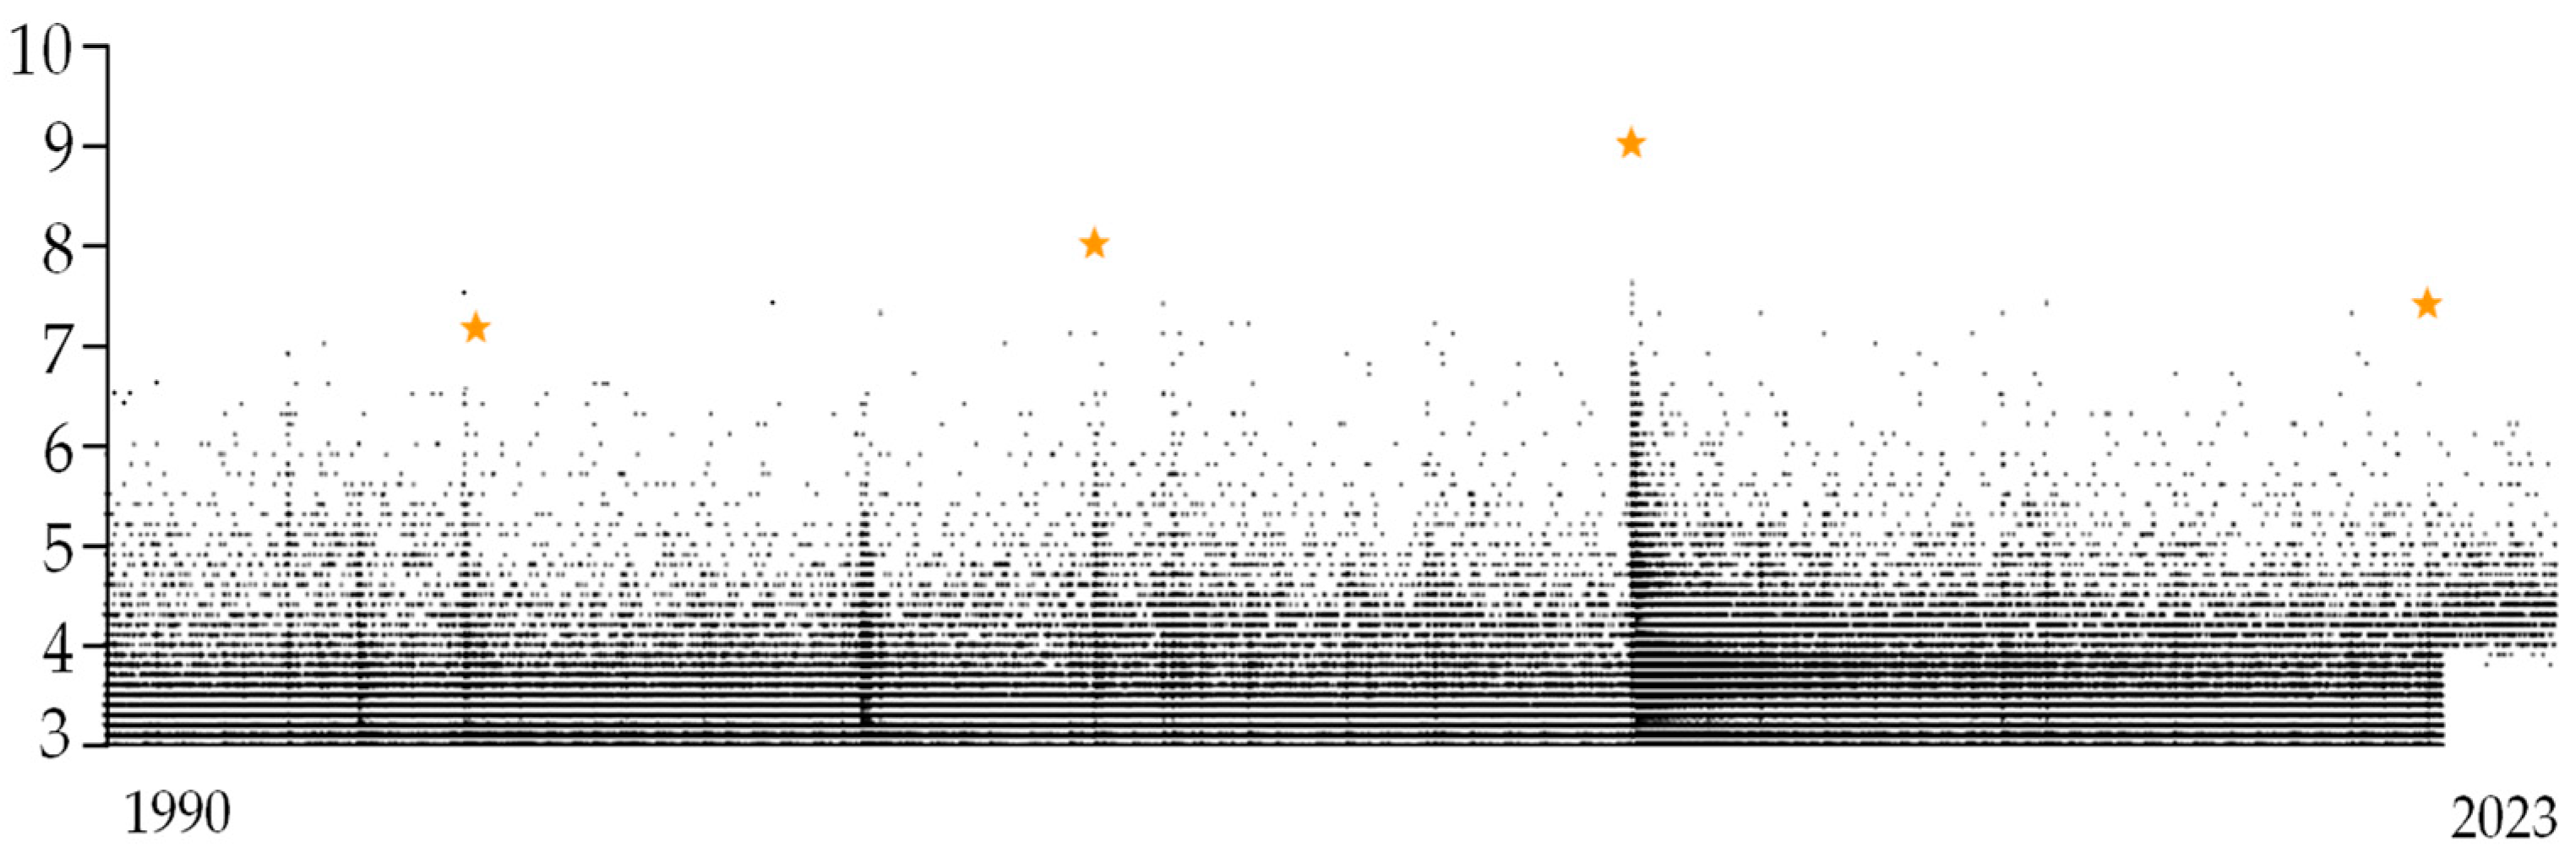
Figure 1. Seismic Magnitude-Time (M-T) plot for the Japan region from 1990 to 2023. Yellow pentagrams from left to right represent the 1995 Hanshin earthquake, the 2003 Hokkaido earthquake, the 2011 Great East Japan earthquake, and the 2022 Offshore Tohoku earthquake. (Data source: ISC&USGS).
Fractalfract 08 00359 g001
Figure 2. Time series analysis of earthquakes in months with magnitude 3 and above in the Japan region from 1990 to 2023. (A) Frequency distribution of earthquakes (B) Local singularity indices calculated using Equation (6); (C) Wavelet scaleogram obtained by applying wavelet analysis to the values of singularity index (B); and (D) Global wavelet power spectrum. Color legend on the right represent the level of power energy of (C). Dashed line represents the peak of power spectrum about 6 month.
Fractalfract 08 00359 g002
Figure 3. Time series analysis of earthquakes in months with magnitude 3 and above in the Japan region from 1990 to 2023. (A) b-values calculated from earthquakes with magnitude 3 and above in months; (B) Local singularity indices calculated using Equation (6) on the basis of v-values (A); (C) Wavelet scaleogram obtained by applying wavelet analysis to the values of singularity indices (B); and (D) Global wavelet power spectrum. Color legend on the right represent the level of power energy of (C). Dashed line represents the peak of power spectrum about 6 month.
Fractalfract 08 00359 g003
Figure 4. Time series analysis of earthquakes in quarters (three months) with magnitude 3 and above in the Japan region from 1990 to 2023. (A) Frequency distribution of earthquakes grouped in quarters; (B) Local singularity indices calculated using Equation (6) on the basis of value (A); (C) Wavelet scaleogram obtained by applying wavelet analysis to the values of singularity indices (B); and (D) Global wavelet power spectrum. Color legend on the right represent the level of power energy of (C). Dashed line represents the peak of power spectrum about 6 quarter.
Fractalfract 08 00359 g004
Figure 5. Time series analysis of earthquakes in years with magnitude 3 and above in the Japan region from 1990 to 2023. (A) Frequency distribution of earthquakes (B) Local singularity indices calculated using Equation (6); (C) Wavelet scaleogram obtained by applying wavelet analysis to the values of singularity indices (B); and (D) Global wavelet power spectrum. Color legend on the right represent the level of power energy of (C). Dashed line represents the peak of power spectrum about 5 year.
Fractalfract 08 00359 g005
Figure 6. Comparison of wavelet scaleogram results for earthquake b-values. (A) based on b-values from monthly data; (B) based on b-values from quarterly data; (C) based on b-values from annually data. The color legend on the right is for all three scaleograms. The vertical dashed red lines represent the two dates of the large earthquakes, 1995 Hanshin earthquake and the 2011 Great East Japan earthquake.
Fractalfract 08 00359 g006
Figure 7. Comparison of earthquake b-values (top) and frequency of earthquakes with magnitude 7.0 or higher (bottom) from 1990 to 2023. The black squares in the top figure represent the b-values calculated based on yearly averaged earthquake data, dashed lines for the root mean squared error (RMSE) associated with the calculation of b-values.
Fractalfract 08 00359 g007
Figure 8. Analysis of the time (year) series of earthquakes with a magnitude of 7.0 or higher in Japan from 1990 to 2023. (A) plots showing the local singularities calculated from b-values (red line) and frequency of earthquakes (black line) with a magnitude of 7.0 or higher; (B) Wavelet scaleogram calculated on the basis of singularity values from b-values of earthquake (red line in A). (C) Global wavelet power spectrum from (B). (D) Wavelet scaleogram calculated on the basis of singularity values from frequency of earthquake (black line in A). (E) Global wavelet power spectrum of (D). The dashed red lines represent the peaks of power spectra.
Fractalfract 08 00359 g008
Figure 9. Cross-correlation analysis between earthquake b-values and earthquakes with a magnitude of 7.0 or higher. The dashed line indicates the peak of correlation at a 2-year time.
Fractalfract 08 00359 g009
Disclaimer/Publisher’s Note: The statements, opinions and data contained in all publications are solely those of the individual author(s) and contributor(s) and not of MDPI and/or the editor(s). MDPI and/or the editor(s) disclaim responsibility for any injury to people or property resulting from any ideas, methods, instructions or products referred to in the content.