Article

A Novel Contact Stiffness Model for Grinding Joint Surface Based on the Generalized Ubiquitiformal Sierpinski Carpet Theory

1
Mechanical Electrical Engineering School, Beijing Information Science & Technology University, Beijing 100192, China
2
Key Laboratory of Modern Measurement and Control Technology, Ministry of Education, Beijing Information Science & Technology University, Beijing 100192, China
3
Department of Mechanical Engineering, State Key Laboratory of Tribology, Tsinghua University, Beijing 100084, China
*
Author to whom correspondence should be addressed.
Fractal Fract. 2024, 8(6), 351; https://doi.org/10.3390/fractalfract8060351
Submission received: 25 March 2024 / Revised: 5 June 2024 / Accepted: 8 June 2024 / Published: 12 June 2024
(This article belongs to the Special Issue Fractal Analysis and Fractal Dimension in Materials Chemistry)

Abstract

:
A novel analytical model based on the generalized ubiquitiformal Sierpinski carpet is proposed which can more accurately obtain the normal contact stiffness of the grinding joint surface. Firstly, the profile and the distribution of asperities on the grinding surface are characterized. Then, based on the generalized ubiquitiformal Sierpinski carpet, the contact characterization of the grinding joint surface is realized. Secondly, a contact mechanics analysis of the asperities on the grinding surface is carried out. The analytical expressions for contact stiffness in various deformation stages are derived, culminating in the establishment of a comprehensive analytical model for the grinding joint surface. Subsequently, a comparative analysis is conducted between the outcomes of the presented model, the KE model, and experimental data. The findings reveal that, under identical contact pressure conditions, the results obtained from the presented model exhibit a closer alignment with experimental observations compared to the KE model. With an increase in contact pressure, the relative error of the presented model shows a trend of first increasing and then decreasing, while the KE model has a trend of increasing. For the relative error values of the four surfaces under different contact pressures, the maximum relative error of the presented model is 5.44%, while the KE model is 22.99%. The presented model can lay a solid theoretical foundation for the optimization design of high-precision machine tools and provide a scientific theoretical basis for the performance analysis of machine tool systems.

1. Introduction

In high-precision machine tool equipment, there exist numerous mechanical joint surfaces, and the contact stiffness characteristics of these joint surfaces constitute a critical weak link that affects the machining accuracy [1]. According to statistics, the stiffness of the joint surface accounts for 60%~80% of the overall stiffness of the machine tool system [2]. The accurate normal contact stiffness is crucial for describing the contact behavior of mechanical joint surfaces, as it significantly impacts the performance of mechanical connections [3]. However, the absence of precise normal contact stiffness parameters poses a challenge in designing high-precision machine tool equipment. Consequently, there is an urgent need to develop effective methods for accurately determining the normal contact stiffness of mechanical joint surfaces [4,5].
The analytical method of contact stiffness acquisition for rough joint surfaces has been a pivotal topic in tribology [3,6]. Two commonly used analytical methods are based on statistical theory and fractal theory. Research on statistical-theory-based models dates back to the 1960s [7]. Greenwood and Williamson [8] pioneered the GW model, assuming hemispherical asperities. Bush [9] employed a parabola to mimic rough surface asperities and studied normal contact stiffness accordingly. Komvopoulos [10] viewed machined surface asperities as cylindrical and investigated normal contact stiffness based on this assumption. Horng [11] extended the GW model with semi-elliptical asperities, while An [12] proposed a model based on sinusoidal asperities fitted to measured profiles. During compression, asperities undergo elastic, elastic–plastic, and plastic deformation. Chang [13] considered elastic–plastic contact based on volume conservation theory, leading to the CEB model. Zhao [14,15] utilized a template function to model the transition from elastic to plastic deformation, resulting in a ZMC model that encompasses all three deformation stages. Ciavarella [16] enhanced the GW model by incorporating asperity interactions on rough surfaces.
Analytical model research based on statistical theory has the following disadvantages. For the profile of single asperity, different assumptions of the asperity profile will lead to different contact stiffness results. For the process of contact calculation, the acquisition of the initial parameters for the statistical contact model requires the topographical analysis of the measured surface, and the process is cumbersome. Moreover, due to the limitations of the contact mechanics theory, the profile of the asperities in the analytical model does not fit well with the profile of the measured surface asperities. For the applicable scope of the model, most of the existing models are universal analytical models, which fail to correlate with the actual machined surface. The surface topographies under different machining modes are quite different. Using the universal model to calculate the contact stiffness under different rough joint surfaces will inevitably cause calculation errors.
The study of analytical models using fractal theory started a bit later. Sayles [17] observed that machined surfaces exhibit fractal characteristics. Majumdar and Bhushan [18] introduced fractal theory into tribology, characterizing rough surfaces using the 2D W-M function and analyzing contact features of rough joint surfaces. Ausloos and Berman [19] then extended the 2D W-M function to 3D space, deriving its generalized form. Yan and Komvopoulos [20] further deduced the generalized 3D W-M function in the Cartesian coordinate system. This fractal expression has become a standard for characterizing rough surfaces [21,22], leading to numerous insights into rough joint surface contact characteristics [22,23,24]. However, as research progressed, limitations of fractal modeling emerged, particularly regarding fractal measurement [25,26,27]. Ou highlighted that fractal’s integer dimension measure is divergent, and its fractal dimension is discontinuous concerning the measurement scale. Describing physical objects with fractal approximations is unreasonable when considering measurement. The Hausdorff dimension’s mutation from integer to fractal during infinite self-similar or self-affine iterations creates singularities in the fractal’s integer dimension measure. To address these challenges, Ou [28] introduced the concept of “ubiquitiform”, based on fractal theory. The ubiquitiform, defined as a self-similar or self-affine structure with finite levels generated by a finite number of iterations under specific rules, has since been applied to various fields [28]. These include characterizing the equivalent elastic modulus of bimaterial bars [29], modeling one-dimensional steady-state conduction in cellular material rods [30], studying concrete softening behavior [31,32], researching material fracture energy parameters [33], crack propagation in quasi-brittle materials [34], and mesostructural characterization of polymer-bonded explosives [35]. Furthermore, the drawbacks of the fractal modeling approach have become increasingly apparent, particularly regarding fractal measurement. In an infinite number of iterations, the initial element undergoes a sudden change in dimension, and the integral dimension measure of the fractal is singular. In contrast, the ubiquitiform theory can make up for the shortcomings of fractal theory.
The generalized ubiquitiformal Sierpinski carpet is a self-similar fractal set. As a typical fractal set, it is often used in the simulation of the complex and chaotic nature of the grinding of rough surfaces. Moreover, the generalized Sierpinski carpet is actually a special fractal theory that inherently possesses the basic characteristics of fractals, including self-similarity and complex detailed structures. This theory is an inheritance and development of fractal theory. It not only retains the advantages of fractals in processing irregular graphics but also resolves issues such as the singularity of fractals and certain contradictions with traditional Euclidean space. Scholars have also incorporated ubiquitiform theory into analyzing rough joint surface contact characteristics. Shang studied contact parameters based on this theory [36], and pointed out that this theory may have stronger advantages in simulating and describing joint surfaces with complex and irregular surface topography.
Based on the above research, the generalized ubiquitiformal Sierpinski carpet is introduced into the calculation of the contact stiffness of the rough joint surface. Combined with the characterization of the grinding joint surface and the contact mechanics analysis of the asperities on the joint surface, a novel analytical model of contact stiffness for grinding a joint surface will be proposed. The model can provide a solid theoretical foundation for optimizing the design of high-precision machine tools and establish a scientific analytical framework for analyzing the performance of machine tool systems.

2. Characterization of the Grinding Surface

The description of the uneven surface serves as the foundation for determining the contact rigidity of the rough joint surface. Initially, this section outlines the profile and arrangement of irregularities on the ground surface. Subsequently, utilizing the broadly applicable and uniformly patterned Sierpinski carpet, the contact features of the ground joint surface are delineated.

2.1. Characterization of Simulated Surface

To accurately obtain the normal contact stiffness, constructing a simulated surface that closely mimics the measured surface is crucial. The construction of a simulated surface includes two aspects: the profile of a single asperity and the distribution of asperities.
For the profile of a single asperity, there are hemispherical [13,14,15,16], cylindrical [11], semi-elliptical [37], and other assumptions. However, the above profile assumptions are not suitable for a grinding surface. In our team’s previous research [12], the data fitting method was used to fit the data points of the asperity profile on the grinding surface. The fitting result shows that compared with other profiles, the asperity profile on the grinding surface is closer to the sinusoidal shape, and the fitting results can be found in the Supplementary Materials Figure S1. Therefore, the axisymmetric sinusoid is used to simulate the profile of a single asperity. Figure 1 shows the schematic diagram of the axisymmetric sinusoidal asperity.
Based on the above analysis, the geometric definition formula of the profile of a single asperity can be obtained, as shown in Formula (1).
z x = h cos π x l
where l is the wavelength of the asperity; h is the height of the asperity; x is the data point of the profile; and −l/2 < x < l/2.
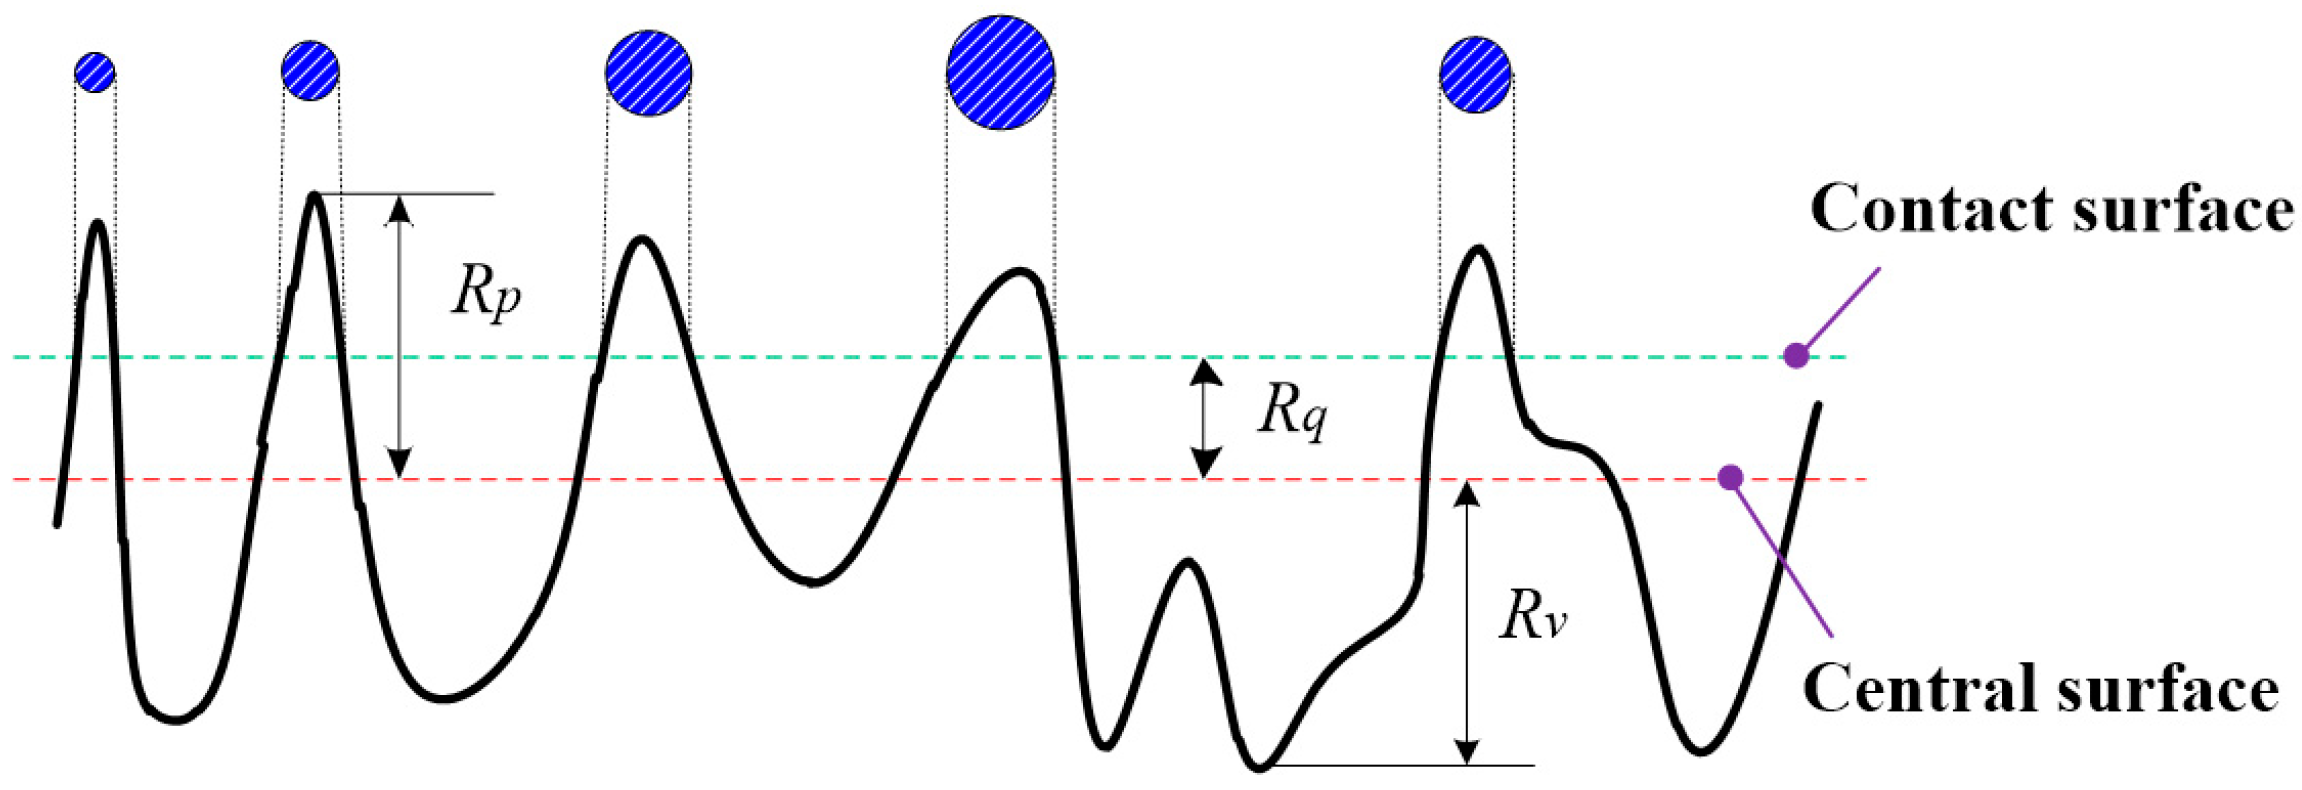
Figure 2 shows the schematic diagram of a two-dimensional rough surface. Here, Rp is the maximum peak height of the grinding surface; Rv is the maximum valley height of the grinding surface; and Rq is the root mean square height of the grinding surface. From this, the maximum height hmax of the asperities can be defined, as shown in the following equation [36].
h max = R p + R v
For a single grinding surface, the maximum heights of the asperities on the two grinding surfaces are hmax1 and hmax2, respectively, and h max 1 = R p 1 + R v 1 , h max 2 = R p 2 + R v 2 . A grinding joint surface composed of two grinding surfaces can be transformed into contact between a single grinding surface and a rigid plane. At this time, the maximum height of the asperities on the grinding joint surface can be represented by Equation (3). Similarly, the root mean square height of the grinding joint surface can be expressed by Equation (4).
h max = h max 1 2 + h max 2 2
R q = R q 1 2 + R q 2 2
For the distribution of asperities on the grinding surface, the Gaussian distribution is used for approximation. A relevant work has proved [36] that the height distribution of asperities on the grinding surface obeys Gaussian distribution. The distribution function is shown in Equation (5).
Φ h = 1 2 π σ e h μ 2 σ 2
where σ is the root mean square of the rough surface and μ is the mean value of the rough surface.
For Gaussian distribution, it can be considered that the values of the independent variables are almost all concentrated in the interval (μ − 3σ, μ + 3σ). Therefore, combined with Equation (2), the following equation can be obtained.
μ   =   h max 3 σ = R p + R v 3 σ
In the above equation, σ = Rq. Therefore, the distribution function of the asperities on the grinding surface is shown in the following equation [2].
Φ h = 1 2 π R q e h h max + 3 R q 2 2 R q 2

2.2. Contact Characterization of the Grinding Joint Surface

After defining the profile of the single asperity and the distribution of asperities on the grinding surface, a simulated surface which is more similar to the measured surface can be obtained. In this section, the contact characterization of the grinding joint surface will be carried out based on the generalized ubiquitiformal Sierpinski carpet.
As evident from Figure 2, with an increase in contact pressure, a higher number of irregularities on the grinding surface engage in contact. Concurrently, the contact regions of the previously engaged irregularities progressively expand.
Khezrzadeh [11] has pointed out that the contact process of a rough joint surface conforms to the generalized ubiquitiformal Sierpinski carpet. Therefore, the generalized ubiquitiformal Sierpinski carpet is introduced to describe the contact characterization of the grinding joint surface. Figure 3 shows the schematic diagram of the generalized ubiquitiformal Sierpinski carpet.
Figure 3a shows the unit division of the generalized ubiquitiformal Sierpinski carpet, which divides the area by length L. The maximum length of each divided area is assumed to be δmax, while there is a minimum length δmin. The δmax and the δmin correspond to the upper bound of the measuring yardstick and the lower bound of the measuring yardstick, respectively.
The δmax × δmax unit area can be divided into p2 equal parts, the 5q2 small squares removed and the remaining p2 − 5q2 small squares kept, and then the first-order generalized ubiquitiformal Sierpinski carpet can be obtained. It is worth mentioning that p and q satisfy p ≥ 3q. After iterative processing according to the above process, generalized ubiquitiformal Sierpinski carpets under different orders can be obtained. Figure 3b,c show the first-order and second-order generalized ubiquitiformal Sierpinski carpets, respectively.
Combined with the definition of fractal dimension, Khezrzadeh [38] obtained the ubiquitiformal dimension of the generalized ubiquitiformal Sierpinski carpet, as shown in Equation (8).
D = ln p 2 5 q 2 ln p
In a single ubiquitiformal unit, the relationship between the upper and the lower bounds of the measuring yardstick is as follows,
1 p N = δ min δ max
After using the δmax × δmax unit area for division, the number of units can be obtained using the following equation.
n f = f l o o r L 2 δ max 2
where floor is the rounding function.
Moreover, if the asperity is determined by the i-th iteration of the generalized ubiquitiformal Sierpinski carpet, the diameter of the bottom circle for the single asperity can be obtained with Equation (11).
d i = q δ max * p i
Combined with the location distribution of asperities in Figure 3, the number of asperities with the diameter di on a single unit can be obtained.
n i = 5 p 2 5 q 2 i 1
It is worth noting that the circular units assumed in this paper do not occupy the square area of the generalized ubiquitiformal Sierpinski carpet. Therefore, a correction factor η needs to be added to the upper bound of the measuring yardstick. Based on reference [36], the upper bound of the measuring yardstick for the grinding joint surface is δ max * , and
δ max * = η δ max
where η is the correction coefficient, and the expression is as follows.
η = 2 π 1 p 2 5 q 2 p 2 N 1 2
The above description is the contact characterization of a single grinding surface. For the grinding joint surface composed of two grinding surfaces, it can be transformed into the contact between a single grinding surface and a rigid plane. Based on reference [36], the ubiquitiformal dimension of the grinding joint surface can be expressed as
D = max D 1 ,   D 2 1
where D1 and D2 are the ubiquitiformal dimensions of the two grinding surfaces, respectively, and (2 < D1 < 3, 2 < D2 < 3).

3. Contact Analysis

Using the analysis from Section 2, the representations of the simulated surface and the grinding joint surface’s contact properties can be achieved. In this segment, drawing on contact mechanics theory, the formulas for calculating the contact stiffness of both an individual surface irregularity and the joint surface within elastic, elastic–plastic, and plastic deformation regions will be derived. This comprehensive approach then allows us to construct a rigorous analytical model for contact stiffness.

3.1. Contact Analysis of a Single Asperity

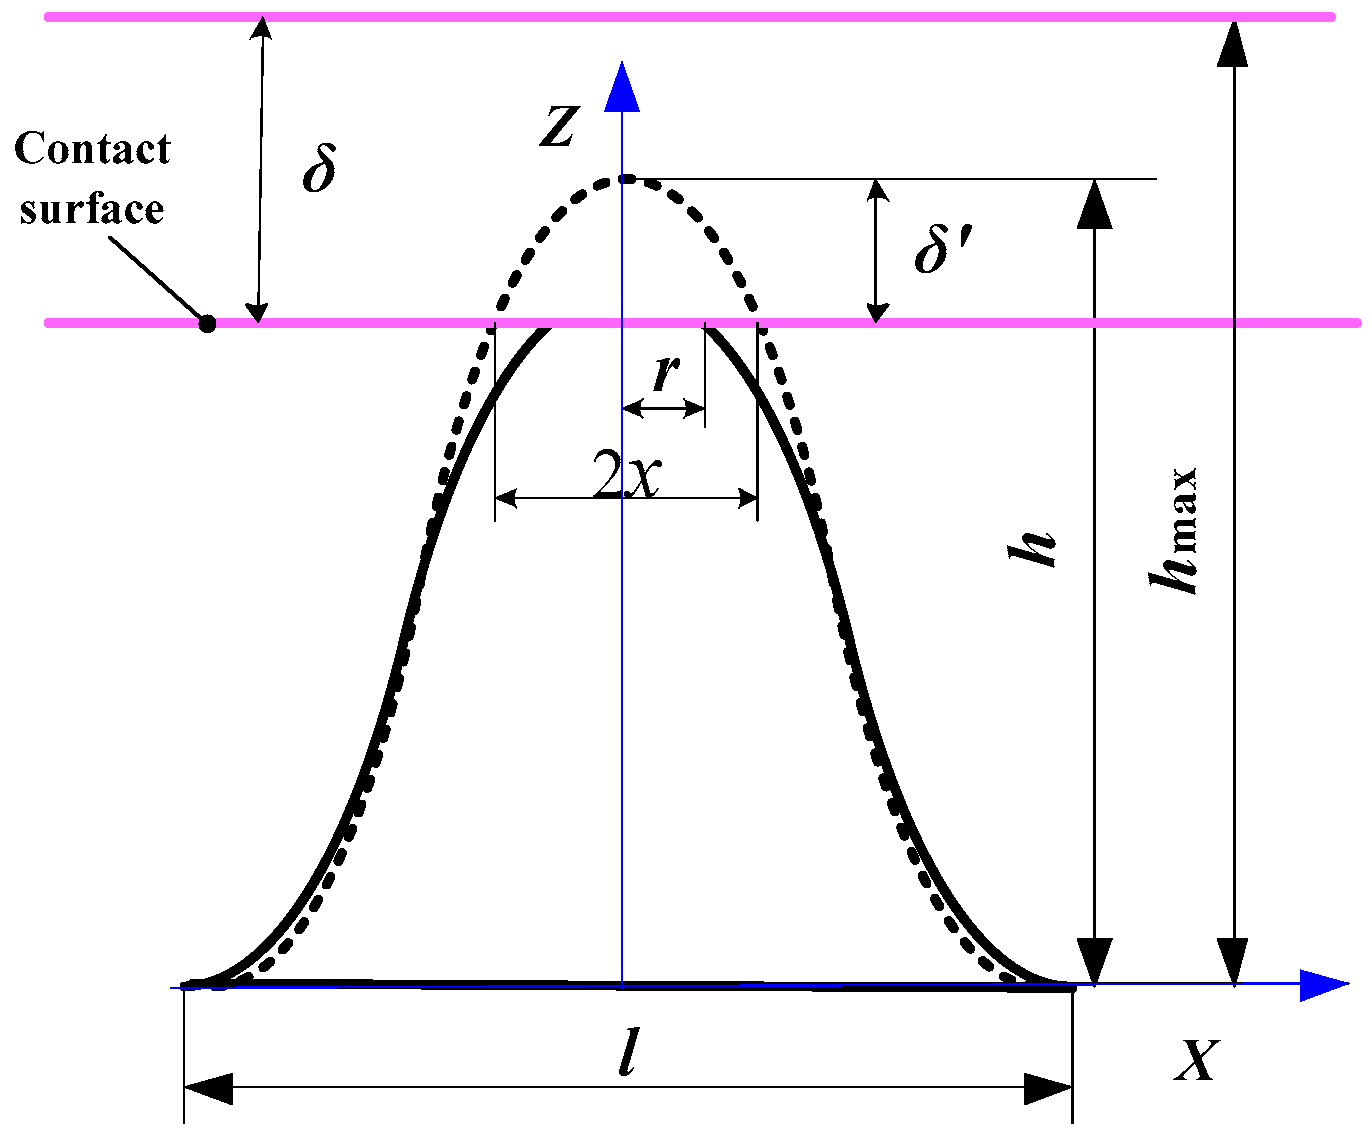
The contact deformation process of a single asperity is analyzed in this section. The deformation process of the axisymmetric sinusoidal asperity can be referred to [7]. Under the contact pressure, the schematic diagram of a single asperity before and after deformation is shown in Figure 4. As shown in Figure 4, when subjected to external load, an indentation depth δ will be generated on the grinding surface. At this time, due to the non-uniformity of the heights of the asperities, the indentation depth δ′ for a single asperity has the following form.
δ = h + δ h max
With the increase in contact pressure, the asperity will undergo three deformation stages: elastic deformation, elastic–plastic deformation, and plastic deformation. For the elastic–plastic deformation stage, the deformation is more complicated and cannot be described accurately and quantitatively. Therefore, the elastic deformation stage and plastic deformation stage of the asperity are analyzed first. By obtaining the critical point of initial plastic deformation and complete plastic deformation of the asperity, the division in the complete elastic deformation stage and the complete plastic deformation stage can be realized. For the elastic–plastic deformation stage, the method of constructing a template function will be used for transition. Each deformation stage is described in detail below in combination with Figure 4.
(1)
Elastic deformation stage
In the elastic deformation stage, based on the Hertz contact theory, the relationship between the contact pressure and the indentation depth is as follows [3].
F = 4 E 3 r e 1 / 2 δ 3 / 2
where E′ is the comprehensive elastic modulus, 1 / E = ( 1 ν 1 2 ) / E 1 + ( 1 ν 2 2 ) / E 2 ; ν 1 and ν 2 are the Poisson’s ratio of the material; E 1 and E 2 are the elastic modulus of the material; r e is the radius of curvature of in the elastic deformation stage; and δ′ is the indentation depth of the asperity.
Combined with the profile assumption of the asperity, when the diameter of the bottom circle is di and the height of the asperity is h, the radius of curvature of the asperity at the vertex can be defined as
r e = 1 d 2 z x d x 2 x = 0 = d i 2 h π 2 cos π x l x = 0 = d i 2 h π 2
Combined with Equations (11), (13), (16), and (17), the analytical equation of the contact pressure F e 1 and indentation depth δ for a single asperity can be obtained.
F e 1 = 4 E 3 π h 1 / 2 q η δ max p i h + δ h max 3 / 2
According to Hertz contact theory, the average contact pressure fme in the elastic deformation stage can be written as follows.
f m e = 4 E 3 π δ r e 1 / 2
When the average contact pressure fme is equal to the yield strength of the material σy, the material will begin to undergo plastic deformation. In addition, the di in Equation (18) corresponds to the radius of curvature when the diameter of the bottom circle is δmax. Thus, the critical indentation depth δ e c at which the asperities begin to enter the plastic deformation stage can be obtained.
δ e c = 3 π σ y 4 E 2 δ max 2 h π 2
(2)
Plastic deformation stage
The relationship between the contact pressure and the indentation depth in the plastic deformation stage is as follows [7].
F p 1 = 6 π r p σ y δ
The contact radius rp in the plastic deformation stage can be obtained from the following equation.
r p = d i π arccos h δ h = d i π arccos h max δ h
Combined with Equations (11), (13), (16), and (22), the analytical equation of the contact pressure F p 1 and indentation depth δ for a single asperity can be obtained.
F p 1 = 6 q η δ max σ y p i h + δ h max arccos h max δ h
The relationship between the real contact area Ap and the indentation depth δ′ in the plastic deformation stage can be expressed by the following equation [12].
A p = 2 π δ r p
Similarly, based on the theory of contact mechanics, when the average pressure fmp is equal to three times the yield strength σy [7], the material will enter fully into plastic deformation:
f m p = 3 σ y
For the critical point of complete plastic deformation, the relationship between the average pressure and the yield strength of the asperity can be expressed by the following equation.
f m p σ y = 2 3 1 + ln 1 3 E σ y d z r p c d r p c = 3
where r p c is the contact radius with complete plastic deformation, and d z r p c d r p c is the absolute value of the slope at point r p c .
Based on the above equation, the contact radius r p c of the critical point with complete plastic deformation for a single asperity can be obtained.
Combined with Equations (21) and (22), the critical indentation depth of complete plastic deformation can be obtained. In addition, the di in Equation (23) corresponds to the radius of curvature when the diameter of the bottom circle is δmax. Thus, the critical indentation depth δ p c at which the asperities completely enter the plastic deformation stage can be obtained.
δ p c = δ max 2 π arcsin 3 e 7 2 σ y E δ max π h
(3)
Elastic–plastic deformation stage
Based on the above analysis, the analytical expressions of the asperities in the elastic and the plastic deformation stages are obtained. Meanwhile, the critical points of initial plastic deformation and complete plastic deformation of asperities are obtained. For the elastic–plastic deformation stage, the method of constructing a template function will be used for transition. The template function can be found in the following equation.
f δ = 2 δ δ e c δ p c δ e c 3 + 3 δ δ e c δ p c δ e c 2
Using the template function, the equation of the contact pressure F e p 1 in the elastic–plastic deformation stage can be obtained, as shown below.
F e p 1 = F e 1 + F p 1 F e 1 f δ
Combined with Equations (19), (24), and (30), the analytical equation of the contact pressure F e p 1 and indentation depth δ for a single asperity can be obtained.
F e p 1 = q η δ max p i 4 E 3 π h 1 / 2 h + δ h max 3 / 2 + 6 σ y h + δ h max arccos h max δ h 4 E 3 π h 1 / 2 h + δ h max 3 / 2 f h + δ h max

3.2. Contact Analysis of the Joint Surface

Drawing from the analysis presented in Section 3.1, the process of contact deformation for a single asperity irregularity can be understood. In this current section, we will delve into the contact deformation process of the entire joint surface, ultimately deriving the expression for the contact stiffness of this joint surface. Combined with the generalized ubiquitiformal Sierpinski carpet, the total contact pressure of the asperities on a single unit with height h and diameter of the bottom circle di is F * 1 n i φ h d h . Within this, φ h d h represents the proportion of the number of asperities with height h in ni, and n i φ h d h represents the number of asperities with height h and the diameter of the bottom circle di on a single unit.
The joint surface is composed of nf units, and the number of iterations of the ubiquitiformal units on the joint surface is N, so the total contact pressure F * on the grinding joint surface can be obtained.
F * = i = 1 N F d h d h = i = 1 N h max δ h max n f F * 1 n i   Φ h d h
where F * and F * 1 are the contact pressure of the joint surface and the single asperity, respectively. Since there are three deformation stages of asperity under contact pressure, the symbol ‘ * ’ is used to comprehensively represent the different deformation stages. That is, F * and F * 1 are applicable to the three deformation stages. Based on the above derivation, the analytical expressions between the contact pressure and the indentation depth of the joint surface under different deformation stages are deduced.
(1)
Elastic deformation stage
From Equation (32), the total contact pressure of the joint surface in the elastic deformation stage can be obtained.
F e = i = 1 N F d h d h = i = 1 N h max δ h max δ e c n f F e 1 n i   Φ h d h
Combined with Equations (9), (12), (14), (19), and (33), the analytical equation of the contact pressure F e and indentation depth δ for the joint surface can be obtained.
F e = 8 5 E 3 π 3 / 2 n f δ max p 2 p D 1 δ max δ min D 2 1 2 δ max δ min D 1 1 p h max δ h max δ e c   h + δ h max 3 h 1 / 2 Φ h d h
(2)
Plastic deformation stage
Similarly, from Equation (32), the total contact pressure of the joint surface in the plastic deformation stage can be obtained.
F p = i = 1 N F d h d h = i = 1 N h max δ p c h max n f F p 1 n i   Φ h d h
Combined with Equations (9), (12), (14), (24), and (34), the analytical equation of the contact pressure F p and indentation depth δ for the joint surface can be obtained.
F p = 12 5 n f δ max σ y π p 2 p D 1 δ max δ min D 2 1 2 δ max δ min D 1 1 p h max δ p c h max h + δ h max arccos h max δ h   Φ h d h
(3)
Elastic–plastic deformation stage
Similarly, from Equation (32), the total contact pressure of the joint surface in the elastic–plastic deformation stage can be obtained.
F e p = i = 1 N h max δ e c h max δ p c n f F e p 1 n i   Φ h d h
Combined with Equations (9), (12), (14), (31), and (37), the analytical equation of the contact pressure F e p and indentation depth δ for the joint surface can be obtained.
F e p = 2 5 δ max n f π p 2 p D 1 δ max δ min D 2 1 2 δ max δ min D 1 1 p h max δ e c h max δ p c 4 E 3 π h 1 / 2 h + δ h max 3 / 2 + 6 σ y h + δ h max arccos h max δ h 4 E 3 π h 1 / 2 h + δ h max 3 / 2 f h + δ h max   Φ h d h
Based on the above analysis, the relationship between the contact pressure and the indentation depth of the joint surface at different deformation stages can be obtained. The total contact pressure F on the joint surface includes the contact pressure of all asperities on the grinding surface in different deformation stages.
F = F e + F e p + F p
The analytical expression of the contact stiffness can be obtained by derivation of the above equation, and the analytical model of contact stiffness for the grinding joint surface is finally established.
K = d F d δ

4. Experiment

4.1. Specimen Preparation

To achieve grinding surfaces with varying ubiquitiformal dimensions, specimens were produced using grinding wheels of differing abrasive grain sizes. The chosen material for these specimens was 40Cr steel. Specifically, the abrasive grains used on the grinding wheels ranged from 60# to 120#, with increments of 20#. The symbol ‘#’ represents the grit size of the grinding wheel. Once the specimens were shaped through machining, the surface contours of the ground areas were captured using ZYGONex-View measurement technology. The surface topography of the measured area can be found in Figure S2. This precision measurement process established the surface profiles essential for the subsequent quantification of ubiquitiformal dimensions. Visual representations of the ground surfaces resulting from the various grinding wheels can be accessed in Figure S3 of the Supplementary Information. Subsequently, the fractal characteristic parameters of these measured surfaces were derived through the application of the box counting method, as outlined in [39]. The comprehensive fractal characteristic data for each distinct grinding surface is tabulated in Table 1, where D1 and D2 designate the ubiquitiformal dimensions for the upper and lower specimens, respectively.
For the calculation of the analytical model, it is also necessary to obtain the roughness parameters of the surface. Based on the definition of the roughness parameter, the topographies of the measured surfaces are analyzed. The roughness parameters of the grinding joint surface are shown in Table 2.
In addition, 40Cr steel is taken as the research object, and the material parameters of 40Cr steel are tested by the universal testing machine. The material parameters include an elastic modulus E1 = E2 = 211 GPa, a Poisson’s ratio υ1 = υ2 = 0.29, a yield strength σy = 785 MPa, and a hardness H = 2070 MPa.

4.2. Test Rig

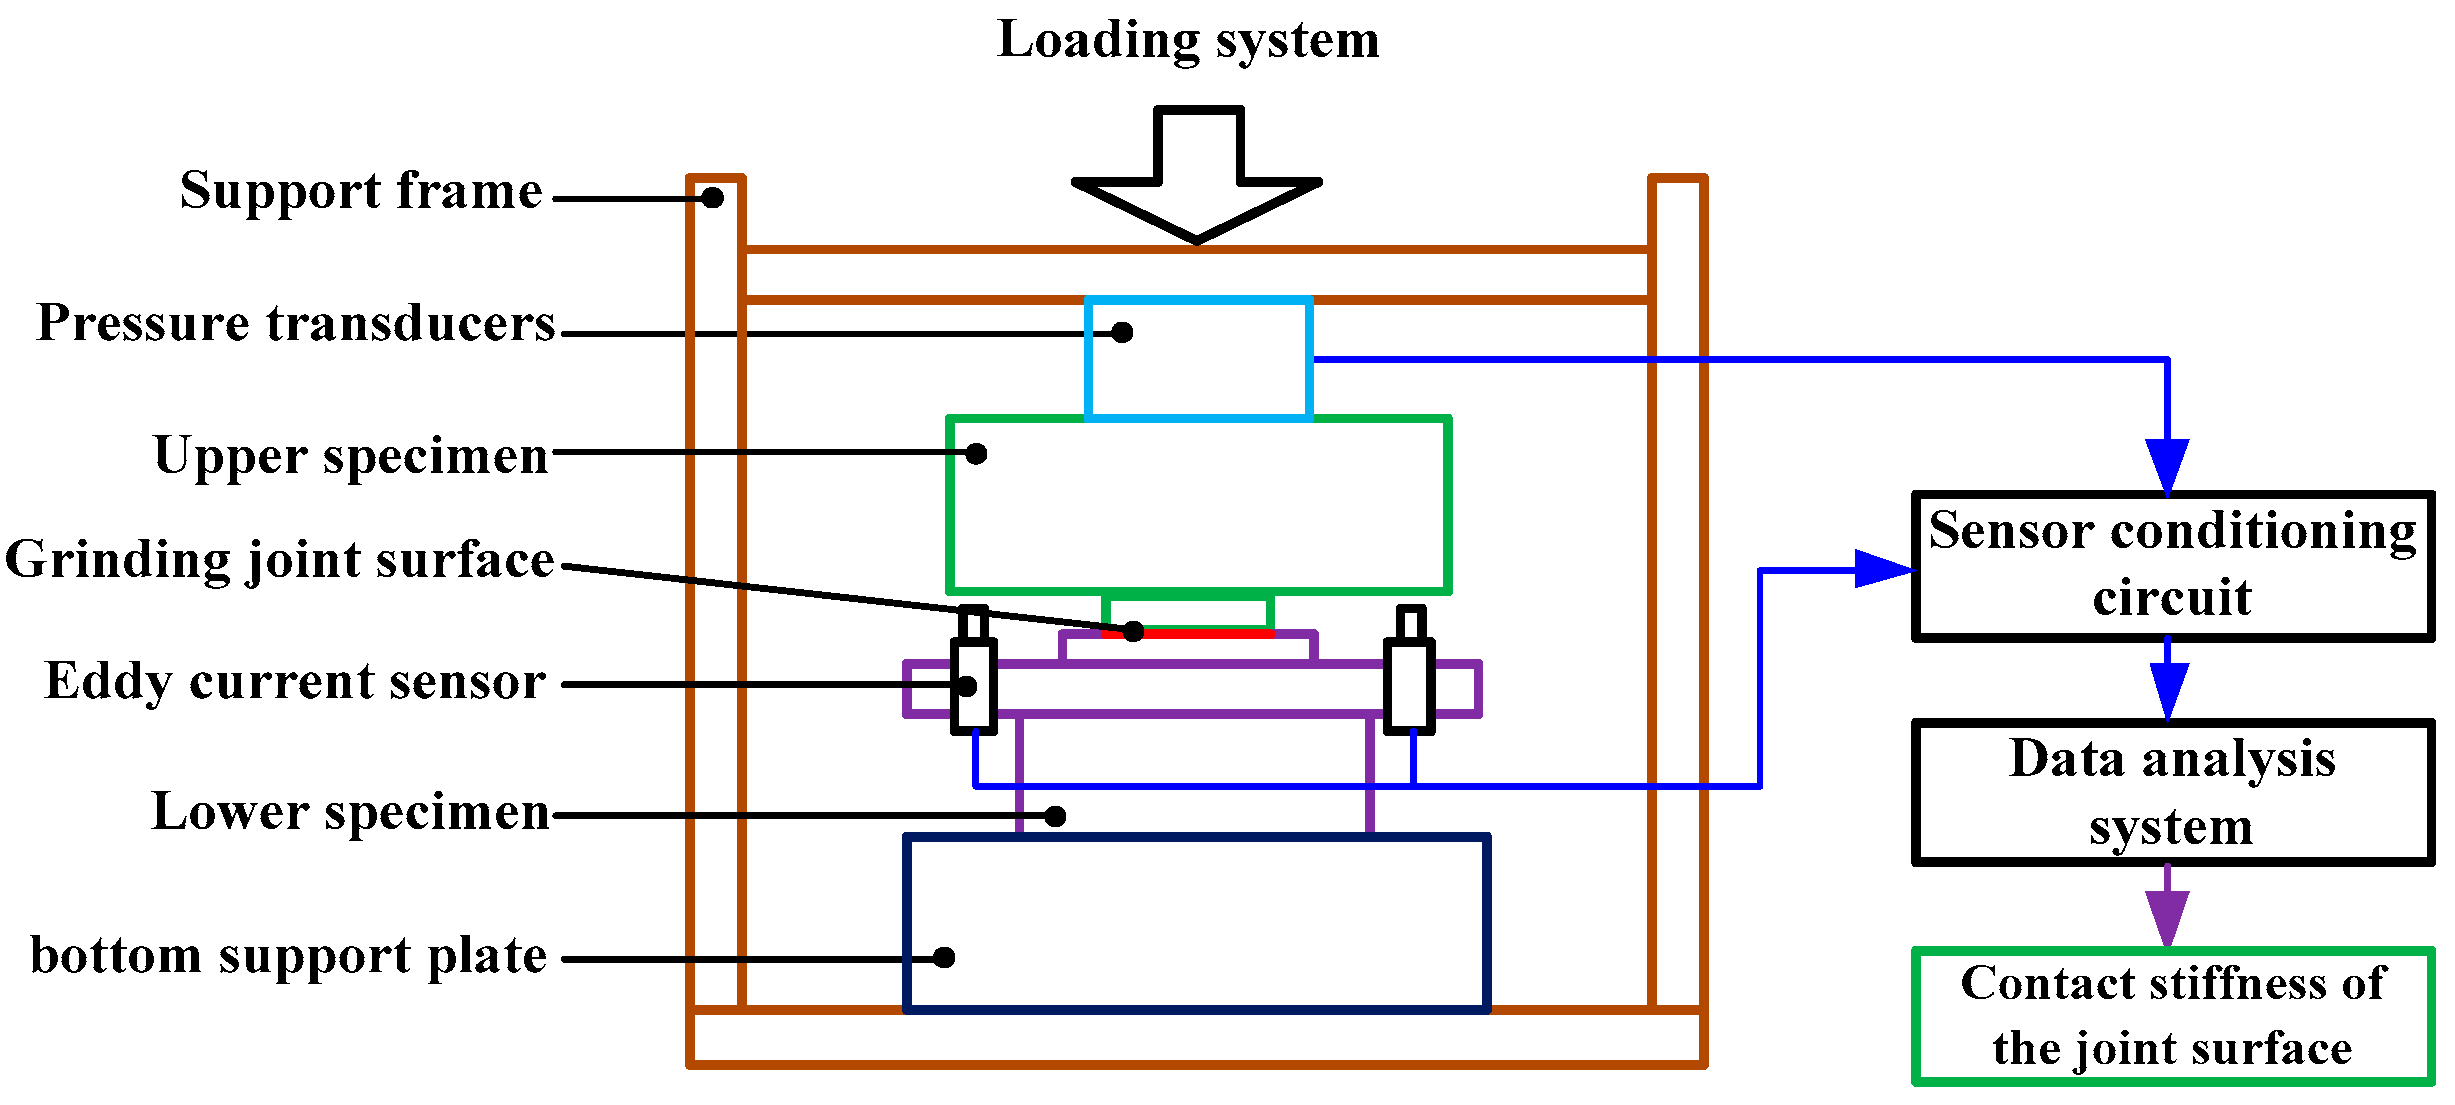
To validate the precision of the model presented in this paper, an experimental test rig is built to conduct experimental research on the normal contact stiffness of the grinding joint surface. The schematic diagram of the test rig is shown in Figure 5. The test rig is composed of five parts: the loading system, the measuring shaft system, the sensor conditioning circuit, and the data analysis system. Among them, the measuring shaft system consists of six parts: the support frame, the pressure transducers, the upper specimen, the lower specimen, the eddy current sensor, and the bottom support plate. The grinding joint surface to be measured is located between the upper and lower specimens.
The test rig was designed in a vertical configuration, with all loading units serially connected within the support frame. For vibration isolation at the base, a rubber mat was employed. The system was subjected to a targeted load of 6000 N, applied via a hydraulic jack. To monitor the contact load on the test surface, a KAP-TC pressure sensor from Kewill GmbH in Hamburg, Germany, was utilized. Additionally, three KD2306-1S eddy current displacement sensors from Kaman in Bloomfield, CT, USA, were mounted on the upper specimens in a uniform arrangement to measure the normal displacement of the contact surface under load.
By collecting data, we were able to generate a curve that illustrates the relationship between contact load and displacement. Further data analysis allowed us to derive a curve depicting the correlation between contact stiffness and contact load. Each set of experiments involved two specimens of identical material and roughness. To ensure data reliability and reproducibility, we conducted three replicate experiments for each test group and calculated the average values as the final dataset.

5. Results and Analysis

To validate the precision of the model proposed in this study, a comparative analysis will be conducted between the outcomes of the presented model, the KE model, and the experimental results.
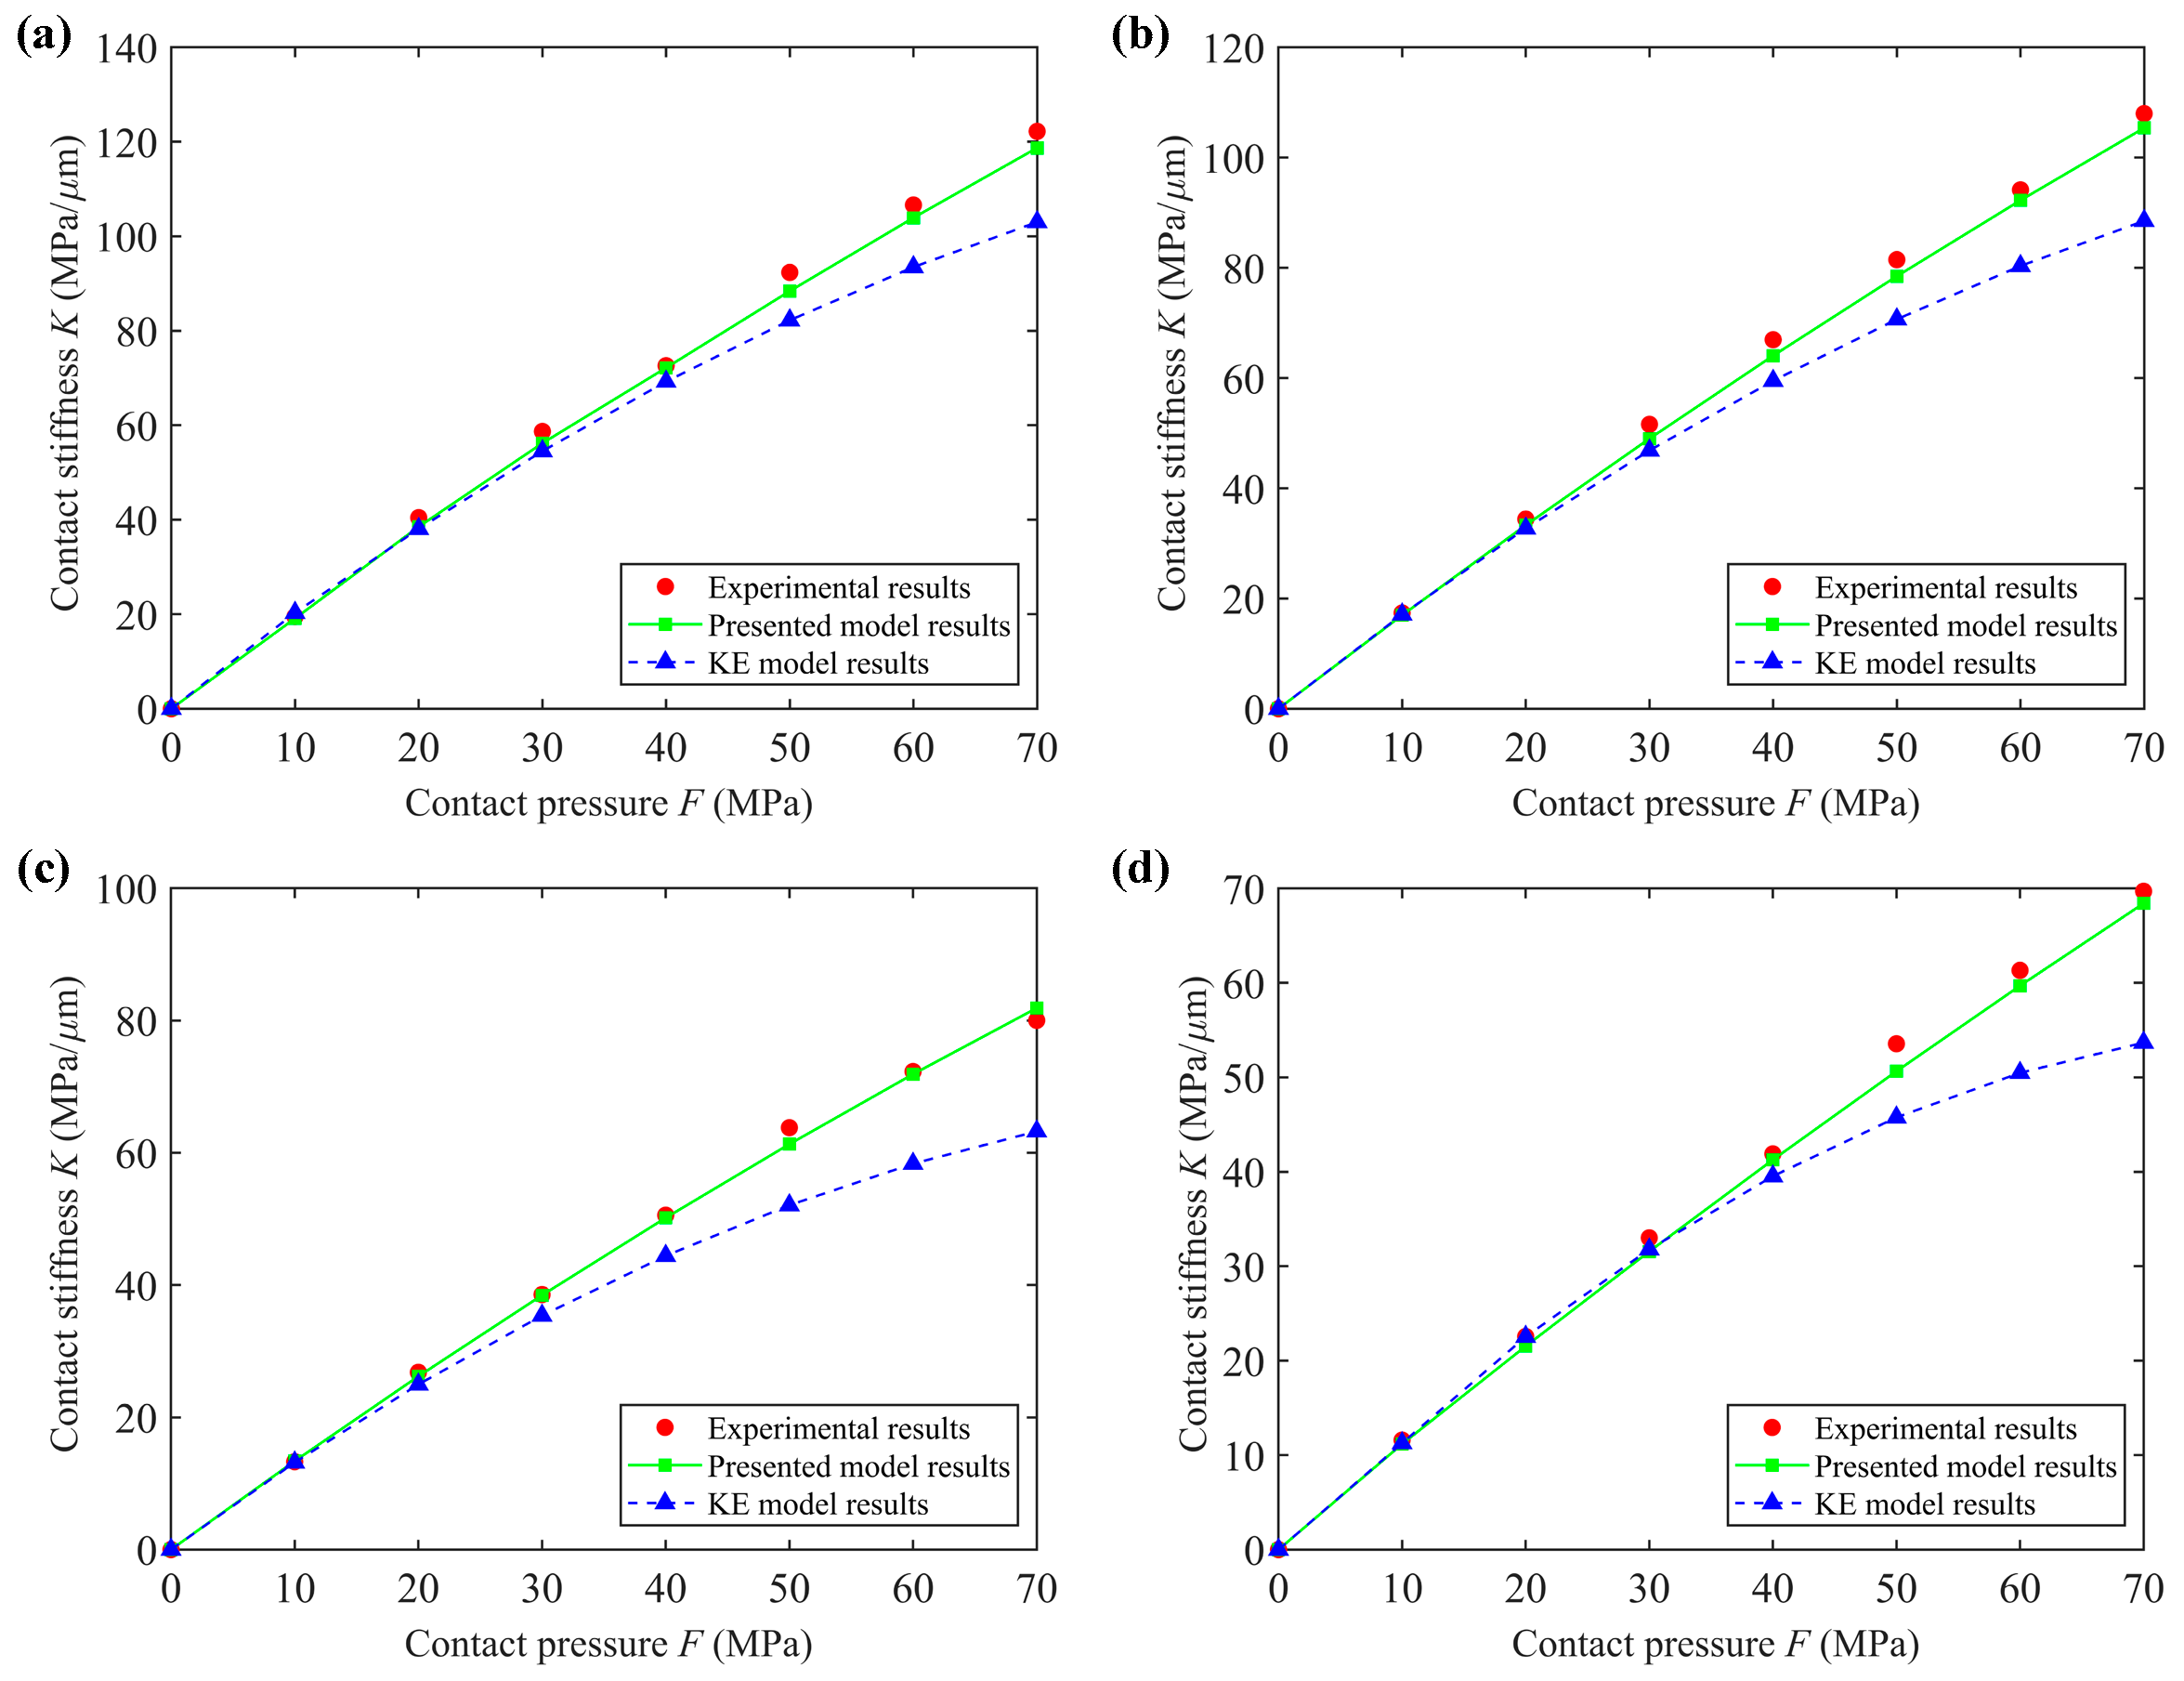
Based on the analysis in Section 4.1, the ubiquitiformal dimensions, roughness parameters, and material parameters of the specimen can be obtained. In order to obtain the simulation results of the presented model, it is necessary to determine the values of the upper and the lower bounds of the measuring yardstick of the joint surface. For the upper bound of the measuring yardstick, δmax = 1 × 10⁻¹ hmax. The iterative parameter p of the generalized ubiquitiformal Sierpinski carpet should satisfy the condition 1 < p < (9/4)D−2 [40], which is taken as 5 in this paper. For the lower bound of measuring yardstick, δmin = 1 × 10−4 δmax [36]. Based on the above initial values, MATLAB 2018b software was used to carry out numerical simulation, and the analytical results of the presented model could be obtained. In addition, in order to avoid the influence of the contact area on the contact stiffness, the contact stiffness results under the condition of unit area are presented. Figure 6 shows the relationship between the contact stiffness and the contact pressure under different grinding joint surfaces. Moreover, the contact stiffness values can be found in Tables S1–S4 in the Supplementary Information.
Synthesizing the results in Figure 6, the contact stiffness increased gradually with the increase in the contact pressure. Moreover, the contact stiffness of the four joint surfaces had the same change trend. It is worth noting that the results of the presented model are closer to the experimental results than the KE model.
When F = 70 MPa, the contact stiffness reaches the maximum value. In joint surface 1, the contact stiffness results of the experimental test, presented model, and the KE model are 122.20 MPa/μm, 118.71 MPa/μm, and 103.01 MPa/μm, respectively. In joint surface 2, the contact stiffness results of the experimental test, presented model, and the KE model are 107.98 MPa/μm, 105.38 MPa/μm, and 88.52 MPa/μm, respectively. In joint surface 3, the contact stiffness results of the experimental test, presented model, and the KE model are 80.01 MPa/μm, 81.88 MPa/μm, and 63.23 MPa/μm, respectively. In joint surface 4, the contact stiffness results of the experimental test, presented model, and the KE model are 69.70 MPa/μm, 68.41 MPa/μm, and 53.67 MPa/μm, respectively. With the increase in the contact pressure, more and more asperities on the grinding joint surface participate in the contact, resulting in a gradual increase in the stiffness with the increase in the contact pressure. Moreover, with the increase in the contact pressure, the difference between the KE model and the presented model gradually increases, and the specific reasons will be analyzed in combination with the relative errors later.
In addition, with the increase in the contact pressure, the change rate of the contact stiffness shows a decreasing trend. With the increase in the contact pressure, more and more asperities on the joint surface enter the plastic deformation stage. Under the condition of the same contact pressure, the indentation depth increases, resulting in a decrease in the contact stiffness.
Finally, under the same contact pressure, the contact stiffness has a decreasing trend with the increase in surface roughness. When F = 70 MPa, the contact stiffnesses of the four joint surfaces are 122.20 MPa/μm, 107.98 MPa/μm, 80.01 MPa/μm, and 69.70 MPa/μm, respectively. With the decrease in roughness, the size of asperities decreases and the number of asperities increases. Under the same contact pressure, more asperities will participate in the contact. As a result, the ability of the joint surface to resist deformation will be enhanced, which eventually leads to an increase in the contact stiffness.
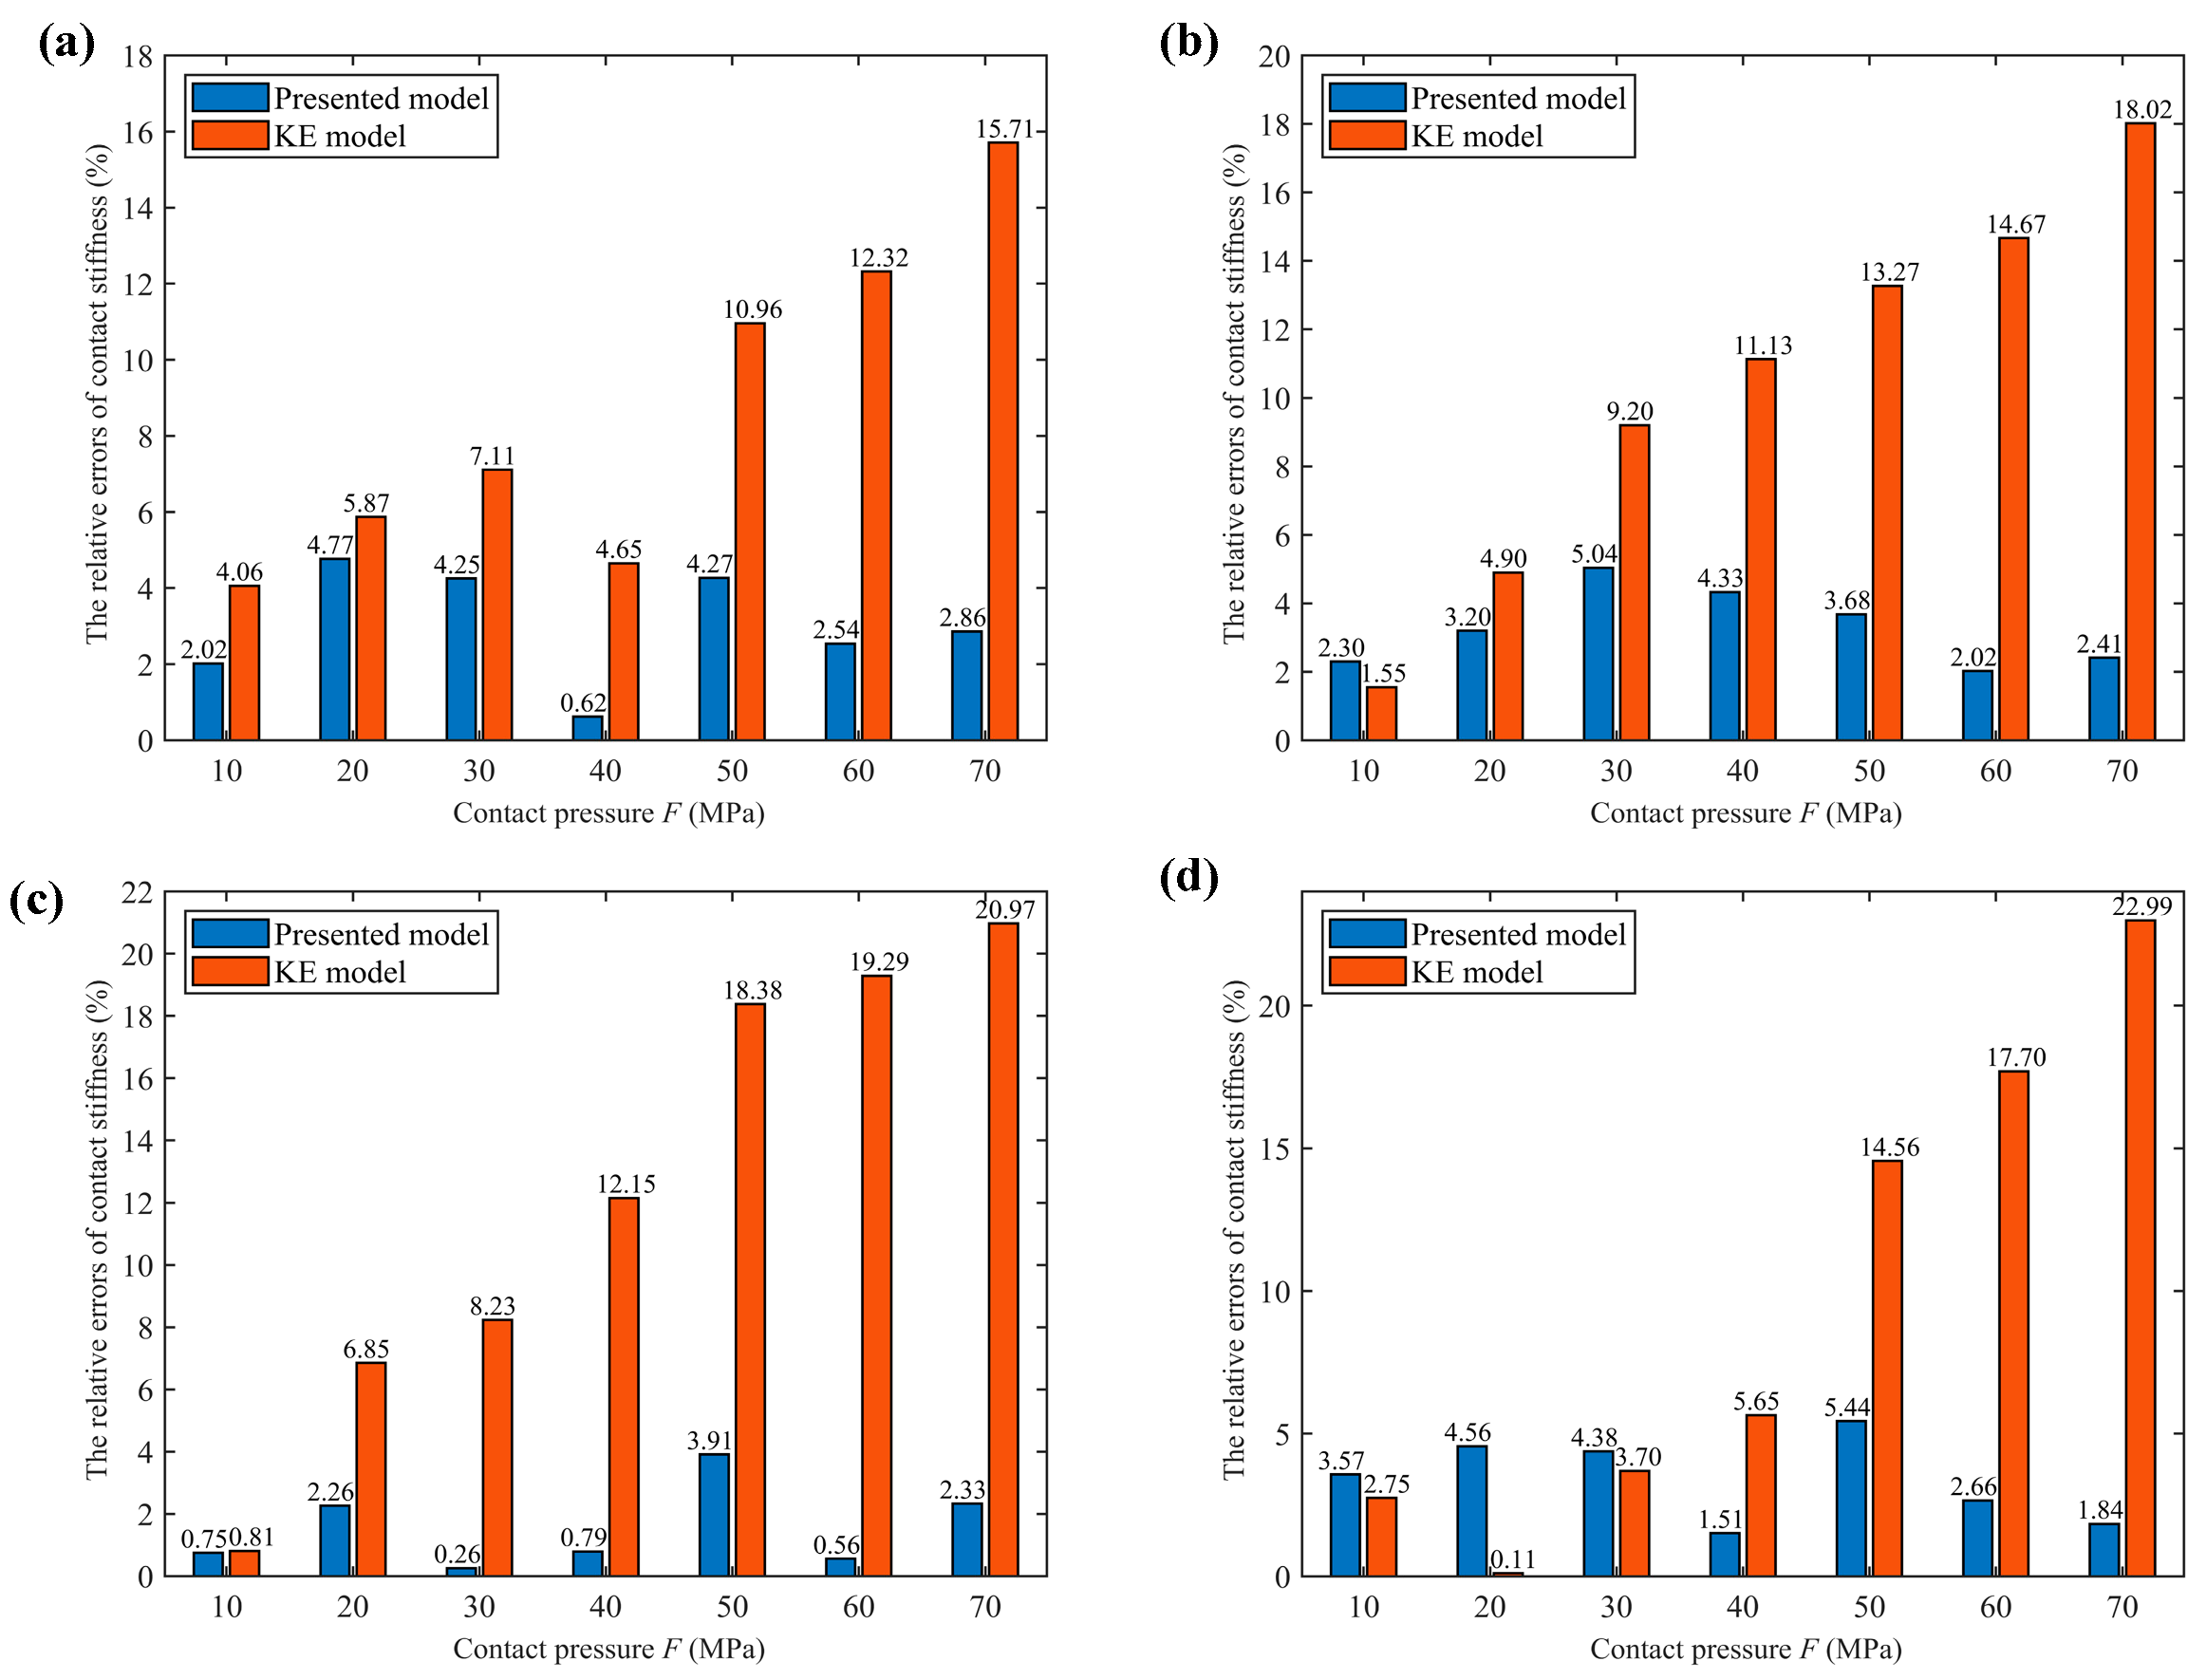
Since the results of the presented model are close to the experimental results, the relative error is analyzed below. Figure 7 shows the The relative errors of the contact stiffness under different grinding joint surfaces. Moreover, the relative error values can be found in Tables S1–S4 in the Supplementary Information.
Figure 7. The relative errors of the contact stiffness under different grinding joint surfaces: (a) grinding joint surface 1; (b) grinding joint surface 2; (c) grinding joint surface 3; (d) grinding joint surface 4.
Fractalfract 08 00351 g007
Interestingly, with the increase in contact pressure, the relative error of the presented model increases first and then decreases. Synthesizing the relative errors of the four joint surfaces, the maximum errors are 4.77%, 5.04%, 3.91%, and 5.44%, respectively. By incorporating the deformation analysis of surface asperities on the grinding surface, the aforementioned phenomena are comprehensively analyzed. When the contact pressure is small, the asperities are in the elastic deformation stage, and the deformation of the asperities in the presented model is closer to the actual working conditions. As contact pressure increases, the asperity transitions into the elastic–plastic deformation stage. The elastic–plastic deformation stage of the asperity is transitioned by the sample function, which results in an increasing trend of the relative error. With the further increase in the contact pressure, the asperities on the joint surface will enter the plastic deformation stage. At this time, the deformation law of asperity is more in line with the plastic deformation theory in contact mechanics, so the relative error has a decreasing trend.
In contrast with the presented model in this paper, with the increase in the contact pressure, the relative error of the KE model has a gradually increasing trend. When F = 70 MPa, the relative error of the four joint surfaces reaches the maximum value. At this time, the maximum values of the relative error are 15.71%, 18.02%, 20.97%, and 22.99%, respectively. By incorporating the deformation analysis of surface asperities on the grinding surface, the aforementioned phenomena are comprehensively analyzed. When the contact pressure is small, the asperities are in the elastic deformation stage, and the deformation of the asperities in the presented model is closer to the actual working conditions. As contact pressure increases, the asperity transitions into the elastic–plastic deformation stage. The aforementioned results are analyzed in conjunction with the assumption of the profile assumption of the single asperity. Compared with the axisymmetric sinusoidal asperities in the presented model, the profile of the asperities in the KE model is hemispherical. Under the same contact pressure, the radius of curvature of the hemispherical asperities is smaller. As a result, the ability of the joint surface to resist deformation will be reduced, which will eventually lead to an increase in the contact stiffness. With the further increase in the contact pressure, the above factors become more obvious, which results in the relative error gradually increasing with the increase in the contact pressure. In addition, the relative error increases gradually with the increase in the roughness of the joint surface. With the decrease in surface roughness, the distribution of asperities in the grinding surface are closer to the Gaussian distribution, which makes the simulated surface closer to the measured grinding surface. Therefore, under the same contact pressure, the relative error will decrease with the decrease in the surface roughness.
To sum up, under the same contact pressure, the results of the presented model are closer to the experimental results than the KE model. Moreover, under the same contact pressure, the relative error of the presented model is smaller than that of the KE model. Combined with the relative error of the four surfaces under different contact pressures, the maximum value of the presented model is 5.44%, while the maximum value of the KE model is 22.99%. The comparison results verify the accuracy of the presented model in this paper.

6. Conclusions

Based on the generalized ubiquitiformal Sierpinski carpet theory, a novel contact stiffness model for grinding joint surface is proposed in this paper. The main conclusions are summarized as follows:
(1)
Combined with generalized ubiquitiformal Sierpinski carpet, the characterization of the grinding surface is realized. The profile of a single asperity is simulated using an axisymmetric sinusoid, while the distribution of asperities is represented using a Gaussian distribution. Based on the generalized ubiquitiformal Sierpinski carpet, the contact characterization of the grinding joint surface is realized. Then, a simulated surface which is more similar to the measured grinding surface is established, which provides the surface basis for the construction of the analytical model of normal contact stiffness.
(2)
A novel contact stiffness model for the grinding joint surface is proposed. Based on the simulated surface and contact mechanics analysis, the analytical expressions of contact stiffness in elastic deformation stage, elastic–plastic deformation stage, and plastic deformation stage are deduced, and the analytical model of contact stiffness for the grinding joint surface is eventually established.
(3)
The accuracy of the presented model is verified well. The results of the presented model, the KE model, and the experimental test are compared. The comparison results show that under the same contact pressure, the presented model is closer to the experimental results than the KE model. The rationality of the results is explained based on the distribution of the asperities and the contact deformation law of the asperities on the grinding surface.
However, the presented model in this paper is validated by the experiments on the grinding joint surface. Whether or not the presented model is suitable for the rough joint surface under other machining modes will be studied in future work.

Supplementary Materials

The following supporting information can be downloaded at: https://www.mdpi.com/article/10.3390/fractalfract8060351/s1, Figure S1: (a) Fitting results of measured data points using different fitting methods. (b) Vertical section image of a single asperity; Figure S2: Measured grinding surfaces under different grinding wheels: (a) surface 1; (b) surface 2; (c) surface 3; (d) surface 4; Table S1: The values and the relative errors of contact stiffness—grinding joint surface 1; Table S2: The values and the relative errors of contact stiffness—grinding joint surface 2; Table S3: The values and the relative errors of contact stiffness—grinding joint surface 3; Table S4: The values and the relative errors of contact stiffness—grinding joint surface 4.

Author Contributions

Conceptualization and methodology, Q.A.; Validation, Q.A., M.H., and S.S.; Writing—original draft preparation and visualization, Q.A. and Y.L. All authors have read and agreed to the published version of the manuscript.

Funding

This work was supported financially by the National Key Research and Development Program of China (No. 2017YFF0108101) and the Beijing Information Science and Technology University Research Foundation (No. 2024XJJ01).

Data Availability Statement

Data are contained within the article.

Conflicts of Interest

The authors declare no conflict of interest.

References

  1. Wang, W.; An, Q.; Suo, S.; Meng, G.; Yu, Y.; Bai, Y. A novel three-dimensional fractal model for the normal contact stiffness of mechanical interface based on axisymmetric cosinusoidal asperity. Fractal Fract. 2023, 7, 279. [Google Scholar] [CrossRef]
  2. Tian, J.Y.; Su, H.; Wang, Z.J.; Zuo, K.C.; Wang, D.F.; Guo, D. Comparative analysis of angular contact bearing stiffness calculated by Hertz contact and thermo-elastohydrodynamic lubrication. Tribol. Int. 2024, 192, 109251. [Google Scholar] [CrossRef]
  3. Zhou, H.; Long, X.H.; Meng, G.; Liu, X.B. A stiffness model for bolted joints considering asperity interactions of rough surface contact. J. Tribol. 2022, 144, 011501. [Google Scholar] [CrossRef]
  4. Yu, X.; Sun, Y.Y.; Zhao, D.; Wu, S.J. A revised contact stiffness model of rough curved surfaces based on the length scale. Tribol. Int. 2021, 164, 107206. [Google Scholar] [CrossRef]
  5. Zhang, K.; Li, G.; Gong, J.Z.; Zhang, M. Normal contact stiffness of rough surfaces considering oblique asperity contact. Adv. Mech. Eng. 2019, 11, 1–14. [Google Scholar] [CrossRef]
  6. Li, L.; Wang, J.J.; Shi, X.H.; Ma, S.L.; Cai, A.J. Contact stiffness model of joint surface considering continuous smooth characteristics and asperity interaction. Tribol. Lett. 2021, 69, 43. [Google Scholar] [CrossRef]
  7. Ghaednia, H.; Wang, X.; Saha, S.; Xu, Y.; Sharma, A.; Jackson, R.L. A review of elastic-plastic contact mechanics. Appl. Mech. Rev. 2017, 69, 060804. [Google Scholar] [CrossRef]
  8. Greenwood, J.A.; Williamson, J.B.P. Contact of nominally flat surfaces. Proc. R. Soc. A Math. Phys. Eng. Sci. 1966, 295, 300–319. [Google Scholar] [CrossRef]
  9. Bush, A.W.; Gibson, R.D.; Thomas, T.R. The elastic contact of a rough surface. Wear 1975, 35, 87–111. [Google Scholar] [CrossRef]
  10. Komvopoulos, K.; Choi, D.H. Elastic finite element analysis of multi-asperity contacts. J. Tribol. 1992, 114, 823–831. [Google Scholar] [CrossRef]
  11. Horng, J.-H. An elliptic elastic-plastic asperity microcontact model for rough surfaces. J. Tribol. 1998, 120, 82–88. [Google Scholar] [CrossRef]
  12. An, Q.; Suo, S.F.; Lin, F.Y.; Shi, J.W. A novel micro-contact stiffness model for the grinding surfaces of steel materials based on cosine curve-shaped asperities. Materials 2019, 12, 3561. [Google Scholar] [CrossRef] [PubMed]
  13. Chang, W.R.; Etsion, I.; Bogy, D.B. An elastic-plastic model for the contact of rough surfaces. J. Tribol. 1987, 109, 257–263. [Google Scholar] [CrossRef]
  14. Zhao, Y.; Maietta, D.M.; Chang, L. An asperity microcontact model incorporating the transition from elastic deformation to fully plastic flow. J. Tribol. 2000, 122, 86–93. [Google Scholar] [CrossRef]
  15. Zhao, Y.; Chang, L. A model of asperity interactions in elastic-plastic contact of rough surfaces. J. Tribol. 2001, 123, 857–864. [Google Scholar] [CrossRef]
  16. Ciavarella, M.; Greenwood, J.A.; Paggi, M. Inclusion of “interaction” in the Greenwood and Williamson contact theory. Wear 2008, 265, 729–734. [Google Scholar] [CrossRef]
  17. Sayles, R.S.; Thomas, T.R. Surface topography as a nonstationary random process. Nature 1978, 271, 431–434. [Google Scholar] [CrossRef]
  18. Majumdar, A.; Bhushan, B. Fractal model of elastic-plastic contact between rough surfaces. J. Tribol. 1991, 113, 1–11. [Google Scholar] [CrossRef]
  19. Ausloos, M.; Berman, D.H. A multivariate Weierstrass–Mandelbrot function. Proc. R. Soc. Lond. A Math. Phys. Sci. 1997, 400, 331–350. [Google Scholar] [CrossRef]
  20. Yan, W.; Komvopoulos, K. Contact analysis of elastic-plastic fractal surfaces. J. Appl. Phys. 1998, 84, 3617–3624. [Google Scholar] [CrossRef]
  21. Shi, W.B.; Zhang, Z.S. Contact characteristic parameters modeling for the assembled structure with bolted joints. Tribol. Int. 2022, 165, 107272. [Google Scholar] [CrossRef]
  22. Zhao, Y.S.; Wu, H.C.; Liu, Z.F.; Cheng, Q.; Yang, C.B. A novel nonlinear contact stiffness model of concrete-steel joint based on the fractal contact theory. Nonlinear Dyn. 2018, 94, 151–164. [Google Scholar] [CrossRef]
  23. Zheng, J.L.; Liu, X.K.; Jin, Y.; Dong, J.B.; Wang, Q.Q. Effects of surface geometry on advection-diffusion process in rough fractures. Chem. Eng. J. 2021, 414, 128745. [Google Scholar] [CrossRef]
  24. Liu, Y.; Wang, Y.S.; Chen, X.; Yu, H.C. A spherical conformal contact model considering frictional and microscopic factors based on fractal theory. Chaos Solitons Fractals 2018, 111, 96–107. [Google Scholar] [CrossRef]
  25. Jiang, K.; Liu, Z.F.; Yang, C.B.; Zhang, C.X.; Tian, Y.; Zhang, T. Effects of the joint surface considering asperity interaction on the bolted joint performance in the bolt tightening process. Tribol. Int. 2022, 167, 107408. [Google Scholar] [CrossRef]
  26. Magsipoc, E.; Zhao, Q.; Grasselli, G. 2D and 3D roughness characterization. Rock Mech. Rock Eng. 2020, 53, 1495–1519. [Google Scholar] [CrossRef]
  27. Li, L.; Yun, Q.Q.; Li, Z.Q.; Liu, Y.; Cao, C.Y. A new contact model of joint surfaces accounting for surface waviness and substrate deformation. Int. J. Appl. Mech. 2019, 11, 1950079. [Google Scholar] [CrossRef]
  28. Ou, Z.C.; Li, G.Y.; Duan, Z.P.; Huang, F.L. Ubiquitiform in applied mechanics. J. Theor. Appl. Mech. 2014, 52, 37–46. [Google Scholar] [CrossRef]
  29. Li, G.-Y.; Ou, Z.C.; Xie, R.; Duan, Z.-P.; Huang, F.-L. A ubiquitiformal one-dimensional steady-state conduction model for a cellular material rod. Int. J. Thermophys. 2016, 37, 41. [Google Scholar] [CrossRef]
  30. Min, Y.; Zhuo-Cheng, O.; Zhuo-Ping, D.; Feng-Lei, H. Research on one-dimensional ubiquitiformal constitutive relations for a bimaterial bar. J. Theor. Appl. Mech. 2019, 57, 291–301. [Google Scholar] [CrossRef]
  31. Ma, Z.; Shi, C.-Z.; Wu, H.-G. Numerical cracking analysis of steel-lined reinforced concrete penstock based on cohesive crack model. Structures 2021, 34, 4694–4703. [Google Scholar] [CrossRef]
  32. Ou, Z.C.; Li, C.Y.; Duan, Z.P.; Huang, F.L. A stereological ubiquitiformal softening model for concrete. J. Theor. Appl. Mech. 2019, 57, 27–35. [Google Scholar] [CrossRef]
  33. Ou, Z.C.; Yang, M.; Li, G.Y.; Duan, Z.P.; Huang, F.L. Ubiquitiformal fracture energy. J. Theor. Appl. Mech. 2017, 55, 1101–1108. [Google Scholar] [CrossRef]
  34. Ou, Z.C.; Ju, Y.B.; Li, J.Y.; Duan, Z.P.; Huang, F.L. Ubiquitiformal crack extension in quasi-brittle materials. Acta Mech. Solida Sin. 2020, 33, 674–691. [Google Scholar] [CrossRef]
  35. Ju, Y.B.; Ou, Z.C.; Duan, Z.P.; Huang, F.L. The ubiquitiformal characterization of the mesostructures of polymer-bonded explosives. Materials 2019, 12, 3763. [Google Scholar] [CrossRef] [PubMed]
  36. Shang, S.; Cao, X.; Liu, Z.; Shi, J.P. Analysis of normal elastic contact stiffness of rough surfaces based on ubiquitiform theory. J. Tribol. 2019, 141, 111401. [Google Scholar] [CrossRef]
  37. Koumi, K.E.; Zhao, L.; Leroux, J.; Chaise, T.; Nelias, D. Contact analysis in the presence of an ellipsoidal inhomogeneity within a half space. Int. J. Solids Struct. 2014, 51, 1390–1402. [Google Scholar] [CrossRef]
  38. Khezrzadeh, H.; Mofid, M. Tensile fracture behavior of heterogeneous materials based on fractal geometry. Theor. Appl. Fract. Mech. 2006, 46, 46–56. [Google Scholar] [CrossRef]
  39. Freiberg, U.; Kohl, S. Box dimension of fractal attractors and their numerical computation. Commun. Nonlinear Sci. Numer. Simul. 2021, 95, 105615. [Google Scholar] [CrossRef]
  40. Denniston, J.T.; Solovyov, S.A. Sierpinski object for composite affine spaces. Fuzzy Sets Syst. 2021, 420, 157–168. [Google Scholar] [CrossRef]
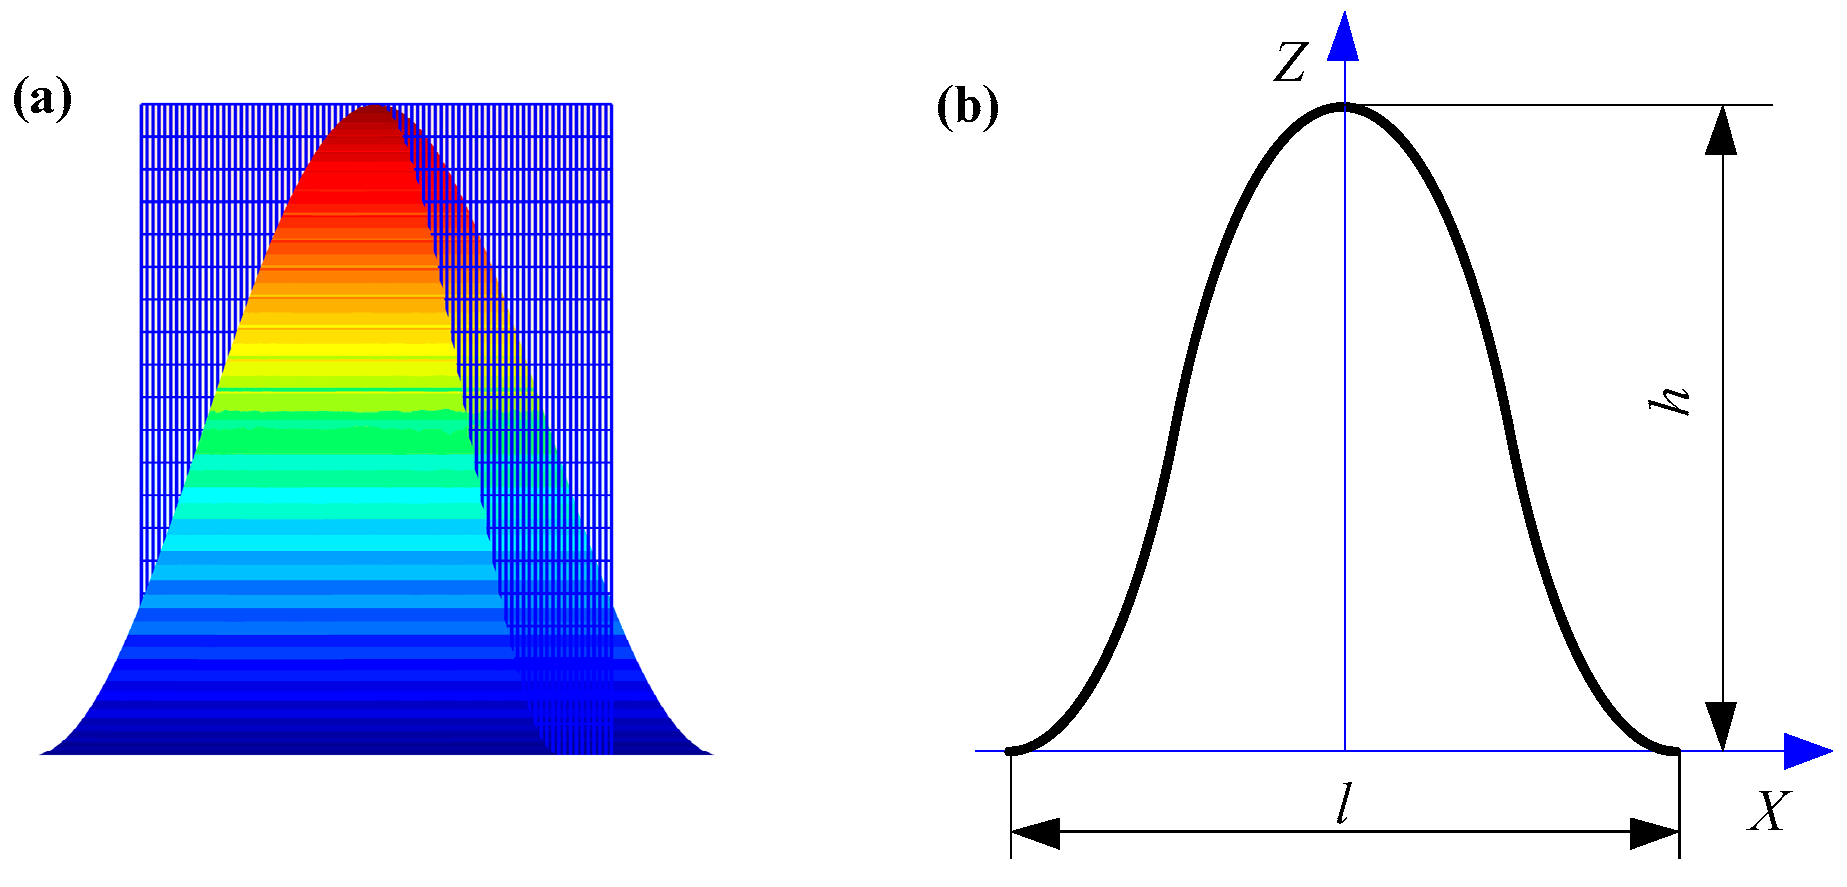
Figure 1. The schematic diagram of the axisymmetric sinusoidal asperity: (a) the three-dimensional view; (b) the vertical cross-sectional view.
Fractalfract 08 00351 g001
Figure 2. Schematic diagram of a two-dimensional rough surface.
Fractalfract 08 00351 g002
Figure 3. The generalized ubiquitiformal Sierpinski carpet: (a) unit division; (b) first-order Sierpinski carpet; (c) second-order Sierpinski carpet.
Fractalfract 08 00351 g003
Figure 4. The contact model of a single asperity.
Fractalfract 08 00351 g004
Figure 5. The schematic diagram of the test rig.
Fractalfract 08 00351 g005
Figure 6. The relationship between the contact stiffness and the contact pressure under different grinding joint surfaces: (a) grinding joint surface 1; (b) grinding joint surface 2; (c) grinding joint surface 3; (d) grinding joint surface 4.
Fractalfract 08 00351 g006
Table 1. The fractal characteristic parameters of different grinding surfaces.
Ubiquitiformal DimensionGrinding Joint Surface 1Grinding Joint Surface 2Grinding Joint Surface 3Grinding Joint Surface 4
D12.5532.5172.4972.491
D22.5362.5222.5012.496
Table 2. The roughness parameters of the grinding joint surface.
Roughness ParametersGrinding Joint Surface 1Grinding Joint Surface 2Grinding Joint Surface 3Grinding Joint Surface 4
Rp1/μm0.5402.5323.5088.895
Rv1/μm0.3751.7963.0827.847
Rq1/μm0.1320.2880.4410.733
Rp2/μm0.5742.5193.5828.884
Rv2/μm0.3881.7583.1347.766
Rq2/μm0.1440.2790.4590.731
Disclaimer/Publisher’s Note: The statements, opinions and data contained in all publications are solely those of the individual author(s) and contributor(s) and not of MDPI and/or the editor(s). MDPI and/or the editor(s) disclaim responsibility for any injury to people or property resulting from any ideas, methods, instructions or products referred to in the content.