Abstract
Distinguishing itself from marine shale formations, alkaline lake shale, as a significant hydrocarbon source rock and petroleum reservoir, exhibits distinct multifractal characteristics and evolutionary patterns. This study employs a combination of hydrous pyrolysis experimentation, nitrogen adsorption analysis, and multifractal theory to investigate the factors influencing pore heterogeneity and multifractal dimension during the maturation process of shale with abundant rich alkaline minerals. Utilizing partial least squares (PLS) analysis, a comparative examination is conducted, elucidating the disparate influence of mineralogical composition on their respective multifractal dimensions. The findings reveal a dynamic evolution of pore characteristics throughout the maturation process of alkaline lake shale, delineated into three distinct stages. Initially, in Stage 1 (200 °C to 300 °C), both ΔD and H demonstrate an incremental trend, rising from 1.2699 to 1.3 and from 0.8615 to 0.8636, respectively. Subsequently, in Stages 2 and 3, fluctuations are observed in the values of ΔD and D, while the H value undergoes a pronounced decline to 0.85. Additionally, the parameter D1 exhibits a diminishing trajectory across all stages, decreasing from 0.859 to 0.829, indicative of evolving pore structure characteristics throughout the maturation process. The distinct alkaline environment and mineral composition of alkaline lake shale engender disparate diagenetic effects during its maturation process compared with other shale varieties. Consequently, this disparity results in contrasting evolutionary trajectories in pore heterogeneity and multifractal characteristics. Specifically, multifractal characteristics of alkaline lake shale are primarily influenced by quartz, potassium feldspar, clay minerals, and alkaline minerals.
1. Introduction
In recent years, there has been a notable escalation in the global pursuit of shale oil and gas exploration and exploitation [1,2,3]. Shale formations exhibit significant pore heterogeneity, manifesting as a complex network of pores ranging from minuscule dimensions (<1 nm) to those spanning several micrometers [4,5,6]. Within the shale oil and gas system, shale serves a dual role, acting both as a source rock for hydrocarbons and as a crucial reservoir for the oil and gas it inherently generates [7]. A comprehensive understanding of shale pore and multifractal characteristics yields profound insights into the fluid dynamics and storage potential of porous media. Consequently, this understanding serves as pivotal guidance in the exploration and exploitation of shale oil and gas resources [8].
The maturation state significantly influences the pore heterogeneity and multifractal characteristics of shale formations [9,10,11,12]. Under high temperatures, potential mineral transformations or recrystallizations may occur, resulting in significant variations in the geometric and topological features of the pores. Consequently, the reservoir capacity and hydrocarbon accumulation mechanisms in shale are profoundly affected [13,14,15,16]. The maturation process of organic matter delineates distinct phases in shale evolution, during which the generation and release of oil, bitumen, and gas occurs within various pore types [7]. Furthermore, the temperature during pyrolysis plays a critical role in determining the efficiency of hydrocarbon generation and release within shale formations. The release of hydrocarbons in shale induces the production of acidic substances, leading to dissolution processes that significantly impact the development of shale pores [17,18].
Numerous techniques and methods have been employed for the investigation of shale pore structure. Through two-dimensional/three-dimensional imaging technologies such as optical microscopy (OM), scanning electron microscopy (SEM), micro-focus X-ray computer tomography (μ-CT), focused ion beam scanning electron microscopy (FIB-SEM), and NMR cryoporometry and thermoporometry techniques, the geometric shape and connectivity of shale pores can be characterized [19,20,21,22,23]. Various experimental methods, including fluid injection (high-pressure mercury intrusion), gas adsorption (CO2/N2 adsorption), and small/ultra-small angle neutron scattering (SAXS/USAXS), facilitate the acquisition of shale pore structure-related parameters [24,25,26,27]. However, the significant heterogeneity and connectivity of shale pores pose considerable challenges for their characterization solely through imaging observations and pore parameter analysis. Traditional Euclidean geometry-based methods often prove inadequate for describing shale pores [28,29]. Therefore, the application of fractal dimension theory serves as a valuable tool for quantifying the complexities and heterogeneities inherent in shale pore structure [30,31]. Fractal dimensions serve as indicators of pore surface roughness and complexity, offering insights into the characteristics of pore structures within a confined unit [28,32]. However, the inherent heterogeneity of shale pores, which are distributed quasi-randomly within a specific range and exhibit various self-similarities across pore size intervals, poses a challenge to the singular fractal dimension’s ability to provide a detailed representation of the diverse pores comprising the shale matrix [8,28]. In response, multifractal dimensions are employed to accurately characterize system heterogeneity and capture local fluctuations through a continuous dimension spectrum, thereby facilitating a comprehensive depiction of both local and global features [4,8,33]. Serving as an extension and refinement of the fractal dimension, multifractal analysis enhances the representation of pore structure information, thus offering a more precise illustration of shale composition [8,34,35,36].
In recent years, scholars have devoted significant attention to investigating the fractal dimension and pore structure characteristics of marine and continental shale formations undergoing pyrolysis processes. Key research areas include examining the influence of thermal maturity on pore configuration, elucidating the relationship between clay minerals and pore structure, and analyzing the effects of hydrocarbon production from organic matter on pore structure evolution during pyrolysis progression [24,26,36,37]. Moreover, multifractal theory has emerged as a widely utilized framework in the study of various shale formations such as Bakken shale, Perth shale, Barnett shale, Marcellus shale, and Bohai Bay Basin shale [37,38].
Alkaline lakes typically exhibit pH values ranging from 9 to 11, with total salinity levels spanning 100 to 350 g/L, predominantly composed of cations such as K+, Na+, Ca2+, and Mg2+. However, in contrast with marine shale formations, the global distribution of alkaline lake shale is relatively limited. Representative examples of alkaline lake shale worldwide include the Eocene Green River Formation shale in the western United States, the Lower Cretaceous Coqueiro and Macabu Formation shales in the Campos Basin of Brazil, and the Fengcheng Formation shale in the Mahu Sag of northwest China [39,40,41]. Distinguishing itself from typical marine shales, shale deposited in an alkaline environment commonly contains abundant alkaline minerals, including reedmergnerite, shortite, searlesite, eitelite, nahcolite, trona and wegschiderite [30,42,43,44]. During early diagenesis, carbonate cement within alkaline lake shales fills some intergranular pores, thereby impeding compaction and enhancing pore structure heterogeneity [16,39,45]. Additionally, alkaline lake shale, rich in silica, aluminosilicate minerals, and volcanic debris, is prone to dissolution during diagenesis, facilitating optimal reservoir formation [46,47]. Furthermore, alkaline lakes characterized by substantial biological productivity, well-developed algal presence, and excellent organic matter preservation contribute to early hydrocarbon generation, prolonged duration, and oil production catalyzed by alkaline minerals, thus serving as superior source rocks. Nevertheless, investigations into alkaline lake shale remain notably scarce, primarily focusing on lithofacies categorization, diagenesis, geochemical features, and pore structure characteristics. Consequently, research exploring fractal dimensions and pore heterogeneity evolutions during thermal maturation remains relatively sparse [40,45,48,49,50,51].
In this study, samples of shale rich in alkaline minerals sourced from the Fengcheng Formation in the Mahu Sag of the Junggar Basin in China were selected for analysis. Artificially matured shale samples were obtained through pyrolysis experiments. Utilizing nitrogen adsorption experiments, multifractal analysis was conducted on these samples to elucidate the evolution patterns and determinants of multifractal dimensions throughout the pyrolysis process. Furthermore, by comparing marine shale with alkaline lake shale, potential environmental influences on multifractal dimensions and pore heterogeneity were analyzed. This research represents a practical application of fractal theory across disciplines and aims to refine current understanding of the multifractal nature and pore structure heterogeneity of alkaline lake shale. Moreover, the findings of this study provide theoretical support for the exploration and exploitation of shale oil and gas resources in China.
2. Geological Settings
The Mahu Sag is located at the northwestern margin of the Junggar Basin. It is a sag formed on the basis of the pre-Carboniferous folded basement and controlled by peripheral fault-thrusting activities [52]. The western boundary is surrounded by the Zhongguai Uplift, the Kebai Fault Zone, and the Wuxia Fault Zone from south to north, adjacent to the Dabasong and Xiayan Uplift in the southeast, and connected to the Yingxi Sag in the east, with an area of about 5000 km2 [52,53]. The strata in the Permian of Mahu Sag mainly include the Jiamuhe Formation, Fengcheng Formation, Xiazijie Formation, Lower Urho Formation, and Upper Urho Formation from bottom to top [53]. The studied horizon in this paper is the Fengcheng Formation. The Fengcheng Formation develops delta facies and lacustrine sedimentation, and the burial depth generally exceeds 4000 m (Figure 1) [53]. The shale of the Fengcheng Formation in the Mahu Sag has been verified to be alkaline lake shale by many scholars [43,54,55,56]. As one of the important hydrocarbon source rock strata, the Fengcheng Formation is also a key field in shale oil exploration in recent years [57,58,59,60].
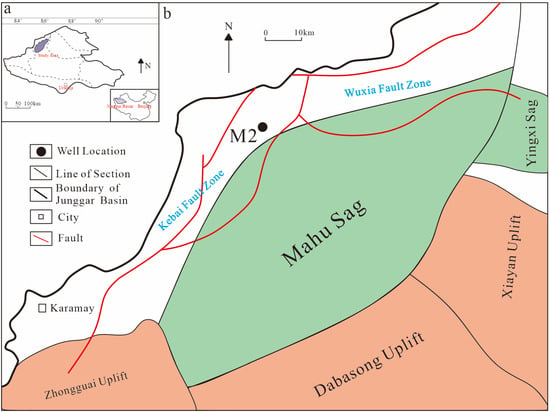
Figure 1.
(a) Location map of Junggar Basin, northwest China; (b) structure map of Mahu Sag and location of well M2 (modified from Zhang et al., 2024 [53]).
3. Methodology
3.1. Samples
Organic-rich shale samples containing alkaline minerals in Well M2 from the Fengcheng Formation in the Mahu Sag of the Junggar Basin in northwest China were selected for this study. During sampling, column samples of identical depth and parallel orientation were chosen and subsequently divided into six equal parts after grinding into powder and being mixed together (depth of the samples: 4155.82 m). Each part underwent pyrolysis experiments at different temperatures to mitigate the potential impact of heterogeneity on the experimental outcomes.
3.2. Hydrous Pyrolysis
In accordance with the time–temperature compensation principle, a methodology was adopted to simulate a continuous sequence of long-term and low-temperature geological evolution processes under elevated temperatures within a relatively short experimental duration. The HXHTST-II high-pressure pyrolysis simulator and HXSRDE-II source rock diagenetic evolution simulator were employed within a semi-closed system. The six shale samples were subjected to incremental heating cycles at temperatures of 200 °C, 250 °C, 300 °C, 350 °C, 400 °C, and 450 °C, respectively (each sample was straightly heated under 200 °C, 250 °C, 300°C, 350 °C, 400 °C, and 450 °C). Each pyrolyzed shale sample was labeled accordingly: M-200, M-250, M-300, M-350, M-400, and M-450. Subsequently, the temperature was maintained for a period of 48 h to ensure thermal equilibrium throughout the system.
Organic geochemical, petrological, and low-temperature gas adsorption experiments were conducted on each specimen to obtain comprehensive data on geochemical parameters, mineralogical attributes, and pore structure characteristics across varying thermal maturation levels. Additionally, multifractal theory was employed for numerical simulation to analyze the alteration in pore structure heterogeneity.
3.3. XRD and Geochemical Analysis
To determine the mineral composition of the rock samples, X-ray diffraction (XRD) experiments were conducted using the Bruker D8 advance X-ray diffractometer, yielding comprehensive mineralogical data. Total organic carbon (TOC) tests were carried out using a Leco CS230 analyzer, with the samples ground to an approximate granularity of 100 μm prior to analysis. Rock Eval pyrolysis was performed following standard procedures, enabling the determination of key geochemical indicators such as S1, S2, S3, etc. S1 and S2, respectively, represent the residual hydrocarbons generated by organic matter in the rock but not yet expelled, and the organic matter that can generate hydrocarbons but has not yet. The sum of S1 and S2 is known as the hydrocarbon generation potential, indicating the rock’s hydrocarbon generation capacity. S3 stands for the amount of carbon dioxide produced by the pyrolysis of kerogen in the rock.
3.4. Gas Adsorption
The Micromeritics ASAP 2460 apparatus was employed under 77 K (LNA) conditions to characterize the structures of mesopores (2~50 nm) and macropores (>50 nm) through low-pressure N2 adsorption. Prior to experimentation, the samples were pulverized to a granularity of 35~80 mesh. Subsequently, the pulverized samples underwent an approximately 8 h degassing process within the apparatus to remove any adsorbed gases or contaminants. Following degassing, the samples were subjected to cycles of increasing and decreasing N2 relative pressure, corresponding to the adsorption and desorption processes. The acquired N2 adsorption isotherms were analyzed using the Brunauer–Emmett–Teller (BET) model to quantitatively assess the pore size distribution. This analysis enabled the determination of the size distribution of mesopores and macropores and the generation of the pore size distribution (PSD) curve [61,62,63].
3.5. Fractal Analysis
Shale pore structures are known for their pronounced heterogeneity, making fractal theory a common tool in shale pore studies. Among the various fractal models utilized by scholars, the Frenkel–Halsey–Hill (FHH) method stands out as a frequently employed approach. In this article, we utilized data obtained from N2 adsorption experiments to calculate the fractal dimensions of porous media using the FHH model. The calculation method for determining the fractal dimensions is outlined as follows:
In the formula, P/Po represents the relative pressure, V denotes the volume of adsorbed N2, and C is a constant parameter. According to fractal theory, the fractal dimension (D) typically ranges between 2 and 3, with an increase in the D value indicating greater heterogeneity and complexity within the pore structure [2,8,47,62,63,64].
In many cases, the intricate nature of shale porosity poses a challenge for singular fractal dimension models, such as the FHH model, to offer a precise representation. Previous studies on shale pores often resort to the box-counting technique for multifractal analysis, which allows for a more comprehensive examination of the complex pore structure [2,40,48,62,63].
A series of uniformly sized boxes, each with a length denoted as k, was utilized and placed over the interval of the recorded signal for analysis. The probability density within each box can be expressed as follows:
where Pi(k) is the probability density function; Vi(k) represents the pore volume of the Number l box; N(k) is the total number of boxes, N(k) = 2a (a = 0,1,2, …). For each interval of size k, the exponential function relationship between Pi(k) and k can be represented as [62,63,65]:
where αi is the singularity index, indicating that as i approaches 0, the singularity of the system approaches infinity [8,63,66]. For the multifractal distribution characteristics of the interval of size k, as k decreases, N(k) increases in the form of a power function, the specific form is:
where Nα(k) is the number of boxes with singular strength between different α values in the function Pi(k), and f(α) represents the multifractal spectrum or singularity spectrum. Finally, α(q) and f(α) can be calculated based on the related equations in the research results of Chhabra [67].
Xi(q, k) is derived from the weighted sum of the qth power of Pi(k), and also follows the power function of k:
where q is the index representing the fractal characteristics of the object at different scales. In this study, the value of q is taken as continuous unit steps ranging from −10 to 10. For multifractal applications, the probability distribution function is defined as [61,64]:
where τ(q), the mass scaling function of order q, can be defined as [63]:
when q = 1:
4. Results
4.1. Petrophysical and Geochemical Characteristic
The mineralogical and geochemical data of the shale samples at various temperatures are presented in Table 1. The Tmax value of the original sample is 417 °C, indicating that the shale sample is immature. With increasing pyrolysis temperature, observable trends emerge in the quartz, feldspar, and clay mineral content of the samples, displaying an increase–decrease–increase cycle. Specifically, the quartz content exhibits an ascending trend within the 200–250 °C range, reaching 12.5% at 250 °C, before declining to 6.4% within 250–350 °C. Both feldspar and clay mineral contents rise within the 200–300 °C range, decrease within the 300–350 °C interval, and then rise again beyond 350 °C. The carbonate mineral content initially decreases rapidly to 1.4% with increasing pyrolysis severity, maintaining a relatively stable value within the 250–400 °C range. However, upon surpassing 400 °C, the carbonate content sharply increases to 8.5%. The proportion of hornblende remains low (<1.5%) within the 200–300 °C interval, reaching 10.1% at 350 °C before decreasing back to a lower prevalence with further pyrolysis. The trend of eitelite content follows a similar pattern to that of hornblende. Within the 200–300 °C range, the eitelite content remains below 2%. After reaching a value of 40.1% at 350 °C, it gradually decreases back to less than 2%. The total organic carbon (TOC) value undergoes a rapid decrease within the 200–250 °C range, followed by a slower decline between 250 and 350 °C, and subsequently increases within the 350–400 °C range before sharply decreasing after 400 °C. The increase in TOC content between 350 and 400 °C is potentially linked to the release of hydrocarbons and kerogen graphitization [65]. Both S1 and S2 reach a high value at 200 °C and decline rapidly with increasing pyrolysis temperature. While S1 exhibits an increasing trend from 300 °C to 400 °C, S2 remains relatively stable within the 250 °C to 300 °C and 350 °C to 400 °C intervals. The variations in total organic carbon (TOC), S1, and S2 throughout the thermal evolution process are indicative of organic matter transformation, hydrocarbon generation, and asphaltene formation [41,48,68]. As the pyrolysis temperature increases, the combined S1 + S2 content progressively decreases.

Table 1.
Mineralogy and geochemical characteristics of the samples during hydrous pyrolysis.
4.2. N2 Adsorption and Pore Structure
The gas adsorption data reveal an increasing trend in maximum adsorption volume with increasing thermal maturity. Based on the IUPAC classification, the hysteresis loops observed in the samples under different temperatures primarily exhibit Type H3 (see Figure 2). Type H3 hysteresis loops are typically associated with non-rigid particulate aggregates containing slit-like pores. In petrology, this phenomenon may be attributed to a lower content of clay minerals and a higher content of relatively stable minerals such as feldspar and quartz [7,65,69,70]. During the pyrolysis process, as the total organic carbon (TOC) content of the source rocks decreases, the expulsion of hydrocarbons could potentially lead to the minor dissolution of unstable minerals such as feldspar and carbonates. Insufficient dissolution processes may result in the local generation of ink-bottle pores with narrow throats and large diameters. Although all samples develop an H3-type hysteresis loop (Figure 2b–e), the shape of the hysteresis loop in the samples changes slightly with increasing pyrolysis temperature. Specifically, at pyrolysis temperatures of 200 °C and 450 °C, the curve is not smooth (Figure 2a,f). These observed changes in the desorption curve during the pyrolysis process indicate alterations in the pore structure.
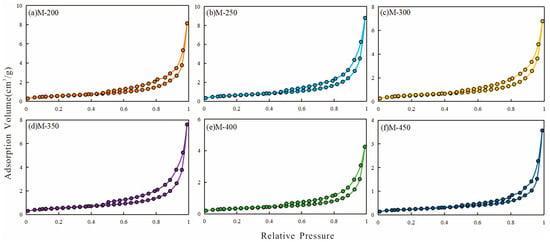
Figure 2.
Adsorption/desorption curves of the samples during hydrous pyrolysis.
The pore structure undergoes continuous changes throughout the pyrolysis process. The pore size distribution (PSD) curve illustrates the relationship between pore radius and pore volume for all samples within the range of 2 nm to 120 nm (Figure 3). The pore size distribution exhibits a bimodal pattern, characterized by two peaks in pore diameter at 20 nm and 40 nm, respectively, with the majority of pore diameters exceeding 20 nm. Additionally, the pore volume demonstrates an initial increase followed by a subsequent decrease in both pore diameter ranges (Figure 4).
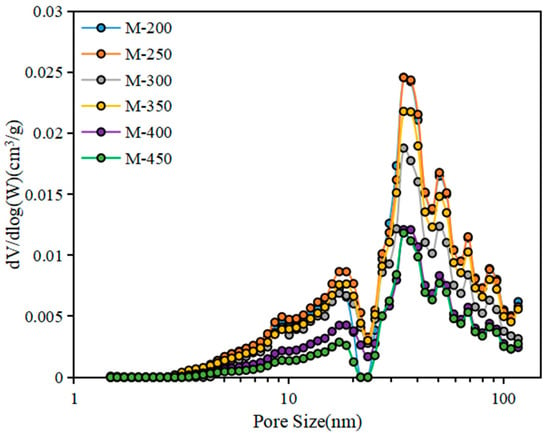
Figure 3.
Pore size distribution of the samples during hydrous pyrolysis.
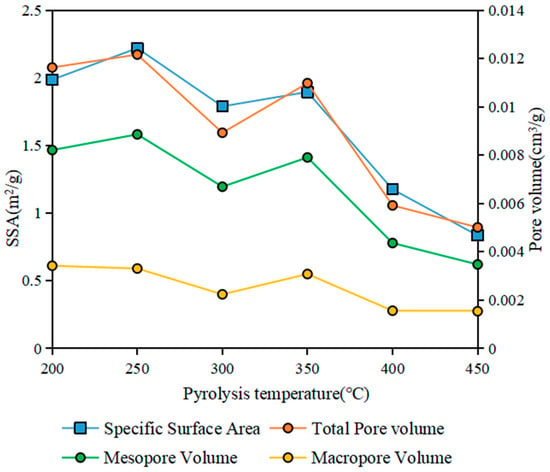
Figure 4.
Variation and relationship of different types of pore volumes and SSA during hydrous pyrolysis.
According to Figure 4 and Figure 5, as the pyrolysis temperature increases, both the total pore volume and specific surface area exhibit a trend of initial increase followed by gradual decrease. The total pore volume ranges from 0.005 cm3/g to 0.0116 cm3/g, while the specific surface area spans from 0.8345 to 2.2188. Mesopore volume predominates over macropore volume, ranging from 0.00821 cm3/g to 0.00347 cm3/g. The alteration trend in mesopore volume initially escalates before receding, similar to the transformation pattern of total pore volume and specific surface area. In contrast, the macropore volume fluctuates more subtly, oscillating between 0.00342 cm3/g and 0.00154 cm3/g (Table 2).
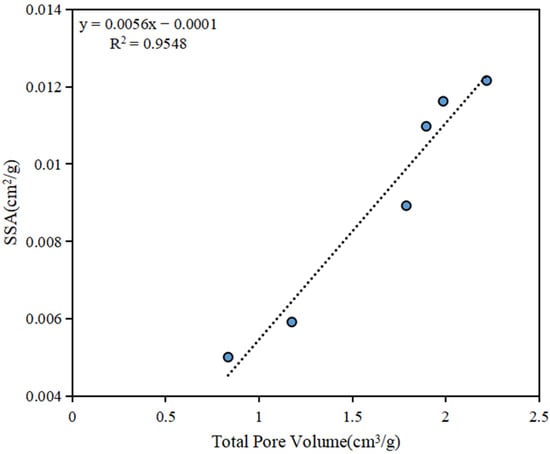
Figure 5.
Relationship between SSA and total pore volume of the samples during hydrous pyrolysis.

Table 2.
SSA and pore volume of the samples during hydrous pyrolysis.
4.3. Fractal Characteristic
During hydrous pyrolysis, water and newly formed hydrocarbons react with minerals, causing significant physical and chemical changes. These changes result in varying alterations in shale pore structure at different stages of artificial maturation, ultimately leading to fluctuations in the fractal dimension [47,71,72]. As depicted in Figure 6, the fractal dimensions of the samples M-200, M-250, M-300, M-350, M-400, and M-450 are calculated to be 2.4713 (Figure 6a), 2.4652 (Figure 6b), 2.46 (Figure 6c), 2.4766 (Figure 6d), 2.4995 (Figure 6e), and 2.4895 (Figure 6f), respectively. Figure 7 illustrates the trend of fractal dimensions with the variation of pyrolysis temperature, displaying an overall pattern of initial decrease, subsequent increase, and then decrease again. The decrease in fractal dimensions signifies a reduction in complexity on the surfaces and structures of the pores, resulting in a tendency towards greater uniformity. This evolution may stem from the generation of bitumen and hydrocarbons, which block more complex branched pores, thereby accentuating the dominance of larger pores [47,73]. Alternatively, it may be attributed to extensive mineral dissolution at this stage, which has led to an improvement in the pore structure to a certain extent. Conversely, the increase in fractal dimensions indicates an enhancement in the heterogeneity of the pore structure. This could be attributed to poorer pore connectivity and an uneven distribution of pores in space [74,75,76,77,78].
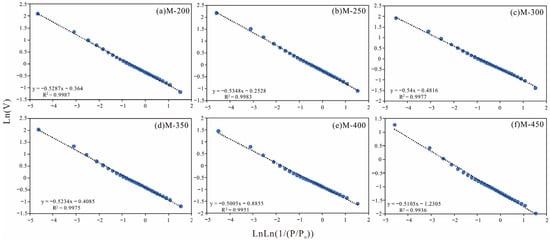
Figure 6.
Fractal characteristics of the samples during hydrous pyrolysis (based on FHH theory).
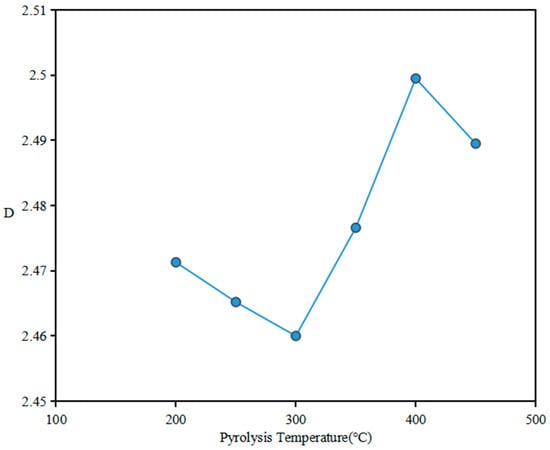
Figure 7.
Variation of the fractal dimension (FHH theory) of the samples during hydrous pyrolysis.
The decrease in fractal dimensions signifies a reduction in complexity on the surfaces and structures of the pores, resulting in a tendency towards greater uniformity. This evolution may stem from the generation of bitumen and hydrocarbons, which block more complex branched pores, thereby accentuating the dominance of larger pores. Alternatively, it may be attributed to extensive mineral dissolution at this stage, which has led to an improvement in the pore structure to a certain extent. Conversely, the increase in fractal dimensions indicates an enhancement in the heterogeneity of the pore structure. This could be attributed to poorer pore connectivity and an uneven distribution of pores in space.
Based on the results of the nitrogen adsorption experiments, the generalized dimension Dq of nitrogen adsorption is calculated for all samples. As demonstrated in Figure 8, the generalized dimension spectrum obtained from the nitrogen adsorption shows an inverted “S” curve. The calculation results in Table 3 show that the generalized dimensions of the samples follow D0 > D1 > D2. Furthermore, Dq monotonously decreases within the interval of q = −10 to 10, indicating that the shale pores within the 2~120 nm range display multifractal characteristics during the nitrogen adsorption process.
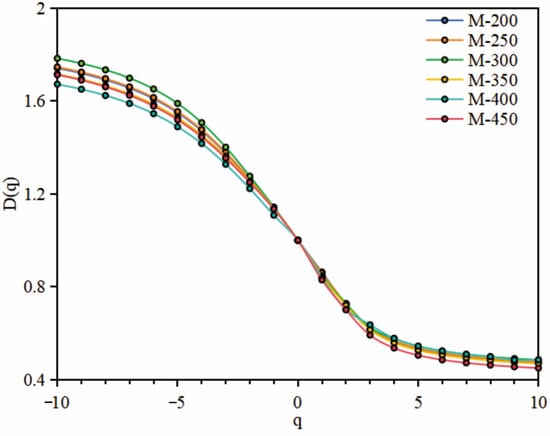
Figure 8.
Generalized dimensions of the samples from the N2 adsorption during hydrous pyrolysis.

Table 3.
Multifractal characteristics of the samples during hydrous pyrolysis.
In the generalized dimension spectrum, D0 denotes the singularity of non-empty boxes within a continuous interval. The multifractal dimension calculation results reveal that all samples have identical D0 values of 1, indicating that the singularity of non-empty boxes remains consistent irrespective of the distribution characteristics of the pores within the boxes. D1 typically represents the information entropy dimension in multifractal analysis, providing insight into the distribution of various apertures within the system [8,79]. It is commonly used to depict the density distribution of shale pores within a unit interval [80]. A higher D1 value generally indicates a more concentrated distribution of the shale’s pore size distribution (PSD) curve [81]. As the pyrolysis temperature increases, the D1 value exhibits a decreasing trend, ranging from 0.859 to 0.829. This suggests that the pyrolysis process induces certain alterations in the pore space of shale samples, thereby amplifying the dispersion in the size distribution of shale pores.
Within the generalized dimension spectrum, D2 represents the correlation dimension. The Hurst index, calculated as H = (D2 + 1)/2, typically falls within the range of 0.5 to 1. A higher H value indicates increased autocorrelation within a size-dependent porosity distribution [8,82,83]. Moreover, the Hurst index serves as a measure of pore connectivity, with higher values suggesting improved pore connectivity. The Hurst index values for all samples from the hydrous pyrolysis experiment range between 0.85 and 0.86355. Initially, the Hurst index slightly increases with the elevation of pyrolysis temperature; however, it subsequently decreases rapidly, indicating that pyrolysis ultimately disrupts pore connectivity.
Within the generalized dimension spectrum, the range of D10 spans from 0.4488 to 0.4843, while the range of D−10 extends from 1.6726 to 1.7838 (Table 3). The difference between D−10 and D10, denoted as ΔD, serves as a key indicator of the overall heterogeneity inherent in the pore size distribution data. The heterogeneity of pore structure, as represented by ΔD, is primarily influenced by volume changes among different types of pores. A higher ΔD value indicates a greater deviation in the dispersion of pore dimensions [8,82,84]. The ΔD values for samples at various pyrolysis temperatures range from 1.1883 to 1.3. Corresponding with an increase in pyrolysis temperature, ΔD demonstrates a trend of initial elevation, subsequent reduction, and final increase.
5. Discussion
5.1. The Relationship between Pore Structure and Multifractal Dimension during Pyrolysis
Throughout the hydrous pyrolysis experiment, changes in organic matter and hydrocarbon generation lead to modifications in pore characteristics, resulting in heterogeneity of the pore structure [15,42,85]. To investigate the relationships among SSA, pore volume, and multifractal dimension, we conducted Pearson’s correlation analysis (Figure 9).
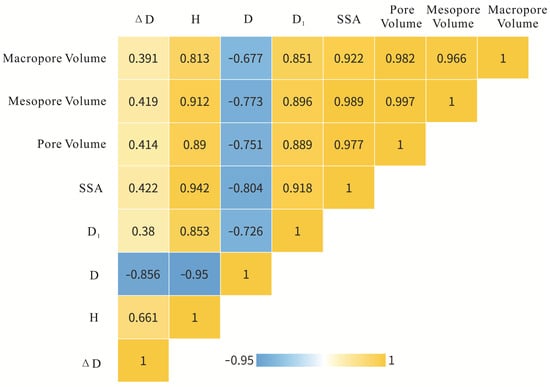
Figure 9.
Correlation coefficients between pore structure parameters.
The correlation between ΔD and SSA, total pore volume, mesopore, and macropore volume appears relatively weak. This suggests that changes in pore radius size and volume do not maintain a strong absolute correlation during the hydrous pyrolysis experiment. Conversely, parameters H, D, and D1 demonstrate a robust correlation with mesopore volume and specific surface area. This phenomenon can be attributed to the hydrous pyrolysis process, wherein newly generated hydrocarbons initially occupy smaller pores. Moreover, for the samples with rich alkaline minerals, dissolution exerts a more pronounced modifying effect on smaller pores, resulting in a greater amplitude for mesopore volume (Figure 4). Small diameter pores, which contribute to increased SSA, significantly influence changes in surface area. Additionally, the characteristics of mesopore exert a profound influence on pore connectivity, heterogeneity, and distribution dispersion across the entire shale sample. Therefore, parameters H, D, D1, and SSA exhibit a stronger correlation with mesopore volume compared with macropore volume.
As depicted in Figure 4, the amplitude of macropore volume is comparatively smaller. Notably, between 300 °C and 400 °C, the volume of macropores displays significant volatility, a phenomenon catalyzed by the metamorphism and transmutation of minerals under an alkaline environment. The volume of macropores exhibits a strong correlation with parameters H and D1, while its connection with D appears slightly weaker. This suggests that the development of larger pores has a limited impact on the heterogeneity of the pore structure.
5.2. The Variation of Pore Heterogeneity and Multifractal Dimension during Hydrous Pyrolysis
Figure 9 illustrates the interrelations among various parameters (H, D, D1, ΔD) characterizing the heterogeneity of pores. Throughout the hydrous pyrolysis experiment, D1 and H demonstrate similar evolution tendencies, while D and ΔD exhibit an inverse trend (refer to Figure 9). There is a strong correlation among H, ΔD, and D, whereas D1 shows a weak correlation with ΔD and a significant correlation with H and D. These findings suggest a robust association between pore interconnectivity, pore distribution, and the heterogeneity of the sample.
The analysis focuses on the variation of multifractal dimension during the hydrous pyrolysis experiment, which is divided into three stages.
During Stage 1, spanning from 200 °C to 300 °C, both the D and D1 values exhibit a downward trend (Figure 10a,d), while the H and ΔD indices encounter an escalation (Figure 10b,c). Throughout the pyrolysis experiment, S2 represents the hydrocarbon yield during the thermal maturation phase of the source rock, whereas the sum of S1 and S2 signifies the potential hydrocarbon yield. The data presented in Table 1 illustrate significant declines in both S2 and the sum of S1 and S2, indicating the generation of hydrocarbons in the shale samples as thermal maturation progresses. Shale produces a substantial volume of organic acids (such as carboxylic and phenolic acids) and acidic gases (such as CO2 and H2S). These acidic fluids are primarily neutralized by adjacent alkaline minerals (such as eitelite), maintaining a moderated level of alkalinity within the samples. Throughout this progression, due to the substantial dissolution of alkaline minerals, larger dissolution pores are liable to emerge. The advent of these dissolution pores commonly enhances pore interconnectivity and augments the dispersion of pore size distribution, resulting in an increase in D1 and H and a decrease in the D value. An increase in the frequency of larger pore spaces induces an uneven distribution of pore dimensions within the entire shale sample, leading to a small surge in the ΔD index.
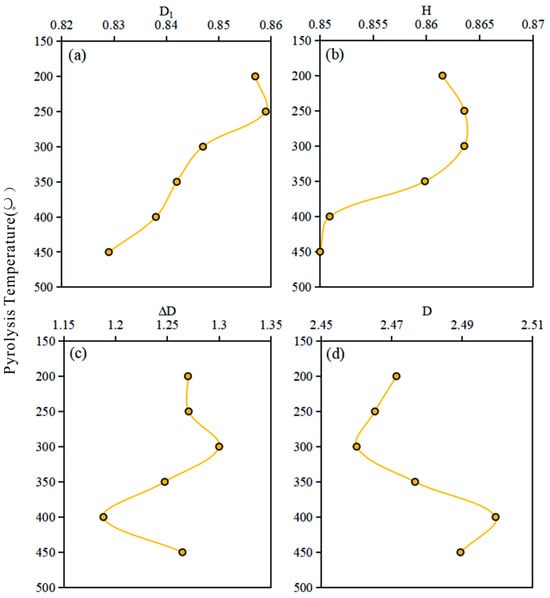
Figure 10.
Variation trend of multifractal parameters during hydrous pyrolysis.
In Stage 2, within the temperature range of 300–400 °C during pyrolysis, the D value rises (Figure 10d) whereas the H, D1, and ΔD values decrease (Figure 10a–c). Alkaline hornblende class minerals and eitelite are formed in an alkaline environment (300–350 °C). Due to the mineral composition of alkaline lake shale and formation water environment, after the acidic fluid is neutralized by alkaline minerals, the formation water environment usually continues to maintain its alkalinity [86]. Quartz granules in an alkaline environment are subjected to dissolution, primarily manifesting intragranular pores of limited interconnectivity and minute scale [87]. Additionally, feldspar, which typically forms micrometer dissolution pores in acidic environments, is susceptible to erosion in alkaline conditions, leading to the development of nanometer scale honeycomb dissolution pores [87,88,89,90].
In the temperature range of 400 °C to 450 °C in Stage 3, the increase in S3 indicates a higher conversion of organic matter to CO2. During this phase, quartz dissolution ceases, leading to an increase in its content, while feldspar undergoes dissolution and metamorphism, transforming into alkaline minerals such as eitelite. At 450 °C, bitumen undergoes pyrolysis, forming an internal pore network that enhances pore development to some extent. These newly formed pores moderately improve the overall surface roughness and complexity of the pore structure in shale [91], resulting in an increase in ΔD (Figure 10c) and a decrease in D (Figure 10d).
In Stages 2 and 3, the interaction between CO2 and the alkaline reservoir fluid typically leads to the transition of the reservoir fluid from alkaline to neutral [86,92]. Quartz dissolution ceases during this stage, accompanied by an increase in content, while feldspar undergoes dissolution, transforming into alkaline minerals such as eitelite. During the hydrothermal transformations of feldspar into eitelite within an alkaline environment, an instantaneous thin fluid film forms on the mineral particle surface, exhibiting distinct chemical and rheological properties compared with the primary fluid [93,94]. As reactions proceed, insoluble elements released by mineral particles are immediately reprecipitated at the interface through the thin fluid film, while soluble elements migrate into the main fluid [93,94,95,96]. Therefore, even in conditions where the secondary mineral ions in the main solution are undersaturated, the reprecipitation of secondary minerals remains plausible [95,97,98]. In summary, during the intermineral transformation process occurring between 300 °C and 450 °C, newly formed minerals typically precipitate on mineral grain surfaces influenced by the thin fluid film, gradually occupying larger pores such as residual original pores and dissolution intergranular pores. With the increasing CO2 partial pressure and high Ca2+ concentration in the formation water, calcite reforms during this stage, filling the large pores [99,100,101]. Following the dissolution–reprecipitation coupling mechanism of hornblende, hornblende dissolves and undergoes transmutation under high temperatures influenced by CO2, resulting in the formation of numerous small pores on the particle surface and the transformation of hornblende into clay minerals such as chlorite [102,103,104]. The surface dissolution and transmutation amplify the number of small pores, enhancing pore heterogeneity, a change further augmented by the newly formed clay minerals. Based on previous diagenesis studies, the substitution of feldspar by alkaline minerals in samples is a widespread phenomenon in geological strata. This alteration process results in the formation of new minerals, such as carbonates, characterized by internal particle opacity and extensive development of intragranular micropores, while maintaining regular particulate boundaries [49,50,75]. The simultaneous filling of macropores and the genesis of numerous poorly connected micropores suggest a phase in which shale reservoir connectivity decreases, heterogeneity intensifies, and pore distribution becomes uneven. Consequently, the fractal dimension (D) exhibits an upward trend (Figure 10d), while the Hurst index (H) and the information entropy dimension (D1) show a downward tendency within the temperature range of 300–450 °C (Figure 10a,b).
5.3. The Influence of Mineralogy on Multifractal Dimension Based on Comparison
Based on previous scholarly contributions and the findings of this study, the differences in pore heterogeneity and multifractal characteristics observed in alkaline lake shale compared with other types of shales primarily stem from two key factors.
The sedimentary environment of shale rich in alkaline minerals is situated within a lake basin characterized by elevated pH values. This fundamental disparity in the sedimentary environment instigates changes, wherein terrigenous detrital matter undergoes dissolution and transformation under alkaline influences. The alkaline conditions foster the dissolution of terrigenous fine or silt quartz upon deposition in the lake, resulting in a significantly reduced quartz content within the alkaline lake shale. Detrital clay minerals such as montmorillonite, unstable in alkaline water conditions, are easily dissolved or transformed to new silicate minerals, such as Fe-illite, Mg-smectite, K-feldspar, and analcime during burial processes [55,105,106,107].
Secondly, volcanic materials undergo instability within alkaline water, leading to dissolution and metamorphosis, resulting in the formation of novel silicate and silica minerals. The evolution of alkaline lakes is primarily linked to volcanic activities and associated hydrothermal events. The clastic fragments and volcanic matrices, rich in volcanic materials, are widely distributed within the Fengcheng Formation shale. Exposed to an alkaline environment, these materials release abundant K+, Na+, Ca2+, Mg2+, and alkaline formation water, subsequently transforming into autogenic silicate minerals such as sodium feldspar and potassium feldspar [55,108]. In comparison with marine shale, the differences in mineralogy further contribute to variations in reservoir formation mechanisms and diagenesis. This serves as the fundamental rationale for the distinct pore structure and multifractal dimensions observed in alkaline lake shale compared with other shale types.
To investigate the influence of mineralogy on shale multifractal dimension, partial least squares regression (PLS) analysis was conducted. Data from marine shale samples sourced from the Mesoproterozoic Xiamaling Formation in North China, as documented by Wu et al. in 2023 [18], were utilized for comparative purposes. The objective was to discern the similarities and differences in the impact of mineral composition on multifractal dimensions between alkaline lake shale and other shale varieties. In this analysis, the Hurst index (H) and ΔD (=D−10 − D10) were chosen as dependent variables, while the mineral content data from Table 1 and Wu et al.’s study were utilized as independent variables for each mineral. The findings are presented in Figure 11.
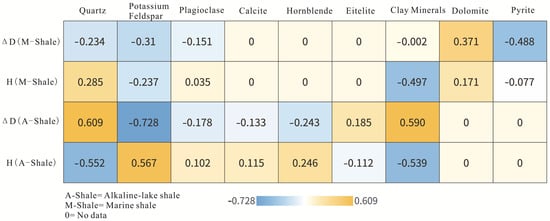
Figure 11.
PLS analysis results based on comparison between alkaline lake shale and marine shale.
In the hydrous pyrolysis of shale rich in alkaline minerals, the fractal dimension is predominantly influenced by quartz, potassium feldspar, and clay minerals, followed by alkaline minerals such as alkaline hornblende and eitelite. In contrast, typical marine shale exhibits relatively less effective control over the fractal dimension by quartz and potassium feldspar during hydrous pyrolysis. Carbonate exerts a more pronounced impact on the fractal dimension in marine shale. Additionally, in marine shale, quartz and potassium feldspar cease to be primary drivers influencing the fractal dimension during hydrous pyrolysis. The clay mineral content in marine shale significantly affects pore interconnectivity, with pyrite and dolomite largely influencing the heterogeneity of pore diameter distribution. Despite the high concentration of quartz in marine shale, the absence of an alkaline environment inhibits dissolution during the diagenesis process, limiting quartz’s control over the multifractal dimension. The diagenetic disparities suggest that the increased concentration of quartz results in poorer pore interconnectivity in alkaline lake shale but enhances the heterogeneity of pore size distribution. Conversely, the effect on marine shale is the opposite.
Both shale rich in alkaline minerals and marine shale exhibit low concentrations of potassium feldspar. However, due to the absence of potassium feldspar dissolution and metamorphism during the hydrous pyrolysis of marine shale, the effect on the multifractal dimension differs between marine shale and alkaline lake shale. The influence of clay minerals on both types of shale varies significantly. Specifically, in alkaline lake shale, the content of clay minerals has a notable negative effect on pore interconnectivity and a positive effect on the heterogeneity of pore diameter distribution. Conversely, clay minerals exert a robust negative influence on pore interconnectivity in marine shale. Throughout the hydrous pyrolysis procedure, the content of hornblende and eitelite also has crucial impacts on the fractal dimension. However, due to their marked fluctuations in content, ranging from low to high and then back to low, they compromise the accuracy of the PLS analysis to some extent.
6. Conclusions
This study aims to assess the evolution of pore heterogeneity and fractal characteristics of alkaline lake shale through artificial hydrous pyrolysis experiments. The method employed combines nitrogen adsorption experiments with multifractal analysis. Additionally, a comparative analysis is conducted between alkaline lake shale and marine shale to elucidate their differences.
- (1)
- During the maturation process of shale, changes occur in the pore characteristics due to the conversion of organic matter and hydrocarbon generation, resulting in alterations in the heterogeneity of the pore structure. The distribution of the total pore volume spans from 0.005 cm3/g to 0.0116 cm3/g, while the specific surface area (SSA) ranges from 0.8345 to 2.2188. Mesopore volume fluctuates between 0.00821 cm3/g and 0.00347 cm3/g, whereas macropore volume varies from 0.00342 cm3/g to 0.00154 cm3/g. The trends of SSA, total pore volume, and mesopore volume exhibit similarity, with minimal volatility observed in the macropore volume. The distribution ranges of ΔD and D are 1.1883 to 1.3 and 2.46 to 2.4995, respectively, indicating opposite trends. With increasing pyrolysis temperature, both D1 and H gradually decrease, with ranges of 0.859 to 0.829 and 0.85 to 0.86355, respectively. These findings suggest that the pyrolysis process ultimately results in a more dispersed distribution of shale pore sizes and diminishes the connectivity among pores.
- (2)
- In the thermal maturation progression of shale rich in alkaline minerals, a direct correlation between pore radius distribution and pore volume is not evident. Mesopores exhibit a greater volume compared with macropores, with mesopores being more susceptible to diagenetic alterations and hydrocarbon modifications during the pyrolysis process. Consequently, the correlation between mesopore volume and other parameters related to pore heterogeneity and multifractal dimensions is more pronounced. Compared with macropores and mesopores, the mesopores (between 2–50 nm) exert a more significant influence on pore heterogeneity and multifractal characteristics.
- (3)
- The changes in multifractal dimensions and pore heterogeneity in alkaline lake shale occur in three consecutive stages. Firstly, the generation of hydrocarbons from organic matter, coupled with the neutralization of alkaline minerals by organic acids, initiates shale dissolution, thereby improving the pore structure. Secondly, a complex diagenetic process ensues, characterized by the mutual transformation between alkaline minerals and feldspar. Newly formed minerals typically precipitate around particle edges and fill intergranular pores. Quartz and feldspar tend to develop intragranular dissolution pores rather than experiencing erosion at the granular periphery in an alkaline environment. The filling of substantial intergranular pores, along with the formation of numerous intragranular small pores, accentuates pore heterogeneity. In the third stage, the transformative effects of dissolution on shale diminish significantly. The pyrolysis of hydrocarbons, such as bitumen, triggers the formation of small pores, thereby enhancing the complexity of the pore structure to some extent.
- (4)
- Diverse sedimentary environments contribute to variations in shale mineral composition. The presence of alkaline conditions and distinctive mineral constituents precipitates disparate diagenetic processes during hydrous pyrolysis, resulting in contrasting developments in pore structure heterogeneity and multifractal characteristics between alkaline lake shale and marine shale. Throughout the hydrous pyrolysis process, the evolution of alkaline lacustrine shale is predominantly governed by quartz, potassium feldspar, and clay minerals, further influenced by alkaline minerals such as hornblende and eitelite. In contrast, dolomite plays a primary role in regulating pore heterogeneity and multifractal dimensions in marine shale, with additional contributions from quartz and potassium feldspar.
Author Contributions
Conceptualization, Y.L.; methodology, Y.L. and L.J.; formal analysis, Y.L. and H.Z.; investigation, Z.Z.; resources, L.J.; data curation, Y.L.; writing—original draft, Y.L.; writing—review and editing, H.Z., Z.Z., and K.L.; supervision, K.L.; project administration, K.L.; funding acquisition, K.L. All authors have read and agreed to the published version of the manuscript.
Funding
This research was funded by the National Natural Science Foundation of China, grant number 42090025.
Data Availability Statement
The data presented in this study are available upon request from the corresponding author. The data are not publicly available because some of the basic research involves confidentiality.
Conflicts of Interest
The authors declare that they have no known competing financial interests or personal relationships that could have appeared to influence the work reported in this paper.
References
- Dai, J.; Zou, C.; Liao, S.; Dong, D.; Ni, Y.; Huang, J.; Wu, W.; Gong, D.; Huang, S.; Hu, G. Geochemistry of the extremely high thermal maturity Longmaxi shale gas, southern Sichuan Basin. Org. Geochem. 2014, 74, 3–12. [Google Scholar] [CrossRef]
- Mishra, S.; Mendhe, V.A.; Varma, A.K.; Kamble, A.D.; Sharma, S.; Bannerjee, M.; Kalpana, M.S. Influence of organic and inorganic content on fractal dimensions of Barakar and Barren Measures shale gas reservoirs of Raniganj basin, India. J. Nat. Gas. Sci. Eng. 2018, 49, 393–409. [Google Scholar] [CrossRef]
- Zou, C.; Yang, Z.; Dai, J.; Dong, D.; Zhang, B.; Wang, Y.; Deng, S.; Huang, J.; Liu, K.; Yang, C.; et al. The characteristics and significance of conventional and unconventional Sinian–Silurian gas systems in the Sichuan Basin, central China. Mar. Petrol. Geol. 2015, 64, 386–402. [Google Scholar] [CrossRef]
- Chandra, D.; Vishal, V. A critical review on pore to continuum scale imaging techniques for enhanced shale gas recovery. Earth-Sci. Rev. 2021, 217, 103638. [Google Scholar] [CrossRef]
- Curtis, M.E.; Cardott, B.J.; Sondergeld, C.H.; Rai, C.S. Development of organic porosity in the Woodford Shale with increasing thermal maturity. Int. J. Coal Geol. 2012, 103, 26–31. [Google Scholar] [CrossRef]
- Loucks, R.G.; Reed, R.M.; Ruppel, S.C.; Jarvie, D.M. Morphology, Genesis, and Distribution of Nanometer-Scale Pores in Siliceous Mudstones of the Mississippian Barnett Shale. J. Sediment. Res. 2009, 79, 848–861. [Google Scholar] [CrossRef]
- Wang, Y.; Liu, L.; Hu, Q.; Hao, L.; Wang, X.; Sheng, Y. Nanoscale Pore Network Evolution of Xiamaling Marine Shale during Organic Matter Maturation by Hydrous Pyrolysis. Energ. Fuel 2020, 34, 1548–1563. [Google Scholar] [CrossRef]
- Liu, K.; Ostadhassan, M.; Zou, J.; Gentzis, T.; Rezaee, R.; Bubach, B.; Carvajal-Ortiz, H. Multifractal analysis of gas adsorption isotherms for pore structure characterization of the Bakken Shale. Fuel 2018, 219, 296–311. [Google Scholar] [CrossRef]
- Chen, J.; Xiao, X. Evolution of nanoporosity in organic-rich shales during thermal maturation. Fuel 2014, 129, 173–181. [Google Scholar] [CrossRef]
- Kang, Z.; Zhao, Y.; Yang, D. Review of oil shale in-situ conversion technology. Appl. Energ. 2020, 269, 115121. [Google Scholar] [CrossRef]
- Wang, L.; Zhao, Y.; Yang, D.; Kang, Z.; Zhao, J. Effect of pyrolysis on oil shale using superheated steam: A case study on the Fushun oil shale, China. Fuel 2019, 253, 1490–1498. [Google Scholar] [CrossRef]
- Zargari, S.; Canter, K.L.; Prasad, M. Porosity evolution in oil-prone source rocks. Fuel 2015, 153, 110–117. [Google Scholar] [CrossRef]
- Cao, T.; Deng, M.; Cao, Q.; Huang, Y.; Yu, Y.; Cao, X. Pore formation and evolution of organic-rich shale during the entire hydrocarbon generation process: Examination of artificially and naturally matured samples. J. Nat. Gas. Sci. Eng. 2021, 93, 104020. [Google Scholar] [CrossRef]
- Löhr, S.C.; Baruch, E.T.; Hall, P.A.; Kennedy, M.J. Is organic pore development in gas shales influenced by the primary porosity and structure of thermally immature organic matter? Org. Geochem. 2015, 87, 119–132. [Google Scholar] [CrossRef]
- Wang, X.; Jiang, Z.; Jiang, S.; Chang, J.; Li, X.; Wang, X.; Zhu, L. Pore Evolution and Formation Mechanism of Organic-Rich Shales in the Whole Process of Hydrocarbon Generation: Study of Artificial and Natural Shale Samples. Energ. Fuel 2020, 34, 332–347. [Google Scholar] [CrossRef]
- Zhang, Y.; Yu, B.; Pan, Z.; Hou, C.; Zuo, Q.; Sun, M. Effect of thermal maturity on shale pore structure: A combined study using extracted organic matter and bulk shale from Sichuan Basin, China. J. Nat. Gas. Sci. Eng. 2020, 74, 103089. [Google Scholar] [CrossRef]
- Fang, X.; Cai, Y.; Hu, Q.; Liu, D.; Gao, P.; Qian, Y.; Jia, Q. Hydrocarbon Retention and Its Effect on Pore Structure Evolution of Marine Shale Based on Pyrolysis Simulation Experiments. Energ. Fuel 2022, 36, 13556–13569. [Google Scholar] [CrossRef]
- Wu, W.; Liang, Z.; Xu, L.; Liu, Y.; Li, Y.; Tang, X.; Yin, Y.; Chen, Y. The Effect of Thermal Maturity on the Pore Structure Heterogeneity of Xiamaling Shale by Multifractal Analysis Theory: A Case from Pyrolysis Simulation Experiments. Minerals 2023, 13, 1340. [Google Scholar] [CrossRef]
- Liang, Z.; Jiang, Z.; Li, Z.; Song, Y.; Gao, F.; Liu, X.; Xiang, S. Nanopores Structure and Multifractal Characterization of Bulk Shale and Isolated Kerogen—An Application in Songliao Basin, China. Energ. Fuel 2021, 35, 5818–5842. [Google Scholar] [CrossRef]
- Wang, P.; Jiang, Z.; Ji, W.; Zhang, C.; Yuan, Y.; Chen, L.; Yin, L. Heterogeneity of intergranular, intraparticle and organic pores in Longmaxi shale in Sichuan Basin, South China: Evidence from SEM digital images and fractal and multifractal geometries. Mar. Petrol. Geol. 2016, 72, 122–138. [Google Scholar] [CrossRef]
- Zhang, S.; Yan, J.; Hu, Q.; Wang, J.; Tian, T.; Chao, J.; Wang, M. Integrated NMR and FE-SEM methods for pore structure characterization of Shahejie shale from the Dongying Depression, Bohai Bay Basin. Mar. Petrol. Geol. 2019, 100, 85–94. [Google Scholar] [CrossRef]
- Enninful, H.R.N.B.; Schneider, D.; Kohns, R.; Enke, D.; Valiullin, R. A novel approach for advanced thermoporometry characterization of mesoporous solids: Transition kernels and the serially connected pore model. Micropor. Mesopor. Mat. 2020, 309, 110534. [Google Scholar] [CrossRef]
- Brun, M.; Lallemand, A.; Quinson, J.; Eyraud, C. A new method for the simultaneous determination of the size and shape of pores: The thermoporometry. Thermochim. Acta 1977, 21, 59–88. [Google Scholar] [CrossRef]
- Clarkson, C.R.; Solano, N.; Bustin, R.M.; Bustin, A.M.M.; Chalmers, G.R.L.; He, L.; Melnichenko, Y.B.; Radliński, A.P.; Blach, T.P. Pore structure characterization of North American shale gas reservoirs using USANS/SANS, gas adsorption, and mercury intrusion. Fuel 2013, 103, 606–616. [Google Scholar] [CrossRef]
- Huang, X.; Zhao, Y. Characterization of pore structure, gas adsorption, and spontaneous imbibition in shale gas reservoirs. J. Petrol. Sci. Eng. 2017, 159, 197–204. [Google Scholar] [CrossRef]
- Xu, L.; Yang, K.; Wei, H.; Liu, L.; Li, X.; Chen, L.; Xu, T.; Wang, X. Full-Scale Pore Structure Characteristics and the Main Controlling Factors of Mesoproterozoic Xiamaling Shale in Zhangjiakou, Hebei, China. Nanomaterials 2021, 11, 527. [Google Scholar] [CrossRef] [PubMed]
- Xu, L.; Yang, K.; Zhang, L.; Liu, L.; Jiang, Z.; Li, X. Organic-induced nanoscale pore structure and adsorption capacity variability during artificial thermal maturation: Pyrolysis study of the Mesoproterozoic Xiamaling marine shale from Zhangjiakou, Hebei, China. J. Petrol. Sci. Eng. 2021, 202, 108502. [Google Scholar] [CrossRef]
- Li, W.; Liu, H.; Song, X. Multifractal analysis of Hg pore size distributions of tectonically deformed coals. Int. J. Coal Geol. 2015, 144–145, 138–152. [Google Scholar] [CrossRef]
- Wang, H.; Liu, Y.; Song, Y.; Zhao, Y.; Zhao, J.; Wang, D. Fractal analysis and its impact factors on pore structure of artificial cores based on the images obtained using magnetic resonance imaging. J. Appl. Geophys. 2012, 86, 70–81. [Google Scholar] [CrossRef]
- Lopes, R.; Betrouni, N. Fractal and multifractal analysis: A review. Med. Image Anal. 2009, 13, 634–649. [Google Scholar] [CrossRef]
- Mandelbrot, B.B. Fractals: Form, Chance, and Dimension; W. H. Freeman: San Francisco, CA, USA, 1977; p. 365. ISBN 76057947. [Google Scholar]
- Gould, D.J.; Vadakkan, T.J.; PochÉ, R.A.; Dickinson, M.E. Multifractal and Lacunarity Analysis of Microvascular Morphology and Remodeling. Microcirculation 2011, 18, 136–151. [Google Scholar] [CrossRef]
- Radlinski, A.P.; Blach, T.; Vu, P.; Ji, Y.; de Campo, L.; Gilbert, E.P.; Regenauer-Lieb, K.; Mastalerz, M. Pore accessibility and trapping of methane in Marcellus Shale. Int. J. Coal Geol. 2021, 248, 103850. [Google Scholar] [CrossRef]
- Ghanizadeh, A.; Bhowmik, S.; Haeri-Ardakani, O.; Sanei, H.; Clarkson, C.R. A comparison of shale permeability coefficients derived using multiple non-steady-state measurement techniques: Examples from the Duvernay Formation, Alberta (Canada). Fuel 2015, 140, 371–387. [Google Scholar] [CrossRef]
- Muller, J. Characterization of pore space in chalk by multifractal analysis. J. Hydrol. 1996, 215–222. [Google Scholar] [CrossRef]
- Xie, S.; Cheng, Q.; Ling, Q.; Li, B.; Bao, Z.; Fan, P. Fractal and multifractal analysis of carbonate pore-scale digital images of petroleum reservoirs. Mar. Petrol. Geol. 2010, 27, 476–485. [Google Scholar] [CrossRef]
- Valenza, J.J.; Drenzek, N.; Marques, F.; Pagels, M.; Mastalerz, M. Geochemical controls on shale microstructure. Geology (Boulder) 2013, 41, 611–614. [Google Scholar] [CrossRef]
- Vernik, L.; Anantharamu, V. Estimating the elastic properties of mica and clay minerals. Geophysics 2020, 85, MR83–MR95. [Google Scholar] [CrossRef]
- Zou, J.; Rezaee, R.; Liu, K. Effect of Temperature on Methane Adsorption in Shale Gas Reservoirs. Energ. Fuel 2017, 31, 12081–12092. [Google Scholar] [CrossRef]
- Liu, K.; Ostadhassan, M.; Zhou, J.; Gentzis, T.; Rezaee, R. Nanoscale pore structure characterization of the Bakken shale in the USA. Fuel 2017, 209, 567–578. [Google Scholar] [CrossRef]
- Modica, C.J.; Lapierre, S.G. Estimation of kerogen porosity in source rocks as a function of thermal transformation: Example from the Mowry Shale in the Powder River Basin of Wyoming. Aapg Bull. 2012, 96, 87–108. [Google Scholar] [CrossRef]
- Wang, Y.; Qiu, N.; Borjigin, T.; Shen, B.; Xie, X.; Ma, Z.; Lu, C.; Yang, Y.; Yang, L.; Cheng, L.; et al. Integrated assessment of thermal maturity of the Upper Ordovician–Lower Silurian Wufeng–Longmaxi shale in Sichuan Basin, China. Mar. Petrol. Geol. 2019, 100, 447–465. [Google Scholar] [CrossRef]
- Wu, Y.; Liu, C.; Jiang, F.; Hu, T.; Lv, J.; Zhang, C.; Guo, X.; Huang, L.; Hu, M.; Huang, R.; et al. Geological characteristics and shale oil potential of alkaline lacustrine source rock in Fengcheng Formation of the Mahu Sag, Junggar Basin, Western China. J. Petrol. Sci. Eng. 2022, 216, 110823. [Google Scholar] [CrossRef]
- Xia, L.; Cao, J.; Stüeken, E.E.; Zhi, D.; Wang, T.; Li, W. Unsynchronized evolution of salinity and pH of a Permian alkaline lake influenced by hydrothermal fluids: A multi-proxy geochemical study. Chem. Geol. 2020, 541, 119581. [Google Scholar] [CrossRef]
- Yao, Y.; Liu, D.; Tang, D.; Tang, S.; Huang, W. Fractal characterization of adsorption-pores of coals from North China: An investigation on CH4 adsorption capacity of coals. Int. J. Coal Geol. 2008, 73, 27–42. [Google Scholar] [CrossRef]
- Yao, Y.; Liu, D.; Tang, D.; Tang, S.; Huang, W.; Liu, Z.; Che, Y. Fractal characterization of seepage-pores of coals from China: An investigation on permeability of coals. Comput. Geosci-Uk 2009, 35, 1159–1166. [Google Scholar] [CrossRef]
- Liu, B.; Mohammadi, M.; Ma, Z.; Bai, L.; Wang, L.; Xu, Y.; Ostadhassan, M.; Hemmati-Sarapardeh, A. Evolution of porosity in kerogen type I during hydrous and anhydrous pyrolysis: Experimental study, mechanistic understanding, and model development. Fuel 2023, 338, 127149. [Google Scholar] [CrossRef]
- Mastalerz, M.; Drobniak, A.; Stankiewicz, A.B. Origin, properties, and implications of solid bitumen in source-rock reservoirs: A review. Int. J. Coal Geol. 2018, 195, 14–36. [Google Scholar] [CrossRef]
- Bai, B.; Liang, J.; Dai, C.; He, W.; Bai, Y.; Chang, X.; Zheng, M.; Li, H.; Zong, H. Diagenesis of the Permian Fengcheng Formation in the Mahu Sag, Junggar Basin, China. Appl. Sci. 2023, 13, 13186. [Google Scholar] [CrossRef]
- Tang, Y.; Lv, Z.; He, W.; Qing, Y.; Song, X.; Cao, Q.; Qian, Y.; Zhu, T.; Li, N.; Li, X. Characteristics and Genesis of Alkaline Lacustrine Tight Oil Reservoirs in the Permian Fengcheng Formation in the Mahu Sag, Junggar Basin, NW China. Minerals 2022, 12, 979. [Google Scholar] [CrossRef]
- Yang, Z.; Tang, Y.; Guo, X.; Huang, L.; Chang, Q. Diagenesis and reservoir space types of alkaline lake-type shale in Fengcheng Formation of Mahu Sag, Junggar Basin, China. Arabian J. Geosci. 2021, 14. [Google Scholar] [CrossRef]
- He, D.; Wu, S.; Zhao, L.; Zheng, M.; Li, D.; Lu, Y. Tectono-Depositional Setting and lts Evolution during Permian to Triassic around Mahu Sag, Junggar Basin. Xinjiang Petrol. Geol. 2018, 39, 35–47, (Chinese in English abstract). [Google Scholar]
- Zhang, H.; Zhang, Z.; Wang, Z.; Wang, Y.; Yang, R.; Zhu, T.; Luo, F.; Liu, K. Using Fractal Theory to Study the Influence of Movable Oil on the Pore Structure of Different Types of Shale: A Case Study of the Fengcheng Formation Shale in Well X of Mahu Sag, Junggar Basin, China. Fractal Fract. 2024, 8, 242, (Chinese in English abstract). [Google Scholar] [CrossRef]
- Tang, Y.; Cao, J.; He, W.; Guo, X.; Zhao, K.; Li, W. Discovery of shale oil in alkaline lacustrine basins: The Late Paleozoic Fengcheng Formation, Mahu Sag, Junggar Basin, China. Petrol. Sci. 2021, 18, 1281–1293. [Google Scholar] [CrossRef]
- Cao, J.; Xia, L.; Wang, T.; Zhi, D.; Tang, Y.; Li, W. An alkaline lake in the Late Paleozoic Ice Age (LPIA): A review and new insights into paleoenvironment and petroleum geology. Earth-Sci. Rev. 2020, 202, 103091. [Google Scholar] [CrossRef]
- Cao, J.; Lei, D.; Li, Y.; Tang, Y.; Abulimiti; Chang, Q.; Wang, T. Ancient high-guality alkaline lacustrine source rocks discovered in the Lower Permian Fengcheng Formation, Junggar Basin. Acta Petrol. Sin. 2015, 36, 781–790, (Chinese in English abstract). [Google Scholar] [CrossRef]
- Zhu, X.; Cai, J.; Liu, Q.; Li, Z.; Zhang, X. Thresholds of petroleum content and pore diameter for petroleum mobility in shale. Aapg Bull. 2019, 103, 605–617. [Google Scholar] [CrossRef]
- Tao, K.; Cao, J.; Chen, X.; Nueraili, Z.; Hu, W.; Shi, C. Deep hydrocarbons in the northwestern Junggar Basin (NW China): Geochemistry, origin, and implications for the oil vs. gas generation potential of post-mature saline lacustrine source rocks. Mar. Petrol. Geol. 2019, 109, 623–640. [Google Scholar] [CrossRef]
- Zou, C.; Jin, X.; Zhu, R.; Gong, G.; Sun, L.; Dai, J.; Meng, D.; Wang, X.; Li, J.; Wu, S.; et al. Do Shale Pore Throats Have a Threshold Diameter for Oil Storage? Sci. Rep-Uk 2015, 5. [Google Scholar] [CrossRef]
- Jin, Z.; Liang, X.; Wang, X.; Zhu, R.; Zhang, Y.; Liu, G.; Gao, J. Shale Oil Enrichment Mechanism and sweet Spot Selection of Fengcheng Formation in Mahu Sag, Junggar Basin. Xinjiang Petrol. Geol. 2022, 43, 631–639, (Chinese in English abstract). [Google Scholar] [CrossRef]
- Liu, K.; Ostadhassan, M. Quantification of the microstructures of Bakken shale reservoirs using multi-fractal and lacunarity analysis. J. Nat. Gas. Sci. Eng. 2017, 39, 62–71. [Google Scholar] [CrossRef]
- Sing, K.S.W.; Everett, D.H.; Haul, R.A.W.; Moscou, L.; Pierotti, R.A.; Rouquerol, J.; Siemieniewska, T. Reporting Physisorption Data for Gas/Solid Systems with Special Reference to the Determination of Surface Area and Porosity. Pure Appl. Chem. 1985, 57, 603–619. [Google Scholar] [CrossRef]
- Halsey, T.C.; Jensen, M.H.; Kadanoff, L.P.; Procaccia, I.I.; Shraiman, B.I. Fractal measures and their singularities: The characterization of strange sets. Phys. Rev. A Gen. Phys. 1986, 33, 1141–1151. [Google Scholar] [CrossRef] [PubMed]
- Liu, S.; Zhang, R. Anisotropic pore structure of shale and gas injection-induced nanopore alteration: A small-angle neutron scattering study. Int. J. Coal Geol. 2020, 219, 103384. [Google Scholar] [CrossRef]
- Guan, M.; Liu, X.; Jin, Z.; Lai, J.; Sun, B.; Zhang, P.; Chen, K. The evolution of pore structure heterogeneity during thermal maturation in lacustrine shale pyrolysis. J. Anal. Appl. Pyrol. 2022, 163, 105501. [Google Scholar] [CrossRef]
- Fishcher, P.; Smith, W.R. Chaos, Fractals, and Dynamics; M. Dekker: New York, NY, USA, 1985; p. 261. ISBN 85004526. [Google Scholar]
- Chhabra, A.; Jensen, R.V. Direct determination of the f(α) singularity spectrum. Phys. Rev. Lett. 1989, 62, 1327–1330. [Google Scholar] [CrossRef]
- Klein, G.D. Geothermometry: Thermal history of sedimentary basins. Science 1989, 243, 1619. [Google Scholar] [CrossRef]
- Sing, K. The Use of Nitrogen Adsorption for the Characterisation of Porous Materials; Elsevier B.V.: Amsterdam, The Netherlands, 2001; Volume 187, pp. 3–9. [Google Scholar]
- Bakshi, T.; Vishal, V. A Review on the Role of Organic Matter in Gas Adsorption in Shale. Energ. Fuel 2021, 35, 15249–15264. [Google Scholar] [CrossRef]
- Lewan, M.D.; Roy, S. Role of water in hydrocarbon generation from Type-I kerogen in Mahogany oil shale of the Green River Formation. Org. Geochem. 2011, 42, 31–41. [Google Scholar] [CrossRef]
- Spigolon, A.L.D.; Lewan, M.D.; de Barros Penteado, H.L.; Coutinho, L.F.C.; Mendonça Filho, J.G. Evaluation of the petroleum composition and quality with increasing thermal maturity as simulated by hydrous pyrolysis: A case study using a Brazilian source rock with Type I kerogen. Org. Geochem. 2015, 83–84, 27–53. [Google Scholar] [CrossRef]
- Sun, L.; Tuo, J.; Zhang, M.; Wu, C.; Wang, Z.; Zheng, Y. Formation and development of the pore structure in Chang 7 member oil-shale from Ordos Basin during organic matter evolution induced by hydrous pyrolysis. Fuel 2015, 158, 549–557. [Google Scholar] [CrossRef]
- Yang, R.; He, S.; Hu, Q.; Sun, M.; Hu, D.; Yi, J. Applying SANS technique to characterize nano-scale pore structure of Longmaxi shale, Sichuan Basin (China). Fuel 2017, 197, 91–99. [Google Scholar] [CrossRef]
- Xiong, F.; Jiang, Z.; Li, P.; Wang, X.; Bi, H.; Li, Y.; Wang, Z.; Amooie, M.A.; Soltanian, M.R.; Moortgat, J. Pore structure of transitional shales in the Ordos Basin, NW China: Effects of composition on gas storage capacity. Fuel 2017, 206, 504–515. [Google Scholar] [CrossRef]
- Xu, S.; Xia, Y.; Lu, M.; Wei, W.; Wang, L.; Cai, J. Fractal Perspective on the Effects of the Acid–Rock Interaction on the Shale Pore Structure. Energ. Fuel 2023, 37, 6610–6618. [Google Scholar] [CrossRef]
- Zhang, J.; Xiao, X.; Wang, J.; Lin, W.; Han, D.; Wang, C.; Li, Y.; Xiong, Y.; Zhang, X. Pore structure and fractal characteristics of coal-bearing Cretaceous Nenjiang shales from Songliao Basin, Northeast China. J. Nat. Gas. Geosci. 2024. [Google Scholar] [CrossRef]
- Fan, Y.; Liu, K.; Yu, L.; Liu, J.; Regenauer-Lieb, K. Assessment of multi-scale pore structures and pore connectivity domains of marine shales by fractal dimensions and correlation lengths. Fuel 2022, 330, 125463. [Google Scholar] [CrossRef]
- Song, W.; Liu, X.; Berto, F.; Razavi, N. Low-Cycle Fatigue Behavior of 10CrNi3MoV High Strength Steel and Its Undermatched Welds. Materials 2018, 11, 661. [Google Scholar] [CrossRef]
- Zhang, P.; Lee, Y.I.; Zhang, J. A review of high-resolution X-ray computed tomography applied to petroleum geology and a case study. Micron 2019, 124, 102702. [Google Scholar] [CrossRef]
- Ferreiro, J.P.; Wilson, M.; Vázquez, E.V. Multifractal Description of Nitrogen Adsorption Isotherms. Vadose Zone J. 2009, 8, 209–219. [Google Scholar] [CrossRef]
- Tian, S.; Guo, Y.; Dong, Z.; Li, Z. Pore Microstructure and Multifractal Characterization of Lacustrine Oil-Prone Shale Using High-Resolution SEM: A Case Sample from Natural Qingshankou Shale. Fractal Fract. 2022, 6, 675. [Google Scholar] [CrossRef]
- Guan, M.; Liu, X.; Jin, Z.; Lai, J. The heterogeneity of pore structure in lacustrine shales: Insights from multifractal analysis using N2 adsorption and mercury intrusion. Mar. Petrol. Geol. 2020, 114, 104150. [Google Scholar] [CrossRef]
- Song, Z.; Liu, G.; Yang, W.; Zou, H.; Sun, M.; Wang, X. Multi-fractal distribution analysis for pore structure characterization of tight sandstone—A case study of the Upper Paleozoic tight formations in the Longdong District, Ordos Basin. Mar. Petrol. Geol. 2018, 92, 842–854. [Google Scholar] [CrossRef]
- Liu, K.; Ostadhassan, M.; Hackley, P.C.; Gentzis, T.; Zou, J.; Yuan, Y.; Carvajal-Ortiz, H.; Rezaee, R.; Bubach, B. Experimental Study on the Impact of Thermal Maturity on Shale Microstructures Using Hydrous Pyrolysis. Energ. Fuel 2019, 33, 9702–9719. [Google Scholar] [CrossRef]
- Li, W.; Zhang, Y.; Ni, M.; Tang, W. Genesis of akaline lacustrine deposits in the Lower Permian FengchengFomation of the Mahu sag, northwestemn jungar Basin: Insights froma comparison with the worldwid alkaline lacustrine deposites. Acta Geol. Sin. 2020, 94, 1839–1852, (Chinese in English abstract). [Google Scholar] [CrossRef]
- Zhang, Z.; Qin, J.; Ba, Z.; Huang, W.; Han, M.; Gao, Y.; Wu, D. Diagenetic facies of the Fengcheng Formation tight reservoir in the alkaline lake sedimentary environment, the southern margin of Mahu Sag, Junggar Basin. Nat. Gas. Geosci. 2024. (Chinese in English abstract). [Google Scholar] [CrossRef]
- Hellmann, R. The albite-water system: Part II. The time-evolution of the stoichiometry of dissolution as a function of pH at 100,200, and 300 °C. Geochim. Cosmochim. Ac 1995, 59, 1669–1697. [Google Scholar] [CrossRef]
- Hamilton, J.P.; Pantano, C.G.; Brantley, S.L. Dissolution of albite glass and crystal. Geochim. Cosmochim. Ac 2000, 64, 2603–2615. [Google Scholar] [CrossRef]
- Wolery, K.G.K.A. The dissolution kinetics of quartz as a function of pH aud time at 70 °C. Geochim. Cosmochim. Ac 1988, 52, 43–53. [Google Scholar]
- Liu, B.; Wang, Y.; Tian, S.; Guo, Y.; Wang, L.; Yasin, Q.; Yang, J. Impact of thermal maturity on the diagenesis and porosity of lacustrine oil-prone shales: Insights from natural shale samples with thermal maturation in the oil generation window. Int. J. Coal Geol. 2022, 261, 104079. [Google Scholar] [CrossRef]
- Zhang, Y.; Li, W.; Tang, W. Tectonic Setting and Environment of Alkaline Lacustrine Source Rocks in the Lower Permian Fengcheng Formation of Mahu Sag. Xinjiang Petrol. Geol. 2018, 39, 48–54, (Chinese in English abstract). [Google Scholar] [CrossRef]
- Fenter, P.; Sturchio, N.C. Mineral–water interfacial structures revealed by synchrotron X-ray scattering. Prog. Surf. Sci. 2004, 77, 171–258. [Google Scholar] [CrossRef]
- Knight, A.W.; Kalugin, N.G.; Coker, E.; Ilgen, A.G. Water properties under nano-scale confinement. Sci. Rep-Uk 2019, 9. [Google Scholar] [CrossRef] [PubMed]
- Hellmann, R.; Cotte, S.; Cadel, E.; Malladi, S.; Karlsson, L.S.; Lozano-Perez, S.; Cabie, M.; Seyeux, A. Nanometre-scale evidence for interfacial dissolution-reprecipitation control of silicate glass corrosion. Nat. Mater. 2015, 14, 307–311. [Google Scholar] [CrossRef] [PubMed]
- Fenter, P.; Lee, S.S.; Park, C.; Catalano, J.G.; Zhang, Z.; Sturchio, N.C. Probing interfacial reactions with X-ray reflectivity and X-ray reflection interface microscopy: Influence of NaCl on the dissolution of orthoclase at pOH 2 and 85 °C. Geochim. Cosmochim. Ac 2010, 74, 3396–3411. [Google Scholar] [CrossRef]
- Ruiz-Agudo, E.; Putnis, C.V.; Rodriguez-Navarro, C.; Putnis, A. Mechanism of leached layer formation during chemical weathering of silicate minerals. Geology (Boulder) 2012, 40, 947–950. [Google Scholar] [CrossRef]
- Hellmann, R.; Wirth, R.; Daval, D.; Barnes, J.; Penisson, J.; Tisserand, D.; Epicier, T.; Florin, B.; Hervig, R.L. Unifying natural and laboratory chemical weathering with interfacial dissolution–reprecipitation: A study based on the nanometer-scale chemistry of fluid–silicate interfaces. Chem. Geol. 2012, 294–295, 203–216. [Google Scholar] [CrossRef]
- Valentine, B.J.; Hackley, P.C.; Hatcherian, J.J. Hydrous pyrolysis of New Albany Shale: A study examining maturation changes and porosity development. Mar. Petrol. Geol. 2021, 134, 105368. [Google Scholar] [CrossRef]
- Huang, H.; Chen, L.; Sun, W.; Xiong, F.; Ji, W.; Jia, J.; Tang, X.; Zhang, S.; Gao, J.; Luo, B. Pore-Throat Structure And Fractal Characteristics Of Shihezi Formation Tight Gas Sandstone In The Ordos Basin, China. Fractals 2018, 26, 1840005. [Google Scholar] [CrossRef]
- Dong, X.; Meng, X.; Pu, R. Impacts of mineralogy and pore throat structure on the movable fluid of tight sandstone gas reservoirs in coal measure strata: A case study of the Shanxi formation along the southeastern margin of the Ordos Basin. J. Petrol. Sci. Eng. 2023, 220, 111257. [Google Scholar] [CrossRef]
- Putnis, A. Mineral Replacement Reactions. Rev. Mineral. Geochem. 2009, 70, 87–124. [Google Scholar] [CrossRef]
- Mondal, S.; Upadhyay, D.; Banerjee, A. The origin of rapakivi feldspar by a fluid-induced coupled dissolution-reprecipitation process. J. Petrol. 2017, 58, 1393–1418. [Google Scholar] [CrossRef]
- Li Yongli, H.F.G.W. Experimental Study of Dissolution-Alteration of Amphibole in a Hydrothermal Environment. Acta Geol. Sin. 2019, 93, 1933–1946. [Google Scholar]
- Wang, M.; Zhang, Z.; Zhou, C.; Yuan, X.; Lin, M.; Liu, Y.; Cheng, D. Lithological characteristics and origin of alkaline lacustrine of the Lower Permian Fengcheng Formation in Mahu Sag, Junggar Basin. J. Palaeogeo. 2018, 20, 147–162, (Chinese in English abstract). [Google Scholar] [CrossRef]
- Savage, D.; Benbow, S.; Watson, C.; Takase, H.; Ono, K.; Oda, C.; Honda, A. Natural systems evidence for the alteration of clay under alkaline conditions: An example from Searles Lake, California. Appl. Clay Sci. 2010, 47, 72–81. [Google Scholar] [CrossRef]
- Hay, R.L.; Guldman, S.G.; Matthews, J.C.; Lander, R.H.; Duffin, M.E.; Kyser, T.K. Clay Mineral Diagenesis in Core KM-3 of Searles Lake, California. Clay Clay Miner. 1991, 39, 84–96. [Google Scholar] [CrossRef]
- Chalmers, G.R.L.; Bustin, R.M. Geological evaluation of Halfway–Doig–Montney hybrid gas shale–tight gas reservoir, northeastern British Columbia. Mar. Petrol. Geol. 2012, 38, 53–72. [Google Scholar] [CrossRef]
Disclaimer/Publisher’s Note: The statements, opinions and data contained in all publications are solely those of the individual author(s) and contributor(s) and not of MDPI and/or the editor(s). MDPI and/or the editor(s) disclaim responsibility for any injury to people or property resulting from any ideas, methods, instructions or products referred to in the content. |
© 2024 by the authors. Licensee MDPI, Basel, Switzerland. This article is an open access article distributed under the terms and conditions of the Creative Commons Attribution (CC BY) license (https://creativecommons.org/licenses/by/4.0/).