Article

Correlation between Agglomerates Hausdorff Dimension and Mechanical Properties of Denture Poly(methyl methacrylate)-Based Composites

1
Faculty of Technology and Metallurgy, University of Belgrade, 11000 Belgrade, Serbia
2
ISEL—Instituto Superior de Engenharia de Lisboa, Aplicações Fundamentais e Investigação Operacional, 1749-016 Lisbon, Portugal
3
CMAFcIO—Centro de Matemática, Aplicações Fundamentais e Investigação Operacional, 1749-016 Lisbon, Portugal
4
Center for Microelectronic Technologies, Institute of Chemistry, Technology and Metallurgy—National Institute of the Republic of Serbia, University of Belgrade, 11000 Belgrade, Serbia
5
Department of Physical Chemistry, “Vinča” Institute of Nuclear Sciences—National Institute of the Republic of Serbia, University of Belgrade, Mike Petrovića Alasa 12-14, P.O. Box 522, 11001 Belgrade, Serbia
*
Author to whom correspondence should be addressed.
Fractal Fract. 2024, 8(6), 314; https://doi.org/10.3390/fractalfract8060314
Submission received: 16 March 2024 / Revised: 18 May 2024 / Accepted: 23 May 2024 / Published: 26 May 2024

Abstract

:
The microstructure–property relationship in poly(methyl methacrylate) PMMA composites is very important for understanding interface phenomena and the future prediction of properties that further help in designing improved materials. In this research, field emission scanning electron microscopy (FESEM) images of denture PMMA composites with SrTiO3, MnO2 and SrTiO3/MnO2 were used for fractal reconstructions of particle agglomerates in the polymer matrix. Fractal analysis represents a valuable mathematical tool for the characterization of the microstructure and finding correlation between microstructural features and mechanical properties. Utilizing the mathematical affine fractal regression model, the Fractal Real Finder software was employed to reconstruct agglomerate shapes and estimate the Hausdorff dimensions (HD). Controlled energy impact and tensile tests were used to evaluate the mechanical performance of PMMA-MnO2, PMMA-SrTiO3 and PMMA-SrTiO3/MnO2 composites. It was determined that PMMA-SrTiO3/MnO2 had the highest total absorbed energy value (Etot), corresponding to the lowest HD value of 1.03637 calculated for SrTiO3/MnO2 agglomerates. On the other hand, the highest HD value of 1.21521 was calculated for MnO2 agglomerates, while the PMMA-MnO2 showed the lowest Etot. The linear correlation between the total absorbed impact energy of composites and the HD of the corresponding agglomerates was determined, with an R2 value of 0.99486, showing the potential use of this approach in the optimization of composite materials’ microstructure–property relationship.

1. Introduction

Fractals are geometric shapes that exhibit self-similarity at different scales and are present in nature, from blood vessels to rock minerals [1]. In the context of composites, fractal analysis provides insights into their microstructures, helping to understand how their components are arranged and how they contribute to the composite’s properties. One common application of fractal analysis in composites is quantifying their roughness or irregularity [2]. The fractal dimension is a measure of shape irregularity, with higher values indicating more complex and rough surfaces. For composites, this can be useful in understanding the distribution of filler particles or the interface between the filler and matrix, which can affect mechanical properties like the strength and toughness [3,4,5]. Fractal theory can also be applied to study the fracture in viscoelastic materials [6]. Fracture surfaces often exhibit complex patterns, and fractal analysis can quantify the roughness and complexity of these surfaces. This information can provide insights into the mechanisms of fracture and how energy is dissipated during failure. Overall, fractal characterization offers a powerful tool for understanding the structure–property relationships in composite materials, providing valuable information for their design and optimization.
Materials with self-similar hierarchical structures have diverse applications in engineering, including absorbing structures, acoustic and electromagnetic metamaterials, and composite structures. Fractal networks have been used by Zhang et al. to design stretchable flexible electronics, meeting the demand for functional electronics with large coverage areas [7]. Yaman et al. examined the electrical conductivity and mechanical properties of copper-powder-filled unsaturated polyester resin using micro-images and fractal dimension characterization [8]. They investigated the effects of the copper filler concentration in the polyester matrix on the electrical conductivity, material hardness, stiffness, and tensile properties of the composite. An increase in the filler concentration led to the spatial pattern of the conductive chain formed in the matrix medium being more complex. The agglomeration of particles also influenced the fractal dimension, with agglomerated structures exhibiting better electrical conductivity than uniform structures. Ji et al. applied fractal theory in connecting the fracture toughness with micromorphology [9]. Gurbuz et al. presented a study on the impact of shape memory alloy (SMA) fibers on the microstructure and mechanical properties of polyvinyl alcohol (PVA) fiber-reinforced engineered cementitious composites (ECCs) [10]. They performed the fractal analysis of surface cracks, including evaluating the fractal dimension with a fracture energy calculation. Recently, the correlation between the fracture toughness and fractal dimension increment in two dental glass-ceramics, varying in crystal volume fraction and fracture surface roughness, was determined by Jodha et al. [11]. Fractal analysis is increasingly prominent in characterizing composite materials, particularly in developing models for various mechanical properties. However, existing models typically consider the entire composite fracture or plane surface when determining the fractal dimension. There is a growing interest in reconstructing the reinforcement alone to better understand and predict the composite’s behavior based on its specific shape and size. Field emission scanning electron microscopy (FESEM) images provide a valuable microstructural basis for conducting fractal analysis.
Poly(methyl methacrylate) (PMMA) is the most widely used polymer in denture applications due to its favorable esthetic, mechanical and chemical properties [12]. However, PMMA is susceptible to failure caused by everyday use [13]. Therefore, the reinforcement of PMMA has become a necessity in order to expand its life service and broaden the conditions of its application. Over the years, various fillers have been investigated regarding their ability to increase hardness, flexural and impact properties [14,15,16]. The reinforcement of PMMA with micro- and nanoparticles has resulted in a wide variety of composites with improved mechanical performance, as well as other functional properties. The microstructure–mechanical behavior relationship is crucial in the prediction and design of composites with improved mechanical properties [17].
In this research, PMMA composites with SrTiO3, MnO2 and SrTiO3/MnO2 nanoparticles were investigated. The fractal reconstruction method presented here involves the shape reconstruction of nanoparticle agglomerates in a polymer matrix. The Hausdorff dimension, a fundamental measure of fractal objects, is estimated using fractal coefficients, often referred to as vertical or contraction factors. While previous research has focused on assessing the Hausdorff dimension and occasionally evaluating vertical factors, a complete characterization of the fractal structure has been lacking. This study introduces an approach to the fractal reconstruction of agglomerates based on the mathematical affine fractal regression model. By applying this method to agglomerates of different ceramic particles in a polymer matrix, we have demonstrated how the Hausdorff dimension can be correlated with mechanical properties. This approach holds significant potential for predicting material properties based on fractal characteristics.

2. Materials and Methods

2.1. Materials

SrTiO3 (nanopowder, <100 nm particle size, 99% trace metals basis, St. Louis, MO, USA) and MnO2 (powder, ≥99%, St. Louis, MO, USA) were used as reinforcements, as well as for the preparation of hybrid nanoparticles. Two-component PMMA (AKRILAT, Serbia) was used as a matrix material.

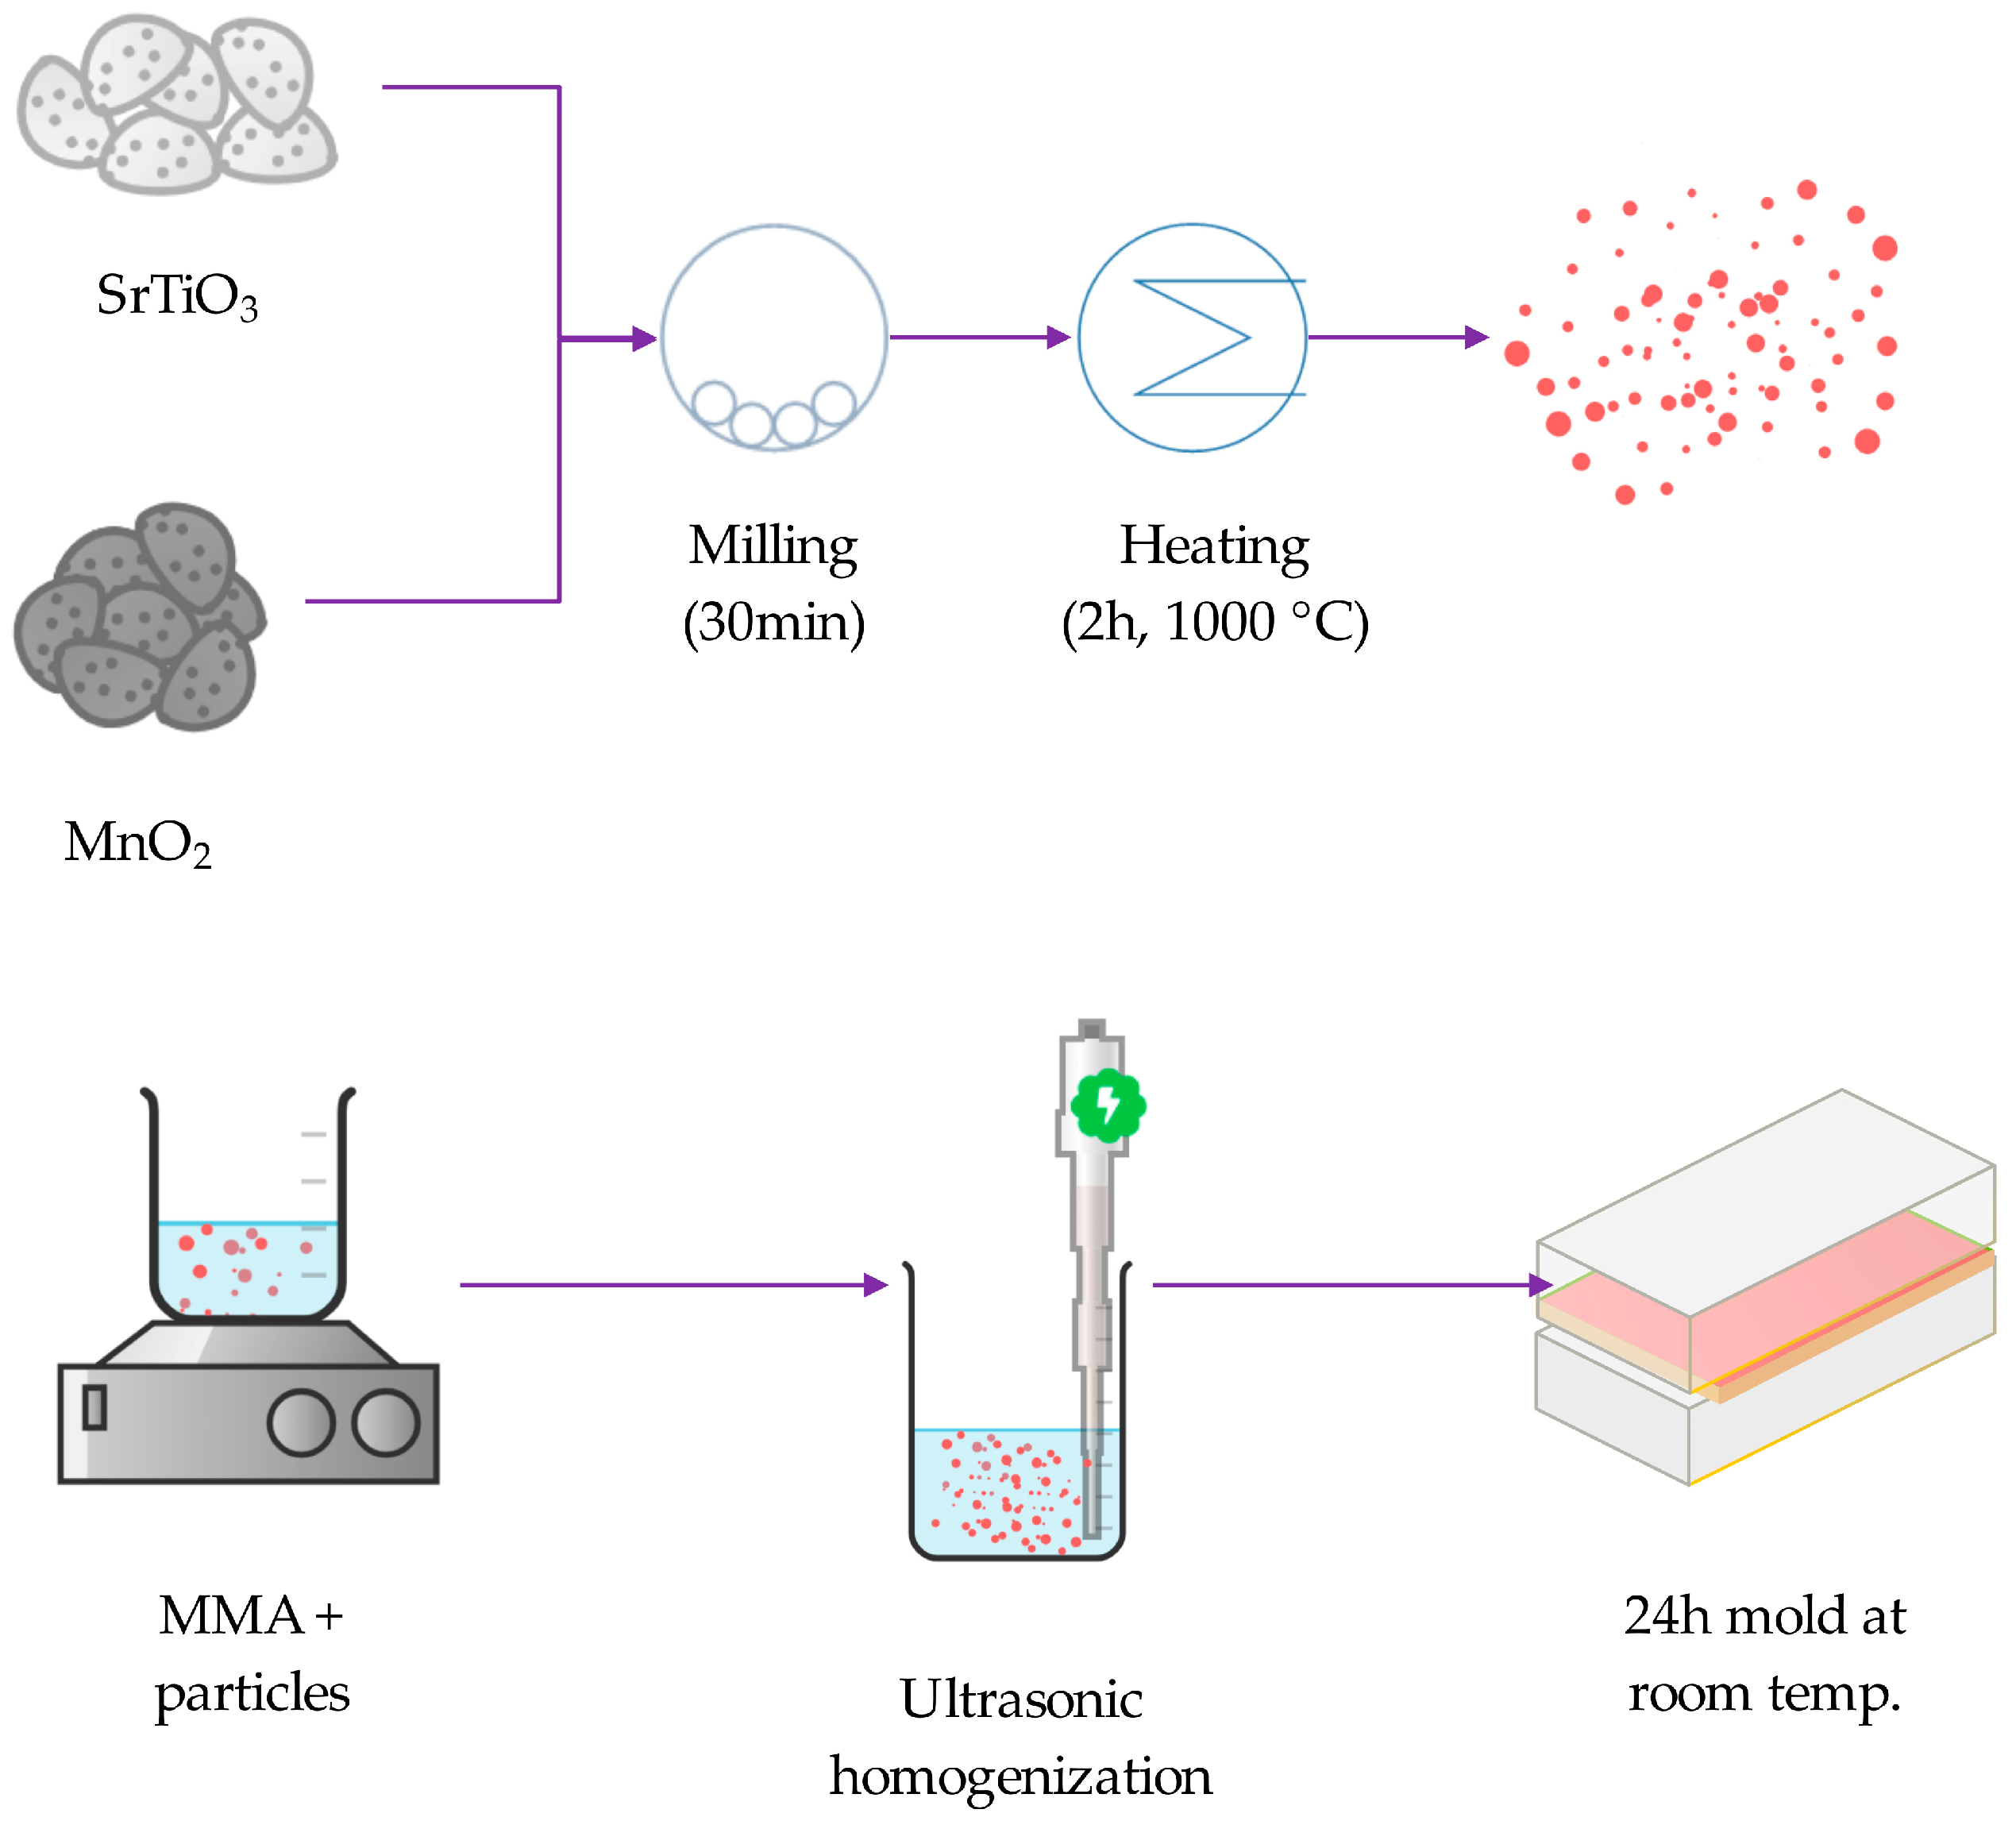
2.2. Processing of Composite Materials

SrTiO3, MnO2 and SrTiO3/MnO2 were incorporated into a dental PMMA matrix. SrTiO3/MnO2 nanoparticles were prepared by the previously published procedure, with a particle concentration of 1 wt% in all composites [18]. The scheme presented in Figure 1 shows the experimental procedure for composite preparation. The composite samples were labeled as follows: PMMA-SrTiO3, PMMA-MnO2 and PMMA-SrTiO3/MnO2.

2.3. Characterization of Samples

To analyze the morphology of the samples, we employed field emission scanning electron microscopy (FESEM) using Tescan Mira 3 instruments from Brno, Czech Republic, with gold sputtering performed prior to imaging. The particle size analysis was conducted by examining three FESEM images using Image-Pro Plus 6.0 software from Rockville, Maryland, USA. The tensile tests of the composites were conducted using a texture analyzer Shimadzu EZ Test LX in accordance with the ISO 527-2 standard for plastics, with a 500 N load cell and a strain rate of 10 mm/min [19]. The cross-sectional area and gauge length were measured before each test, and all measurements were conducted at room temperature. For high-speed puncture impact testing, we used the HYDROSHOT HITS-P10 machine from Shimadzu, Kyoto, Japan, to investigate the influence of nanoparticles on the impact resistance of PMMA. The total absorbed energy Etot value was automatically calculated from the load-time diagram. The striker had a diameter of 12.7 mm with a hemispherical head, and the impact force was set to 10 kN, with the impact velocity and depth set at 0.15 m/s and 1 mm, respectively. Fractal analysis was performed using Fractal Real Finder software on FESEM images of different composites, following the methodology used in our previously published research [20].

3. Results and Discussion

3.1. FESEM Analysis of Composites

The fracture site morphology was analyzed using the FESEM images shown in Figure 2. The presence of particles in composites significantly impacts their mechanical properties, particularly at the fracture site. Polymerization processes lead to various changes at the interface between particles and polymers, which further influence mechanical properties such as the toughness and elasticity.
As can be seen, the shape and size of the agglomerates in PMMA- SrTiO3, PMMA-MnO2 and SrTiO3/MnO2 vary, with different toughening mechanisms observed at the fracture surface. In our previous research, it was shown that the synergy between SrTiO3 and MnO2 resulted in an improved mechanical performance compared to both the pure PMMA and PMMA-SrTiO3 composite [18]. This was a consequence of the reduced agglomeration and better distribution of ceramic particles within the polymer matrix. In this study, the influence of the agglomerate shape on mechanical properties was investigated using FESEM analysis.

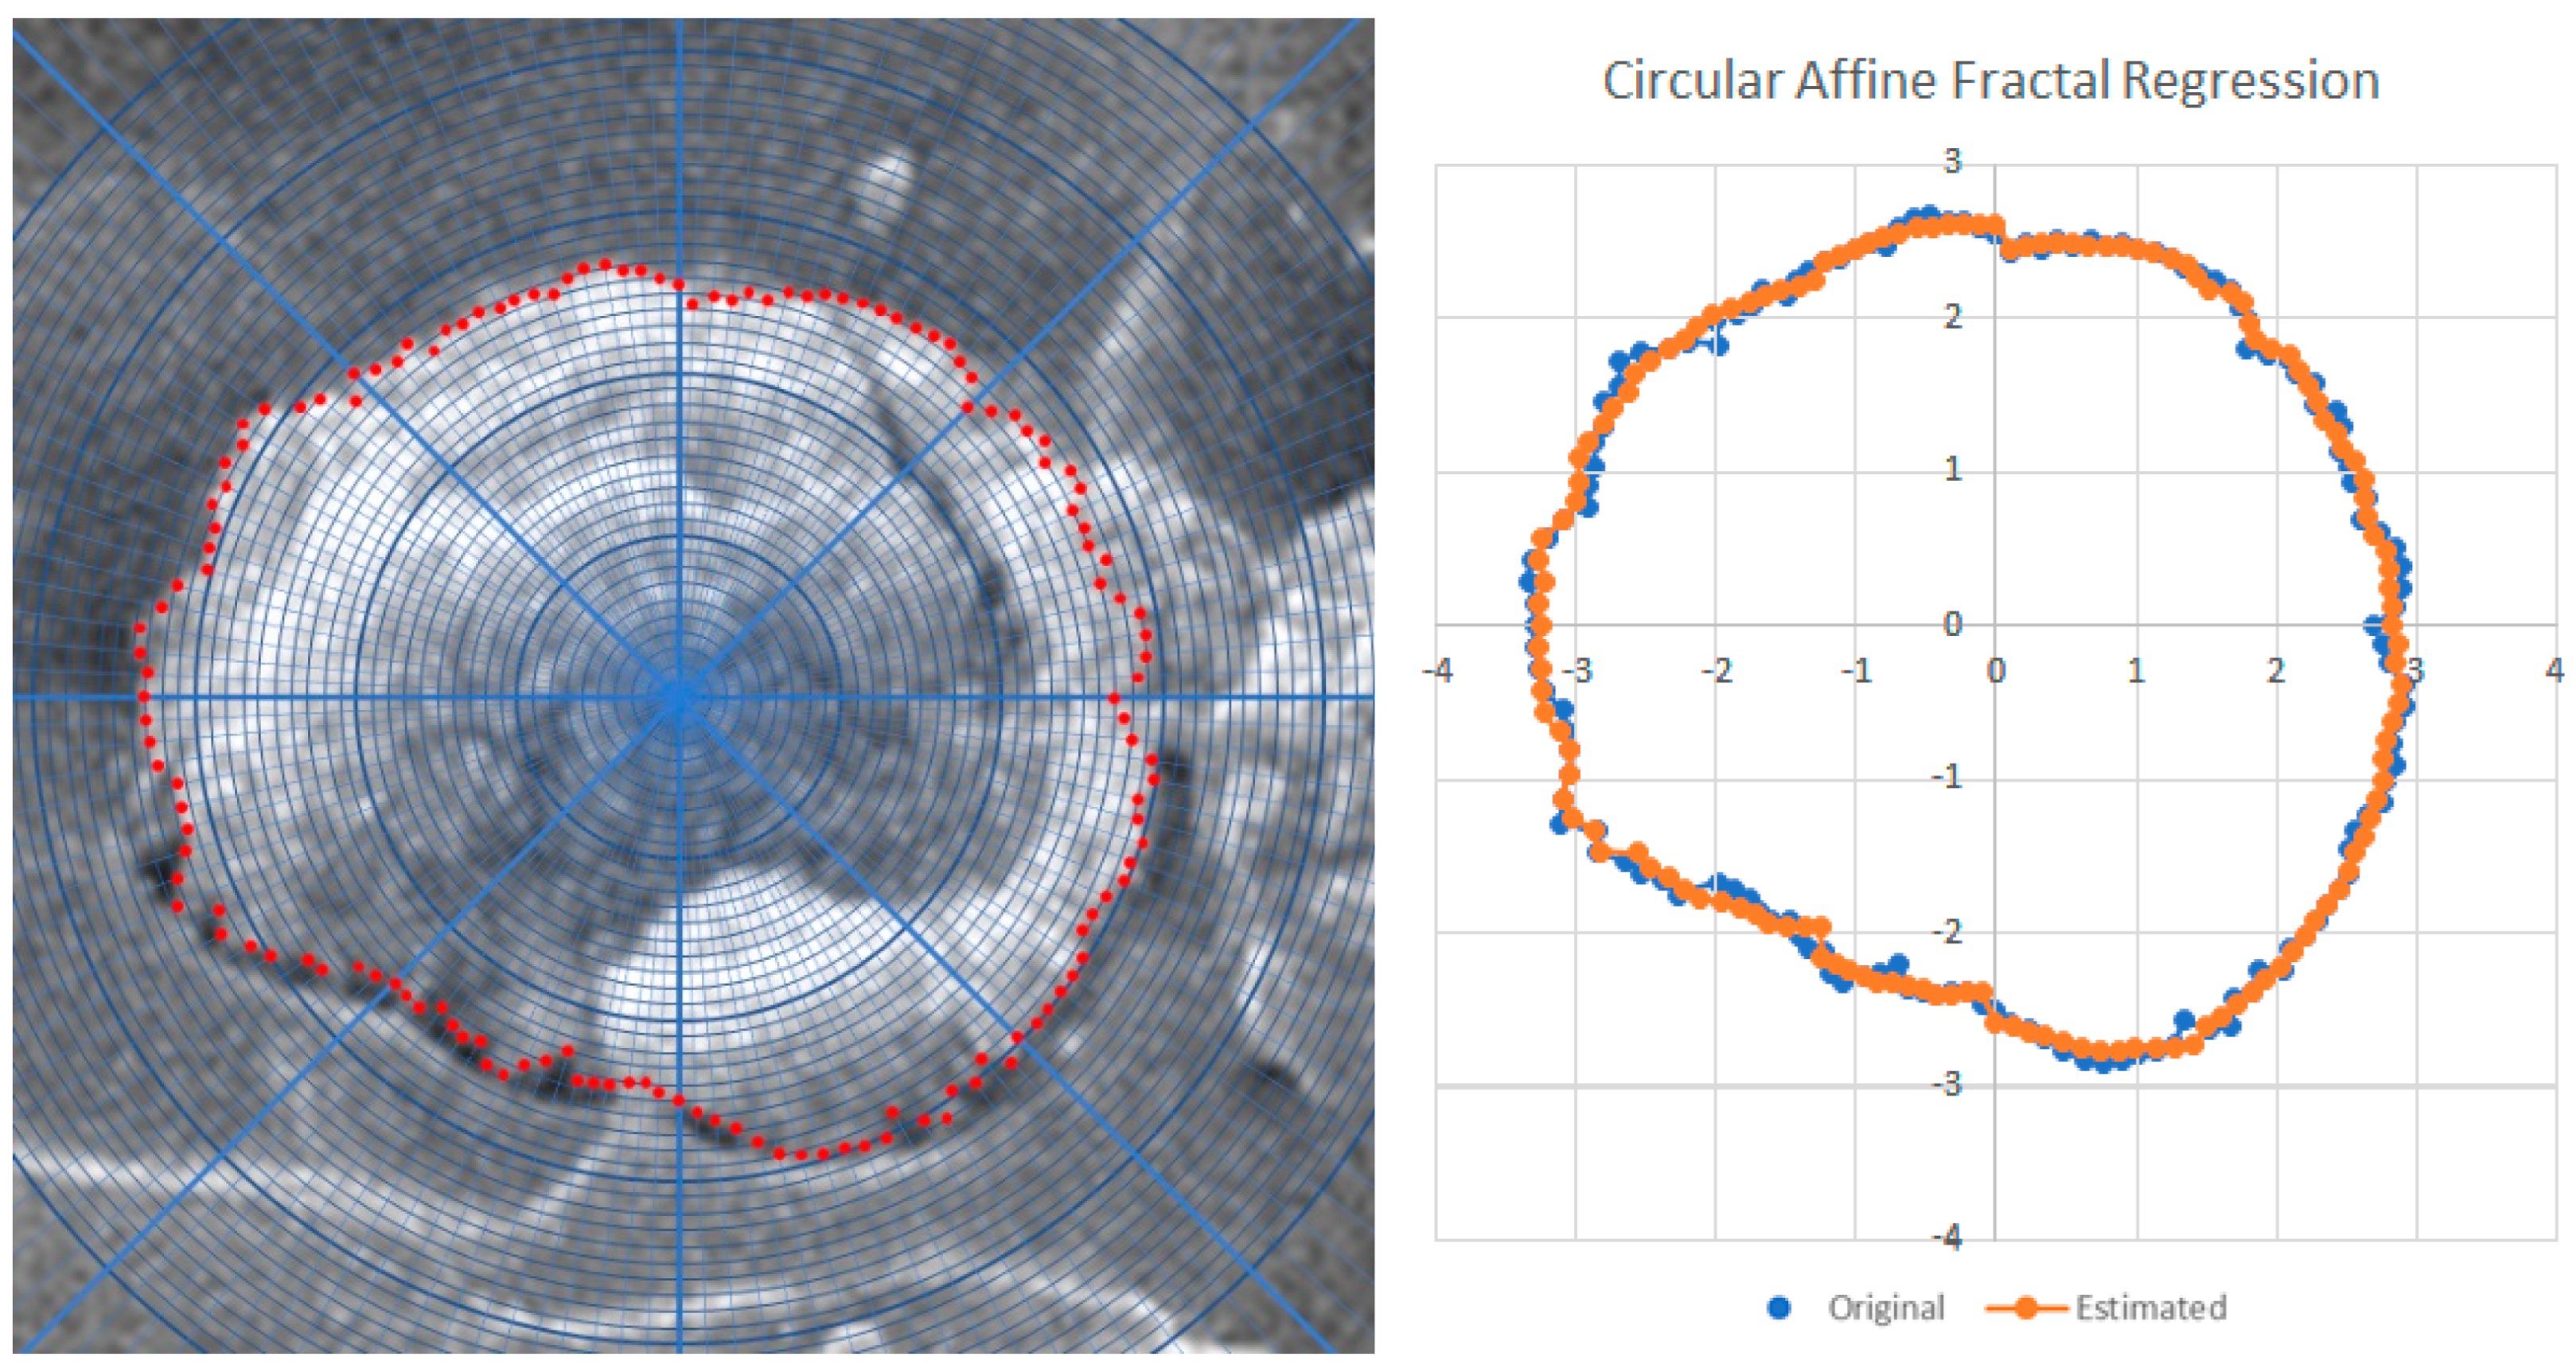
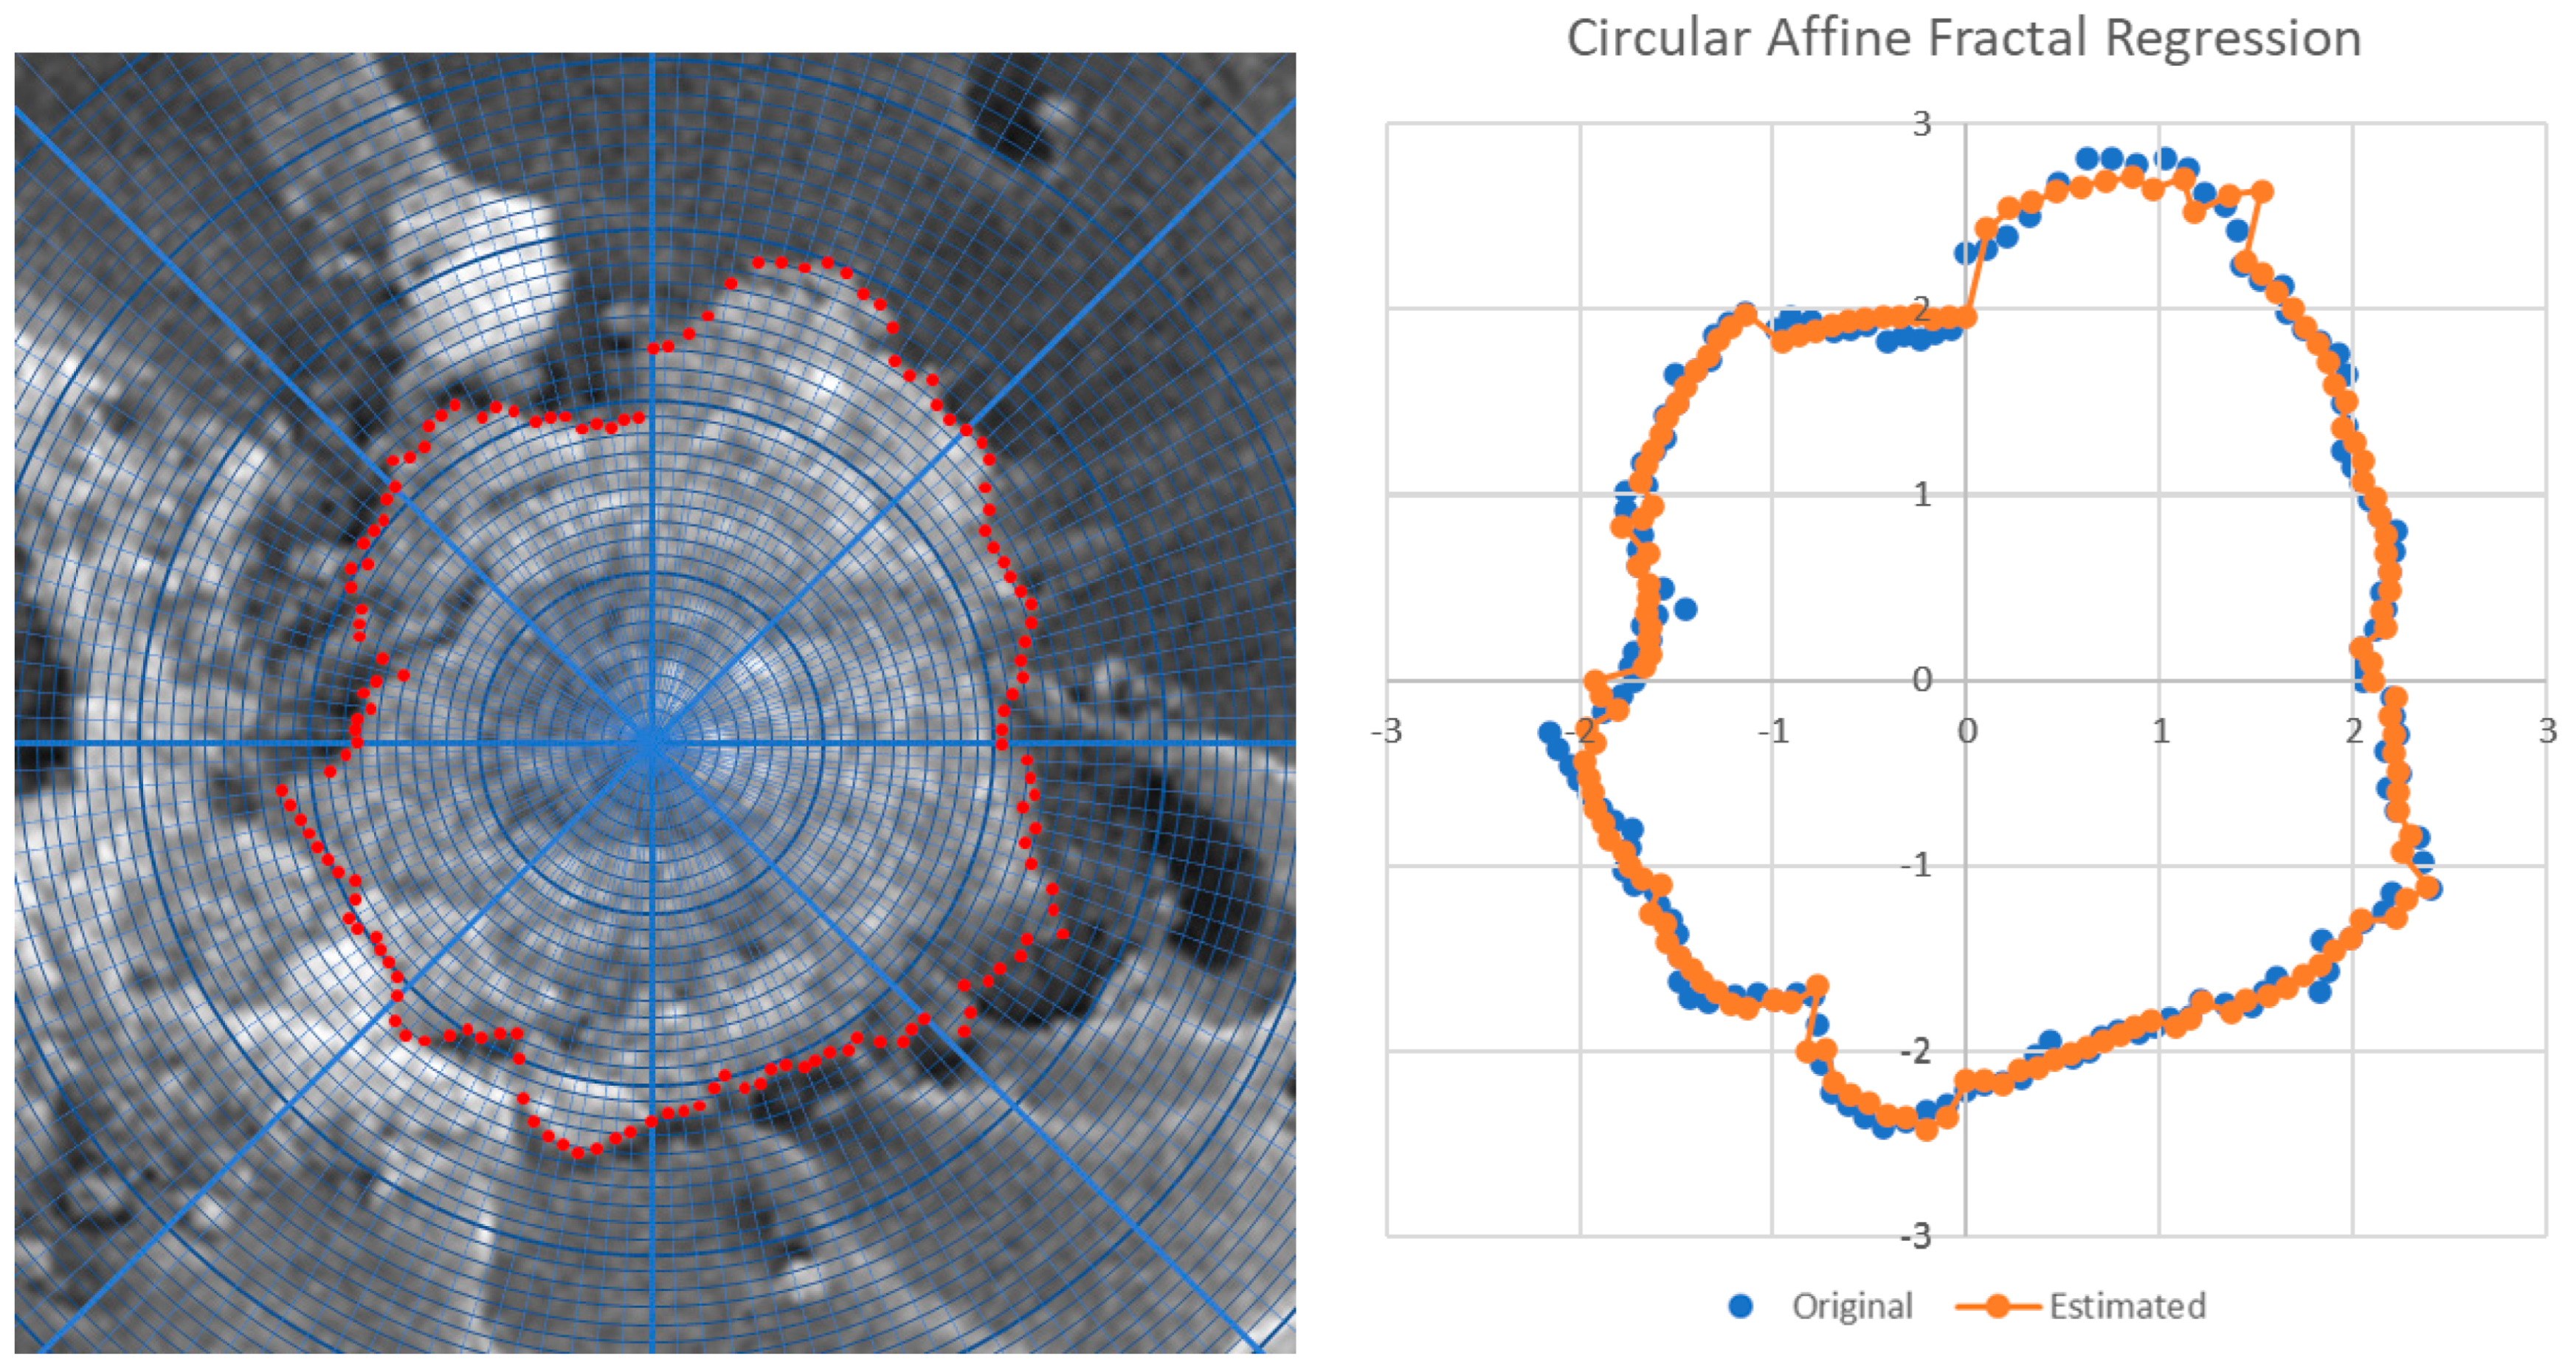
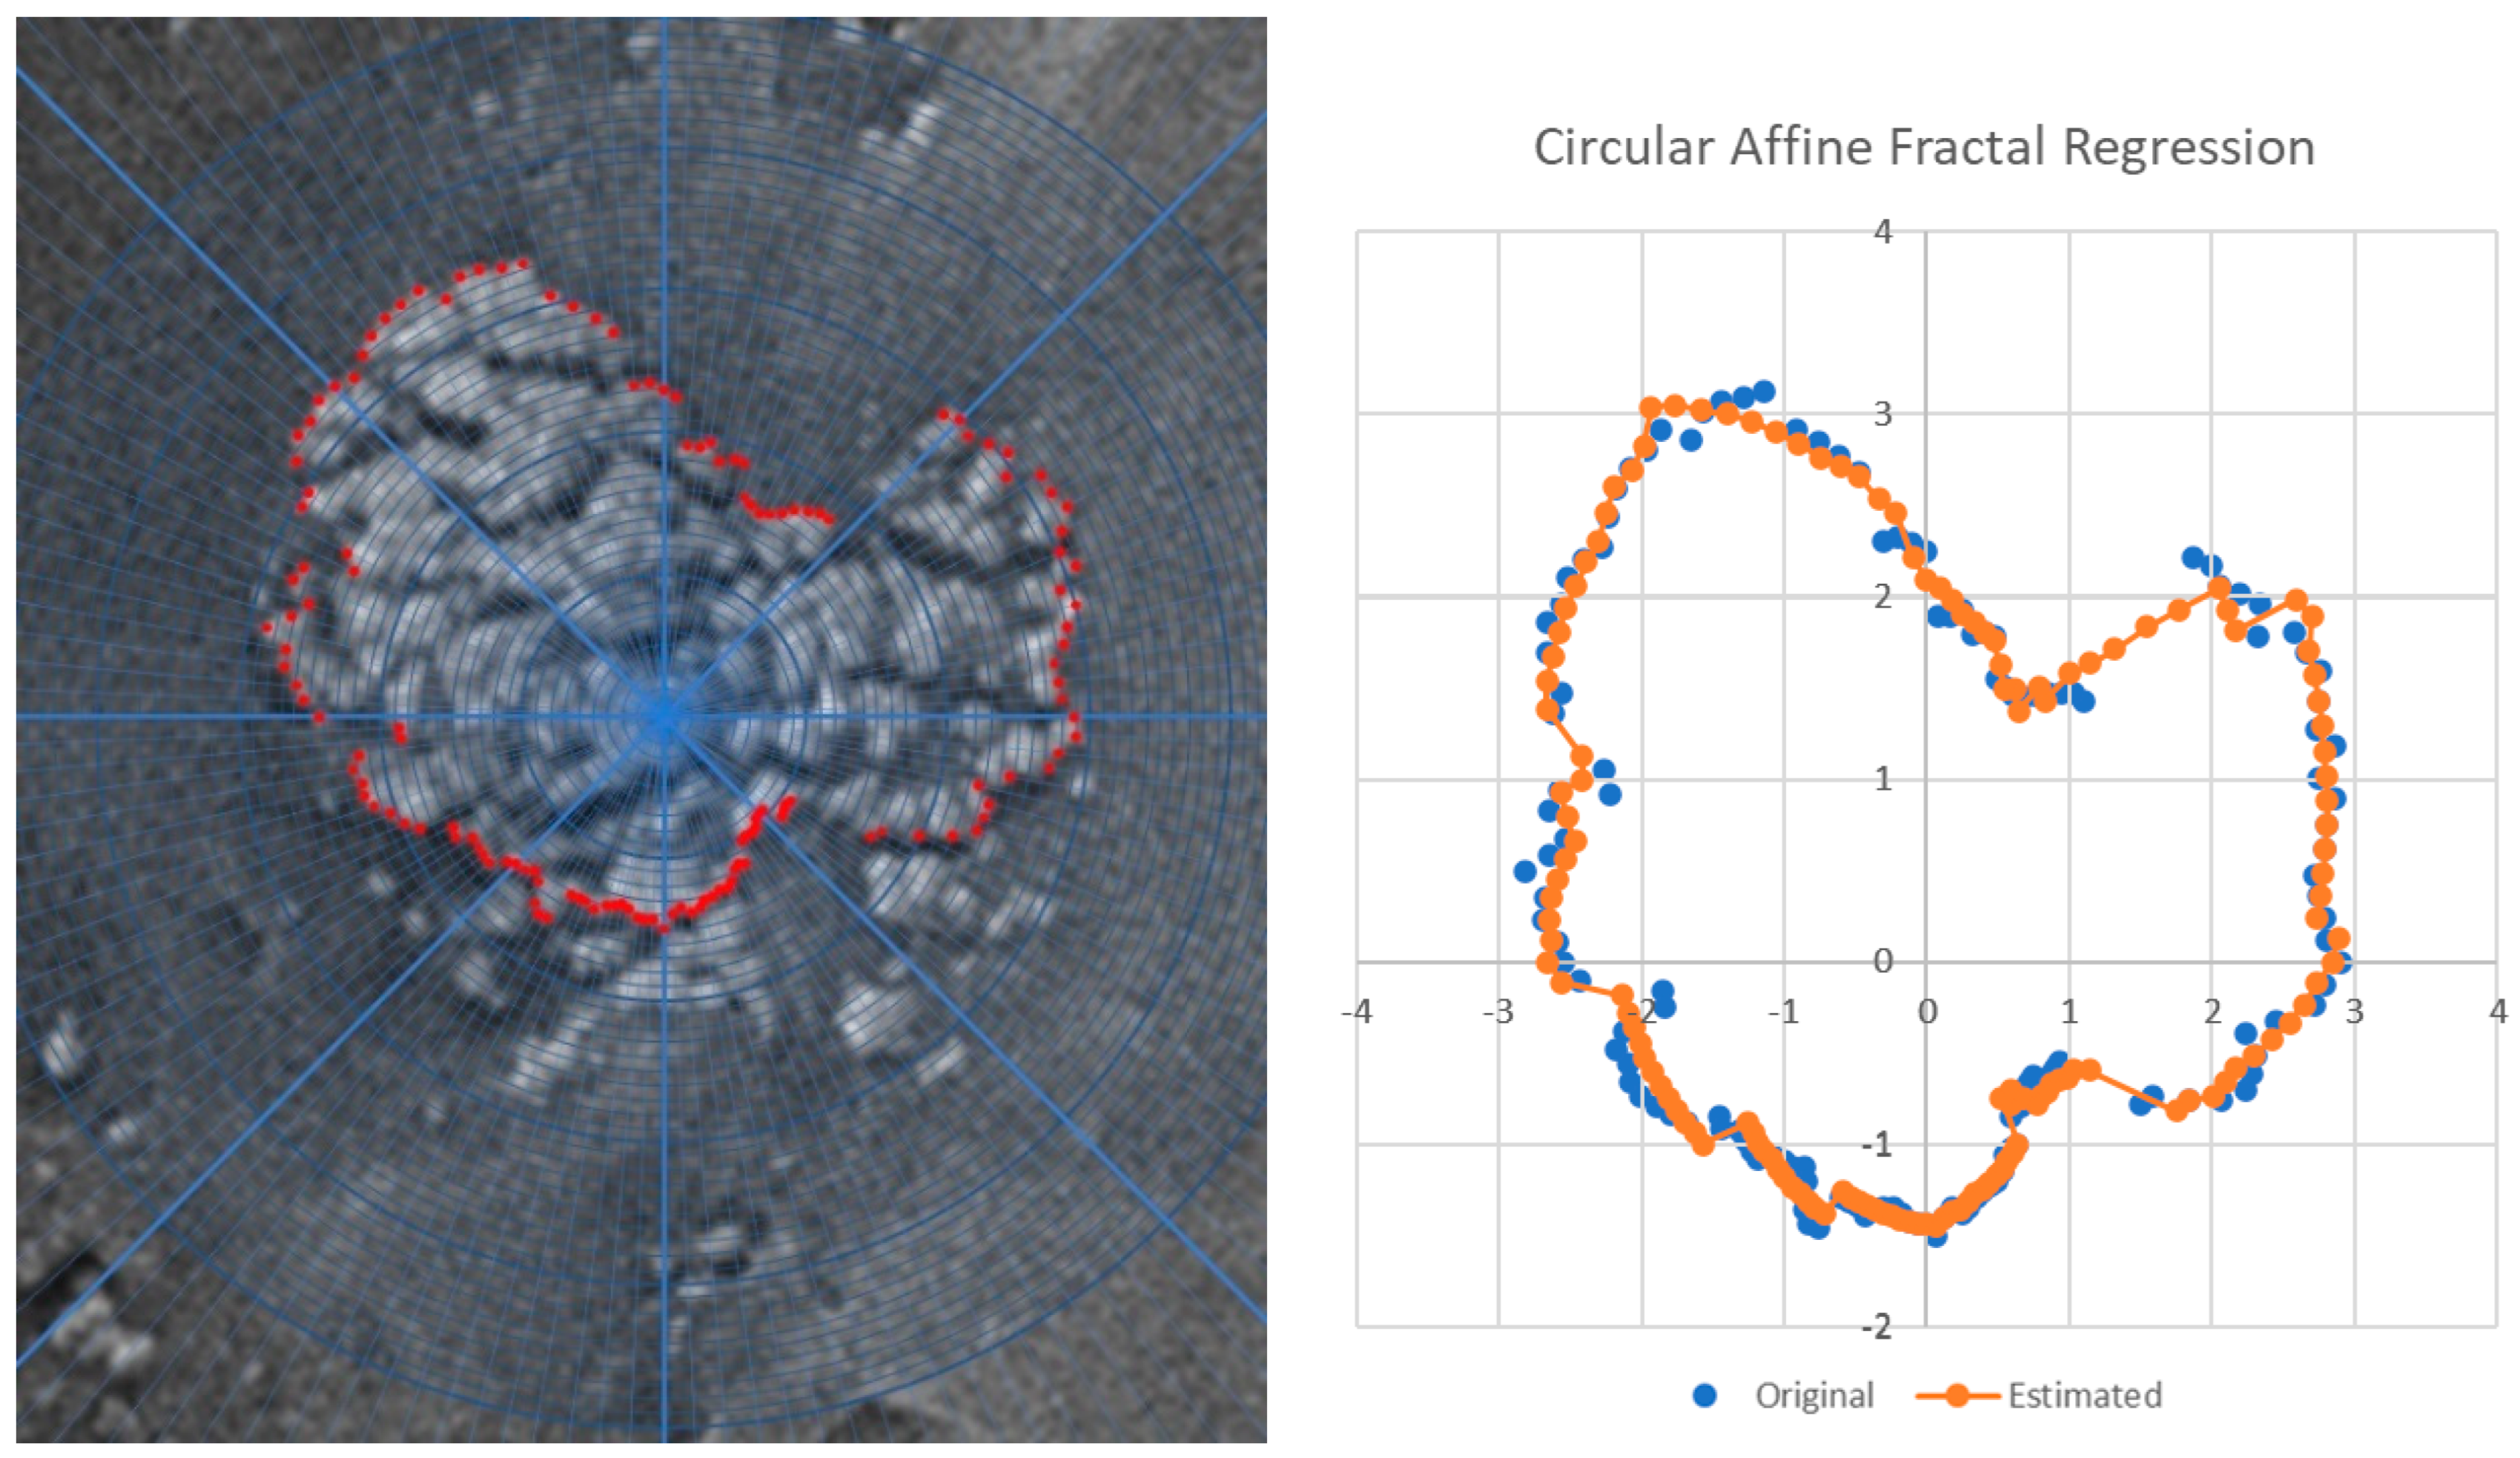
3.2. Fractal Analysis

In our previously published research, we presented a model based on fundamental mathematical theory [21]. However, applying this model to actual experimental data requires a fitting method to obtain the parameters of a theoretical function. The commonly used fractal interpolation method does not estimate all parameters, such as fractal coefficients. This work introduces fractal regression, which is a method that determines all the theoretical model parameters that best fit the actual data, representing a specific case of a theoretical model published earlier. Fractal regression allows for the estimation of the fractal dimension based on the proposed fractal function and the obtained fractal coefficients. In this study, FESEM images of two composites were used for the practical application of fractal regression-based data reconstruction, aiming to reconstruct fiber shapes and determine fractal dimensions. Fractal analysis has been a challenging task in the study of objects, structures, and data with irregular shapes. Scientists often use fractal analysis to estimate a fractal dimension, which is a generalization of the classical integer dimension. The Box dimension and the Hausdorff dimension (HD) are commonly used in this analysis. While the Box dimension is relatively easy to estimate using computational tools, it provides a characterization of an object or phenomenon without identifying its inherent self-similarity structure. A newer method in fractal analysis for real data is fractal regression, which defines a fractal function mathematically to approximate the data and effectively identifies the self-similarity structure in the data. This method involves searching for a replicative process, where the entire dataset is replicated on smaller scales. It should be emphasized that a fractal is theoretically defined by self-similarity, which is characterized by an infinite number of fractal levels, replicating configurations on smaller scales. This means that the fractal structure appears similar at different scales, being scale-invariant. The standard domain is always given as the interval [0,1), regardless of the original image’s scale. For the range, we use an interval with one digit for the units. The scale is indicated only for the original FESEM images on labels. The theoretical foundation for this method is detailed in [22], and the modeled system is as follows:
φ x + j p = a j φ x + b j x + c j
where x 0 , 1 , 0 j p 1 , and a j , b j , c j represent the real numbers for estimation, with 0 < a j < 1 . The default domain is [0,1). The solution of this system is the function φ : [ 0,1 ) R . Parameter a j is the fractal coefficient and b j is the directional coefficient, and p stands for the fractal period. The a j characterizes the fractal oscillations in the data (bigger, in absolute terms, means more fractal oscillations and fewer means smoother behavior in the data).
The algorithm computes the estimates for the coefficients aj, bj and cj of the function that solves the system of equations given in Formula (1). Fractal regression would be similar to performing a linear regression on some given data, i.e., dividing the set into 12 intervals and performing a classical linear regression at each interval. By executing this, the coefficients bj and cj would be obtained, but with all coefficients aj equal to zero. In fractal regression, a coefficient aj is added to each of these linear functions, which measures the fractal oscillations that have self-similar characteristics. If a function is smoother, aj is close to zero. As indicated, the aj parameter is not dependent on the scale and will affect the Hausdorff dimension estimation.
The analytical solution to this equation system cannot be obtained explicitly; thus, Fractal Real Finder software was used, which obtains the fractal regression coefficients via a computational and numerical approximation. A few applications have already been presented in the literature [23]. Fractal analysis was effectively performed on two-dimensional images of the three-dimensional composite material. This technique is a recently developed approach suitable for one-dimensional sets. In this study, contours of two-dimensional images were parametrized to one-dimensional data through polar coordinates. It is assumed that when repeating the same technique in other contours of the same material containing similar structures, the estimates for the Hausdorff dimension would be not significantly different.
FESEM images of the fracture surface after the impact test were used for fractal analysis. Agglomerates at the sites were chosen for having the shape most frequently observed in all the FESEM images; they were enlarged and bordered with red points. Figure 3, Figure 4 and Figure 5 represent the enlarged FESEM images and corresponding estimated fractal contours for PMMA-SrTiO3, PMMA-MnO2 and PMMA-SrTiO3/MnO2, respectively. The results of the fractal regression are given in Table 1, Table 2 and Table 3.
By determining the mathematical formulation of a fractal function that approximates the data, it is possible to estimate its Hausdorff dimension. This is a non-integer dimension different from the integer classical one. This is usually an indicator used to characterize fractal objects. The result gives the formula needed to compute the HD, which is presented as follows:
Proposition. The Hausdorff dimension of the graph of the function φ solution of the above system is upper bounded by the solution d of the following:
j = 0 p 1 β j d = 1
where β j = max 1 p ,   a j ,   0 p p 1 .
This proposition states that only the fractal coefficients such that a j > 1 p are relevant for the computation of the Hausdorff dimension, following Formula (2). These are called relevant coefficients. This means that only the relevant parameters affect the estimation of the Hausdorff dimension. In the case where no fractal coefficients are relevant, the Hausdorff dimension is estimated to be equal to one. The relevant parameters express the strength of the fractal oscillation on data.
The software evaluated all possible fractal shapes and performed the fractal reconstruction of the curve with 12 fractal periods (p = 12) and 2 fractal levels (L = 2). The number of points was calculated using Formula (3):
p L = 12 2 = 144
In the case of the studied contours with p = 12 , which have been divided into 144 angles, the relevant coefficients are those greater than 0.08(3).
For the SrTiO3 contour, they are a 0 = 0.107711 , a 1 = 0.162713 , a 5 = 0.179479 , a 6 = 0.203129 and a 11 = 0.085325 ; for the contour of MnO2, they are a 0 = 0.11053 , a 2 = 0.17685 , a 5 = 0.1434 , a 6 = 0.144696 , a 7 = 0.106984 , a 8 = 0.269847 , a 10 = 0.095076 and a 5 = 0.146954 . The contour of SrTiO3/MnO2 has only one relevant coefficient, a 1 = 0.17325 .
The corresponding estimates for the Hausdorff dimension are 1.13097 , 1.21521 and 1.03637 for the SrTiO3, MnO2 and SrTiO3/MnO2 agglomerates contours, respectively.
The SrTiO3/MnO2 agglomerate contour does not have a self-similarity as strong as SrTiO3. As can be seen, almost all fractal coefficients of SrTiO3/MnO2 are not relevant (low absolute values). This means that the estimated curve has a lot of subintervals near straight lines, which results in a very low HD. On the other side, the estimated contour of SrTiO3 shows a rounded self-iterated fractal shape, which means that the self-similarity is not so smooth (not close to straight lines). As a consequence, more relevant fractal coefficients and a greater Hausdorff dimension are obtained.

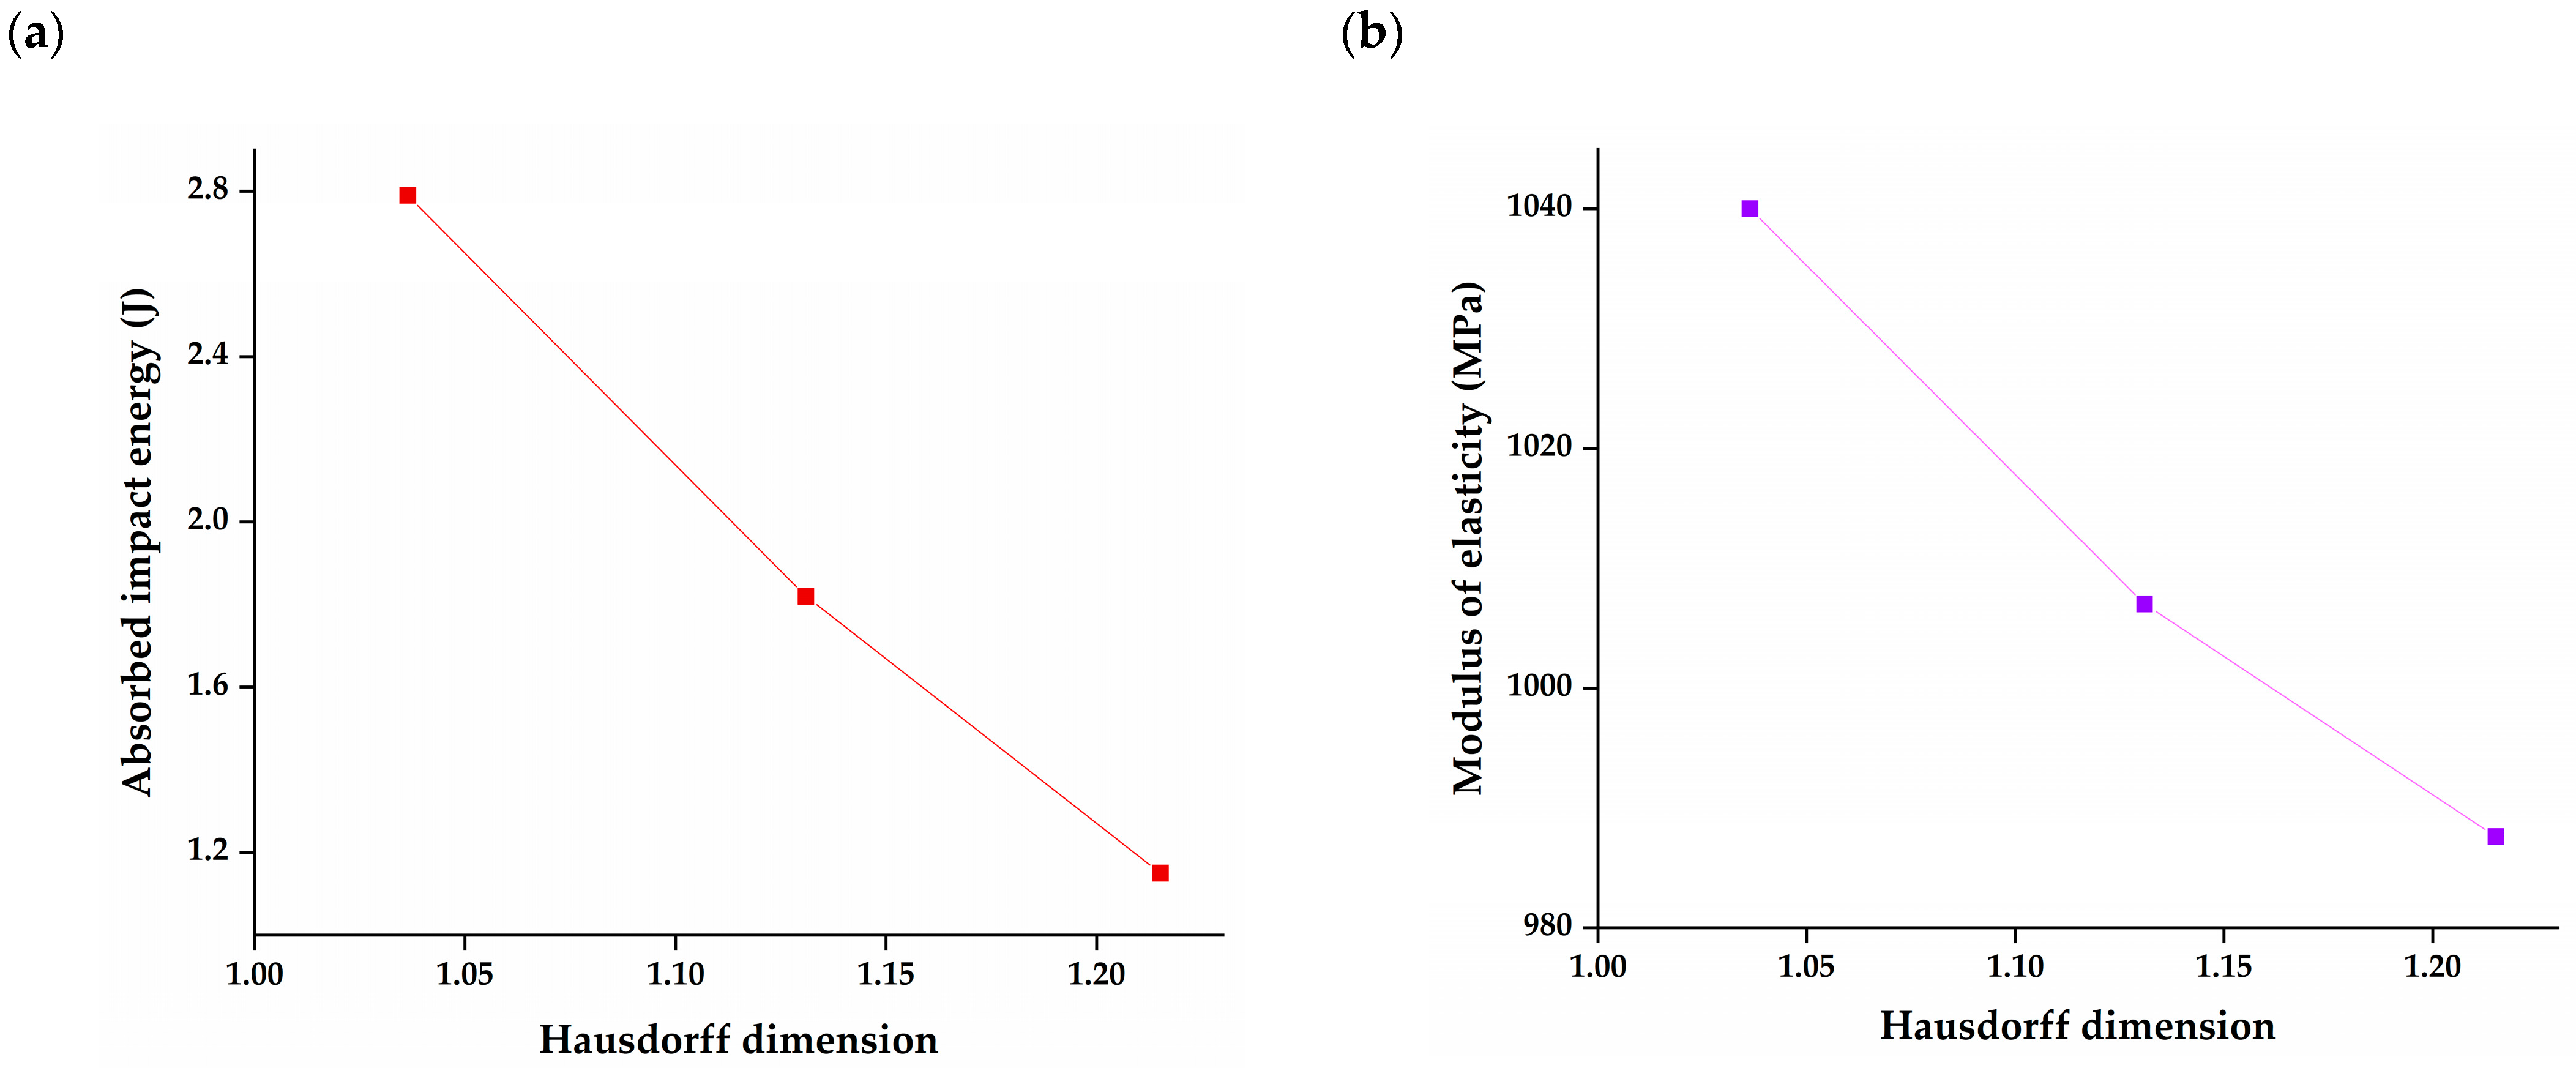
3.3. Dependence of Mechanical Properties on Agglomerate Hausdroff Dimension

The agglomerates formed by MnO2 showed the highest irregularity and HD, which led to the reduced mechanical performance of PMMA-MnO2 compared to PMMA-SrTiO3 and PMMA-SrTiO3/MnO2. The total absorbed impact energy was 142.6% higher in PMMA-SrTiO3/MnO2, suggesting significantly weaker interactions between MnO2 and PMMA. Different polymer–particle interactions result in different surface areas and shapes, which contribute to changes in the Hausdorff dimension. Obviously, stronger interactions resulted in agglomerates with a reduced HD.
The correlation of the absorbed impact energy (Etot) and modulus of elasticity (E) with the Hausdorff dimension (HD) is presented in Figure 6. The fracture surface was analyzed after the impact test; therefore, the focus was on the correlation between Etot and HD (Figure 6a). The dependence fits the linear regression model, with an R2 value of 0.99486. As can be seen, Etot decreases with the increase in HD, presumably because irregular shapes act like stress concentrators that contribute to the crack propagation. Furthermore, the modulus of elasticity reduces linearly with the HD (Figure 6b) determined for agglomerates at different fracture surfaces, which indicates that similar particle–polymer interactions and consequently agglomerate shapes are present throughout the entire volume of the sample. The R2 value for linear fit was 0.98762, meaning that the determined HD could be correlated to other mechanical properties, expanding the possibility of predicting the properties.
The results presented in this study indicate that the HD obtained by fractal regression could be used for the prediction of mechanical performance, which could have great prospects in the future design of composite materials.

4. Conclusions

This research presents an application of the fractal regression method in the shape reconstruction of ceramic nanoparticle agglomerates in denture PMMA-based composites. SrTiO3, MnO2 and SrTiO3/MnO2 nanoparticles were used as reinforcement. Ceramic nanoparticles are prone to the formation of agglomerates in the polymer matrix due to weak interfacial interactions, which can influence the mechanical properties of the composite. Therefore, it is necessary to establish a connection between agglomeration and the mechanical performance in order to predict and improve the composite’s features. Impact resistance is an important mechanical property and major drawback in the application of PMMA as a denture restorative material, which can be enhanced with nanoparticle addition. For the correlation of microstructural properties, i.e., nanoparticle agglomeration with impact resistance, the fractal analysis of fracture surface FESEM images was performed. The contours of 2-dimensional FESEM images of nanoparticle agglomerates in a polymer were parametrized to one-dimensional data with polar coordinates. The software assessed all possible fractal shapes and carried out the fractal reconstruction of the curve with 12 fractal periods and 2 fractal levels. The contours of the SrTiO3, MnO2 and SrTiO3/MnO2 agglomerates had five, eight and one relevant coefficient for the Hausdorff dimension (HD) estimation, respectively. The Hausdorff dimensions determined for the agglomerates of all three types of nanoparticles were correlated with the corresponding total absorbed impact energy values of the composites. Negative linear correlation was established, with an R2 equal to 0.99486. Furthermore, the same correlation was determined in the relationship between the HD and modulus of elasticity, which indicates that the prediction obtained at the fracture site after the impact test could be expanded to other mechanical properties. The R2 for the HD–modulus of elasticity relationship was 0.98762. This study presented data that could be valuable in the prediction of mechanical properties and the future design of composite materials, based on the fractal analysis of microstructure, showing the potential of fractal theory application in materials science.

Author Contributions

Conceptualization, I.S. and V.R.; methodology, H.T.E.; software, C.S.; validation, I.S. and V.R.; formal analysis, H.T.E., C.S., A.S., M.P. and I.J.-C.; investigation H.T.E.; writing—original draft preparation, H.T.E.; writing—review and editing, I.S. and V.R.; visualization, A.S.; supervision I.S. and V.R.; funding acquisition, V.R. All authors have read and agreed to the published version of the manuscript.

Funding

This work was financially supported by the Ministry of Science, Technological Development and Innovation of the Republic of Serbia (Contract Nos. 451-03-65/2024-03/200135, 451-03-66/2024-03/200017 and 451-03-66/2024-03/200026) and National Funding from FCT-Fundação para a Ciência e a Tecnologia, under the project: UIDB/04561/2020.

Data Availability Statement

The data presented in this study are available upon request from the corresponding author. The data are not publicly available due to privacy.

Conflicts of Interest

The authors declare no conflicts of interest. The funders had no role in the design of the study; in the collection, analyses, or interpretation of data; in the writing of the manuscript; or in the decision to publish the results.

References

  1. Zhang, H.-K.; Wu, W.-J.; Kang, Z.; Feng, X.-Q. Topology optimization method for the design of bioinspired self-similar hierarchical microstructures. Comput. Methods Appl. Mech. Eng. 2020, 372, 113399. [Google Scholar] [CrossRef]
  2. Ţălu, Ş.; Stach, S.; Lainović, T.; Vilotić, M.; Blažić, L.; Alb, S.F.; Kakaš, D. Surface roughness and morphology of dental nanocomposites polished by four different procedures evaluated by a multifractal approach. Appl. Surf. Sci. 2015, 330, 20–29. [Google Scholar] [CrossRef]
  3. Fu, S.-Y.; Feng, X.-Q.; Lauke, B.; Mai, Y.-W. Effects of particle size, particle/matrix interface adhesion and particle loading on mechanical properties of particulate–polymer composites. Compos. Part B Eng. 2008, 39, 933–961. [Google Scholar] [CrossRef]
  4. Feng, J.; Venna, S.R.; Hopkinson, D.P. Interactions at the interface of polymer matrix-filler particle composites. Polymer 2016, 103, 189–195. [Google Scholar] [CrossRef]
  5. Peterson, G.W.; Lee, D.T.; Barton, H.F.; Epps, T.H.; Parsons, G.N. Fibre-based composites from the integration of metal–organic frameworks and polymers. Nat. Rev. Mater. 2021, 6, 605–621. [Google Scholar] [CrossRef]
  6. Niccolini, G.; Rubino, A.; Carpinteri, A. Dimensional transitions in creeping materials due to nonlinearity and microstructural disorder. Chaos Solitons Fractals 2020, 141, 110345. [Google Scholar] [CrossRef]
  7. Zhang, Y.; Fu, H.; Xu, S.; Fan, J.A.; Hwang, K.-C.; Jiang, J.; Rogers, J.A.; Huang, Y. A hierarchical computational model for stretchable interconnects with fractal-inspired designs. J. Mech. Phys. Solids 2014, 72, 115–130. [Google Scholar] [CrossRef]
  8. Yaman, K. Fractal characterization of electrical conductivity and mechanical properties of copper particulate polyester matrix composites using image processing. Polym. Bull. 2022, 79, 3309–3332. [Google Scholar] [CrossRef]
  9. Ji, G.; Li, K.; Zhang, G.; Li, S.; Zhang, L. An assessment method for shale fracability based on fractal theory and fracture toughness. Eng. Fract. Mech. 2019, 211, 282–290. [Google Scholar] [CrossRef]
  10. Gurbuz, E.; Erdem, S.; Zhang, M. Mechanical properties and 3D fractal analysis of engineered cementitious composites with shape memory alloy fibres. Case Stud. Constr. Mater. 2023, 19, e02412. [Google Scholar] [CrossRef]
  11. Jodha, K.S.; Kaur, N.; Salazar Marocho, S.M.; Mecholsky, J.J.; Lirette, S.T.; Duan, Y.; Griggs, J.A. Relationship between fracture toughness and fractal dimensional increment in two types of dental glass-ceramics with different fracture surface roughness. Dent. Mater. 2022, 38, 1977–1988. [Google Scholar] [CrossRef]
  12. Zafar, M.S. Prosthodontic Applications of Polymethyl Methacrylate (PMMA): An Update. Polymers 2020, 12, 2299. [Google Scholar] [CrossRef] [PubMed]
  13. Al-Dwairi, Z.N.; Tahboub, K.Y.; Baba, N.Z.; Goodacre, C.J. A Comparison of the Flexural and Impact Strengths and Flexural Modulus of CAD/CAM and Conventional Heat-Cured Polymethyl Methacrylate (PMMA). J. Prosthodont. 2020, 29, 341–349. [Google Scholar] [CrossRef] [PubMed]
  14. Yerliyurt, K.; Taşdelen, T.B.; Eğri, Ö.; Eğri, S. Flexural Properties of Heat-Polymerized PMMA Denture Base Resins Reinforced with Fibers with Different Characteristics. Polymers 2023, 15, 3211. [Google Scholar] [CrossRef] [PubMed]
  15. Jiangkongkho, P.; Arksornnukit, M.; Takahashi, H. The synthesis, modification, and application of nanosilica in polymethyl methacrylate denture base. Dent. Mater. J. 2018, 37, 582–591. [Google Scholar] [CrossRef] [PubMed]
  16. Sharifianjazi, F.; Pakseresht, A.H.; Shahedi Asl, M.; Esmaeilkhanian, A.; Nargesi khoramabadi, H.; Jang, H.W.; Shokouhimehr, M. Hydroxyapatite Consolidated by Zirconia: Applications for Dental Implant. J. Compos. Compd. 2020, 2, 26–34. [Google Scholar] [CrossRef]
  17. Wang, Y.; Wang, C.; Dong, S.; Zu, L.; Lan, T. The study on microstructure and mechanical properties of multi-component composite based on HDPE. Des. Monomers Polym. 2020, 23, 164–176. [Google Scholar] [CrossRef]
  18. Elhmali, H.T.; Stajcic, I.; Stajcic, A.; Pesic, I.; Jovanovic, M.; Petrovic, M.; Radojevic, V. Influence of Novel SrTiO3/MnO2 Hybrid Nanoparticles on Poly(methyl methacrylate) Thermal and Mechanical Behavior. Polymers 2024, 16, 278. [Google Scholar] [CrossRef]
  19. ISO 527-2:2012; Plastics—Determination of Tensile Properties Part 2: Test Conditions for Moulding and Extrusion Plastics. International Organization for Standardization: Geneva, Switzerland, 2012.
  20. Stajcic, I.; Stajcic, A.; Serpa, C.; Vasiljevic-Radovic, D.; Randjelovic, B.; Radojevic, V.; Fecht, H. Microstructure of Epoxy-Based Composites: Fractal Nature Analysis. Fractal Fract. 2022, 6, 741. [Google Scholar] [CrossRef]
  21. Mitic, V.V.; Lazovic, G.; Paunovic, V.; Cvetkovic, N.; Jovanovic, D.; Veljkovic, S.; Randjelovic, B.; Vlahovic, B. Fractal frontiers in microelectronic ceramic materials. Ceram. Int. 2019, 45, 9679–9685. [Google Scholar] [CrossRef]
  22. Serpa, C.; Buescu, J. Explicitly defined fractal interpolation functions with variable parameters. Chaos Solitons Fractals 2015, 75, 76–83. [Google Scholar] [CrossRef]
  23. Mitić, V.; Serpa, C.; Ilić, I.; Mohr, M.; Fecht, H.-J. Fractal Nature of Advanced Ni-Based Superalloys Solidified on Board the International Space Station. Remote Sens. 2021, 13, 1724. [Google Scholar] [CrossRef]
Figure 1. Composite processing scheme.
Fractalfract 08 00314 g001
Figure 2. FESEM images of fracture surfaces in (a) PMMA-SrTiO3; (b) PMMA-MnO2; and (c) PMMA-SrTiO3/MnO2 [18].
Fractalfract 08 00314 g002
Figure 3. Enlarged SrTiO3 agglomerate (left) and estimated fractal curve of an agglomerate (right) in PMMA–SrTiO3 composite.
Fractalfract 08 00314 g003
Figure 4. Enlarged MnO2 agglomerate (left) and estimated fractal curve of an agglomerate (right) in PMMA–MnO2 composite.
Fractalfract 08 00314 g004
Figure 5. Enlarged SrTiO3/MnO2 agglomerate (left) and estimated fractal curve of an agglomerate (right) in PMMA–SrTiO3/MnO2 composite.
Fractalfract 08 00314 g005
Figure 6. Correlation of agglomerate Hausdorff dimension and (a) total absorbed impact energy (b) modulus of elasticity of the composites.
Fractalfract 08 00314 g006
Table 1. Estimated coefficients for the fractal curve of SrTiO3.
01234567891011
a j −0.108−0.163−0.0150.0080.034−0.179−0.203−0.072−0.0430.0530.028−0.085
b j −0.0940.005−0.2920.0550.5040.288−0.04−0.685−0.1010.534−0.044−0.077
c j 3.1323.1552.7612.5982.4933.5423.8243.172.6132.4282.9413.192
Table 2. Estimated coefficients for the fractal curve of MnO2.
01234567891011
a j −0.111−0.063−0.177−0.0180.0170.143−0.145−0.107−0.270.056−0.0950.147
b j 0.2850.367−0.5790.114−0.318−0.3020.1540.1540.549−0.1260.328−0.456
c j 2.3332.5033.4191.9952.2441.5782.2242.2332.5532.0422.3562.258
Table 3. Estimated coefficients for the fractal curve of SrTiO3/MnO2.
01234567891011
a j 0.0060.1730.05−0.023−0.031−0.0750.007−0.010.004−0.0080.058−0.039
b j 0.48−1.5970.8021.218−0.525−0.175−0.2980.0070.068−0.250.4671.011
c j 2.7312.8251.3832.5293.5422.8722.1181.5631.3761.4280.7462.035
Disclaimer/Publisher’s Note: The statements, opinions and data contained in all publications are solely those of the individual author(s) and contributor(s) and not of MDPI and/or the editor(s). MDPI and/or the editor(s) disclaim responsibility for any injury to people or property resulting from any ideas, methods, instructions or products referred to in the content.

