Abstract
Soil-rock mixtures (SRM) are extensively utilized as filling materials in engineering slopes and roadbeds. A comprehensive understanding of the crushing characteristics of SRM during compaction is essential for precisely controlling its mechanical properties, particularly when dealing with SRM comprising soft rock blocks. This study conducted heavy compaction and screening tests to investigate the crushing and compaction behaviors of soil-soft rock mixture (SSRM) with varying coarse particle content (P5 content), the primary focus was primarily on analyzing the double fractal characteristics of coarse and fine particles. The research findings are as follows: with the increase of P5 content, the maximum dry density of SSRM initially rises and then declines, reaching its peak when P5 content is 70%. Soft rock blocks in SSRM exhibit extreme fragility during compaction, the crushing index of coarse particles exhibits a linear increase with the rise in P5 content, whereas the crushing index of fine particles displays a “double peak” characteristic. After compaction, a linear positive correlation is observed between the fractal dimension and the crushing index of coarse and fine particles. With the increase in P5 content, the slope of the relationship curve between the fractal dimension and the crushing index of coarse particles remains relatively constant, while the intercept gradually decreases. Moreover, the fractal dimension of fine particles effectively reflects the compaction characteristics of SSRM, and the relationship between the fractal dimension of fine particles and dry density aligns with the compaction curve of SSRM.
1. Introduction
Soil-rock mixture (SRM) is widely utilized as a geotechnical material owing to its substantial bearing capacity and high shear strength, particularly in infrastructure construction engineering like slopes and roadbeds. Xu et al. [1] defined SRM as an extremely heterogeneous and loose rock-soil medium system formed since the Quaternary period. Its physical and mechanical properties are primarily influenced by particle composition [2], exhibiting a strong correlation with the strength of the stone block. The stone blocks possess sharp edges [3], large particle size, and may contain a primary structural plane [4]. Particle crushing occurs during the compaction or tamping process [5], impacting the original grading state of SRM [6], thereby affects its physical and mechanical properties [7,8], and may lead to instability and deformation in fill works.
The particle crushing of granular materials is affected by compaction degree, stress level, loading path, particle strength and mineral composition, and is extremely sensitive to particle strength [9]. Research on SRM has primarily focused on compositions with hard rock. Wang et al. [10] observed the gradation curves of SRM with hard slate to be almost identical before and after compaction, indicated that particle crushing of the weathered crushed slate was not evident after compaction. Du et al. [11] studied the crushing characteristics of coarse particle soil containing weakly weathered granite gravel, with the particle crushing rate below 25% after triaxial compression tests. Pang et al. [12] conducted limited uniaxial compression tests on medium-hard crushed coal gangue with a strength of 16.84 MPa by using the fractional loading method and discussed the mechanical properties and re-crushing characteristics of gangue particles during the loading process, revealing particle crushing mainly occurred in the slow compaction stage and the increment of fractal dimension characterized the re-crushing potential. Wang et al. [13] used the homemade compaction testing system to load the crushed rock particle sample with uniaxial compressive strength of 62 MPa and explored the crushing characteristics and particle size distribution in the loading process, observed that the maximum crushing index was only 43.68~47.75% when the compaction was 40 mm. However, the block of soft rocks with saturated uniaxial compressive strength of less than 15 MPa [14] is highly prone to breakage during compaction [15,16,17,18]. The research results of Zhang et al. [16] showed that the crushing index of soft coal particles was obviously higher than that of hard coal particles. Meanwhile, it can be found that the fractal dimension decreased with increasing rock strength for the same initial particle size gradation and stress [19]. Limited research has been conducted on soil-rock mixtures with soft rock block (Soil-Soft Rock Mixture; SSRM). The gradation of SSRM undergoes significant changes before and after compaction, influencing the mechanical properties of SSRM, such as compressive strength, permeability characteristic, the stress-strain relationship and so on. Pang et al. [12], Li et al. [20] concluded that the crushing small particles fill the voids, further reducing the voids ratio, and the load-bearing capacity of the SRM is greatly increased. Li et al. [21,22] conducted seepage test and found that particles crushing would reduce the permeability of the SRM. In mountainous areas’ infrastructure construction, the most effective means to address material shortages and reduce costs is through high excavation, low filling, and using local materials. A commonly employed mixture, consisting of strongly weathered argillaceous slate-silty clay, serves as a primary filling material for engineering slopes and roadbeds. Therefore, it is imperative to investigate the compaction and crushing characteristics of SSRM, and quantify the degree of particle crushing by fractal dimension to understand the influence of particle crushing on the compaction characteristics of the SSRM.
This study configured a mixture of strongly weathered argillaceous slate-silty clay with varying soil-rock ratios. Heavy compaction tests were conducted to explore the compaction characteristics of SSRM with different P5 content and water content. Simultaneously, screening tests of SSRM before and after compaction were performed to analyze its crushing characteristics. Considering the double fractal characteristics of SSRM, this study revealed the relationship between the fractal dimension and the crushing index and dry density of SSRM. The results have significant implications for selecting filling material ratios, controlling deformation in fill engineering, and enhancing compaction quality.
2. Experiments and Methods
2.1. Experimental Instrument and Materials
This study is mainly to provide experimental results in line with local standards in China, so on the basis of referring to ASTM standards [23] and Chinese standards [24], the compaction test employed the standard Z3 heavy compaction instrument, consisting of a cylindrical percussion barrel and a compaction hammer. The inner diameter of the cylinder is 152 mm, height 116 mm, volume 2104.9 cm3, and the compaction hammer weighs 4.5 kg with a drop distance of 457 mm. The compaction energy works out to be 2684.9 kJ/m3, and the compaction instrument’s maximum allowable particle size is 40 mm. Standard shakers were used for the screening test of SSRM, equipped with a vibrator and ten round hole screens with diameters of 40, 20, 10, 5, 2, 1, 0.5, 0.25, 0.1, and 0.075 mm, respectively.
The SSRM used for the test was sourced from an incineration power plant project site in Hunan Province, China (Figure 1). Through random sampling and experimental testing at multiple locations, the natural moisture content of SSRM averages 9.78%. The filling material consisted mainly of soft rock blocks and fine particle materials. The soft rock blocks are strongly weathered argillaceous slate, characterized by extremely poor rock quality (RQD < 25), a density of 2.43 g/cm3, saturated compressive strength of 3.2–7.2 MPa, micro-cracks, plate-like structure, and weak weathering resistance. The fine particle material resulted mainly from the weathering of argillaceous slate and silty clay.
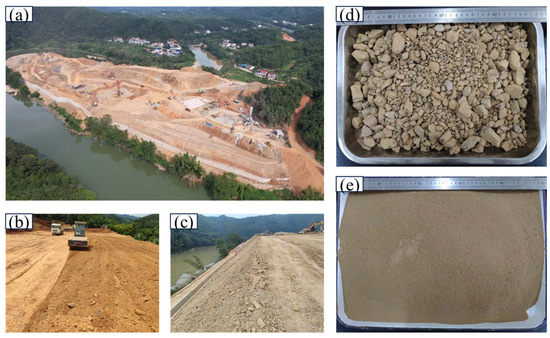
Figure 1.
(a) Top view of sampling site; (b) SRM compaction; (c) High-fill slope after compaction; (d) Coarse particle; (e) Fine particle.
Screening of the filling material on-site (Figure 2a) revealed that particles exceeding 40 mm comprised about 2~5% of the mass, with a non-uniformity coefficient Cu = 9.6~37.1 and a curvature coefficient Cc = 1.8~3.8. For particles that exceed the allowable range of the maximum particle size of the instrument, four methods are often adopted in the laboratory for treatment: the elimination method [25], the similar grading method [26], the equivalent weight replacement method [7] and the mixed method [27]. Since the particle size exceeding 40 mm was less than 10%, the elimination method was used to treat the excess particle size, the maximum particle size of the sample was controlled below 40 mm to meet the requirements of the instrument for the sample size.
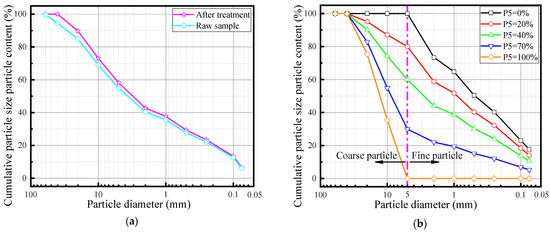
Figure 2.
(a) Gradation curves of raw and supersized particles treated. (b) Gradation curves of each P5 content.
2.2. Experimental Scheme
Determining the soil-rock threshold is crucial for SRM studies, and the concepts of bulk rock and soil particles are relative, with boundaries varying based on different research scales [28]. For example, Wang et al. [29] studied the compaction characteristics of SRM with a maximum particle size of 100 mm by using a large compacting instrument independently developed and selected 10 mm as the threshold value of soil-rock. American Society for Testing and Materials (ASTM) adopts 4.75 mm as the boundary particle size of coarse and fine particles [30], however, 5 mm is used as the threshold of soil and rock in many classical literatures [2,5,25]. To align with classical literature and taking into account the experimental scale and recommendations from numerous scholars [31,32,33], a threshold of 5 mm was chosen for differentiating between soil and rock in following works.
Samples were prepared after field packing super-particle size treatment, according to the designed P5 (particle size ≥ 5 mm) content. The particle grading curves of five samples groups with different P5 content are shown in Figure 2b.
Studies have shown that the optimum moisture content of SRM is generally less than 15%, and gradually decreases with the increase of coarse content [33,34,35]. At the same time, considering the natural moisture content of the SSRM, each SSRM group was proportioned for five different moisture contents (6%, 8%, 10%, 12%, 14%) [24], thoroughly mixed, and blanked for 24 h to maintain consistent internal moisture content. The samples were then divided into three layers for compaction, with 94 hits per layer. Before compaction, the surface of each layer was gouged, and the sample was weighed after compaction. Post-weighing, the SSRM was demolded, dispersed with a wooden hammer, placed outdoors for air drying and oven drying, and then screened. This process yielded the maximum dry density and optimal moisture content for samples with different P5 content, along with particle gradation after compaction.
2.3. Particle Fractal Model
The fractal theory [36] proposed by Mandelbrot can reveal the fine structure hidden in the chaotic and disorderly irregular forms and phenomena in nature and quantitatively describe the implied rules. Then, a two-dimensional particle fractal characteristic model was established. Tyler et al. extended the model, establishing a three-dimensional particle size distribution characteristic model, and deduced the fractal dimension weight distribution model of soil particle size distribution [37]:
where dmax is defined as the maximum particle size of an SSRM sample; ρ is any particle sizes; D is the fractal dimension; M(ρ < di) is the particle mass less than the particle size di; MT is the total mass of all particles.
If a good linear fitting relationship exists between particle size ratio and mass ratio in double logarithmic coordinates, with the slope of the fitted line denoted as k, then the fractal dimension is determined as D = 3 − k [38].
The particle size distribution exhibits self-similarity and robust fractal characteristics in SSRM, and different particle size distributions in SSRM correspond to distinct fractal features [39]. The fractal dimension (D) serves as a quantifiable measure for the particle size composition of SSRM before and after compaction, providing insights into the particle crushing characteristics. SSRM displays double fractal characteristics [40], implying that the fractal properties of particles above and below the soil-rock threshold differ from those of homogeneous soil. Furthermore, the intersection particle size of the two fractal curves can be considered the boundary particle size between coarse and fine particle [41]. Therefore, neglecting the double fractal characteristics of SSRM and using the average fractal dimension to describe the entire grain set would lead to an inaccurate characterization of the SSRM’s crushing characteristics. Through the analysis of double logarithmic coordinate data for the particle size ratio and mass ratio of SSRM in this study, it is evident that it conforms to double fractal characteristics.
According to Formula (1), the coarse particle fractal dimension (D5C), fine particle fractal dimension (D5F), and the average fractal dimension (D) of each P5 content sample before compaction can be obtained, as shown in Table 1. The table indicates that the fractal dimension of fine particles in SSRM with different P5 content is 3.6039, indicating geometric similarity in the fine particle grading structure across various P5 content samples.

Table 1.
Fractal dimension of samples with P5 content before compaction.
3. Results and Discussion
3.1. Compaction Characteristics of SSRM
Figure 3 illustrates the compaction curve of SSRM with varying P5 content. Figure 4 presents the changes in maximum dry density and optimal moisture content of SSRM with P5 content, the fitting was conducted using binomial polynomials, yielding fitting coefficients of R2 = 0.983 and R2 = 0.976, respectively.
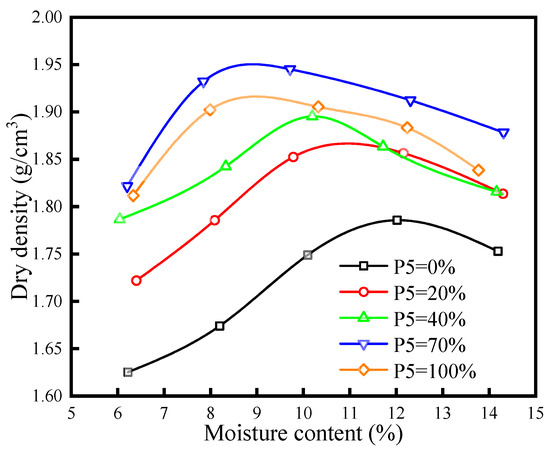
Figure 3.
Compaction curves of SSRM with different P5 content.
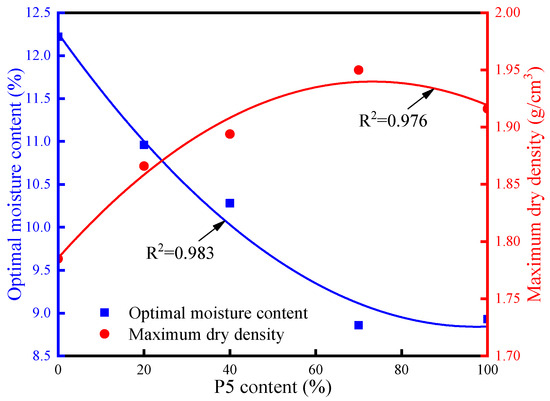
Figure 4.
Relationship curves of optimal moisture content, maximum dry density, and P5 content.
In Figure 3, the compaction curve takes the form of an approximate parabola. With the increase of moisture content, the dry density of samples initially rises and then decreases. This behavior is attributed to the thickness of the hydration film on particle surface, a phenomenon extensively explained in the literature. Figure 4 reveals that the maximum dry density of SSRM first increases and then decreases with growing P5 content. At P5 content equal to 70%, the maximum dry density of SSRM reaches its peak. Specifically, when P5 content equals 20%, 40%, 70%, and 100%, the maximum dry density of SSRM is 1.866 g/cm3, 1.894 g/cm3, 1.950 g/cm3, and 1.916 g/cm3, respectively, with no significant variation in values. Notably, SSRM with P5 content equal to 0% exhibits significantly lower dry density compared to SSRM with P5 content greater than 20% at the same moisture content.
Interpreted the above test results, it’s observed that, at the same volume, the porosity of coarse particles is smaller, resulting in a larger dry density compared to fine particles. Under the same moisture content, SSRM containing coarse particles exhibits higher dry density than SSRM without coarse particles after compaction. When P5 content ranges from 20% to 70%, the skeleton pores between coarse particles can be filled by fine particles. The increase in P5 content leads to a gradual increase in the maximum dry density of SSRM, with the growth rate gradually decreasing. When P5 content reaches 70%, the maximum dry density reaches its peak. When P5 content exceeds 70%, the insufficient content of fine particles is unable to fill the pores between coarse particles, resulting in an overhead state after compaction. Due to the skeleton effect formed by coarse particles, force transfer to fine particles during compaction becomes challenging, potentially leading to uncompacted fine particles and a subsequent decrease in maximum dry density.
3.2. Particle Crushing Characteristics
During the compaction process of SSRM, external forces cause extrusion and grinding between particles. If particle strength is insufficient, particles may rupture or break, resulting in smaller particles. The physical and mechanical properties of SSRM change before and after particle crushing. According to the degree of particle crushing, refining the three particle crushing types proposed by Guyon, Tu et al. [42] identified four types: surface lapping, local rupture, complete rupture, and complete crushing. Figure 5 shows the model diagram for these four crushing types and the actual pictures of the particles crushing after compaction.
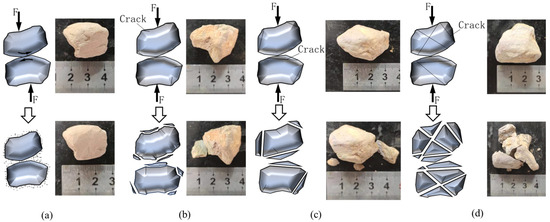
Figure 5.
Particle crushing type. The left side is the model diagram, and the right side is the physical diagram. (a) Surface lapping; (b) local rupture; (c) complete rupture; (d) complete crushing.
Particle fragmentation will inevitably change the particle composition of the sample. The gradation curve can express the particle size distribution macroscopically, Figure 6 presents the fractional curves of SSRM with different P5 content and different moisture content after the compaction test. The curves represent particle size distribution based on the sieving experiment. The difference between the total mass of samples after sieving and the original total mass is less than 0.3%, indicating high accuracy in the screening analysis results.

Figure 6.
Gradation curves of SSRM before and after compaction for each P5 content. (a) P5 = 0%; (b) P5 = 20%; (c) P5 = 40%; (d) P5 = 70%; (e) P5 = 100%.
As depicted in Figure 6, the particle grading curves after compaction are consistently higher than those before compaction. Coarse particle content decreases, while fine particle content increases after compaction. This indicates the evident crushing effect of compaction on SSRM particles. With increased moisture content, the particle fraction curve shifts upward, suggesting that moisture content promotes coarse particle crushing. However, the differences in the particle fraction curve after compaction under different moisture content are small. The inhomogeneity coefficient Cu of each particle group after compaction is greater than 10, indicating that poorly graded SSRM transitions towards better grading during compaction. Bonagiri et al. [43], Romana et al. [44], through the participation of some soil amendment in fine-grained clay or soft soil, such as granite sand and chitosan, to improve the durability and strength of soft soil and reduce the compressibility. Their research gives us a lot of inspiration. In this study, coarse particles (physical amendment) can be regarded as soil amendment. The test results of this study show that with the gradual increase of coarse particle content, the maximum dry density of SSRM first increases and then decreases, indicating that the addition of coarse particle conditioner makes the grading of SSRM gradually strengthen, and gradually weaken after reaching the optimal level.
The particle crushing index (Bg) proposed by Marsal [45] is employed to quantify the crushing degree of each particle group before and after compaction. Bg reflects the change in each particle group of the sample, representing the positive sum of the difference between the contents of each particle group before and after compaction.
where Wki is defined as the mass fraction of a certain particle group before compaction; Wkf is defined as the mass fraction of the same batch after compaction.
SRM has obvious double fractal characteristics [39]. To vividly characterize the crushing characteristics of particles, this paper subdivides the above particle crushing index (Bg) into coarse particle crushing index (Bg5C) and fine particle crushing index (Bg5F). These relationships are as follows:
At the same time, according to the definition of crushing index, the most extreme situation is that the coarse particle content of the SSRM is 100%, and the coarse particles are all broken into fine particles after compaction, or there is no particle crushing before and after compaction, that is, the range of the coarse and fine particle crushing index (Bg5C and Bg5X) are 0~100%, and the range of the total particle crushing index (Bg) is 0~200%.
Figure 7 illustrates the relationship between P5 content and the crushing index of coarse and fine particles under various moisture content conditions of SSRM after compaction. Figure 8 demonstrates the total particle crushing index of SSRM after compaction under different moisture content.

Figure 7.
Relationship between coarse and fine particle crushing index and P5 content after compaction. (a) Coarse particle; (b) Fine particle.
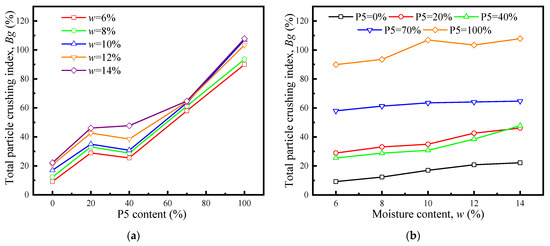
Figure 8.
Relationship between total particle crushing index and P5 content, moisture content. (a) P5 content; (b) Moisture content.
As shown in Figure 7, the crushing index of coarse particles increases with the rise in P5 content, whereas the relationship between the fine particle crushing index and P5 content exhibits a distinctive “double peak” pattern, with the initial peak occurring when P5 = 20%. Specifically, at P5 = 20%, the coarse particle crushing index ranges from 0.9% to 2.8%, while the corresponding fine particle crushing index is notably higher, ranging from 28.1% to 43.3%. At P5 = 40%, the coarse particle crushing index ranges between 8.4% and 18.5%, and the corresponding fine particle crushing index is in the range of 17.2% to 29.2%. Interestingly, When P5 = 100%, the crushing index of both coarse and fine particles, under varying moisture content, is equal, falling within the range of 45.0% to 53.9%. The total particle crushing index, as illustrated in Figure 8a, exhibits little change within the P5 = 20~40% range, but experiences a pronounced increasing trend within the P5 = 40~100% range, reaching its peak at P5 = 100%, ranging between 89.9% and 107.8%. Comparing with the range of the total crushing index, indicates that the particle crushing has reached more than 50% of the maximum crushing degree. Furthermore, Figure 8b highlights the apparent increase in total particle crushing after compaction, with moisture content promoting particle crushing. However, the variation in particle crushing index after compaction for SSRM with identical P5 content but different water contents is insignificant, aligning with the findings of Wang et al. [46]. For instance, considering P5 = 70%, the total particle crushing index is 58.0%, 61.3%, 63.5%, 64.1%, and 64.7% for moisture contents of 6%, 8%, 10%, 12%, and 14%, respectively. The incremental change in the crushing index with increasing moisture content is 5.7%, 3.6%, 0.9% and 0.9%, respectively.
The crushing behavior of SSRM with varying P5 content can be explained by the spatial structure [34] of SRM, illustrated in Figure 9. In the range of P5 = 0~20%, coarse particles were suspended within fine particles, forming a suspended dense structure. The fine particles exerted a buffering effect on the coarse particles during the compaction process, resulting in a less pronounced crushing effect on the coarse particles, with particle crushing primarily occurring in the fine particles. Transitioning to the P5 = 20~40% range, an increase in coarse particles led to their contact with each other, though a complete skeleton was not yet formed. Under compaction, the coarse particle crushing index gradually increased, albeit at a slow rate. Conversely, the crushing index of fine particles exhibited a decreasing trend in this interval, and the total crushing index of the SSRM remained relatively constant. This can be attributed to the compaction process breaking coarse particles into finer ones, with the reduction in fine particles compensated by the crushing of coarse particles. Additionally, the presence of the contact skeleton of coarse particles mitigated the compaction effect on fine particles. As P5 increased to the range of 40~70%, the contact between coarse particles formed a complete skeleton, allowing the pores between coarse particles to be filled by fine particles. During compaction, the crushing indexes of both coarse and fine particles showed an increasing trend, with the growth rate gradually intensifying. Finally, when P5 reached 70~100%, the pores between the coarse particle skeleton could not be filled, resulting in an overhead phenomenon where compaction work was borne by the skeleton. This condition made the SSRM highly susceptible to cracking and breaking, leading to a significant particle break index.

Figure 9.
Particle distribution diagram of SSRM with different P5 content. (a) P5 = 0%; (b) Coarse particles suspended and without contact; (c) Coarse particles suspended and local contact; (d) Complete coarse particles skeleton and fine particles completely filled; (e) Complete coarse particles skeleton and fine particles not completely filled; (f) P5 = 100%.
3.3. Particle Fractal Analysis
Fractal theory was employed to quantify the extent of particle crushing [47]. In Figure 10, a graph is presented with lg(di/dmax) as the horizontal coordinate and lg(M(ρ < di)/MT) as the vertical coordinate based on fractal theory.

Figure 10.
Fractal characteristic curves of samples with different P5 content before and after compaction. (a) P5 = 0%; (b) P5 = 20%; (c) P5 = 40%; (d) P5 = 70%; (e) P5 = 100%.
The results illustrate that SSRM with varying particle size distributions exhibits diverse fractal characteristics. The logarithmic curves of particle size ratio and mass ratio exhibit a well-fitted linear relationship. For SSRM with P5 = 20~100%, by fitting the data on both sides of the 5 mm particle size (where the particle size comparison number lg(di/dmax) is 0.903), the fractal dimension shows a significant difference. This indicates the evident double fractal characteristics of SSRM. For P5 ≥ 70%, under the same P5 content, the slope of the fractal characteristic curve for coarse particles is greater than that for fine particles, implying that the fractal dimension of coarse particles is smaller than that of fine particles. The opposite is observed when P5 ≤ 40%. With an increase in moisture content, the slope of the fractal characteristic curves for both coarse and fine particles gradually decreases, individual deviations occur at P5 = 20% and P5 = 40% due to some uncertain factors during the experiment (for example heterogeneous particle shape). However, the fractal dimension of compacted SSRM with the same P5 content generally increases with rising moisture content, indicating that moisture content promotes particle fragmentation.
Table 2 shows the fractal dimension of coarse and fine particles of SSRM with different P5 content after compaction under different moisture content according to the fractal characteristic curve.

Table 2.
Fractal dimension of coarse and fine particles.
With equivalent compaction energy, the particle gradation of a soil-soft rock mixture is more prone to achieve an optimal distribution compared to that of a soil-hard rock mixture post compaction. In this ideal distribution, particles exhibit increased resistance to breakage upon contact [21]. As shown in Table 2, after compaction, the results indicate that the fractal dimension of coarse and fine particles of SSRM with the same P5 content does not exhibit significant changes under varying moisture content. This suggests that, after compaction, the particle composition of SSRM tends to be consistent for different moisture content levels [19]. This phenomenon contributes to the minor differences observed in maximum dry density for SSRM with P5 content exceeding 20%. Additionally, the data reveals that the fractal dimension of coarse particles decreases with an increase in P5 content, while no distinct pattern exists between the fractal dimension of fine particles and P5 content. This observation aligns with the findings of Zhang et al. [48].
3.4. Relationship between Particle Crushing and Fractal Dimension
Figure 11 displays the relationship between the fractal dimension and crushing index of SSRM after compaction.
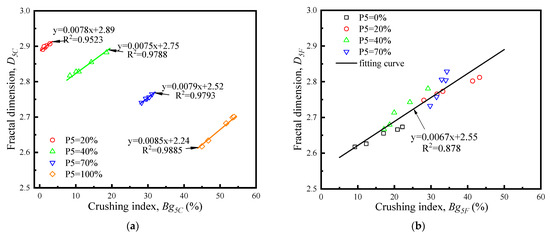
Figure 11.
Variations of fractal dimension with particle crushing index. (a) Coarse particles; (b) Fine particles.
Figure 11 illustrates the relationship between the fractal dimension and crushing index of SSRM after compaction. A notable linear correlation emerges between the crushing index and fractal dimension of SSRM after compaction. The fractal dimension exhibits an increase corresponding to the rise in the particle crushing index, suggesting that the SSRM’s degree of fragmentation after compaction can be effectively characterized by its fractal dimension. In Figure 11a, SSRM with varying P5 content displays a consistent slope in the fitting relationship between the crushing index and fractal dimension of coarse particles, ranging from 0.0075 to 0.0085. Additionally, the intercept decreases with the increase of P5 content. Figure 11b reveals a significant linear correlation between the crushing index and the fractal dimension of fine particles, fitting SSRM with different P5 content (0~70%) to the following Formula (4).
In the equation, x is the fine particle crushing index, y is the fractal dimension of the fine particle, and the fitting correlation coefficient R2 is 0.878.
3.5. Relationship between Dry Density and Fractal Dimension
The relationship between the dry density of SSRM and the fractal dimension of fine particles is depicted in Figure 12 for various P5 content levels. Binomial fitting was applied to the relationship after compaction, resulting in fitting correlation coefficients of 0.9664, 0.9227, 0.9132, 0.9180, and 0.9590, respectively, indicating a high correlation. The fitting curve demonstrates that the dry density of SSRM with different moisture content initially increases and then decreases with the rise of the fractal dimension of the fine particles. This trend aligns with the compaction curve of SSRM. By comparing the maximum dry density of SSRM with each P5 content obtained from the two curves (Figure 13), specifically taking P5 = 70%, the maximum dry density is 1.9500 and 1.9521, with only a 0.11% difference between them. This suggests that the fractal dimension of fine particles in SSRM effectively reflects the compaction characteristics of the material.
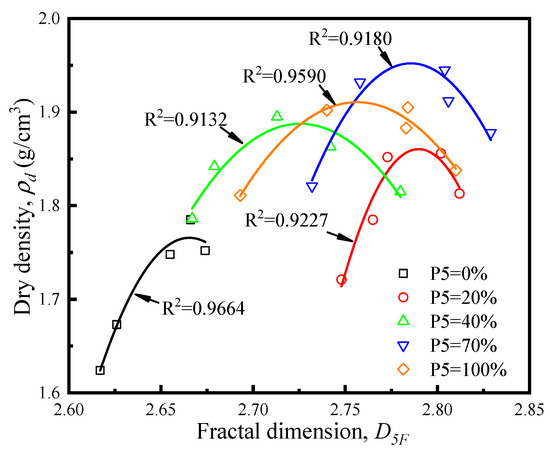
Figure 12.
The relationship between the dry density and fractal dimension of fine particles.

Figure 13.
Comparison of the maximum dry density obtained by the two curves.
4. Conclusions
In this study, the compaction and crushing characteristics of SSRM were investigated based on test results from compaction and screening tests involving various P5 content. An analysis was conducted considering the double fractal characteristics of SSRM, focusing on the influence of the fractal dimension of coarse and fine particles on particle crushing. The key conclusions are summarized below:
(1) For SSRM with different P5 content, the maximum dry density of SSRM reaches its peak when P5 equals 70%. The maximum dry density for SSRM with P5 content greater than 20% varies slightly, the minor difference is attributed to the tendency of the particle composition structure to become consistent after compaction.
(2) The total particle crushing index (Bg) is subdivided into coarse particle crushing index (Bg5C) and fine particle crushing index (Bg5F). For the same moisture content, the coarse particle crushing index increases with the rise of P5 content. However, the relationship between fine particle crushing index and P5 content exhibits a “double peak” form, with the first “spike” occurring when P5 equals 20%.
(3) SSRM displays distinctive double fractal characteristics, with a significant difference in the fractal dimension between coarse and fine particles. Post-compaction, the fractal dimension of both coarse and fine particles increases with higher moisture content, but the increasing trend is not pronounced, suggesting a similar particle structure under different moisture content conditions.
(4) A consistent pattern is observed in the fitting relationship between the fractal dimension of coarse particles and the crushing index. Specifically, there is minimal variation in the slope of the fitting curve with different P5 content, while the intercept decreases with increasing P5 content. A linear positive correlation is generally observed between fine particle crushing index and fractal dimension under different P5 content.
(5) The dry density of SSRM exhibits a high correlation with the fractal dimension of fine particles after compaction. Binomial fitting yields a high degree of correlation, with the fitting trend aligning with the compaction curve. Therefore, the fractal dimension of fine particles in SSRM effectively reflects its compaction characteristics.
The current study provides a practical insight into the compaction characteristics of SSRM. Compared with soil-hard rock mixture, SSRM exhibits a higher degree of crushing during compaction. The impact of compaction or tamping on SSRM is a crucial consideration in real filling engineering scenarios. The conclusion of the current study will contribute to the practical selection of SSRM mix ratios and analysis of compaction states in foundation engineering. Based on the test work in this manuscript, our future research will delve into exploring the mechanical properties of SSRM, including but not limited to UCS, CBR, DSS, etc., to further enhance our understanding of SSRM.
Author Contributions
Conceptualization, F.H. and K.Z. (Keneng Zhang); methodology, F.H. and K.Z. (Kaofei Zhu); validation, Y.H., Z.Z. and B.L.; formal analysis, F.H.; writing-original draft preparation, F.H.; writing-review and editing, F.H., B.L. and K.Z. (Kaofei Zhu); supervision, K.Z. (Keneng Zhang), Y.H. and Z.Z. All authors have read and agreed to the published version of the manuscript.
Funding
This research was funded by the National Natural Science Foundation of China (Grant No. 41972282) and the Fundamental Research Funds for Central Universities of Central South University (Grant No. 2023zzts0469 & 2021zzts0254).
Data Availability Statement
The raw data supporting the conclusions of this article will be made available by the authors on request.
Conflicts of Interest
The authors declare no conflict of interest.
References
- Xu, W.J.; Hu, R.L. Conception, classification and significations of soil-rock mixture. Hydrogeol. Eng. Geol. 2009, 36, 50–56+70. [Google Scholar]
- Xing, K.; Zhou, Z.; Yang, H.; Liu, B.C. Macro-meso freeze-thaw damage mechanism of soil-rock mixtures with different rock contents. Int. J. Pavement Eng. 2020, 21, 9–19. [Google Scholar] [CrossRef]
- He, Y.; Li, Y.Y.; Evans, T.J.; Yu, A.B.; Yang, R.Y. Effects of particle characteristics and consolidation pressure on the compaction of non-spherical particles. Miner. Eng. 2019, 137, 241–249. [Google Scholar] [CrossRef]
- Liu, H.D.; Liu, J.J.; Zhang, S.Y.; Feng, L.Y.; Qiu, L. Stress–strain and acoustic emission characteristics of cement-based materials used to simulate soft rock with fractures. Sci. Rep. 2022, 12, 7903. [Google Scholar] [CrossRef] [PubMed]
- Zou, J.F.; Sheng, Y.M.; Xia, Z.Q. Dynamic stress properties of dynamic compaction (DC) in a red-sandstone soil-rock mixture embankment. Environ. Earth Sci. 2017, 76, 411. [Google Scholar]
- Kang, S.; Kim, G.; Wi, J.; Ahn, T.; Lee, D.S.; Choi, H. Effect of Particle Breakage on Compaction and Thermal Resistivity of Concrete-based Recycled Aggregates. J. Korean Geotech. Soc. 2015, 31, 17–28. [Google Scholar] [CrossRef][Green Version]
- Zhang, H.Y.; Xu, W.J.; Yu, Y.Z. Triaxial tests of soil–rock mixtures with different rock block distributions. Soils Found. 2016, 56, 44–56. [Google Scholar] [CrossRef]
- Wu, M.Q.; Li, H.T.; Wang, L.; Yang, X.L.; Yang, N.; Yu, M.G. Compaction-deformation behaviors and breakage characteristics of loose broken coal under various stress-temperature coupling loads. Fuel 2023, 353, 129083. [Google Scholar] [CrossRef]
- Liu, Y.M.; Liu, H.B.; Mao, H.J. DEM investigation of the effect of intermediate principle stress on particle breakage of granular materials. Comput. Geotech. 2017, 84, 58–67. [Google Scholar] [CrossRef]
- Wang, L.; Zhu, J.G.; Zhang, Z.L.; Zheng, H.F. Effects of dry density on shear behavior and particle breakage for slate rockfill material. Bull. Eng. Geol. Environ. 2021, 80, 1181–1192. [Google Scholar] [CrossRef]
- Du, J.; Xiong, Z.M.; Shen, X.G.; Li, C.C. Experimental Study on the Effect of Coarse Grain Content on the Dilatancy and Particle Breakage Characteristics of Coarse-Grained Soils. Geofluids 2023, 2023, 2307881. [Google Scholar] [CrossRef]
- Pang, M.K.; Pan, H.Y.; Yang, S.H.; Zhu, S.P.; Zhang, T.J. Experimental Investigation of the Compaction-Crushing Characteristics of Graded Fractured Coal Gangue Based on Infill Mining. Fractal Fract. 2023, 7, 33. [Google Scholar] [CrossRef]
- Wang, L.Z.; Yin, M.G.; Kong, H.L.; Zhang, H.L. Experimental Study on Breakage Characteristics and Energy Dissipation of the Crushed Rock Grains. KSCE J. Civ. Eng. 2022, 26, 1465–1478. [Google Scholar] [CrossRef]
- Hashemnejad, A.; Aghda, S.M.F.; Talkhablou, M. Introducing a new classification of soft rocks based on the main geological and engineering aspects. Bull. Eng. Geol. Environ. 2021, 80, 4235–4254. [Google Scholar] [CrossRef]
- Bryson, L.S.; Mahmoodabadi, M.; Gomez-Gutierrez, I.C. Mechanical Behavior of Weathered Compacted Shales. Geotech. Geol. Eng. 2023. [Google Scholar] [CrossRef]
- Zhang, C.; Liu, J.B.; Zhao, Y.X.; Han, P.H.; Zhang, L. Numerical Simulation of Broken Coal Strength Influence on Compaction Characteristics in Goaf. Nat. Resour. Res. 2020, 29, 2495–2511. [Google Scholar] [CrossRef]
- Zhang, C.; Ren, Z.P.; Hao, D.Y.; Zhang, T. Numerical Simulation of Particle Size Influence on the Breakage Mechanism of Broken Coal. Arab. J. Sci. Eng. 2020, 45, 9171–9185. [Google Scholar] [CrossRef]
- Bai, J.W.; Tang, H.F.; Hu, J.; Yang, L.Y.; Guo, T.C.; Zhang, Z.Q. Characteristics and Controlling Factors of Particle Crushing in Volcaniclastic Sediments under Compaction: The Quaternary Pyroclastic Deposits of Hongtu Hill, Changbaishan Area, Northeastern China. Minerals 2023, 13, 1351. [Google Scholar] [CrossRef]
- Zhang, J.X.; Li, M.; Liu, Z.; Zhou, N. Fractal characteristics of crushed particles of coal gangue under compaction. Powder Technol. 2017, 305, 12–18. [Google Scholar] [CrossRef]
- Li, Z.; Yang, X.J.; Yang, P.; Feng, G.R.; Liu, J.Y.; Zhu, C.Q.; Cheng, X. Layered re-breaking behavior of gangue backfilling materials and inspirations for protecting mined ecological environments. Constr. Build Mater. 2023, 368, 130477. [Google Scholar] [CrossRef]
- Li, B.; Liang, Y.P.; Zhang, L.; Zou, Q.L. Breakage law and fractal characteristics of broken coal and rock masses with different mixing ratios during compaction. Energy Sci. Eng. 2019, 7, 1000–1015. [Google Scholar] [CrossRef]
- Li, B.; Liang, Y.P.; Zhang, L.; Zou, Q.L. Experimental investigation on compaction characteristics and permeability evolution of broken coal. Int. J. Rock Mech. Min. 2019, 118, 63–76. [Google Scholar] [CrossRef]
- ASTM-D698; Standard Test Methods for Laboratory Compaction Characteristics of Soil Using Standard Effort (12,400 ft-lbf/ft3 (600 kN-m/m3)). ASTM: West Conshohocken, PA, USA, 2012.
- GS/T 50123-2019; Ministry of Housing and Urban-Rural Development of the People’s Republic of China. Standard for Geotechnical Testing Method. China Planning Press: Beijing, China, 2019.
- Zhao, Y.X.; Liu, Z.X. Study of Material Composition Effects on the Mechanical Properties of Soil-Rock Mixtures. Adv. Civ. Eng. 2018, 2018, 3854727. [Google Scholar] [CrossRef]
- Yang, Z.P.; Li, J.; Liu, H.Y.; Zhang, Y.M.; Liu, X.R. Influence of the block stone size on shear mechanical behavior of soil-rock mixture-bedrock interface. Rock Soil Mech. 2023, 44, 965–974. [Google Scholar]
- Han, H.X.; Li, J.; Shi, J.C.; Yang, C.N. Influence of Scale Effect on Strength and Deformation Characteristics of Rockfill Materials. Materials 2022, 15, 5467. [Google Scholar] [CrossRef] [PubMed]
- Medley, E.W.; Zekkos, D. Geopractitioner approaches to working with antisocial mélanges. Geol. Soc. Am. Spec. Pap. 2011, 480, 261–277. [Google Scholar]
- Wang, Q.; Hu, X.L.; Xu, Y.; Zhou, C.; Xu, C. Investigation on compaction characteristics and meso-mechanism of soil-rock mixture with soft rock blocks. J. Zhejiang Univ. (Eng. Sci.) 2018, 52, 2295–2305. [Google Scholar]
- ASTM-D4718; Standard Practice for Correction of Unit Weight and Water Content for Soils Containing Oversize Particles. ASTM: West Conshohocken, PA, USA, 2015.
- Feda, J. Notes on the effect of grain crushing on the granular soil behaviour. Eng. Geol. 2002, 63, 93–98. [Google Scholar] [CrossRef]
- Liu, Y.; Sun, S.R.; Wei, J.H.; Song, J.L.; Yu, Y.X.; He, W.; Zhang, J.X. Mechanical characteristics of soil-rock mixtures containing macropore structure based on 3D modeling technology. J. Mt. Sci. 2020, 17, 2224–2240. [Google Scholar] [CrossRef]
- Ji, X.P.; Lu, H.L.; Dai, C.; Ye, Y.G.; Cui, Z.F.; Xiong, Y. Characterization of Properties of Soil–Rock Mixture Prepared by the Laboratory Vibration Compaction Method. Sustainability 2021, 13, 11239. [Google Scholar] [CrossRef]
- Ji, X.P.; Han, B.; Hu, J.M.; Li, S.W.; Xiong, Y.; Sun, E.Y. Application of the discrete element method and CT scanning to investigate the compaction characteristics of the soil–rock mixture in the subgrade. Road Mater. Pavement Des. 2022, 23, 397–413. [Google Scholar] [CrossRef]
- Yan, X.; Zhan, W.; Hu, Z.; Yu, Y.Q.; Xiao, D.Q. Experimental Study on the Effect of Compaction Work and Defect on the Strength of Soil-Rock Mixture Subgrade. Adv. Mater. Sci. Eng. 2021, 2021, 5533590. [Google Scholar] [CrossRef]
- Mandelbrot, B.B. Fractal Analysis and Synthesis of Fracture Surface Roughness and Related Forms of Complexity and Disorder. Int. J. Fract. 2006, 138, 13–17. [Google Scholar] [CrossRef]
- Shi, X.S.; Cheng, Z.L. Fractal behavior in crushing of rockfill material. Chin. J. Rock Mech. Eng. 2010, 29, 3852–3857. [Google Scholar]
- Zhang, P.; Jin, L.; Du, X.L.; Lu, D.C. Computational homogenization for mechanical properties of sand cobble stratum based on fractal theory. Eng. Geol. 2018, 232, 82–93. [Google Scholar] [CrossRef]
- Fu, X.D.; Ding, H.F.; Sheng, Q.; Zhang, Z.P.; Yin, D.W.; Chen, F. Fractal Analysis of Particle Distribution and Scale Effect in a Soil-Rock Mixture. Fractal Fract. 2022, 6, 120. [Google Scholar] [CrossRef]
- Tasdemir, A. Fractal evaluation of particle size distributions of chromites in different comminution environments. Miner. Eng. 2009, 22, 156–167. [Google Scholar] [CrossRef]
- Zhang, Z.P.; Fu, X.D.; Yuan, W.; Sheng, Q.; Chai, S.B.; Du, Y.X. The Influence of the Fractal Dimension on the Mechanical Behaviors of the Soil–Rock Mixture: A Case Study from Southwest China. Fractal Fract. 2023, 7, 106. [Google Scholar] [CrossRef]
- Tu, Y.L.; Liu, X.R.; Ren, Q.Y.; Chai, H.J.; Wang, J.B.; Yu, J.Y. Effects of rock contents and particle breakage on strength characteristics of soil-rock aggregate. Rock Soil Mech. 2020, 41, 3919–3928. [Google Scholar]
- Bonagiri, V.; Arif, A.B.M.; Ateekh, U.R.; Bhaskar, C.S.C. Shear, Consolidation Characteristics and Carbon Footprint Analysis of Clayey Soil Blended with Calcium Lignosulphonate and Granite Sand for Earthen Dam Application. Sustainability 2023, 15, 6117. [Google Scholar]
- Romana, M.R.; Arif, A.B.M.; Sathyanarayanan, R.; Abdullah, A. Sustainable assessment and carbon footprint analysis of polysaccharide biopolymer-amended soft soil as an alternate material to canal lining. Front. Environ. Sci. 2023, 11, 1214988. [Google Scholar]
- Marsal, R.J. Coarse-scale testing of rockfills materials. J. Soil Mech. Found. Eng. ASCE 1967, 93, 27–44. [Google Scholar] [CrossRef]
- Wang, J.J.; Cheng, Y.Z.; Zhang, H.P.; Deng, D.P. Effects of particle size on compaction behavior and particle crushing of crushed sandstone-mudstone particle mixture. Environ. Earth Sci. 2015, 73, 8053–8059. [Google Scholar] [CrossRef]
- Wu, D.T.; Guo, W.B.; Luo, F.; Li, M. Simulation experimental investigations on particle breakage mechanism and fractal characteristics of mixed size gangue backfill materials. J. Mater. Res. Technol-JMRT 2023, 24, 125–142. [Google Scholar] [CrossRef]
- Zhang, M.; Zhang, S.L.; Xu, Y.; Zhang, W.L.; Yuan, C.W.; Xie, H.L. Study on correlation between fractal characteristics and shear strength of bimsoils. Bull. Eng. Geol. Environ. 2023, 82, 338. [Google Scholar] [CrossRef]
Disclaimer/Publisher’s Note: The statements, opinions and data contained in all publications are solely those of the individual author(s) and contributor(s) and not of MDPI and/or the editor(s). MDPI and/or the editor(s) disclaim responsibility for any injury to people or property resulting from any ideas, methods, instructions or products referred to in the content. |
© 2024 by the authors. Licensee MDPI, Basel, Switzerland. This article is an open access article distributed under the terms and conditions of the Creative Commons Attribution (CC BY) license (https://creativecommons.org/licenses/by/4.0/).