
Dynamic Black–Litterman Portfolios Incorporating Asymmetric Fractal Uncertainty


Abstract
1. Introduction
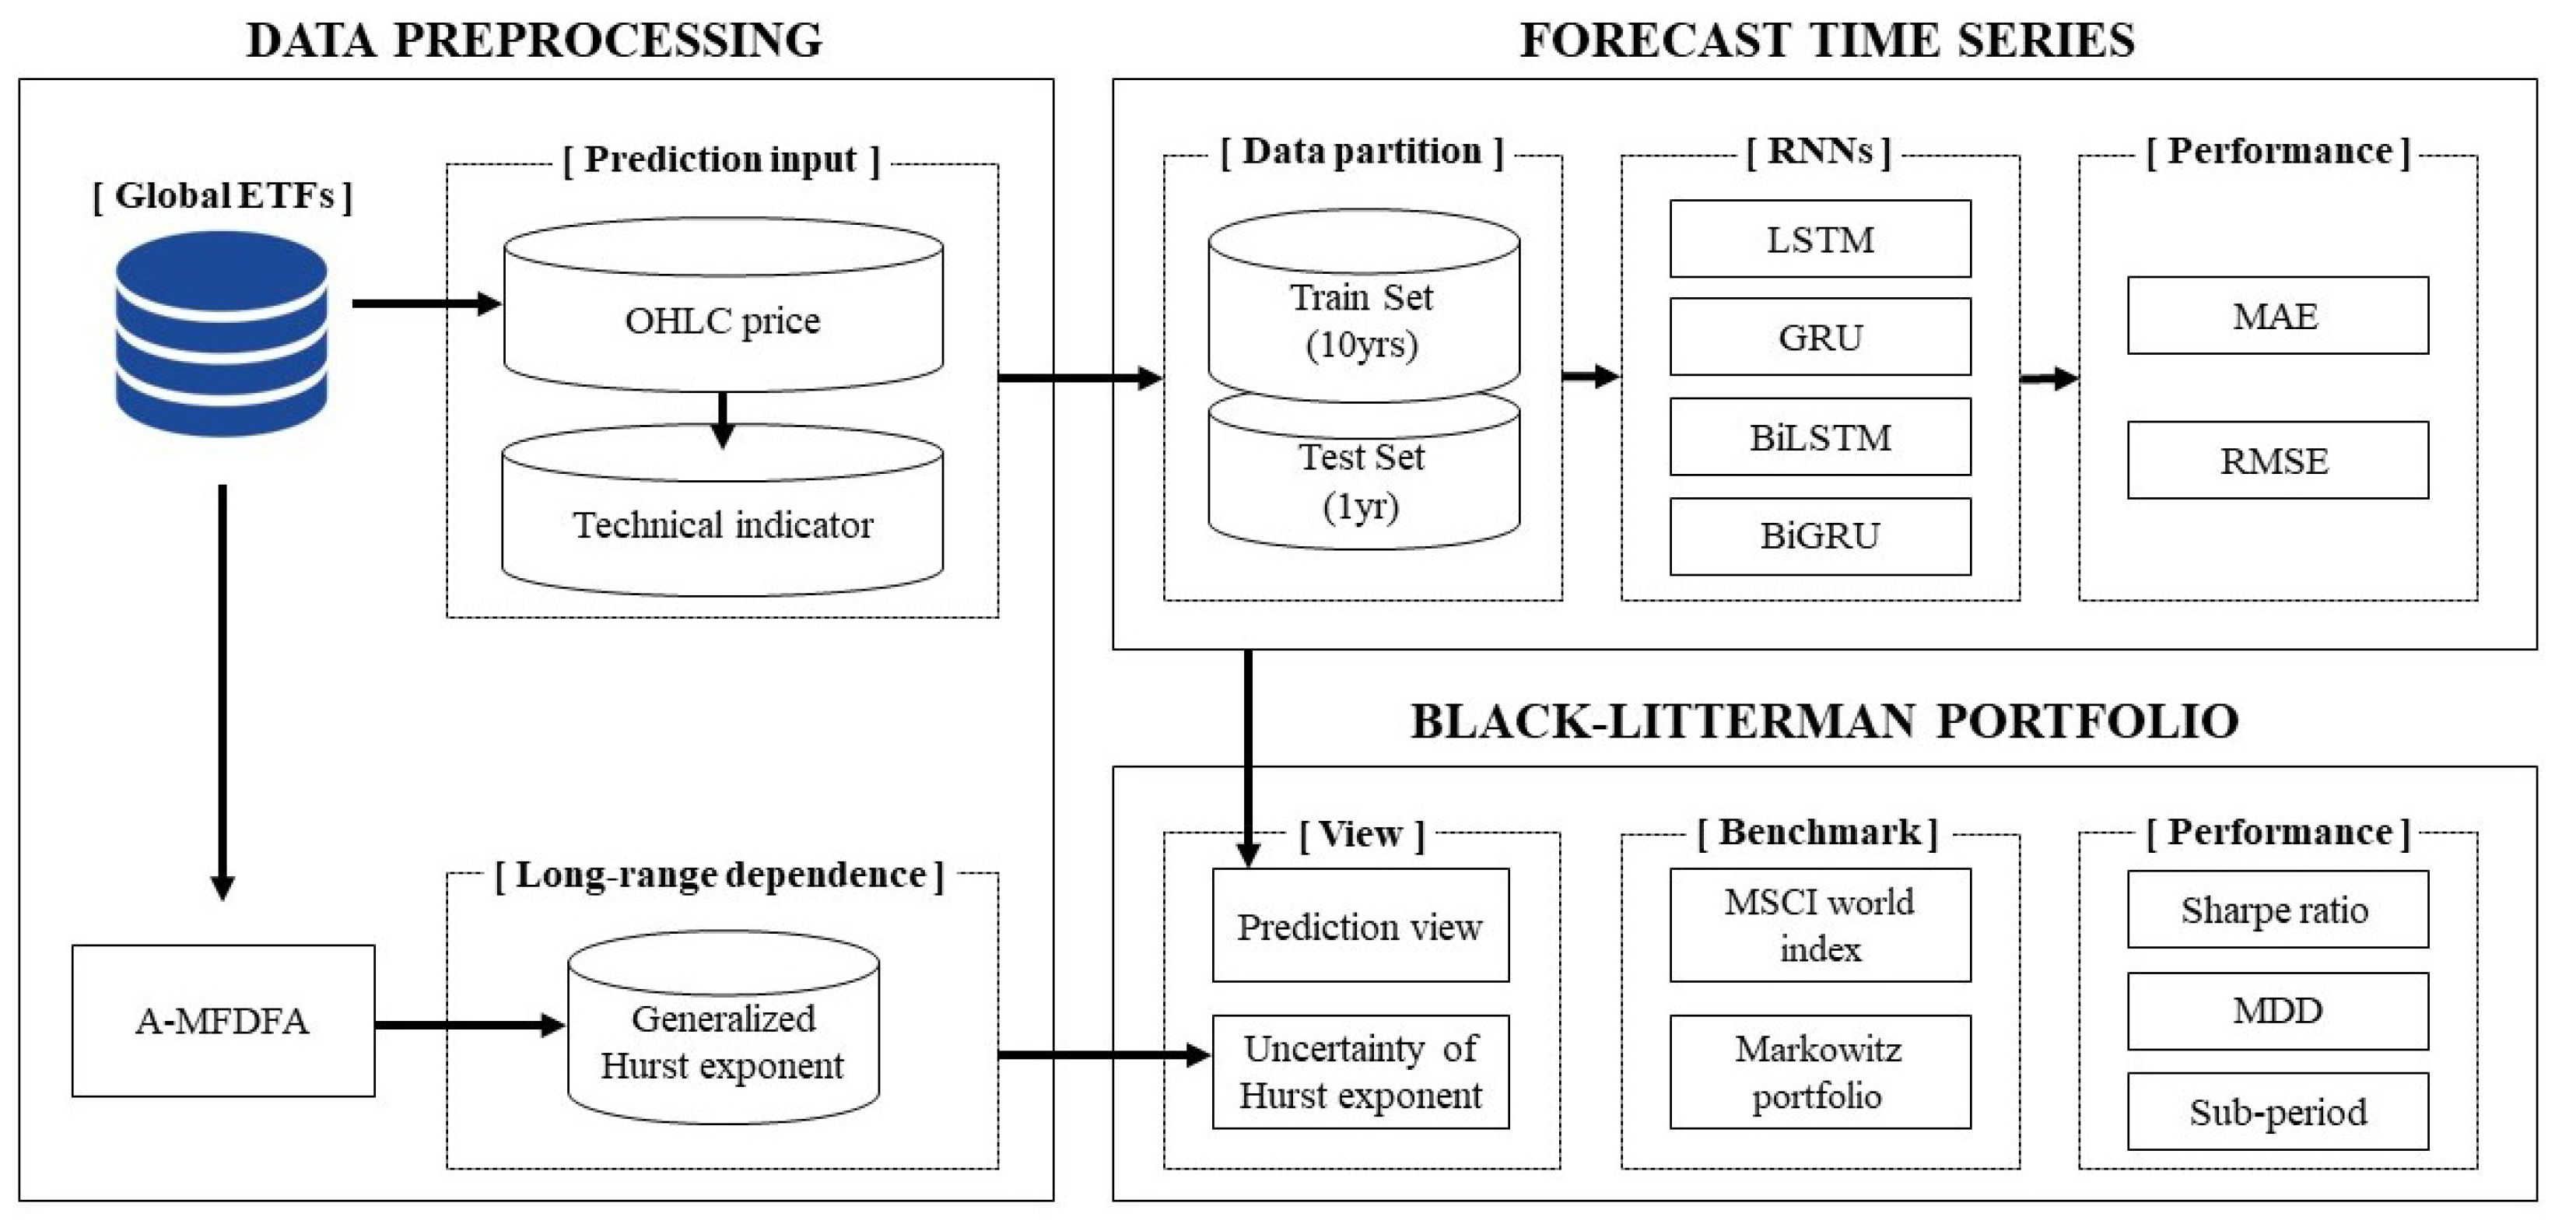
2. Methods
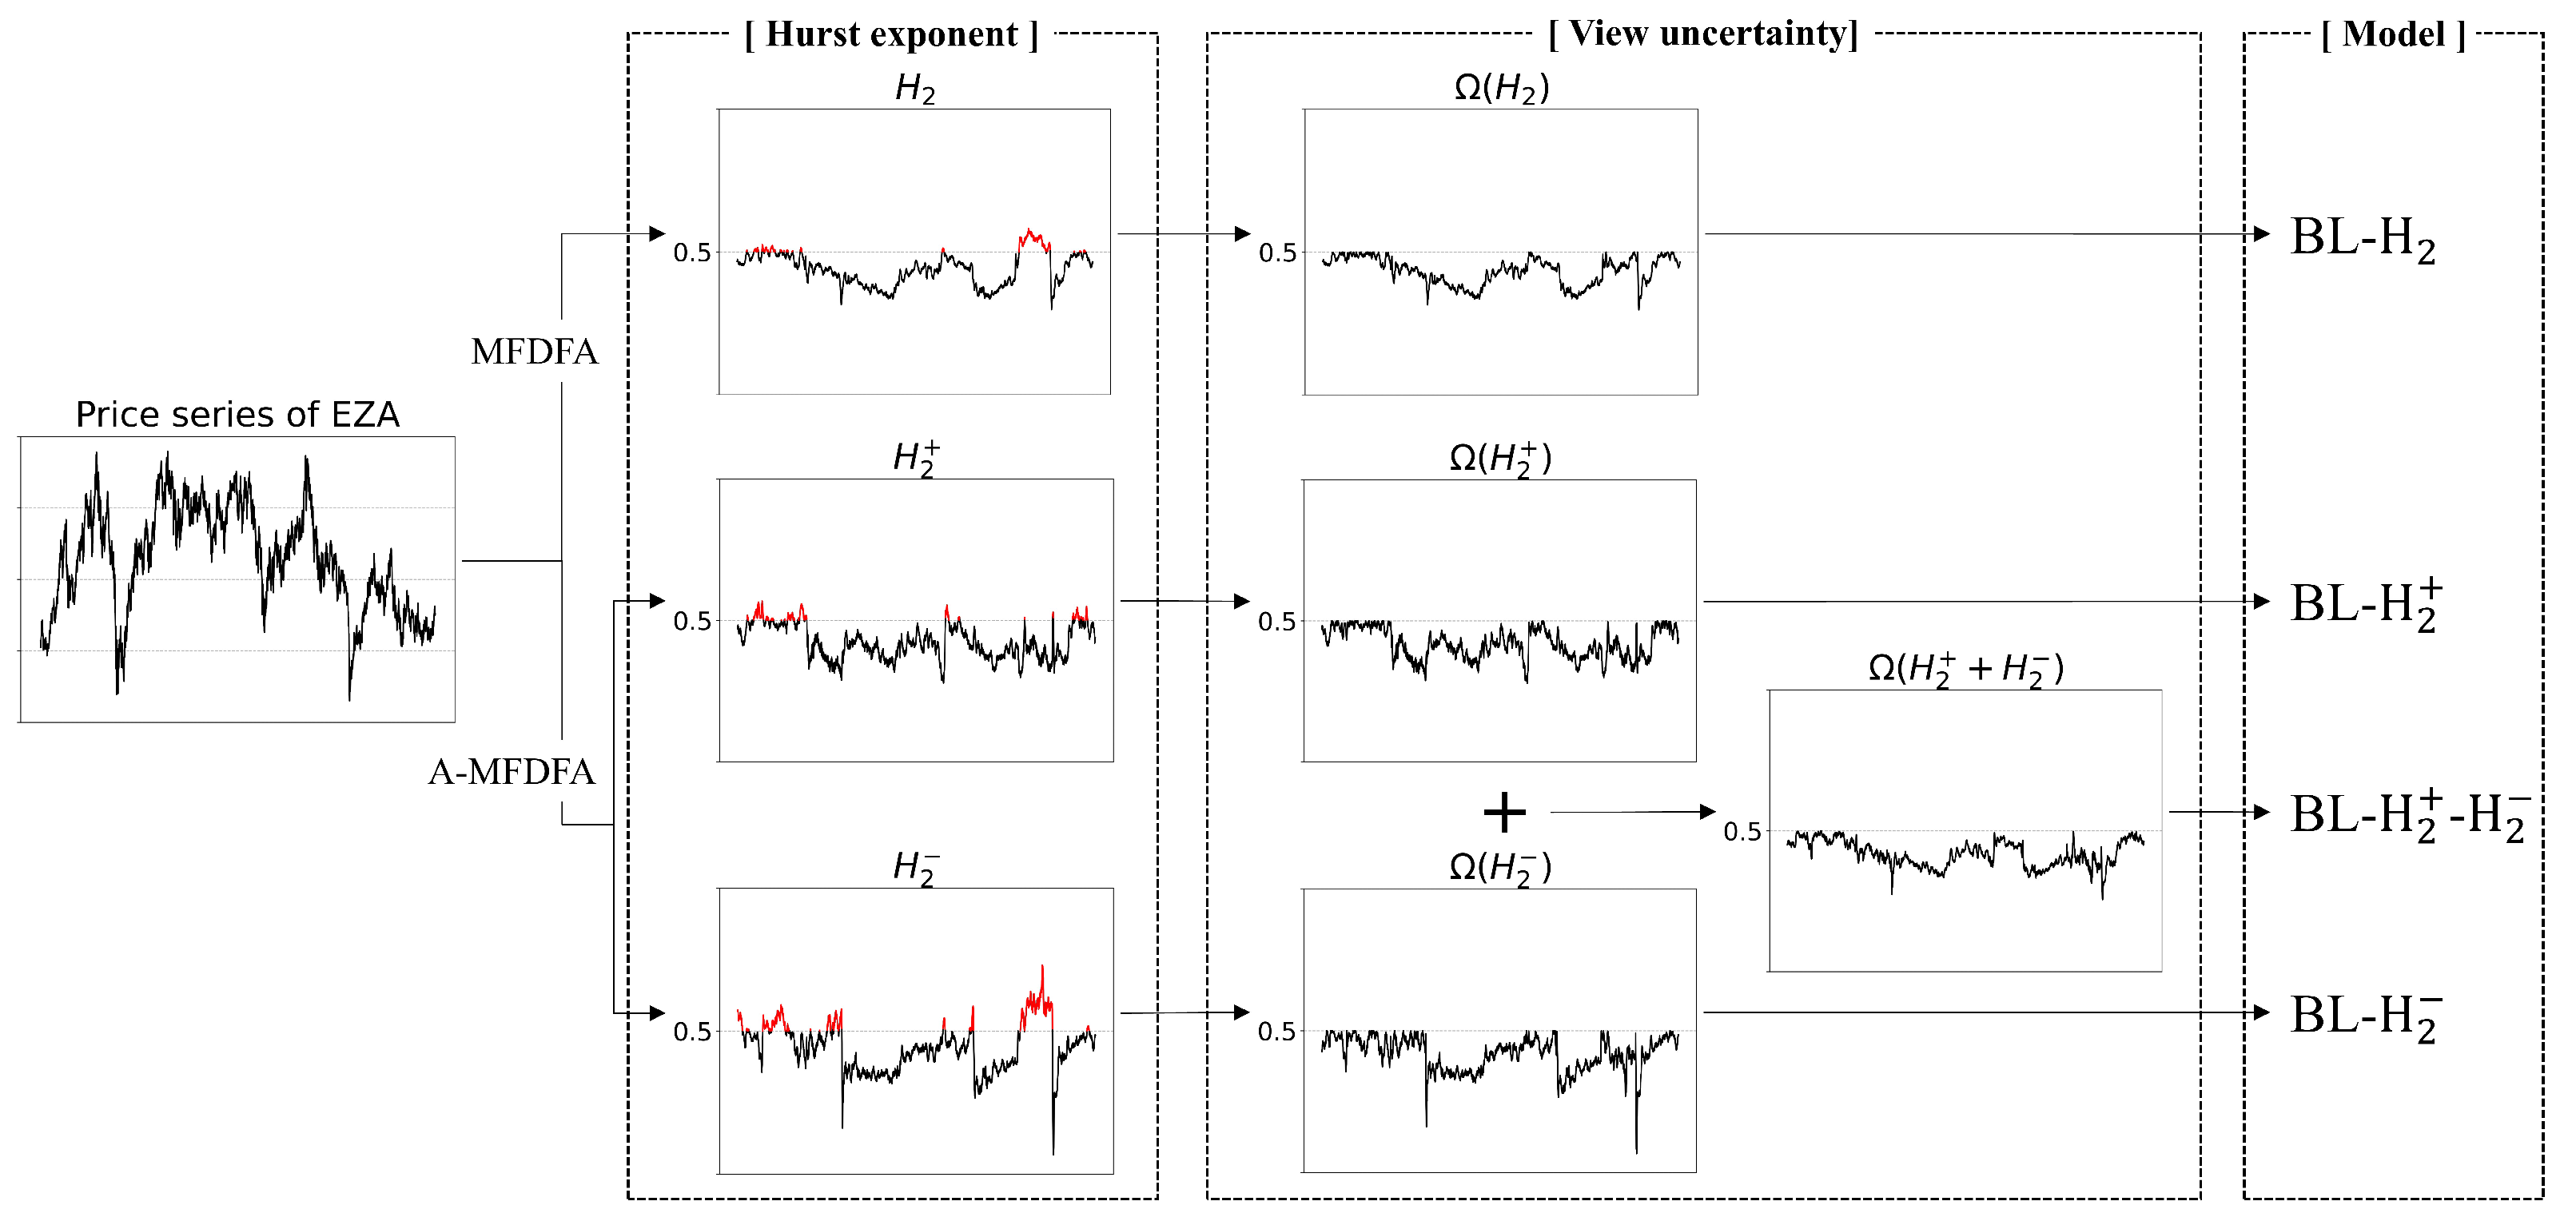
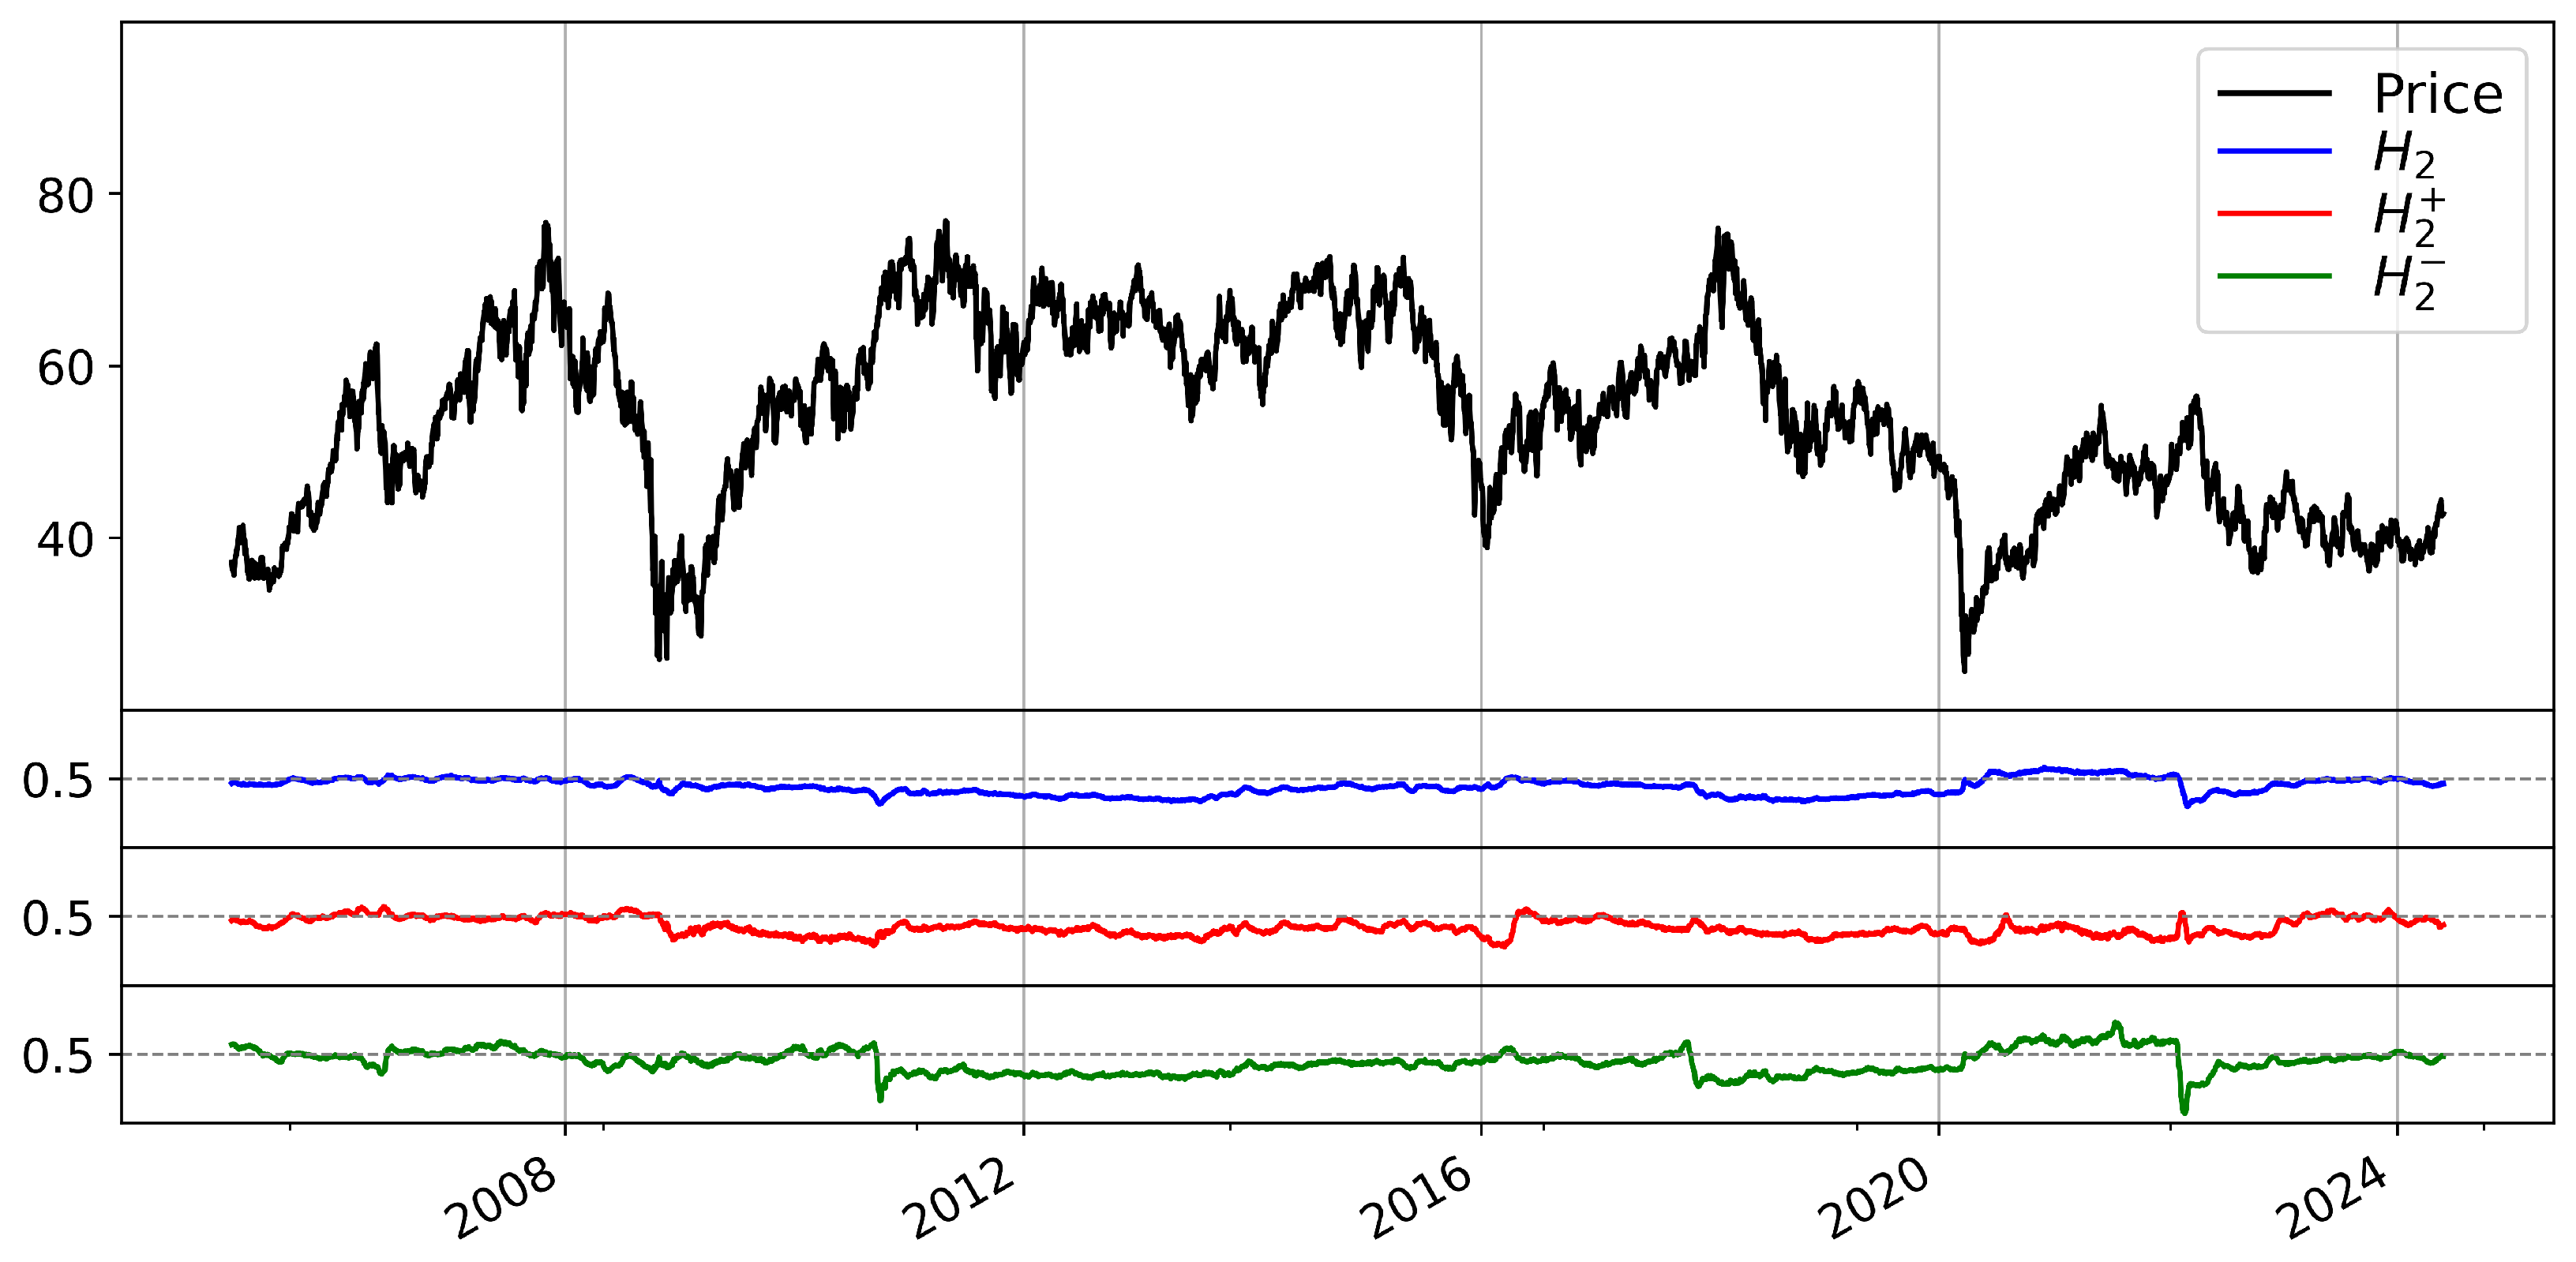
2.1. Asymmetric Fractality of the ETF Price Series
2.2. Recurrent Neural Network Group
2.3. Black–Litterman Portfolio with Asymmetric Fractality
| Algorithm 1 Black–Litterman portfolio with asymmetric fractality |
Input: price series of ith ETF Output: portfolio weight with 10 ETFs
|
3. Experiments and Data
3.1. Experiments
3.2. Data
4. Results
4.1. Prediction Results
4.2. Portfolio Evaluation
5. Discussion and Conclusions
Author Contributions
Funding
Data Availability Statement
Conflicts of Interest
Abbreviations
| BL | Black–Litterman (portfolio) |
| ETF | exchange-traded fund |
| EMH | efficient market hypothesis |
| MFDFA | multifractal detrended fluctuation analysis |
| A-MFDFA | asymmetric multifractal detrended fluctuation analysis |
| RNN | recurrent neural network |
| LSTM | long short-term memory |
| GRU | gated recurrent unit |
| BiLSTM | bidirectional long short-term memory |
| BiGRU | bidirectional gated recurrent unit |
| MAE | mean absolute error |
| RMSE | root mean squared error |
| MDD | maximum drawdown |
Appendix A

References
- Fama, E.F. Efficient capital markets: A review of theory and empirical work. J. Financ. 1970, 25, 383–417. [Google Scholar] [CrossRef]
- Tiwari, A.K.; Aye, G.C.; Gupta, R. Stock market efficiency analysis using long spans of data: A multifractal detrended fluctuation approach. Financ. Res. Lett. 2019, 28, 398–411. [Google Scholar] [CrossRef]
- Brouty, X.; Garcin, M. A statistical test of market efficiency based on information theory. Quant. Financ. 2023, 23, 1003–1018. [Google Scholar] [CrossRef]
- Yaya, O.S.; Adekoya, O.B.; Vo, X.V.; Al-Faryan, M.A.S. Stock Market Efficiency in Asia: Evidence from the Narayan–Liu–Westerlund’s GARCH-based unit root test. Int. J. Financ. Econ. 2024, 29, 91–101. [Google Scholar] [CrossRef]
- Saâdaoui, F. Skewed multifractal scaling of stock markets during the COVID-19 pandemic. Chaos Solitons Fractals 2023, 170, 113372. [Google Scholar] [CrossRef] [PubMed]
- Cho, P.; Lee, M. Forecasting the Volatility of the Stock Index with Deep Learning Using Asymmetric Hurst Exponents. Fractal Fract. 2022, 6, 394. [Google Scholar] [CrossRef]
- Hurst, H.E. Long-Term Storage Capacity of Reservoirs. Trans. Am. Soc. Civ. Eng. 1951, 116, 770–799. [Google Scholar] [CrossRef]
- Peng, C.K.; Buldyrev, S.V.; Havlin, S.; Simons, M.; Stanley, H.E.; Goldberger, A.L. Mosaic organization of DNA nucleotides. Phys. Rev. E 1994, 49, 1685–1689. [Google Scholar] [CrossRef]
- Li, Y. Multifractal Characteristics of China’s Stock Market and Slump’s Fractal Prediction. Fractal Fract. 2022, 6, 499. [Google Scholar] [CrossRef]
- Ameer, S.; Nor, S.M.; Ali, S.; Zawawi, N.H.M. The Impact of COVID-19 on BRICS and MSCI Emerging Markets Efficiency: Evidence from MF-DFA. Fractal Fract. 2023, 7, 519. [Google Scholar] [CrossRef]
- Choi, S.Y. Analysis of stock market efficiency during crisis periods in the US stock market: Differences between the global financial crisis and COVID-19 pandemic. Phys. A Stat. Mech. Its Appl. 2021, 574, 125988. [Google Scholar] [CrossRef]
- Wang, F.; Chang, J.; Zuo, W.; Zhou, W. Research on Efficiency and Multifractality of Gold Market under Major Events. Fractal Fract. 2024, 8, 488. [Google Scholar] [CrossRef]
- Lee, M.; Song, J.W.; Park, J.H.; Chang, W. Asymmetric multi-fractality in the U.S. stock indices using index-based model of A-MFDFA. Chaos Solitons Fractals 2017, 97, 28–38. [Google Scholar] [CrossRef]
- Lee, M.; Song, J.W.; Kim, S.; Chang, W. Asymmetric market efficiency using the index-based asymmetric-MFDFA. Phys. A Stat. Mech. Its Appl. 2018, 512, 1278–1294. [Google Scholar] [CrossRef]
- Naeem, M.A.; Yousaf, I.; Karim, S.; Tiwari, A.K.; Farid, S. Comparing asymmetric price efficiency in regional ESG markets before and during COVID-19. Econ. Model. 2023, 118, 106095. [Google Scholar] [CrossRef]
- Khurshid, A.; Khan, K.; Cifuentes-Faura, J.; Chen, Y. Asymmetric multifractality: Comparative efficiency analysis of global technological and renewable energy prices using MFDFA and A-MFDFA approaches. Energy 2024, 289, 130106. [Google Scholar] [CrossRef]
- Belhoula, M.M.; Mensi, W.; Al-Yahyaee, K.H. Dynamic speculation and efficiency in European natural gas markets during the COVID-19 and Russia-Ukraine crises. Resour. Policy 2024, 98, 105362. [Google Scholar] [CrossRef]
- Yang, J.; Feng, Y. Market inefficiency spillover network across different regimes. Financ. Res. Lett. 2023, 58, 104577. [Google Scholar] [CrossRef]
- Lee, M.; Cho, Y.; Ock, S.E.; Song, J.W. Analyzing Asymmetric Volatility and Multifractal Behavior in Cryptocurrencies Using Capital Asset Pricing Model Filter. Fractal Fract. 2023, 7, 85. [Google Scholar] [CrossRef]
- Wang, M.; Zhong, C.; Yue, K.; Zheng, Y.; Jiang, W.; Wang, J. Modified MF-DFA Model Based on LSSVM Fitting. Fractal Fract. 2024, 8, 320. [Google Scholar] [CrossRef]
- Wang, L.; Lee, R.S.T. Stock Index Return Volatility Forecast via Excitatory and Inhibitory Neuronal Synapse Unit with Modified MF-ADCCA. Fractal Fract. 2023, 7, 292. [Google Scholar] [CrossRef]
- Cabezas-Rivas, E.; Sánchez-Coll, F.; Tormo-Xaixo, I. Chance or Chaos? Fractal Geometry Aimed to Inspect the Nature of Bitcoin. Fractal Fract. 2023, 7, 870. [Google Scholar] [CrossRef]
- Kojić, M.; Mitić, P.; Minović, J. Gold and Sustainable Stocks in the US and EU: Nonlinear Analysis Based on Multifractal Detrended Cross-Correlation Analysis and Granger Causality. Fractal Fract. 2023, 7, 738. [Google Scholar] [CrossRef]
- Bildirici, M.; Ucan, Y.; Tekercioglu, R. A Hybrid Approach Combining the Lie Method and Long Short-Term Memory (LSTM) Network for Predicting the Bitcoin Return. Fractal Fract. 2024, 8, 413. [Google Scholar] [CrossRef]
- Hu, H.; Zhao, C.; Li, J.; Huang, Y. Stock Prediction Model Based on Mixed Fractional Brownian Motion and Improved Fractional-Order Particle Swarm Optimization Algorithm. Fractal Fract. 2022, 6, 560. [Google Scholar] [CrossRef]
- Yang, C.; Huang, R.; Liu, D.; Qiu, W.; Zhang, R.; Tang, Y. Analysis and Warning Prediction of Tunnel Deformation Based on Multifractal Theory. Fractal Fract. 2024, 8, 108. [Google Scholar] [CrossRef]
- Black, F.; Litterman, R. Global Portfolio Optimization. Financ. Anal. J. 1992, 48, 28–43. [Google Scholar] [CrossRef]
- Barua, R.; Sharma, A.K. Dynamic Black Litterman portfolios with views derived via CNN-BiLSTM predictions. Financ. Res. Lett. 2022, 49, 103111. [Google Scholar] [CrossRef]
- Zhu, E.; Yen, J. Enhancing Portfolio Optimization with Transformer-GAN Integration: A Novel Approach in the Black-Litterman Framework. arXiv 2024, arXiv:2404.02029. [Google Scholar]
- Li, T.; Chen, P. Asset allocation combining macro and micro information–Empirical test based on entropy pool model. Financ. Res. Lett. 2024, 64, 105470. [Google Scholar] [CrossRef]
- Zhang, D.; Dai, X.; Xue, J. Incorporating weather information into commodity portfolio optimization. Financ. Res. Lett. 2024, 66, 105672. [Google Scholar] [CrossRef]
- Barua, R.; Sharma, A.K. Using fear, greed and machine learning for optimizing global portfolios: A Black-Litterman approach. Financ. Res. Lett. 2023, 58, 104515. [Google Scholar] [CrossRef]
- Teplova, T.; Evgeniia, M.; Munir, Q.; Pivnitskaya, N. Black-Litterman model with copula-based views in mean-CVaR portfolio optimization framework with weight constraints. Econ. Chang. Restruct. 2023, 56, 515–535. [Google Scholar] [CrossRef]
- Fuhrer, A.; Hock, T. Uncertainty in the Black–Litterman model: Empirical estimation of the equilibrium. J. Empir. Financ. 2023, 72, 251–275. [Google Scholar] [CrossRef]
- Markowitz, H. PORTFOLIO SELECTION*. J. Financ. 1952, 7, 77–91. [Google Scholar] [CrossRef]
- Connor, J.; Martin, R.; Atlas, L. Recurrent neural networks and robust time series prediction. IEEE Trans. Neural Netw. 1994, 5, 240–254. [Google Scholar] [CrossRef] [PubMed]
- Hochreiter, S.; Schmidhuber, J. Long Short-Term Memory. Neural Comput. 1997, 9, 1735–1780. [Google Scholar] [CrossRef]
- Chung, J.; Gulcehre, C.; Cho, K.; Bengio, Y. Empirical Evaluation of Gated Recurrent Neural Networks on Sequence Modeling. arXiv 2014, arXiv:1412.3555. [Google Scholar] [CrossRef]
- Graves, A.; Schmidhuber, J. Framewise phoneme classification with bidirectional LSTM and other neural network architectures. Neural Networks 2005, 18, 602–610. [Google Scholar] [CrossRef]
- Cho, K.; van Merrienboer, B.; Gulcehre, C.; Bahdanau, D.; Bougares, F.; Schwenk, H.; Bengio, Y. Learning Phrase Representations using RNN Encoder-Decoder for Statistical Machine Translation. arXiv 2014, arXiv:1406.1078. [Google Scholar] [CrossRef]
- Fabozzi, F.J.; Focardi, S.M.; Kolm, P.N. Incorporating trading strategies in the Black-Litterman framework. J. Trading 2006, 1, 28–37. [Google Scholar] [CrossRef]
- Satchell, S.; Scowcroft, A. 3—A demystification of the Black-Litterman model: Managing quantitative and traditional portfolio construction. In Forecasting Expected Returns in the Financial Markets; Satchell, S., Ed.; Academic Press: Oxford, UK, 2007; pp. 39–53. [Google Scholar] [CrossRef]
- Kolm, P.; Ritter, G. On the Bayesian interpretation of Black–Litterman. Eur. J. Oper. Res. 2017, 258, 564–572. [Google Scholar] [CrossRef]
- He, G.; Litterman, R. The Intuition Behind Black-Litterman Model Portfolios. 2002. Available online: https://papers.ssrn.com/sol3/papers.cfm?abstract_id=334304 (accessed on 1 August 2024).
- Idzorek, T. 2—A step-by-step guide to the Black-Litterman model: Incorporating user-specified confidence levels. In Forecasting Expected Returns in the Financial Markets; Satchell, S., Ed.; Academic Press: Oxford, UK, 2007; pp. 17–38. [Google Scholar] [CrossRef]
- Han, Y.; Li, J. The impact of global economic policy uncertainty on portfolio optimization: A Black–Litterman approach. Int. Rev. Financ. Anal. 2023, 86, 102476. [Google Scholar] [CrossRef]
- Martin, R.A. PyPortfolioOpt: Portfolio optimization in Python. J. Open Source Softw. 2021, 6, 3066. [Google Scholar] [CrossRef]
- Dessain, J. Machine learning models predicting returns: Why most popular performance metrics are misleading and proposal for an efficient metric. Expert Syst. Appl. 2022, 199, 116970. [Google Scholar] [CrossRef]

| Hyperparameter | Search Space |
|---|---|
| Number of layer | [1, 2, 3] |
| Number of neurons | [32, 64, 128, 256, 512] |
| Dropout rate | [0, 0.1, 0.2, 0.3, 0.4, 0.5] |
| Activation function | [tanh, ReLU] |
| Optimizer | Adam |
| Batch size | [32, 64] |
| Epochs | 100 |
| Ticker | MSCI Country ETFs |
|---|---|
| EWA | iShares MSCI Australia |
| EWC | iShares MSCI Canada |
| EWG | iShares MSCI Germany |
| EWJ | iShares MSCI Japan |
| EWT | iShares MSCI Taiwan |
| EWU | iShares MSCI United Kingdom |
| EWW | iShares MSCI Mexico |
| EWY | iShares MSCI South Korea |
| EWZ | iShares MSCI Brazil |
| EZA | iShares MSCI South Africa |
| ETF | Mean | Max | Min | Standard Deviation | Skewness | Kurtosis | Jarque– Bera Test | ADF Test 1 |
|---|---|---|---|---|---|---|---|---|
| EWA | 0.0003 | 0.2075 | −0.1611 | 0.0171 | −0.03 | 13.82 | 42,664.9 * | −18.4 * |
| EWC | 0.0003 | 0.1286 | −0.1332 | 0.0138 | −0.45 | 11.30 | 28,715.1 * | −14.2 * |
| EWG | 0.0004 | 0.1979 | −0.1269 | 0.0159 | 0.05 | 11.73 | 30,765.2 * | −16.2 * |
| EWJ | 0.0003 | 0.1582 | −0.1041 | 0.0129 | 0.18 | 10.37 | 24,072.8 * | −17.8 * |
| EWT | 0.0003 | 0.1416 | −0.1563 | 0.0164 | −0.17 | 8.86 | 17,574.6 * | −14.9 * |
| EWU | 0.0002 | 0.1706 | −0.1202 | 0.0142 | −0.25 | 14.61 | 47,735.4 * | −16.6 * |
| EWW | 0.0005 | 0.2149 | −0.1525 | 0.0171 | 0.06 | 10.51 | 24,689.1 * | −16.2 * |
| EWY | 0.0004 | 0.2242 | −0.1581 | 0.0192 | 0.59 | 15.77 | 55,843.7 * | −16.3 * |
| EWZ | 0.0005 | 0.2558 | −0.2309 | 0.0237 | −0.24 | 9.87 | 21,836.5 * | −17.1 * |
| EZA | 0.0004 | 0.2292 | −0.2008 | 0.0213 | −0.07 | 9.14 | 18,669.6 * | −17.0 * |
| Ticker | LSTM | BiLSTM | GRU | BiGRU |
|---|---|---|---|---|
| EWA | 0.4446 | 0.4056 | 0.3024 | 0.4830 |
| EWC | 0.7288 | 0.6832 | 0.7486 | 1.0484 |
| EWG | 0.5057 | 0.5707 | 0.3995 | 0.4526 |
| EWJ | 0.8806 | 1.0497 | 0.8528 | 0.9151 |
| EWT | 1.9431 | 1.5749 | 2.2252 | 1.8637 |
| EWU | 0.5175 | 0.6803 | 0.5683 | 0.5359 |
| EWW | 1.0188 | 1.2924 | 0.9032 | 0.9651 |
| EWY | 1.8421 | 1.4657 | 1.2411 | 1.4163 |
| EWZ | 1.1970 | 1.2120 | 1.1880 | 0.9775 |
| EZA | 1.0658 | 1.1811 | 1.0804 | 1.1062 |
| Mean | 1.0144 | 1.0116 | 0.9510 | 0.9764 |
| Ticker | LSTM | BiLSTM | GRU | BiGRU |
|---|---|---|---|---|
| EWA | 0.5470 | 0.5039 | 0.3991 | 0.5825 |
| EWC | 0.8831 | 0.8524 | 0.9563 | 1.2546 |
| EWG | 0.6391 | 0.6966 | 0.5102 | 0.5821 |
| EWJ | 1.1018 | 1.2694 | 1.0577 | 1.1252 |
| EWT | 2.2230 | 1.7876 | 2.5269 | 2.1602 |
| EWU | 0.6629 | 0.8258 | 0.7214 | 0.6911 |
| EWW | 1.2755 | 1.5547 | 1.1270 | 1.2422 |
| EWY | 2.1501 | 1.8247 | 1.5557 | 1.7773 |
| EWZ | 1.5004 | 1.4797 | 1.4282 | 1.2561 |
| EZA | 1.3482 | 1.4823 | 1.3516 | 1.4474 |
| Mean | 1.2331 | 1.2277 | 1.1634 | 1.2119 |
| Method | BL | BL- | BL- | BL- | BL-- |
|---|---|---|---|---|---|
| LSTM | 1.1021 | 1.2455 | 1.2185 | 1.2216 | 1.3496 |
| GRU | 1.3016 | 1.4483 | 1.4073 | 1.4862 | 1.5393 |
| BiLSTM | 1.1223 | 1.1826 | 1.1940 | 1.2008 | 1.1844 |
| BiGRU | 1.1251 | 1.2569 | 1.2092 | 1.1998 | 1.3567 |
| Metrics | Base | MW | BL | BL- | BL- | BL- | BL-- |
|---|---|---|---|---|---|---|---|
| Mean Return | 0.0358 | 0.0374 | 0.3376 | 0.3886 | 0.3752 | 0.3960 | 0.4136 |
| Standard Dev. | 0.2082 | 0.1766 | 0.2440 | 0.2545 | 0.2524 | 0.2530 | 0.2557 |
| Sharpe Ratio | 0.0759 | 0.0985 | 1.3016 | 1.4483 | 1.4073 | 1.4862 | 1.5393 |
| MDD | 0.4811 | 0.3764 | 0.3699 | 0.3844 | 0.3805 | 0.3752 | 0.3759 |
| Year | Metrics | Base | MW | BL | BL- | BL- | BL- | BL-- |
|---|---|---|---|---|---|---|---|---|
| 2016 | Mean Return | 0.091 | 0.0939 | 0.7079 | 0.7683 | 0.7602 | 0.7645 | 0.7526 |
| Standard Dev. | 0.22 | 0.173 | 0.3362 | 0.3389 | 0.3388 | 0.3389 | 0.3392 | |
| Sharpe Ratio | 0.4129 | 0.5418 | 2.1015 | 2.2625 | 2.2392 | 2.2514 | 2.2143 | |
| MDD | 0.1042 | 0.1022 | 0.1393 | 0.1393 | 0.1393 | 0.1393 | 0.1393 | |
| 2017 | Mean Return | 0.2061 | 0.2027 | 0.351 | 0.4051 | 0.4547 | 0.3764 | 0.4168 |
| Standard Dev. | 0.1128 | 0.0766 | 0.1013 | 0.1272 | 0.132 | 0.1262 | 0.1462 | |
| Sharpe Ratio | 1.824 | 2.6417 | 3.4597 | 3.178 | 3.4373 | 2.9765 | 2.8453 | |
| MDD | 0.0353 | 0.0252 | 0.0293 | 0.0393 | 0.0393 | 0.0365 | 0.0484 | |
| 2018 | Mean Return | −0.2154 | −0.1613 | 0.1223 | 0.2153 | 0.2158 | 0.3744 | 0.3936 |
| Standard Dev. | 0.1877 | 0.1413 | 0.2199 | 0.2436 | 0.2434 | 0.2607 | 0.2615 | |
| Sharpe Ratio | −1.1453 | −1.1394 | 0.5549 | 0.8821 | 0.8847 | 1.4331 | 1.5021 | |
| MDD | 0.2664 | 0.2125 | 0.1392 | 0.1425 | 0.1408 | 0.1156 | 0.1156 | |
| 2019 | Mean Return | 0.1227 | 0.1856 | 0.2043 | 0.2599 | 0.2419 | 0.2725 | 0.2834 |
| Standard Dev. | 0.1347 | 0.1055 | 0.1301 | 0.137 | 0.1349 | 0.136 | 0.1367 | |
| Sharpe Ratio | 0.9093 | 1.7568 | 1.5668 | 1.8933 | 1.7902 | 2.0002 | 2.0687 | |
| MDD | 0.1167 | 0.0665 | 0.1248 | 0.091 | 0.1082 | 0.0963 | 0.0932 | |
| 2020 | Mean Return | 0.0498 | 0.1307 | 0.4523 | 0.5095 | 0.4529 | 0.4883 | 0.4881 |
| Standard Dev. | 0.3663 | 0.2951 | 0.4005 | 0.4142 | 0.4062 | 0.4066 | 0.4077 | |
| Sharpe Ratio | 0.1357 | 0.4419 | 1.1272 | 1.2277 | 1.1129 | 1.1985 | 1.1949 | |
| MDD | 0.4063 | 0.3038 | 0.3699 | 0.3844 | 0.3805 | 0.3752 | 0.3759 | |
| 2021 | Mean Return | 0.035 | 0.0813 | 0.2396 | 0.2589 | 0.248 | 0.2458 | 0.2489 |
| Standard Dev. | 0.1583 | 0.1385 | 0.2014 | 0.2115 | 0.2115 | 0.2008 | 0.2081 | |
| Sharpe Ratio | 0.2206 | 0.5859 | 1.1875 | 1.2216 | 1.17 | 1.2215 | 1.1937 | |
| MDD | 0.1166 | 0.0901 | 0.1417 | 0.1603 | 0.1483 | 0.1483 | 0.1483 | |
| 2022 | Mean Return | -0.203 | -0.1965 | 0.3503 | 0.3778 | 0.3568 | 0.3448 | 0.4107 |
| Standard Dev. | 0.2186 | 0.2017 | 0.2383 | 0.2435 | 0.2411 | 0.2378 | 0.2385 | |
| Sharpe Ratio | −0.9267 | −0.9719 | 1.4669 | 1.5484 | 1.4768 | 1.4473 | 1.7184 | |
| MDD | 0.2781 | 0.2673 | 0.2257 | 0.2062 | 0.2201 | 0.2047 | 0.1973 | |
| 2023 | Mean Return | 0.1541 | 0.1501 | 0.2807 | 0.3232 | 0.2805 | 0.311 | 0.325 |
| Standard Dev. | 0.1575 | 0.1453 | 0.1731 | 0.1826 | 0.1792 | 0.1814 | 0.1833 | |
| Sharpe Ratio | 0.9761 | 1.0311 | 1.6179 | 1.7671 | 1.5619 | 1.7105 | 1.7698 | |
| MDD | 0.1367 | 0.1147 | 0.1396 | 0.1439 | 0.1539 | 0.1503 | 0.157 |
Disclaimer/Publisher’s Note: The statements, opinions and data contained in all publications are solely those of the individual author(s) and contributor(s) and not of MDPI and/or the editor(s). MDPI and/or the editor(s) disclaim responsibility for any injury to people or property resulting from any ideas, methods, instructions or products referred to in the content. |
© 2024 by the authors. Licensee MDPI, Basel, Switzerland. This article is an open access article distributed under the terms and conditions of the Creative Commons Attribution (CC BY) license (https://creativecommons.org/licenses/by/4.0/).
Share and Cite
Cho, P.; Lee, M. Dynamic Black–Litterman Portfolios Incorporating Asymmetric Fractal Uncertainty. Fractal Fract. 2024, 8, 642. https://doi.org/10.3390/fractalfract8110642
Cho P, Lee M. Dynamic Black–Litterman Portfolios Incorporating Asymmetric Fractal Uncertainty. Fractal and Fractional. 2024; 8(11):642. https://doi.org/10.3390/fractalfract8110642
Chicago/Turabian StyleCho, Poongjin, and Minhyuk Lee. 2024. "Dynamic Black–Litterman Portfolios Incorporating Asymmetric Fractal Uncertainty" Fractal and Fractional 8, no. 11: 642. https://doi.org/10.3390/fractalfract8110642
APA StyleCho, P., & Lee, M. (2024). Dynamic Black–Litterman Portfolios Incorporating Asymmetric Fractal Uncertainty. Fractal and Fractional, 8(11), 642. https://doi.org/10.3390/fractalfract8110642