Article

Fractal Analysis of Doped Strontium Titanate Photocatalyst

1
Department of Physical Chemistry, “Vinča” Institute of Nuclear Sciences—National Institute of the Republic of Serbia, University of Belgrade, 11001 Belgrade, Serbia
2
ISEL—Instituto Superior de Engenharia de Lisboa, CMAFcIO—Centro de Matemática, Aplicações Fundamentais e Investigação Operacional, 1749-016 Lisboa, Portugal
3
Institute for Multidisciplinary Research, University of Belgrade, 11030 Belgrade, Serbia
4
Faculty of Technology and Metallurgy, University of Belgrade, 11000 Belgrade, Serbia
5
Department of Materials, “Vinča” Institute of Nuclear Sciences—National Institute of the Republic of Serbia, University of Belgrade, 11001 Belgrade, Serbia
6
Center for Microelectronic Technologies, Institute of Chemistry, Technology and Metallurgy—National Institute of the Republic of Serbia, University of Belgrade, 11000 Belgrade, Serbia
*
Author to whom correspondence should be addressed.
Fractal Fract. 2024, 8(10), 560; https://doi.org/10.3390/fractalfract8100560
Submission received: 5 September 2024 / Revised: 19 September 2024 / Accepted: 24 September 2024 / Published: 27 September 2024
(This article belongs to the Section Mathematical Physics)

Abstract

:
In this research, the doping of SrTiO3 with Mn4+ was performed in order to evaluate the potential application as a photocatalyst for the degradation of organic dye pollutants. Since photocatalytic activity depends on grain microstructure, fractal analysis was used to estimate the Hausdorff dimension to provide a more thorough investigation of Mn@SrTiO3 morphology. Structural analysis by infrared spectroscopy indicated the incorporation of Mn4+ into the SrTiO3 lattice, while by using x-ray diffraction, the crystallite size of 44 nm was determined. The photocatalytic activity test performed on complex ethyl violet organic dye revealed potential for Mn@SrTiO3 application in water treatment. Based on fractal regression analysis, a good estimate was obtained for the reconstruction of grain shape, with a Hasudorff dimension of 1.13679, which was used to find the best kinetics model for the photodegradation reaction. The experimental data showed a nearly linear fit with fractal-like pseudo-zero order. These findings and applications of fractal dimensions could contribute to future characterizations of photocatalysts, providing a deeper understanding of surface properties and their influence on photocatalytic activity.

1. Introduction

As a part of nonlinear science, fractal analysis is focused on irregularities and self-similarities in nature, providing a valuable tool for understanding the complex structures of materials and predicting their properties based on fractal dimensions and self-similarity characteristics [1,2,3]. By employing fractal analysis techniques, researchers can enhance their understanding of material structures and optimize their functional properties for various applications [4,5]. Fractal analysis has become very attractive in the characterization of materials, offering insights into their microstructural properties and functional behavior [6]. Studies have utilized fractal analysis to examine various materials, such as TEGylated phenothiazine–chitosan composites for mercury ion recovery, where fractal dimensions and lacunarity were calculated for four xerogels, based on FESEM images [7]. The fractal reconstruction of microstructural shapes in epoxy-based composites was performed by our research team in order to present a potential method for predicting structure–property relations in composites [8]. Peng et al. reported theoretical and numerical predictions for transversely isotropic piezoelectric materials, with the formulation of the Weierstrass–Mandelbrot fractal function [9]. In the study of Wei et al., the fractal dimension of modified fluorescently-labeled calcium carbonate filler dispersion in polypropylene was correlated with the composite properties [10]. They determined that the dispersion with the lowest fractal dimension showed the highest improvement in the impact resistance. Li et al. determined the mapping relationship between permeability, thermal conductivity, and diffusivity properties in porous material by using the fractal dimensions of pores, proposing a method for understanding and predicting the mechanisms of the transport phenomenon [11]. Recently, Kamoushi et al. used fractal analysis in the microstructure characterization of La(Mg½Ti½)O3, crucial for understanding electrical properties at microwave frequencies and miniaturizing electronic components [12]. As can be seen, fractal theory application in materials science is very broad, providing valuable insight into material properties and the relationship between them. One of the fields where fractal analysis can be valuable is the photocatalytic degradation of organic pollutants.
Organic pollutants, with their toxic and potentially carcinogenic properties, represent significant risks in air and water [13]. The primary sources of these pollutants include chemical processing, construction materials, textile manufacturing, and indoor coatings. The photocatalytic degradation of dyes has emerged as an effective strategy for reducing pollution from synthetic dyes [14]. Various inorganic and organic materials have been used as photocatalysts for dye degradation, among which reduced graphene oxide was recently successfully applied to the degradation of indigo carmine and neutral red dyes [15,16,17]. Deepracha et al. discovered that in the presence of Ca2+, Sr2+, and Ba2+ ions, the photocatalytic degradation reaction of methylene blue and acid yellow 42 occurs at a higher rate [18]. For a deeper understanding of photocatalytic reactions, fractal calculations have been applied to the investigation of the chemical reaction kinetics of photocatalysis [19]. In the study of Wang et al., fractional kinetics models were used to describe the photocatalytic degradation of Rhodamine B dye in the presence of different catalysts, establishing the best fit for a fractional first-order kinetics model [20]. Sieland et al. emphasized the importance of the fractal dimension through the investigation of charge carrier recombination kinetics, providing a fractal model that can be applied in all domains [21]. The Hausdorff dimension of photocatalysts also influences photocatalytic activity and thermodynamic parameters, such as activation energy. Dobrescu et al. have shown on various catalysts that activation energy depends on surface properties, proving that photocatalytic activity increases with fractal dimension [22].
Perovskites are cubic structured ceramics that can have a range of properties that make them suitable for various applications, from insulators and conductors to biomedical materials and photocatalysts [23,24,25]. Due to their advantageous properties, such as a high nonlinear optical coefficient, the capacity to adjust band gap cations by cation replacement or the creation of oxygen vacancies, high dielectric constant, thermal stability, mechanical strength, and effective photocatalytic properties, they can be used for the degradation of organic pollutants [26,27]. The properties of SrTiO3 are highly dependent on microstructural features, which can be controlled with synthesis parameters. The strontium ions in SrTiO3 can enhance the generation of superoxide radicals, thus reducing the recombination of charge carriers produced by light, thereby promoting photocatalytic oxidation. Efforts have been made to enhance the photocatalytic efficiency of SrTiO3 photocatalysts by introducing metal nanoparticles, doping, or modifying crystal planes and morphology [28]. Modifying the standard configuration of perovskites can lead to the development of new electrical and magnetic properties, making the study of these materials especially intriguing [29]. Siqueira et al. synthesized SrTiO3 doped with cobalt (Co) in order to improve perovskite conductivity [24]. They have shown that with doping, smaller particles were obtained with higher conductivity, as a consequence of grain boundary effects. Various research studies have focused on enhancing the photocatalytic efficiency of SrTiO3 through different approaches such as solid solution synthesis, heterojunction catalyst formation, and crystal facet engineering [30]. A solid solution prepared by Xin et al., (SrTiO3)1-x-(SrTaO2N)x, showed tunable absorption edges and superior photocatalytic activity compared to their parent compounds [31]. Recently, Basumatary et al. reported the formation of heterojunction catalysts like SrTiO3/SrMoO4, which demonstrated excellent degradation efficiency for contaminants like methylene blue and phenol, showcasing its potential for wastewater treatment applications [32]. Furthermore, the development of SrTiO3 single crystals with tailored facets has led to a significant enhancement in photocatalytic hydrogen evolution rates, highlighting the importance of crystal facet engineering in improving photocatalytic performance [33]. These advancements highlight the continuous efforts to optimize SrTiO3 photocatalysis, which is greatly influenced by the microstructure. In addition, until now there has been no research investigating the photodegradation of harmful industrial ethyl violet dye using SrTiO3-based materials.
Manganese dioxide (MnO2) has emerged as a promising photocatalyst for various applications, especially in wastewater treatment and organic pollutant degradation [34,35]. Studies have shown that different morphologies and composites of MnO2 can significantly impact its photocatalytic efficiency. Arunpandian et al. demonstrated that synthesized Ce@MnO2 photocatalysts show exceptional degradation efficiency of pollutants under visible light irradiation [36]. Additionally, the fabrication of cationic microgel-doped MnO2/Fe3O4 nanocomposites exhibited high catalytic activity in the reduction of toxic dyes and pollutants under UV light, with reusability up to eight cycles, revealing the potential for practical applications [37]. However, none of the photocatalyst microstructures have been characterized by fractal analysis so far, although the insight into the fractal dimension could be valuable for the investigation of photocatalytic activity.
This research presents SrTiO3 doped with Mn4+, for potential use in photocatalysis, for organic dye degradation. The reconstruction of an obtained grain shape was performed by applying fractal regression analysis. Before the introduction of this method for the identification of the real structure’s fractal shape, the literature characterized objects and data by an indicator of fractal behavior, called the Hausdorff dimension. The most frequently used method to estimate this is to compute an estimate of the Box dimension, involving non-integer values that partially characterize the data. With our new method, fractal regression, the identification of the fractal shape is performed by a mathematically defined function, adding a deeper understanding of these kinds of phenomena. The Hausdorff dimension was further connected to a kinetics model of the photocatalytic degradation of ethyl violet dye, establishing a good fit after the modification of a pseudo-zero-order model.

2. Materials and Methods

2.1. Materials

For the preparation of the photocatalyst, SrTiO3 (particle diameter < 100 nm) and MnO2 (≥99%, powder) were used. Organic dye for the photodegradation investigation was ethyl violet (EV). All of the chemicals used were bought from Sigma-Aldrich, St. Louis, MI, USA.

2.2. Doping of SrTiO3

SrTiO3 and MnO2 were milled and heated at 1000 °C for 2 h in order to obtain hybrid nanoparticles [38]. Afterwards, sintering at 160 bar and 1000 °C was performed for 2 h in order to incorporate Mn in the SrTiO3.

2.3. Characterization of Samples

The X-ray diffraction (XRD) was used for the identification of crystalline phases and the calculation of unit cell parameter and volume, as well as the crystallite size and microstrain, which were determined with the use of the MDI Jade 6 program. The XRD pattern was collected over the range 10° < 2θ < 90° on an Ital Structures APD2000 X-ray diffractometer using CuKα radiation (λ = 1.5418 Å) with a step size of 0.02° and a counting time of 1 s/step. Fourier transform infrared (FTIR) spectroscopy was performed on a Thermo Scientific Nicolet iS35 spectrometer (Waltham, MA, USA), with the presented range of 1200–500 cm−1 and resolution of 4 cm−1.
To analyze the morphology of the photocatalyst, we employed field emission scanning electron microscopy (FESEM) using Tescan Mira 3 instruments (Brno, Czech Republic). Photodegradation tests were performed in an open reactor (V = 100 mL) in a dark chamber equipped with an Osram Ultra-Vitalux 300 W lamp, which, according to the specification, simulates radiation similar to natural sunlight with only 5% UV radiation. The lamp was placed 20 cm away from the ethyl violet (EV) dye solution. Constant mixing and temperature (20 °C) of the solution were maintained during the experiment. The photodegradation was monitored by mixing 25 mL of an aqueous solution of the dye (50 mg dm–3) and 50 mg of catalyst. The suspensions were left in the dark for 30 min to reach good dispersion and adsorption/desorption equilibrium between the catalyst and the dye. Then, the lamp was switched on and after every 30 min of irradiation, the solution was sampled. The residual concentration of dye was determined via a UV–Vis spectrophotometer (Shimadzu 2600 (Kyoto, Japan)) after separation of the solution by mini-spin centrifuge (Eppendorf (Hamburg, Germany)). The absorption spectra and rate of photodegradation were observed in terms of the absorbance change at the peak maximum of the EV dye solution (λmax = 590.5 nm).
Fractal analysis was performed using Fractal Real Finder software on the FESEM image of Mn@SrTiO3, following the methodology from our previously published research [8].

3. Results and Discussion

3.1. FTIR Analysis of Particles

Infrared spectra of hybrid, un-sintered SrTiO3/MnO2 and Mn@SrTiO3 are presented in Figure 1. At 859.0 cm−1, a small band from residual TiO2 or SrCO3 was identified, which was reduced after sintering [39]. A peak originating from Ti-O appeared at 531.7 cm−1 in SrTiO3/MnO2, while in Mn@SrTiO3 it was shifted to a higher wavenumber, 540.5 cm−1. The shift occurred as a consequence of SrTiO3 lattice distortion due to an incorporation of Mn during sintering [40].

3.2. XRD Analysis of Mn@SrTiO3

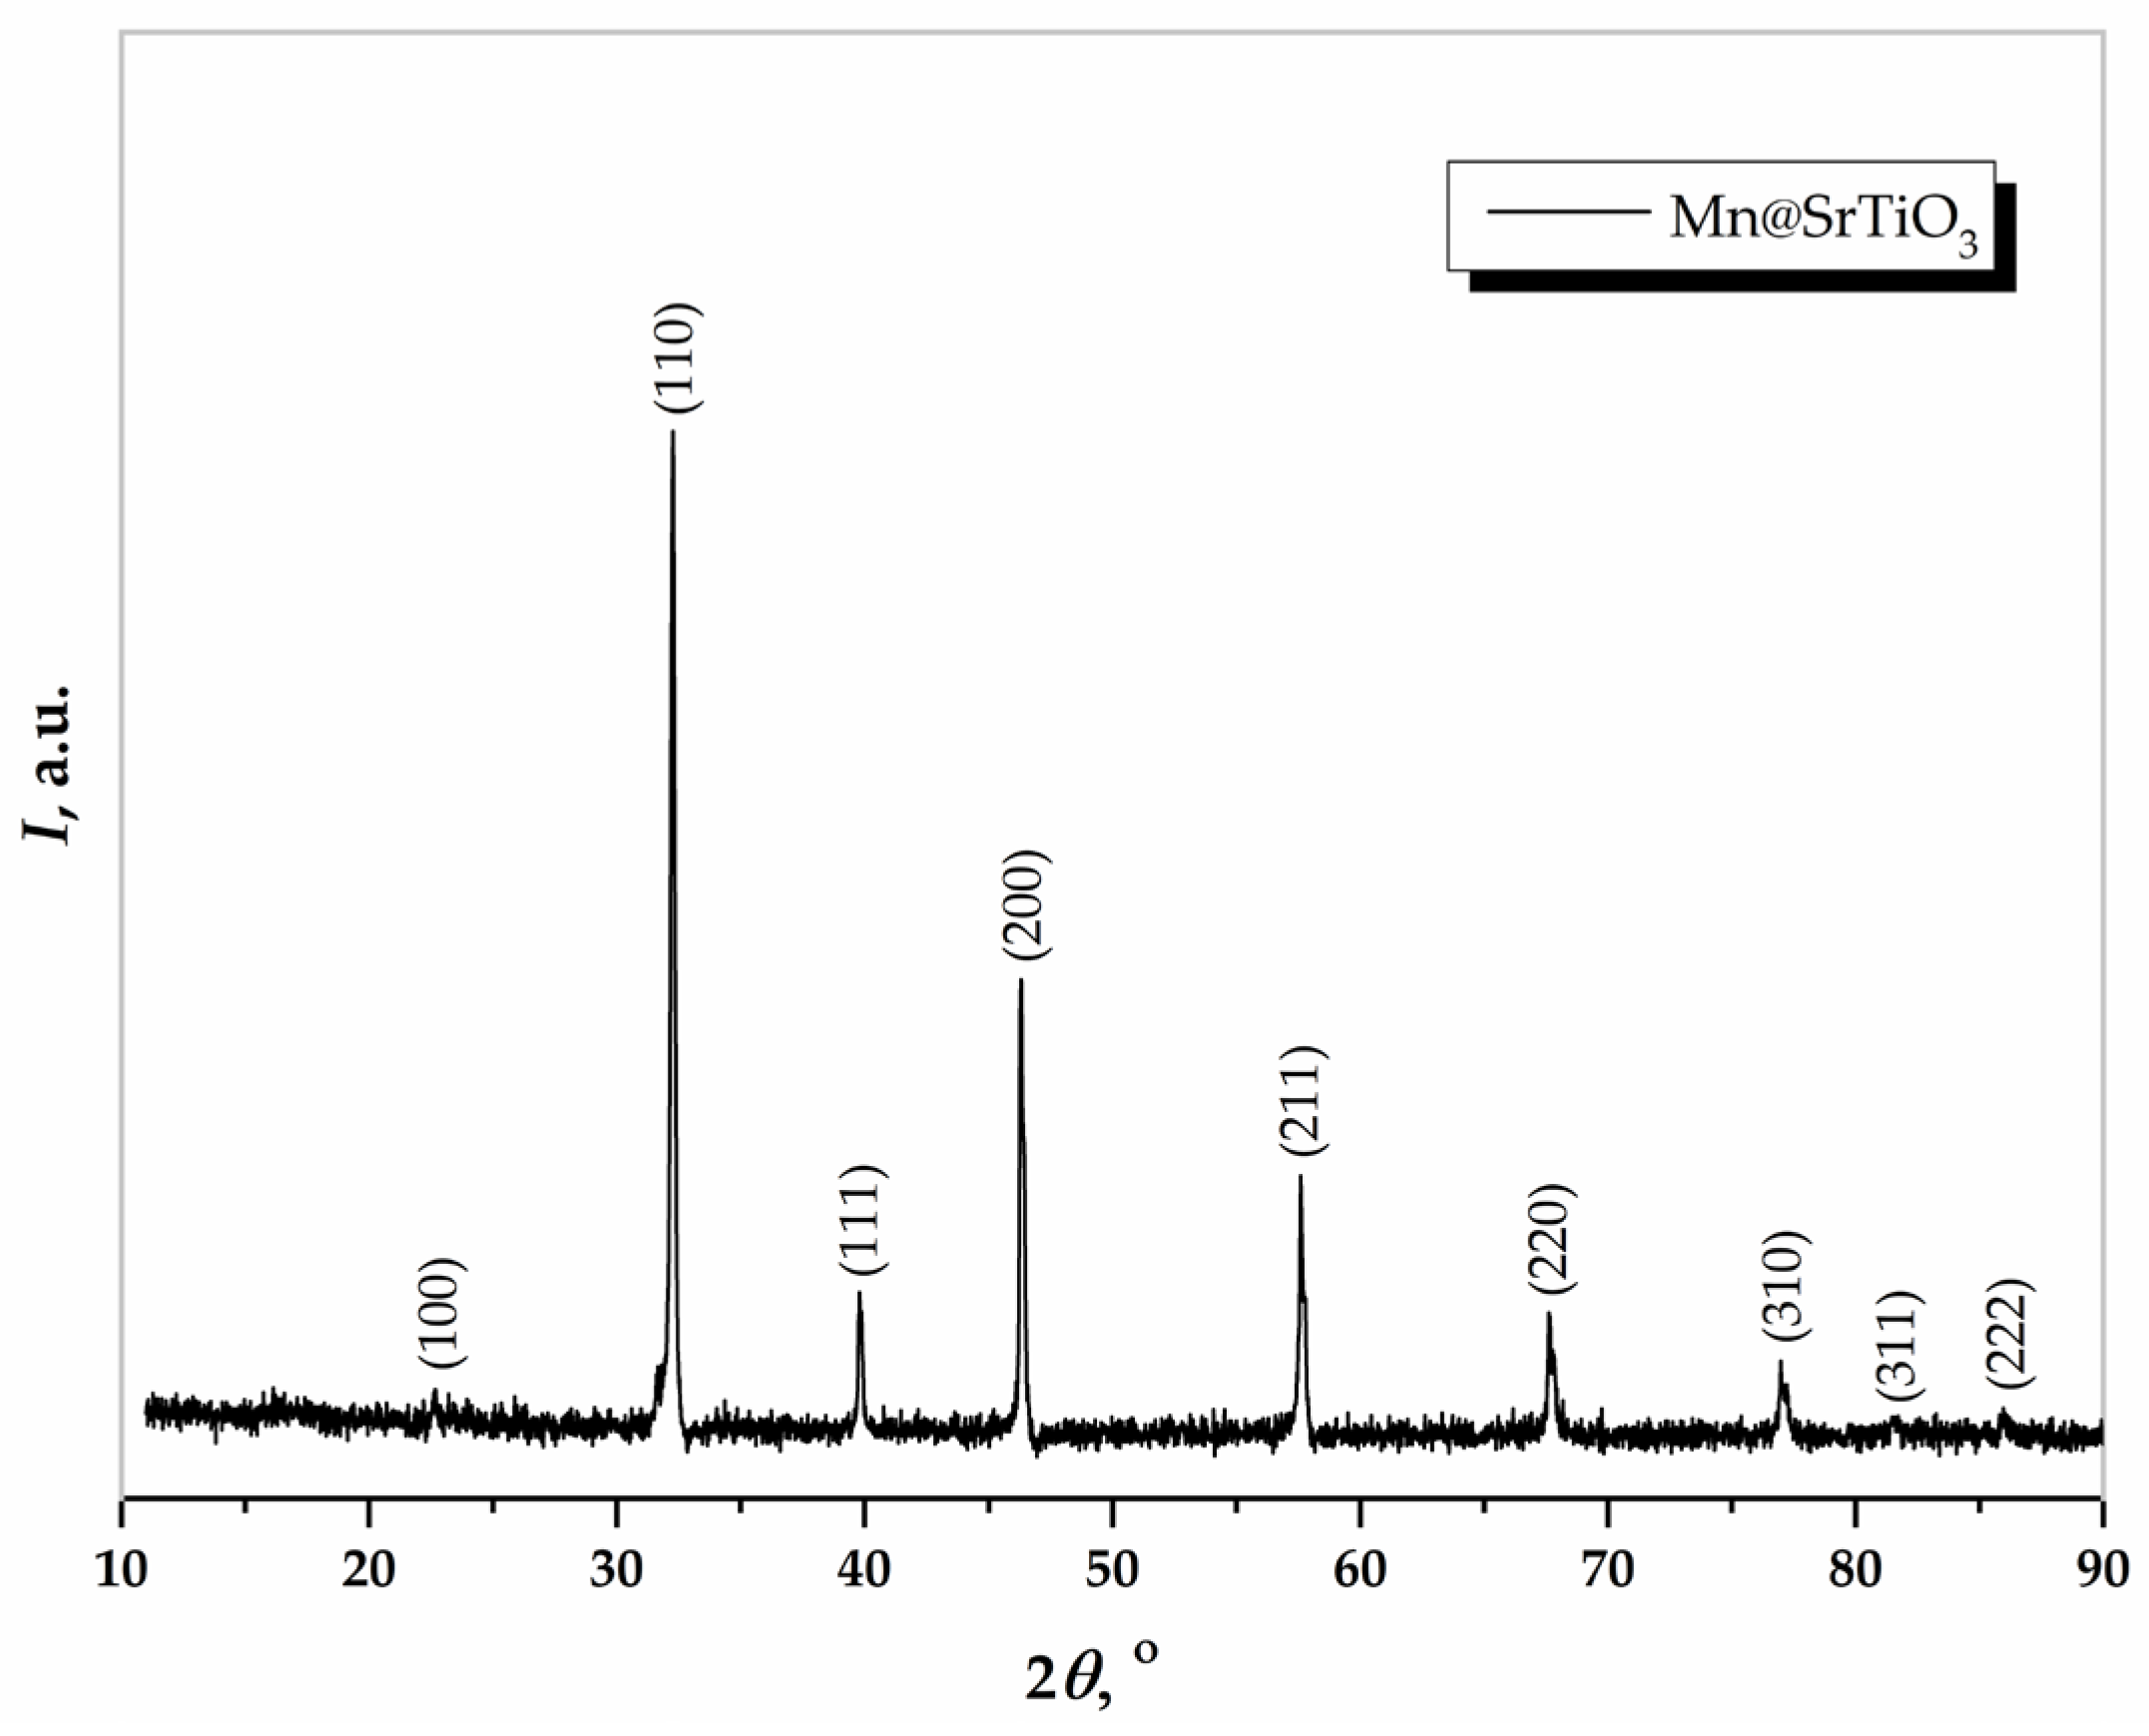
The XRD pattern of the prepared sample is presented in Figure 2. The diffraction peaks (100), (110), (111), (200), (211), (220), (310), (311), and (222) are all assigned to the perovskite structure of strontium titanate (SrTiO3), which agrees well with the PDF card number 35-0734 (a = 3.905, V = 59.5). It is clear that SrTiO3 crystallizes in a cubic structure, and the Pm-3m (no. 221) space group is the only phase in the sample. No additional peaks associated with Mn species can be observed in Figure 2, indicating that Mn ions are doped into the SrTiO3 lattice. It is presumed that an SrTi1-xMnxO3 solid solution was formed. Mn4+ ions can easily occupy the places of Ti4+ ions in the lattice, forming the compound SrTi1-xMnxO3, due to the similar size of the ionic radii of Ti4+ (0.605 Å) and Mn4+ (0.53 Å) ions in the octahedral arrangement [41].
The unit cell parameter and volume, together with an average crystallite size and microstrain of SrTiO3 calculated using the Sherrer and Williamson–Hall (W–H) method [42,43], are shown in Table 1.
The average nanocrystallite size (D) was firstly calculated using the Scherrer formula:
D = k × λ β × c o s θ
where k is the shape factor (0.9), λ is the wavelength of CuKα radiation, β is the full-width half maximum, and θ is the Bragg angle [41]. The software determines the β value in the 2θ-axis after the well-performed fitting, and then calculates the average crystallite size (D) using the Scherrer formula (Equation (1)) for six well-defined SrTiO3 diffraction maxima: (110), (111), (200), (211), (220), and (310). The calculated average crystallite size of the modified SrTiO3 was 41 nm (Table 1). Then, the W–H method is used to better estimate the crystallite size together with lattice strain. The microstrain (ε) formed in the structure due to the defects and lattice distortion is calculated using the W–H formula [41]:
β × c o s θ = k × λ D + 4 × ε × s i n θ
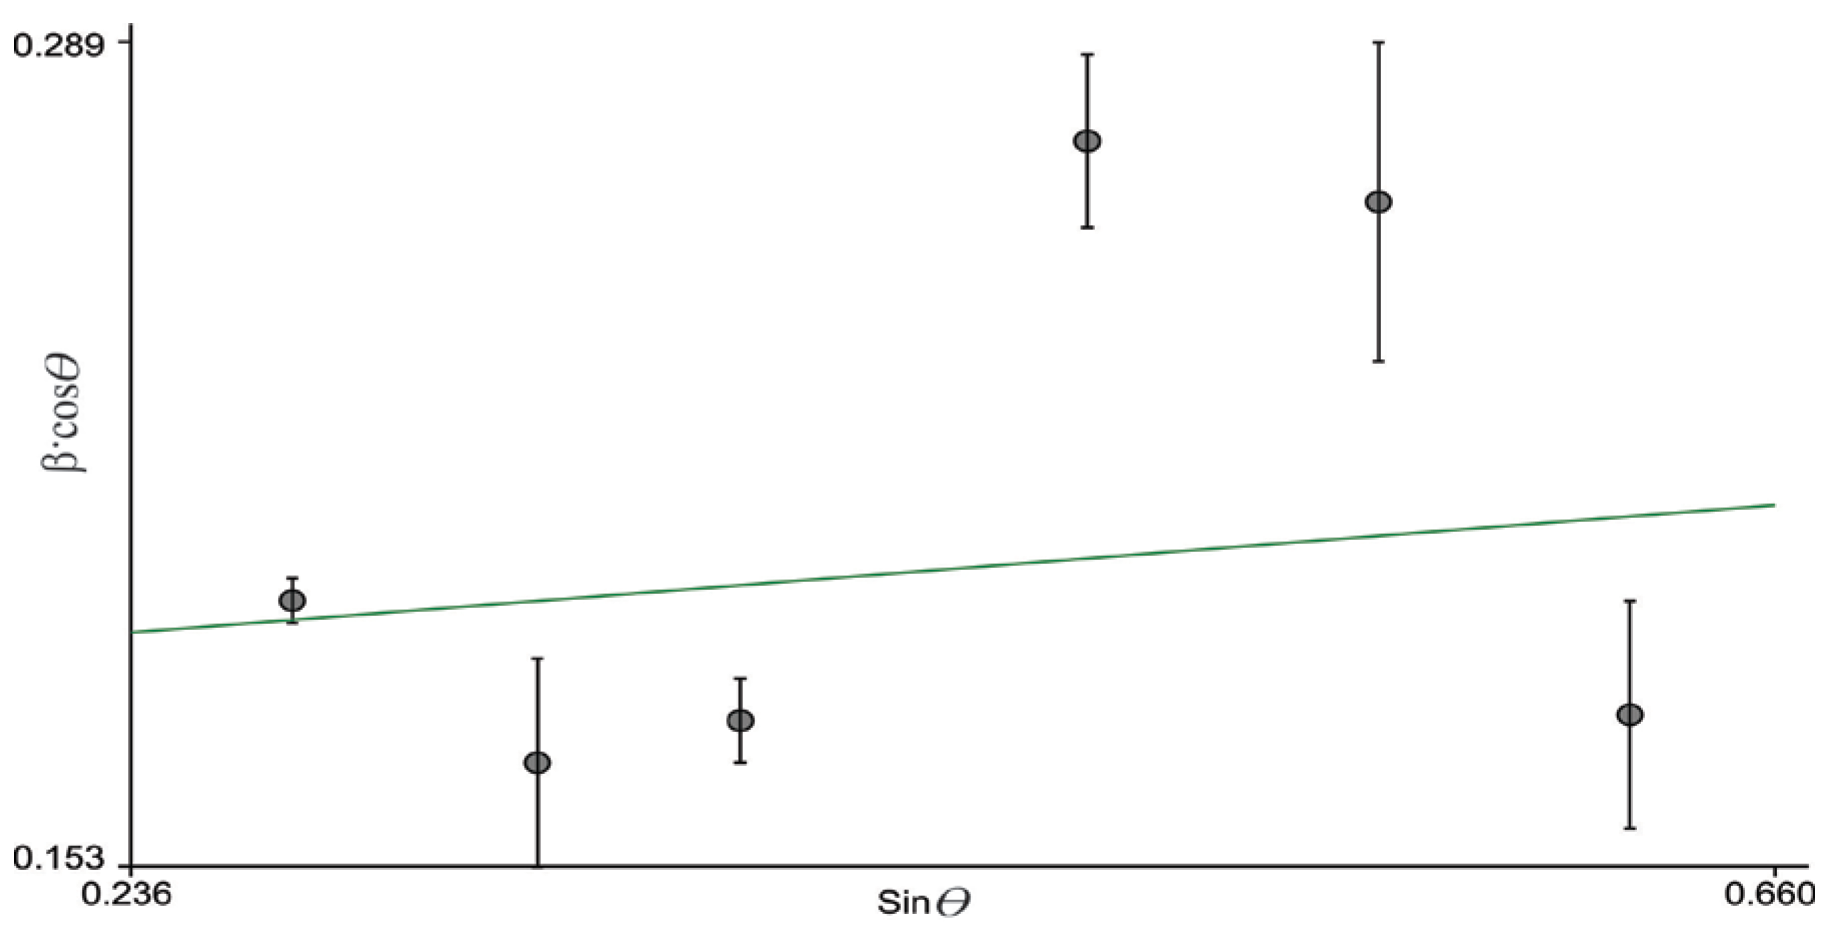
The Williamson–Hall plot of βcosϴ vs. sinϴ of the modified SrTiO3 is shown in Figure 3. The crystallite size was calculated from the intercept, and the microstrain from the slope of the linear fit of the data. Hence, the average crystallite size of mechanically activated SrTiO3 using the W–H method was 44 nm. Since the crystallite size of Mn-doped SrTiO3 measured by the Scherrer method does not cover the strain, the value is slightly less than that obtained from the W–H method.
The microstrain is a useful parameter to illustrate the lattice distortion within the structure. Low microstrain is usually related to a more stable structure. According to the W–H equation [42], negligible microstrain (Table 1) indicates that the obtained structure is well ordered. A lattice distortion, represented by the microstrain and the change in lattice parameter, is small because the ionic radii of Mn4+ and Ti4+ are comparable. The dislocation density, calculated using the formula δ = 1/D2, was 5.2 × 10⁻⁴ nm–2, which also revealed information about the crystal structure [44].

3.3. FESEM Analysis of Grains

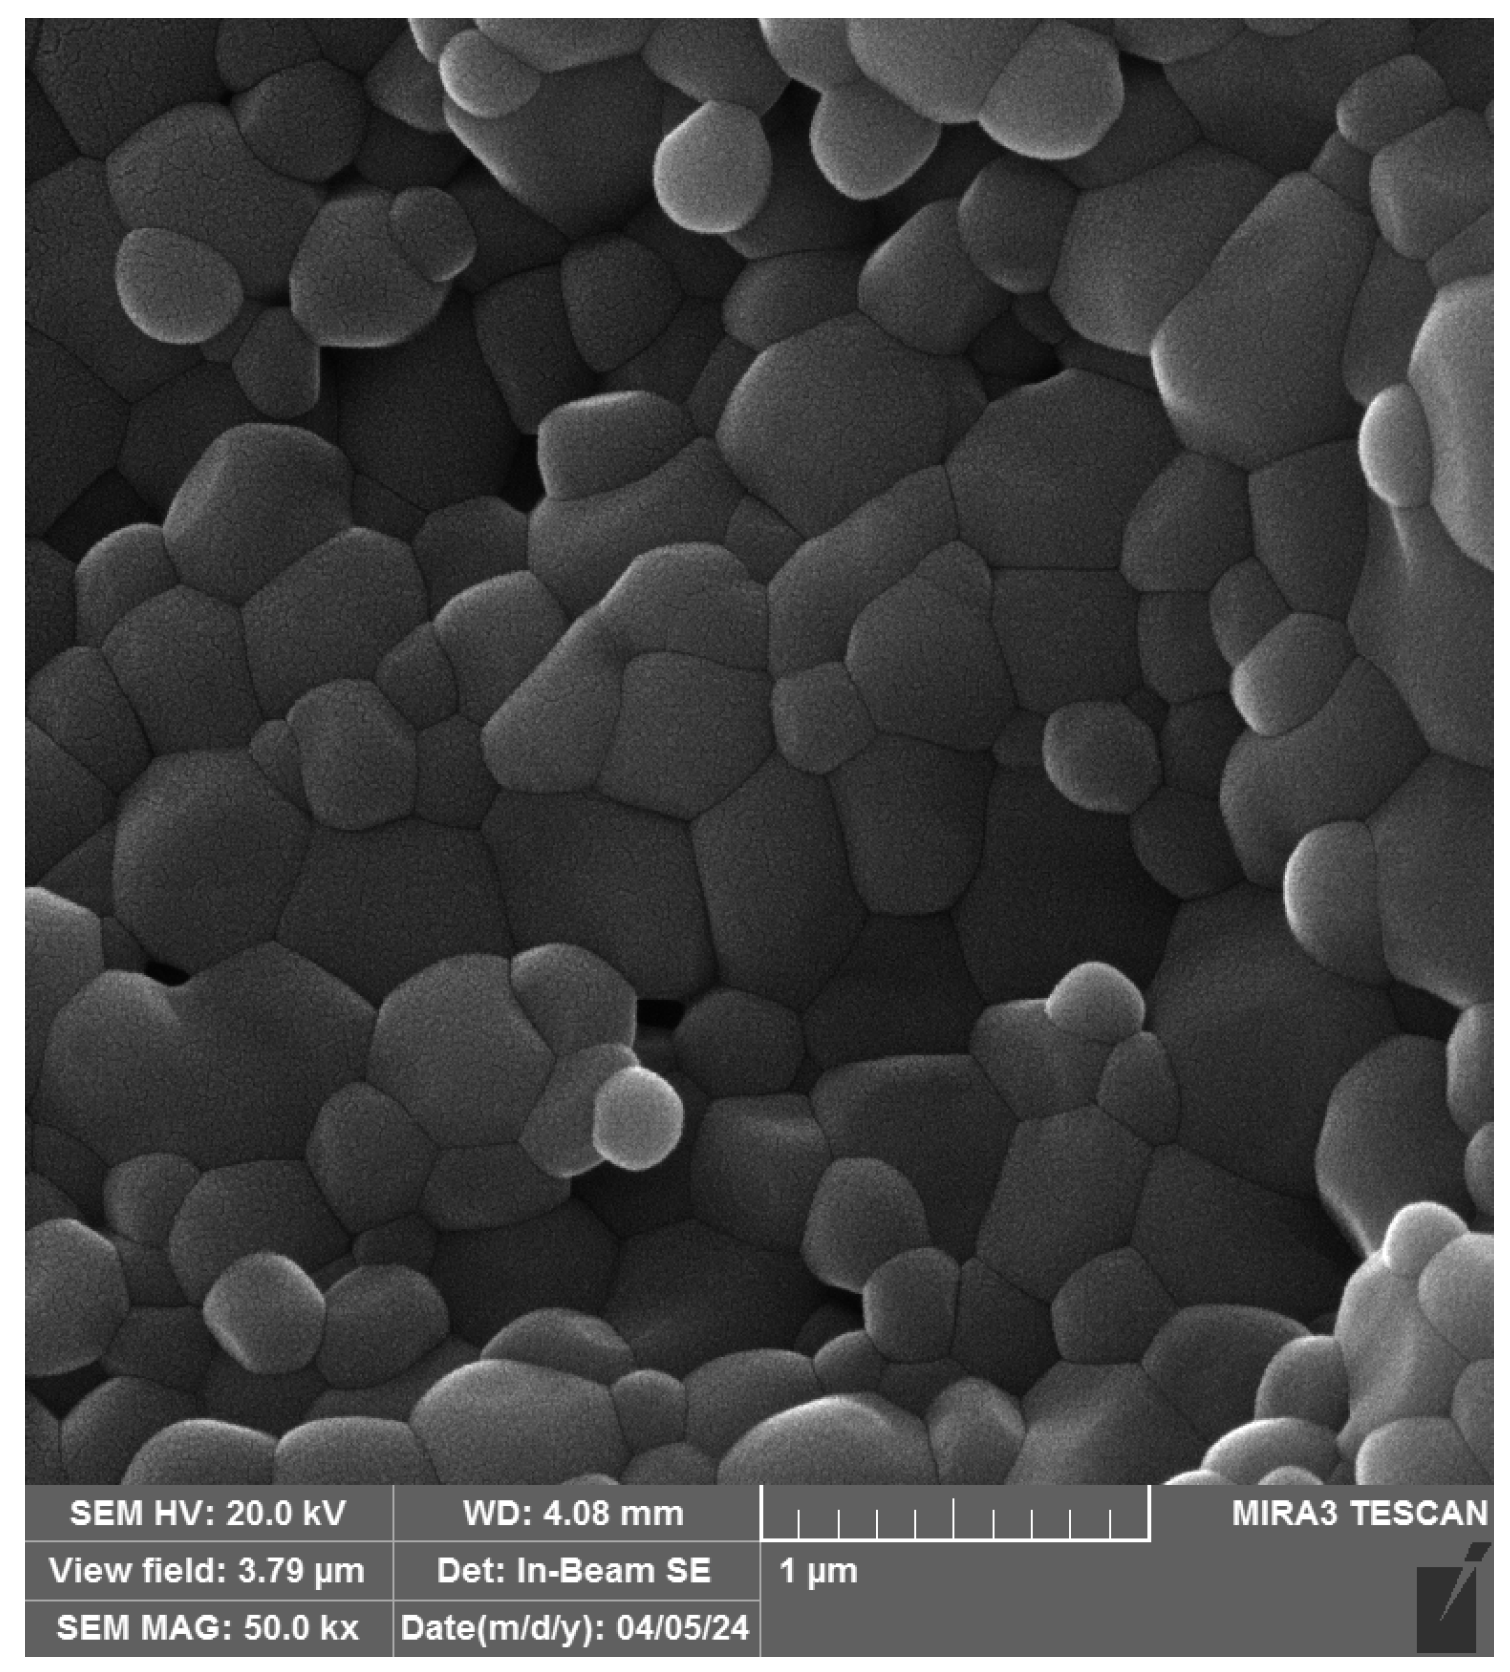
The morphology of Mn@SrTiO3 is presented in Figure 4. As can be seen, nanoscale grains with a visible boundary were generated, with a shape typical of SrTiO3 grains [45].
The FESEM image was further used for fractal analysis in order to determine the Hausdorff dimension of a grain with a clear boundary.

3.4. Photocatalytic Activity of Mn@SrTiO3

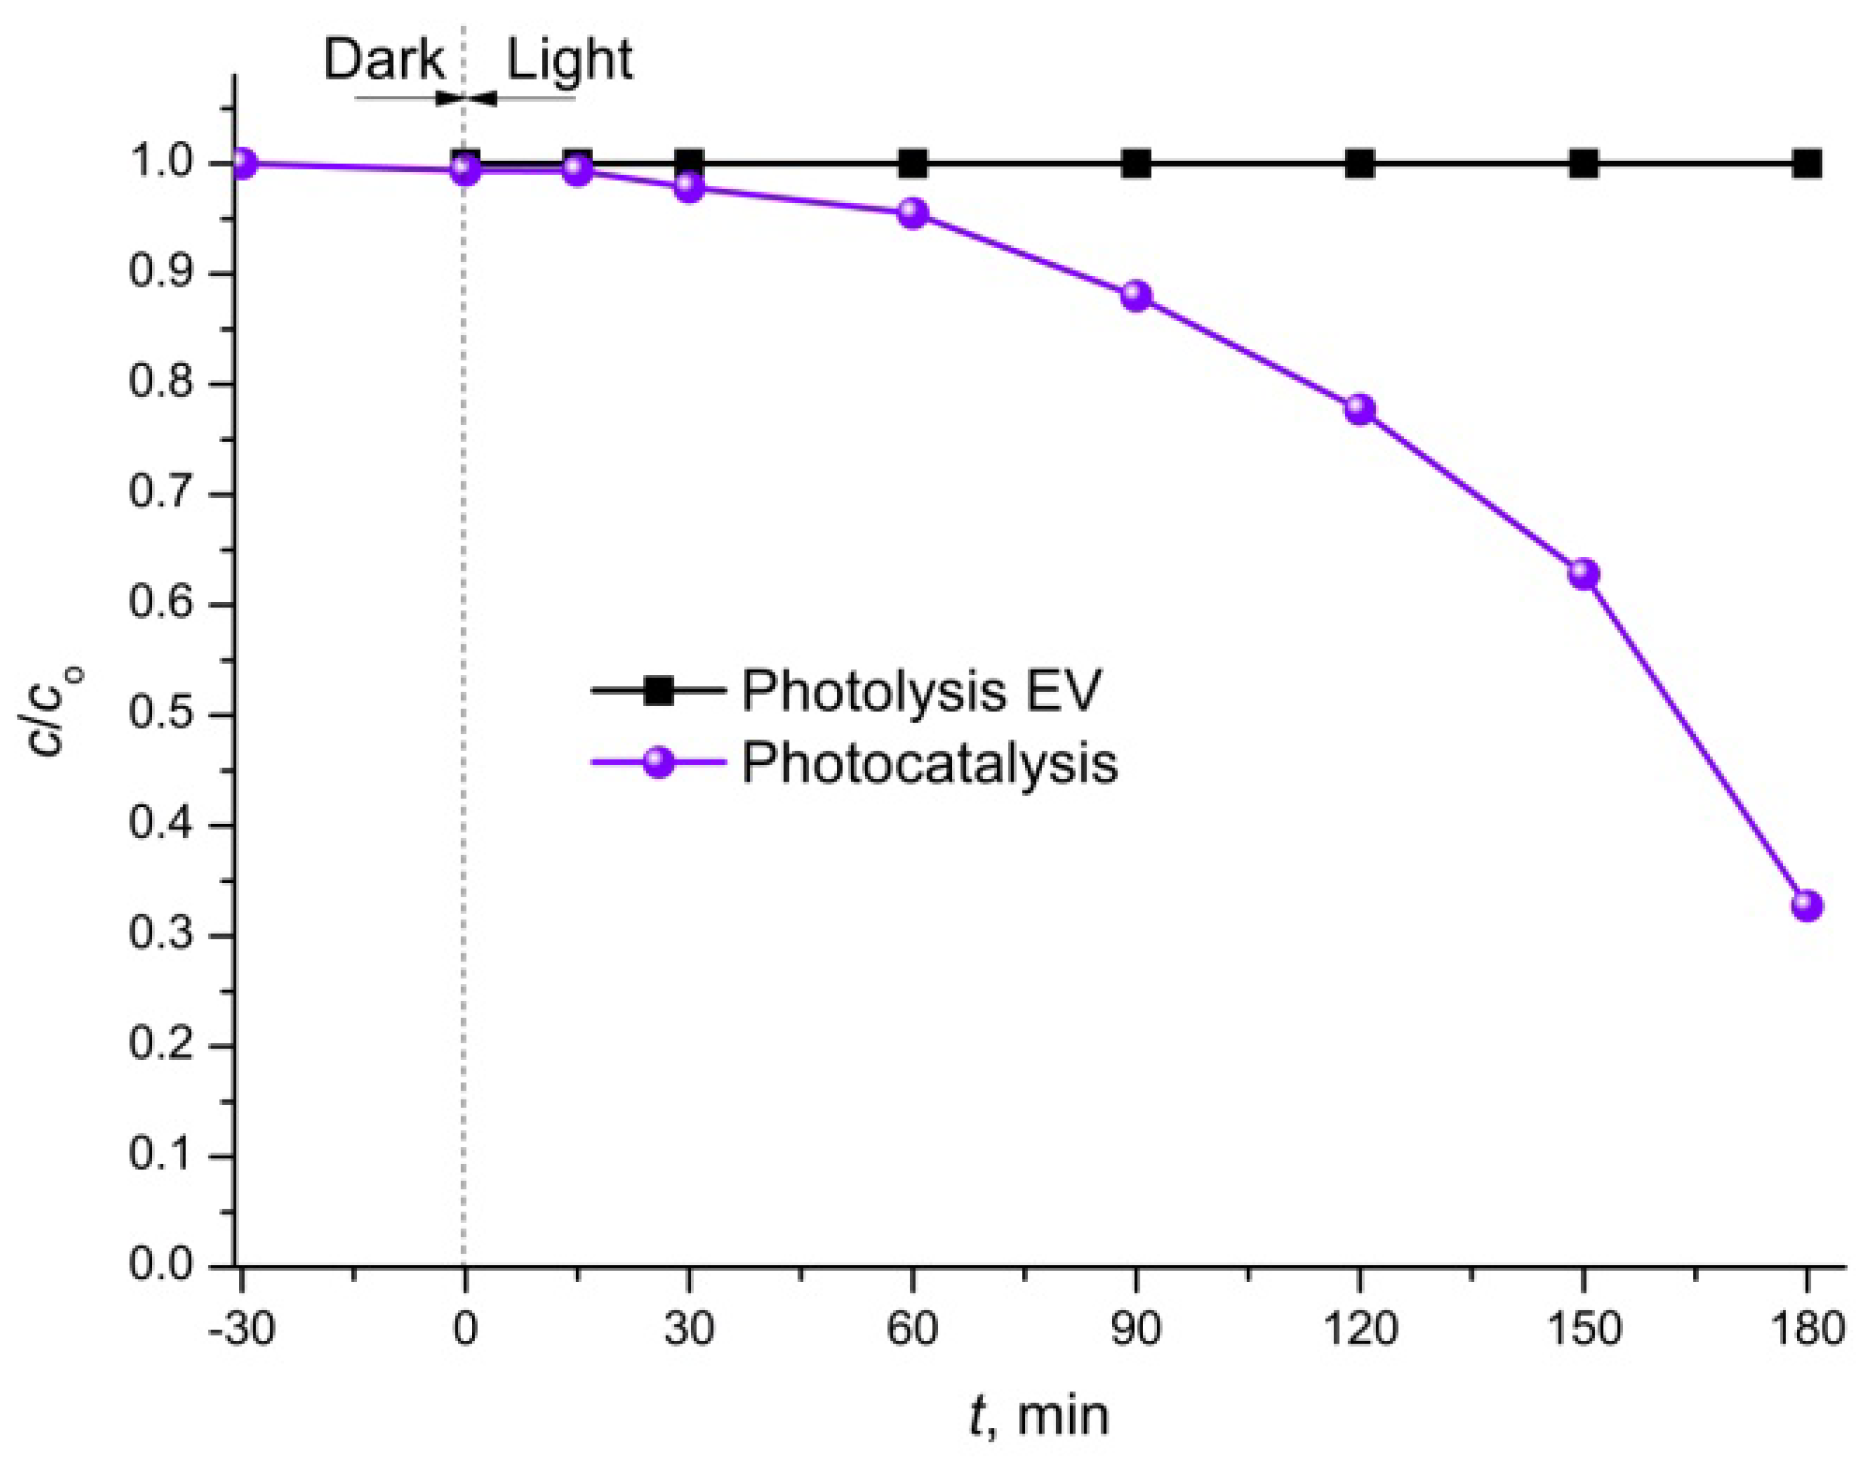
During the photodegradation measurements, it was first confirmed experimentally using UV–Vis spectroscopy that there was no photodegradation of the tested dye in the absence of a catalyst. To evaluate the photocatalytic performance of the modified SrTiO3, the dependence of the EV concentration on the irradiation time was measured, and the results are presented in Figure 5. Although the tested sample showed no adsorption of EV dye in the dark, the degradation under simulated solar light was notable, confirming that this powder was photocatalytically active for the degradation of industrial EV dye. This sample degraded 68% of the dye over 180 min of irradiation, confirming its potential for the photodegradation of harmful dye in water treatment.

3.5. Kinetics Modeling of the Photocatalytic Degradation of EV Dye

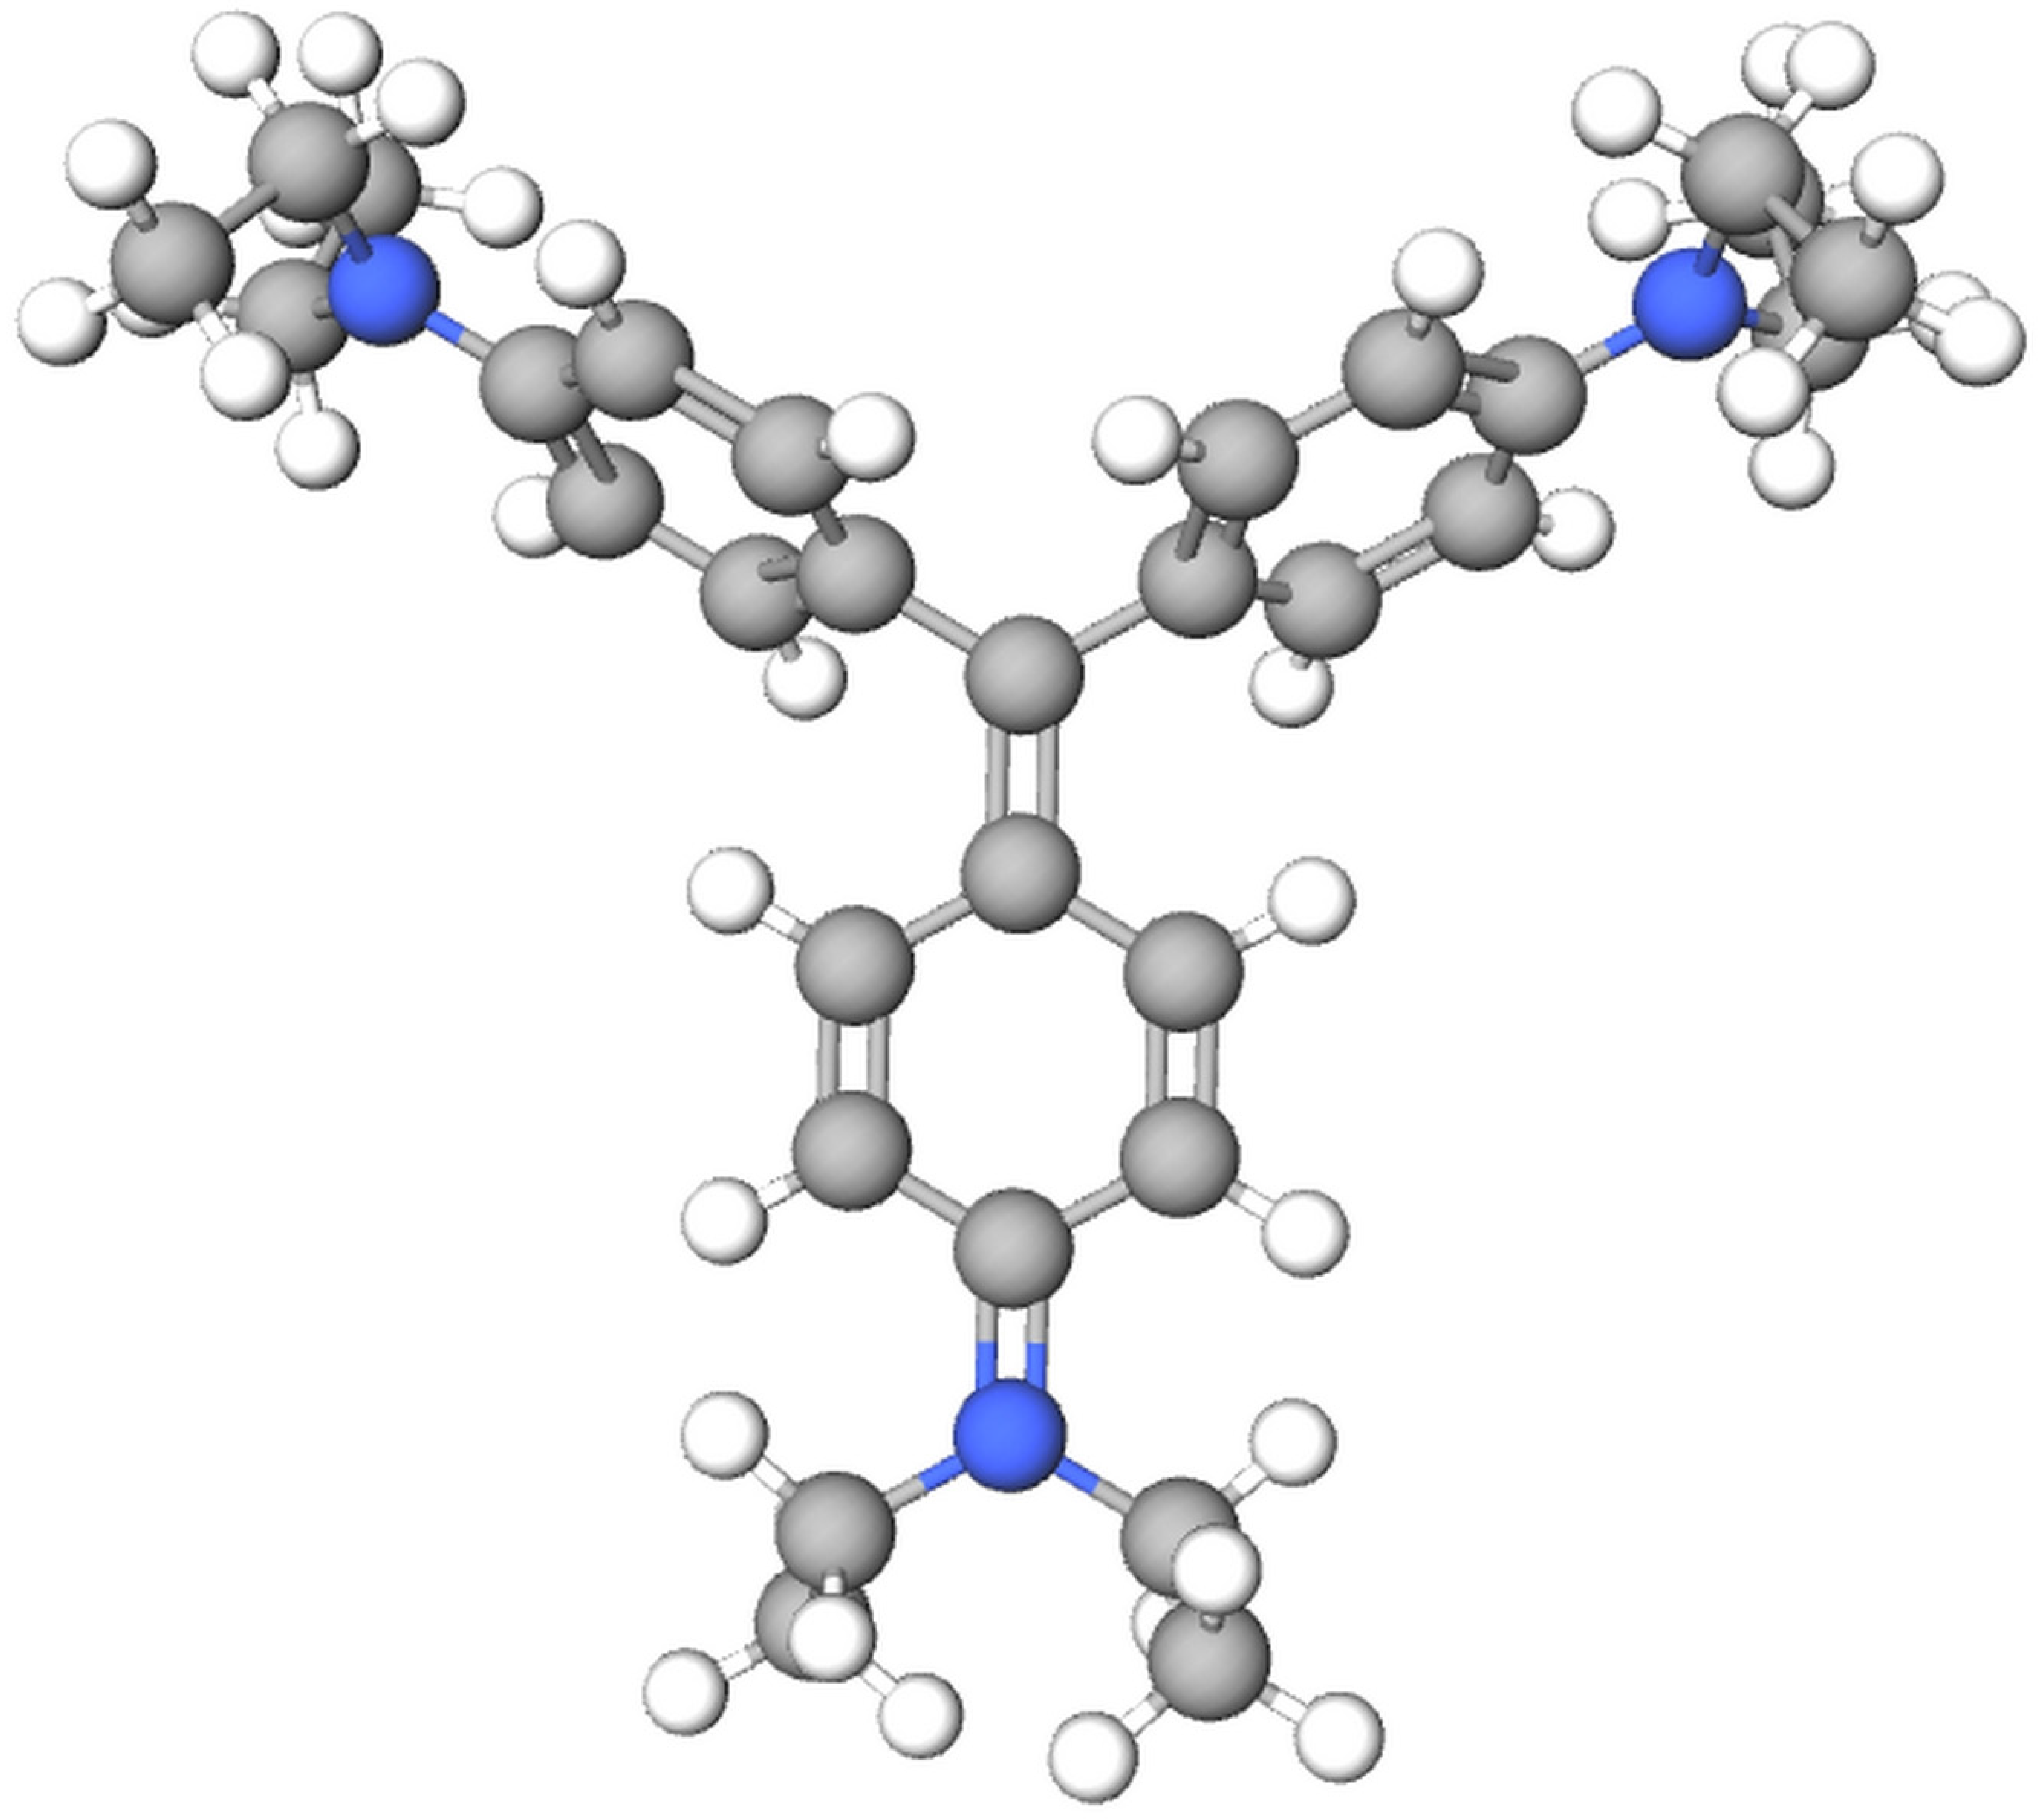
EV is a large molecule (molecular weight Mw = 492.1 g mol–1) (Figure 6); hence, its complete degradation is complex and passes through many intermediate stages [46]. This dye belongs to the basic dyes, which are cationic. It is very toxic to aquatic organisms and has long-term negative effects.
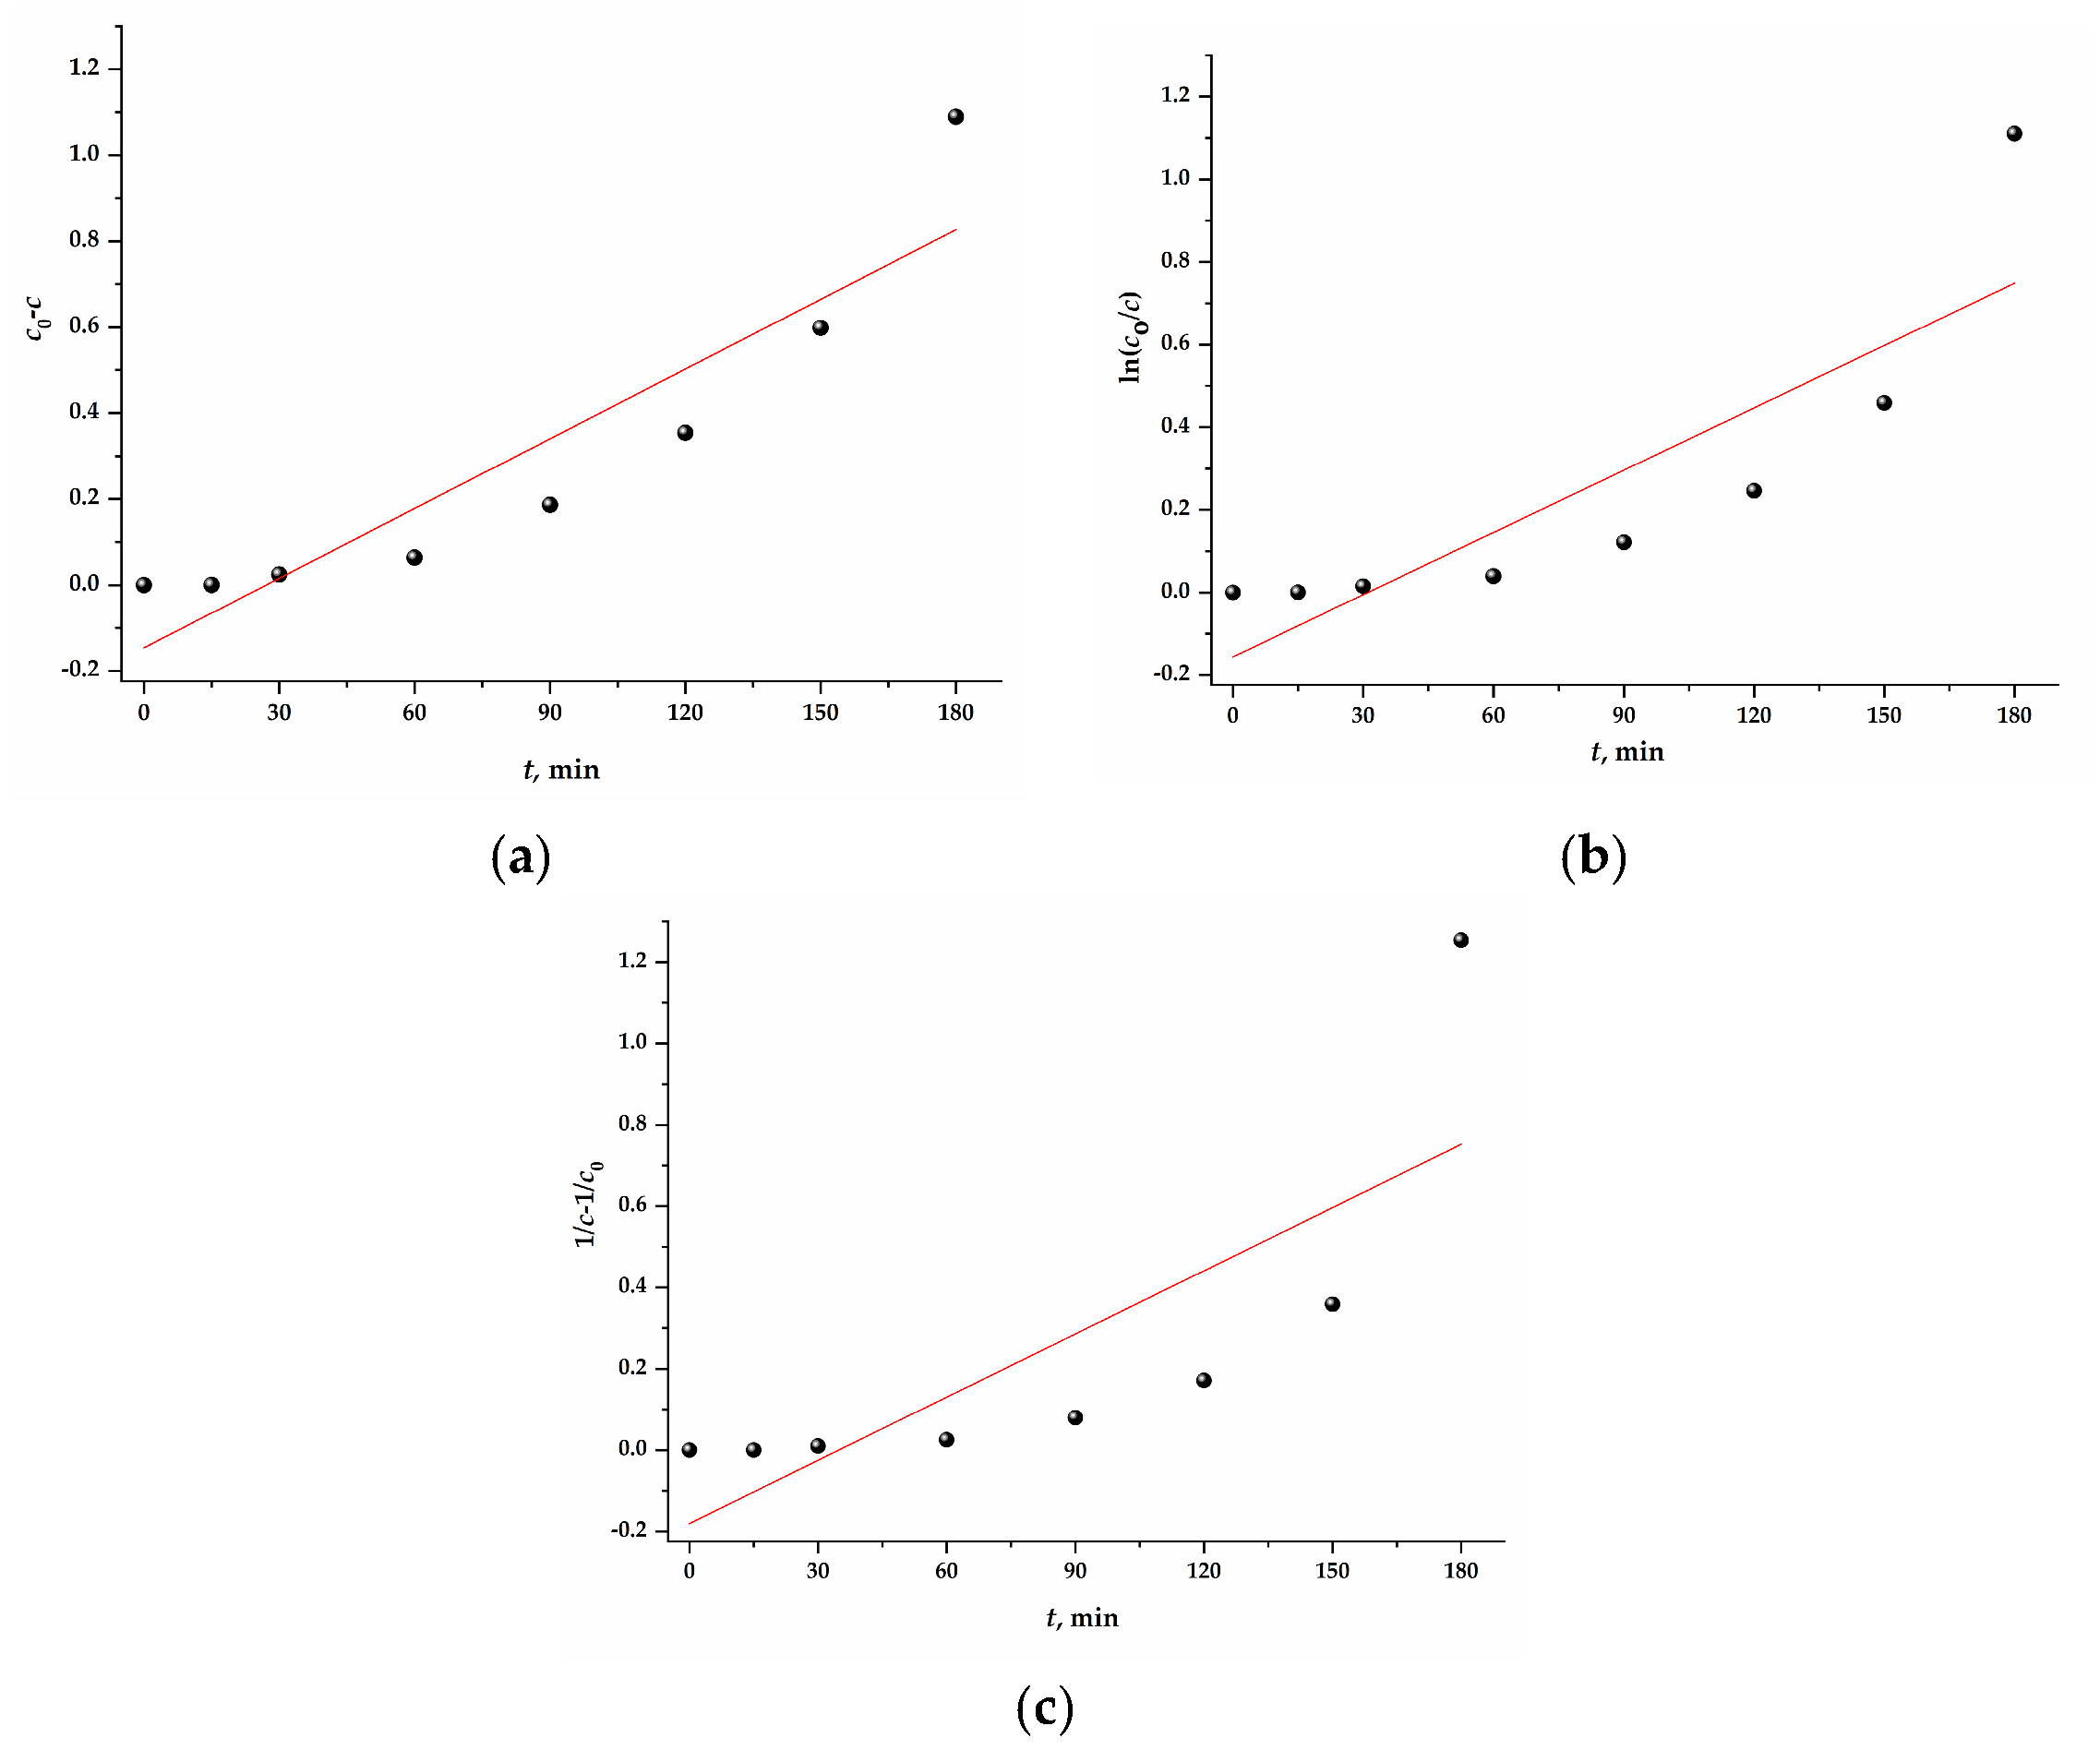
According to the literature, the kinetics of the photodegradation of most dyes can be described using the Langmuir–Hinshelwood kinetics model [47]. The kinetics parameters (rate constants, correlation factor) and proper reaction order were determined by comparing pseudo-zero (Equation (3)), -first (Equation (4)), and -second (Equation (5)) kinetics models:
c 0 c = k 0 × t
ln c 0 / c = k 1 × t
1 c 1 c 0 = k 2 × t
Here, c0 is the initial dye concentration (mg dm−3), c is the dye concentration (mg dm−3) at time t (min), and k0, k1, and k2 are zero-order, first-order, and second-order rate constants, respectively. Figure 7 shows experimental data fitted by pseudo-zero (Figure 7a), -first (Figure 7b), and -second (Figure 7c) order kinetics models. The obtained values of the kinetics parameters, calculated by fitting under the assumption of kinetic order, are listed in Table 2. For the pseudo-first and pseudo-second order, low correlation coefficient (R2) values (0.7 and 0.566, respectively) indicated that the degradation of EV dye by Mn@SrTiO3 did not follow these kinetics models. The high and acceptable R2 value (0.822) was found for Mn@SrTiO3 assuming a pseudo-zero kinetic order. This means that the photocatalytic degradation of EV can be well described by the pseudo-zero-order reaction in the presence modified SrTiO3 as photocatalysts under simulated solar light. In general, the pseudo-first kinetic order is mostly proper for anionic azo dyes concentration up to a few ppm and many studies were well described by this model [48]. On the other hand, pseudo-zero kinetic order [47,49,50,51] was also reported for the photocatalytic degradation of organic dyes rather than the first-order kinetics model, mostly for cationic dyes and higher dye concentrations.

3.6. Fractal Analysis of Mn@SrTiO3

The method of fractal regression was used to analyze a contour of an irregular Mn@SrTiO3 grain shape. This type of analysis represents a recently developed approach [8,12].
We identified a fractal function fitting the data. The function that approximates the data is the solution of the following system of iterative functional equations:
φ x + j p = a j φ x + b j x + c j ,
where x 0 , 1 , 0 j p 1 , and a j , b j , and c j are the parameters (real numbers) to be estimated, with 0 < a j < 1 . The default domain is [0,1). The solution of this system is the fractal function φ : [ 0,1 ) R . Parameter a j is the fractal coefficient and b j is the directional coefficient. a j is an indicator of the fractal oscillations of the data (greater, in absolute terms, means more fractal oscillations, and less, smoother data).
The goal is to obtain the shape of the self-similarity structure present in the data by dividing an interval into p subintervals. The second fractal level divides each subinterval again into another p subintervals. We define L as the number of fractal levels identified by the program. In this work, the parameters are p = 12 and L = 2 .
The study of fractal regression is defined and theoretically formulated in our previously published study [52]. We used software called Fractal Real Finder, developed by the author Cristina Serpa (the interested reader may obtain more information from pedagogical material available online in the ResearchGate page (https://www.researchgate.net/profile/Cristina-Serpa, accessed on 4 September 2024)), to obtain fitting approximation solutions, because there is no explicit analytical solution to the problem. This software is developed for a one-dimensional finite set of points. The analyzed FESEM image is of circular shape; therefore, a grid of polar coordinates to mark points in the contour (red dots) was used. Each point represents 1 of 144 angles and has a radius. The set of radii of all points is the input of the program, and then we obtain the estimated coefficients ( a j , b j , and c j ) of the fitted fractal function. The plot of the results is compared graphically in Figure 8. As can be observed, the reconstruction of the contour exhibited a high level of accuracy. The presence of fractal self-similarity was effectively determined through the application of a clearly defined fractal equation. The inherent fractal characteristics in Mn@SrTiO3 were subjected to a comprehensive and thorough analysis utilizing precise mathematical techniques, thereby enhancing our understanding of its complex nature.
The output of fractal regression from the software is given in Table 3. We emphasize that the fractal functions studied in this image are characterized by the fractal coefficients with absolute values in [ 0,1 ) , regardless of the scale of the data.
The next theoretical results show how to estimate the Hausdorff dimension knowing in advance the fractal coefficients estimated by the program [39].
Proposition 1.
The Hausdorff dimension of the graph of the function  φ  solution of the above system is upper-bounded by the solution  d  of:
j = 0 p 1 β j d = 1 ,
where  β j = m a x 1 p ,   a j ,   0 p p 1 .
This proposition states that only the fractal coefficients such that a j > 1 p are relevant for the computation of the Hausdorff dimension. We call these relevant coefficients.
In the case of the contour studied, the relevant coefficients are those greater than 0.08(3). They are a 2 = 0.124487 and a 6 = 0.186339 . The corresponding estimative for the Hausdorff dimension is 1.13679 .
In order to visualize the reason why the Hausdorff dimension of the estimative is not 1 (the value for functions with only non-relevant fractal coefficients), fractal functions are presented in another perspective; namely, if we plot the points and respective estimates in a different scale, then we may see the fractal oscillations that appear in the output of the program. Figure 9 shows the set of radii plotted in a Cartesian coordinate system, the domain being the standard interval [ 0,1 ) , and the scale of the range does not include zero.
Since it was shown that photocatalytic properties are highly dependent on morphological properties, with the data set of HD and different photocatalytic activities, correlation and prediction could be obtained in the future.

3.7. Fractal-like Photodegradation Reaction Kinetics

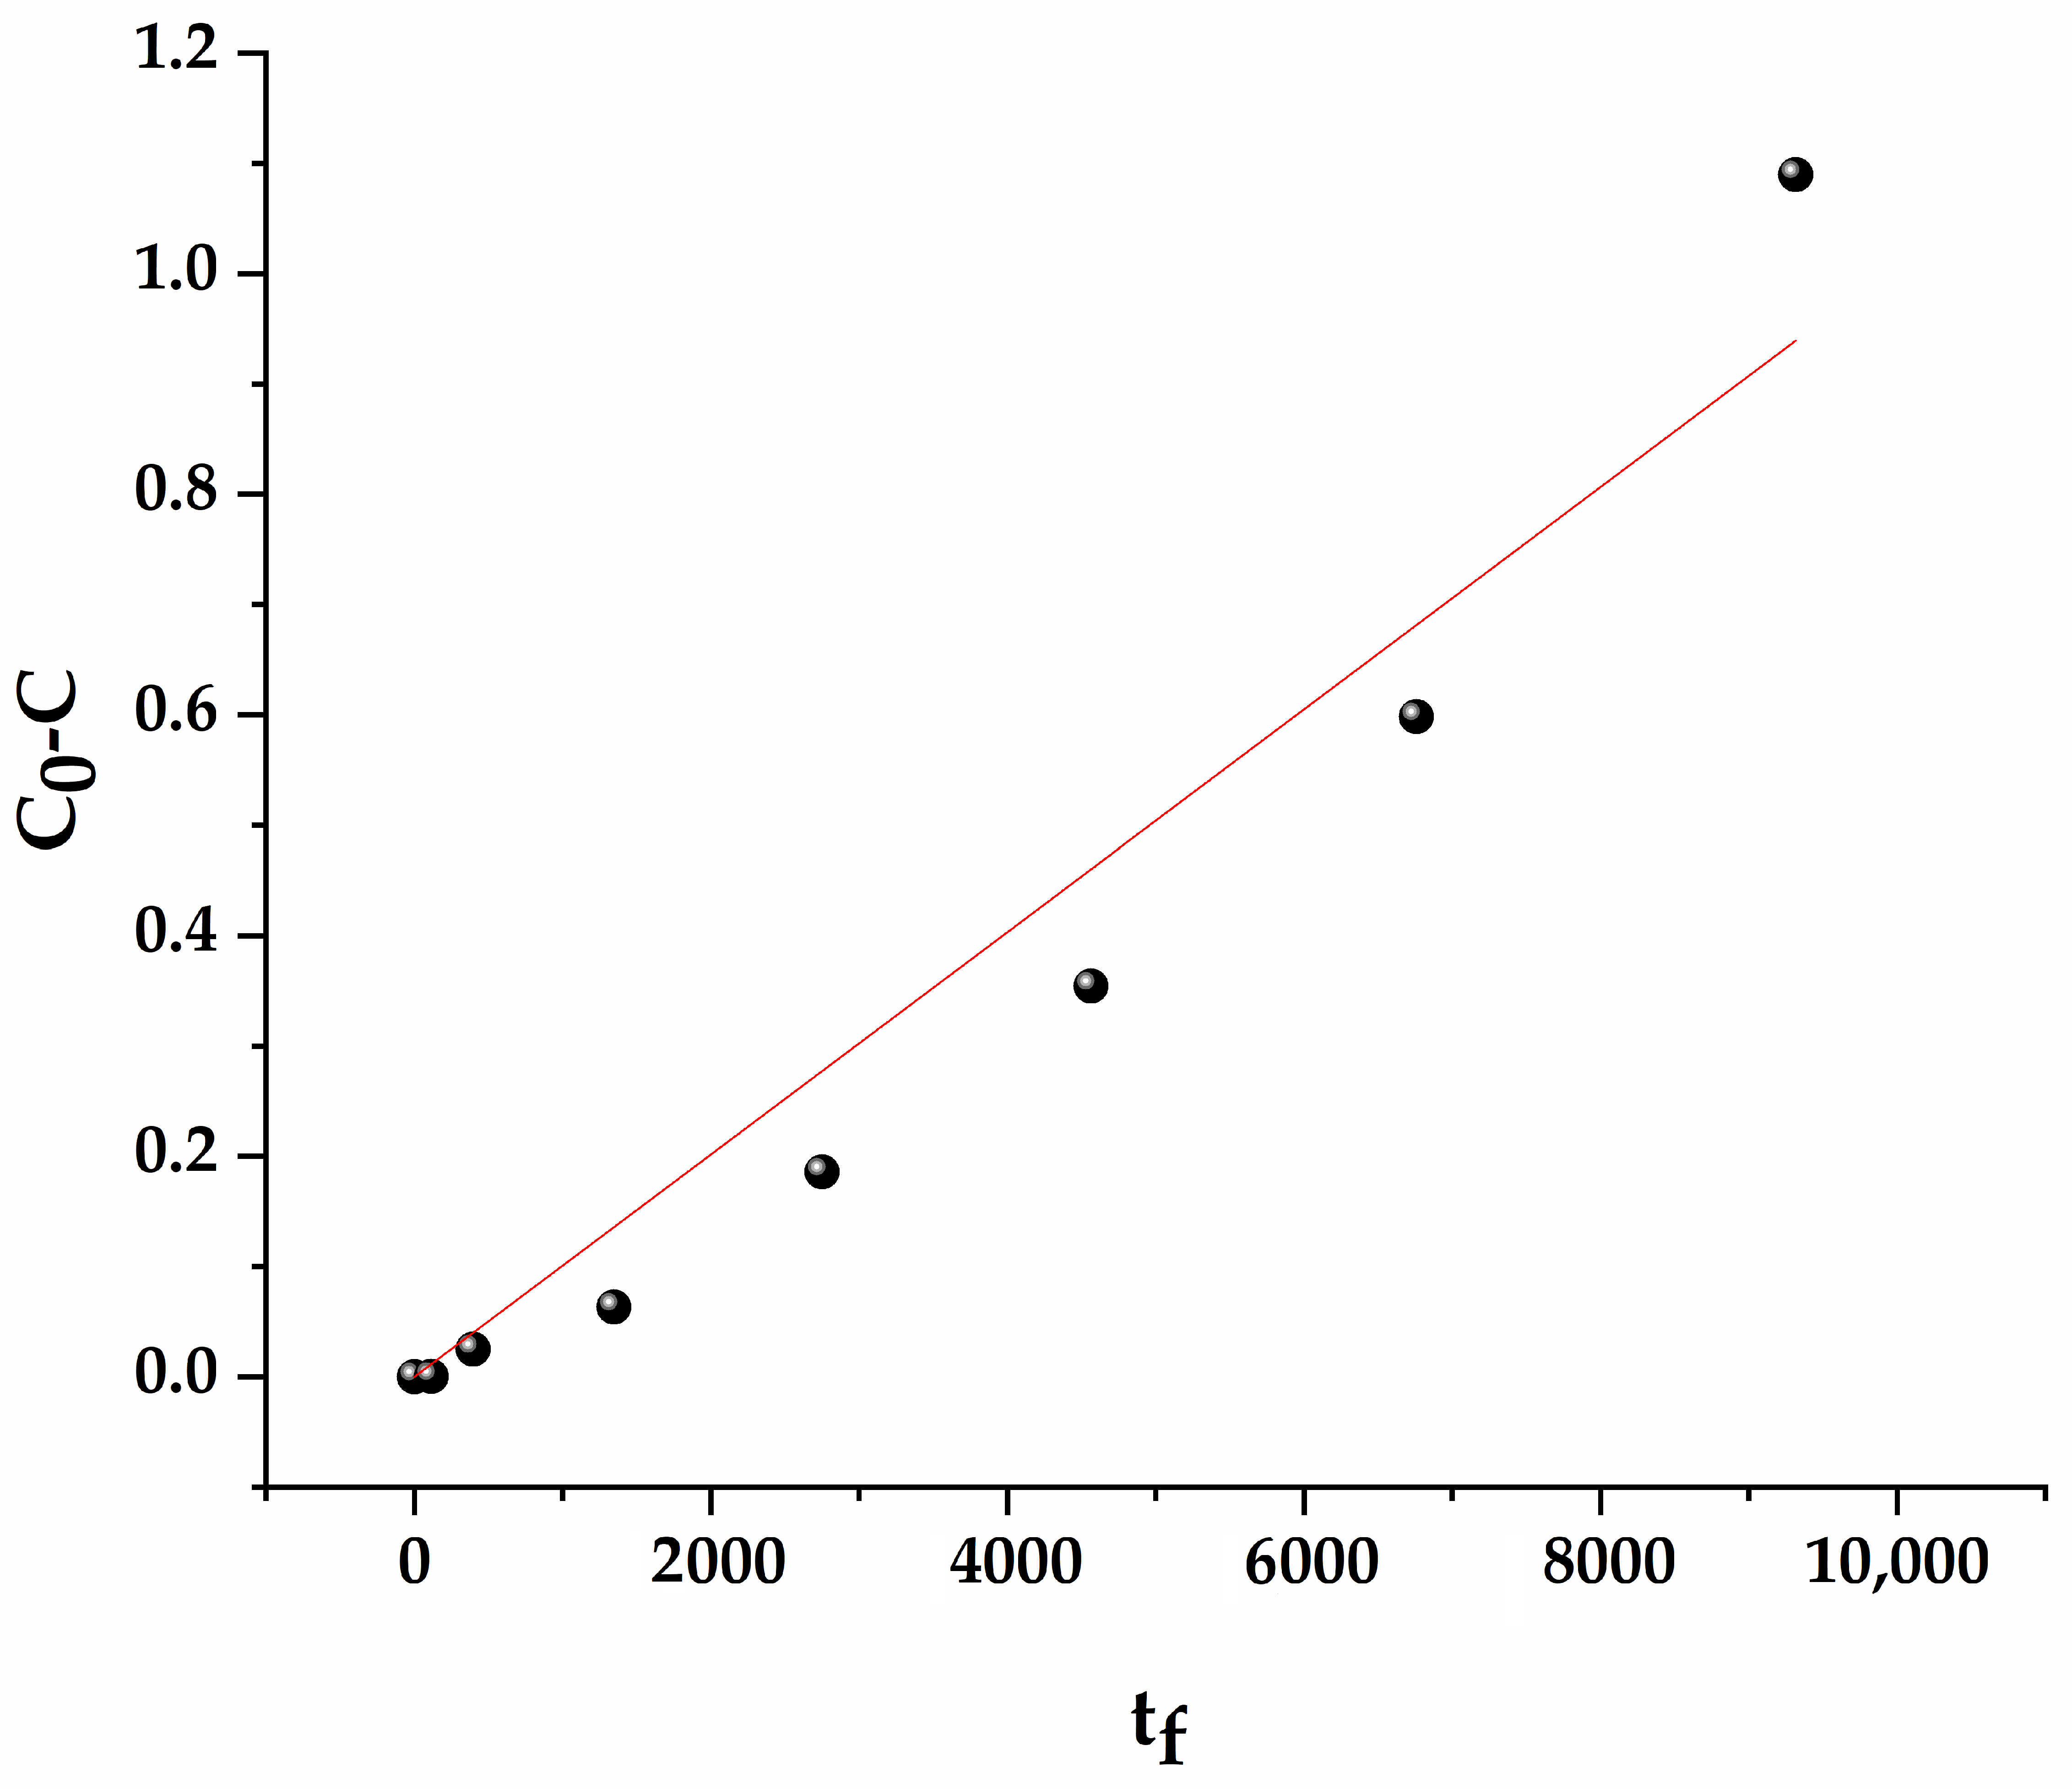
After the mathematical estimation of HD, it was implemented in the fitting photolytic degradation reaction order of EV in the presence of Mn@SrTiO3. As it was established, the closest kinetics model is pseudo-zero order. Fractal-based kinetics was applied in accordance with the model proposed by Kopelman [53,54]. For reactions on the fractal surface, the rate constant is dependent on time:
k f = k 0 × t 2 H D 1
If k0 is replaced by kf, then the following fractal kinetics model is obtained:
c 0 c = k 0 × t 1.75
Figure 10 represents the fractal-like kinetics model fit, where a better fit can be observed compared to the pseudo-zero order. The coefficient of determination value was 0.968.
It is obvious that the application of fractals in chemical kinetics can be valuable for the investigation of reaction rates. Future studies should also investigate the Mn@SrTiO3 Hausdorff dimension’s influence on the thermodynamic properties of photocatalysis, where a connection with the activation energy could be established.

4. Conclusions

The examination of the SrTiO3 doped with Mn involved a thorough analysis of its fractal characteristics utilizing a sophisticated mathematical technique known as fractal regression, resulting in the derivation of a highly accurate fitting approximation. Detailed structural assessments suggested the integration of Mn4+ ions within the crystalline lattice of SrTiO3. Furthermore, a crystallite size of 44 nanometers was determined. Upon subjecting the Mn@SrTiO3 composite to a photocatalytic activity test, it was observed that a substantial degradation rate of 68% for ethyl violet organic dye was achieved over a duration of 180 min under UV–Vis irradiation conditions. This notable performance highlights the significant potential of Mn@SrTiO3 as a viable candidate for applications in photocatalysis, an area of research important for environmental protection by facilitating the elimination of organic contaminants from water sources. Furthermore, the investigation into the photodegradation process indicated a good fitting with a pseudo-zero-order kinetics model, exhibiting a coefficient of determination (R2) value of 0.866. Through the utilization of contour analysis, the distinctive fractal morphology of the Mn@SrTiO3 particle was successfully identified, with an estimated Hausdorff dimension (HD) of 1.13679. The determined HD was included in the chemical kinetics in order to show the influence of morphology on the photodegradation reaction rate. After fitting with the fractal-like pseudo-zero order, the R2 value rose to 0.968, showing the contribution of fractal surface inclusion in the model. It should be emphasized that future studies focusing on the expansion of fractal shape data pertaining to photocatalysts could yield valuable insights into the inherent photocatalytic capabilities of such materials, including the correlation of HD with activation energy and photocatalytic activity dependence on temperature.

Author Contributions

Conceptualization, I.S. and A.S.; methodology, I.S.; software, C.S.; validation, I.S. and A.S.; formal analysis, I.S., C.S., B.S., I.J.C. and V.D.; investigation I.S.; writing—original draft preparation, I.S.; writing—review and editing, A.S., B.S. and V.R.; visualization, B.S. and A.S.; funding acquisition, I.S, V.R. and A.S. All authors have read and agreed to the published version of the manuscript.

Funding

This work was financially supported by the Ministry of Science, Technological Development and Innovation of the Republic of Serbia (Contract Nos. 451-03-66/2024-03/200026, 451-03-66/2024-03/200017, 451-03-66/2024-03/200053 and 451-03-65/2024-03/200135) and National Funding from FCT—Fundação para a Ciência e a Tecnologia, under the project: UIDB/04561/2020.

Data Availability Statement

The data presented in this study are available on request from the corresponding author. The data are not publicly available due to privacy.

Acknowledgments

We acknowledge the help of AI ChatGPT 4.0 tool for English editing.

Conflicts of Interest

The authors declare no conflicts of interest. The funders had no role in the design of the study; in the collection, analyses, or interpretation of data; in the writing of the manuscript; or in the decision to publish the results.

References

  1. Wang, L.; Tang, S. Investigation and Application of Fractals in Civil Engineering Materials. Fractal Fract. 2023, 7, 369. [Google Scholar] [CrossRef]
  2. Boeing, G. Visual Analysis of Nonlinear Dynamical Systems: Chaos, Fractals, Self-Similarity and the Limits of Prediction. Systems 2016, 4, 37. [Google Scholar] [CrossRef]
  3. Qiang, C.; Deng, Y.; Cheong, K.H. Information Fractal Dimension of Mass Function. Fractals 2022, 30, 2250110. [Google Scholar] [CrossRef]
  4. Duan, Q.; An, J.; Mao, H.; Liang, D.; Li, H.; Wang, S.; Huang, C. Review about the Application of Fractal Theory in the Research of Packaging Materials. Materials 2021, 14, 860. [Google Scholar] [CrossRef] [PubMed]
  5. Gordillo-Cruz, E.; Alvarez-Ramirez, J.; González, F.; De Los Reyes, J.A. Fractal Analysis of X-ray Diffraction Patterns of Zirconia–Alumina Mixed Oxides. Phys. A Stat. Mech. Its Appl. 2018, 512, 635–643. [Google Scholar] [CrossRef]
  6. Zhou, W.; Cao, Y.; Zhao, H.; Li, Z.; Feng, P.; Feng, F. Fractal Analysis on Surface Topography of Thin Films: A Review. Fractal Fract. 2022, 6, 135. [Google Scholar] [CrossRef]
  7. Paun, M.-A.; Nichita, M.-V.; Paun, V.-A.; Paun, V.-P. Fractal Analysis of Four Xerogels Based on TEGylated Phenothiazine and Chitosan. Gels 2023, 9, 435. [Google Scholar] [CrossRef]
  8. Stajcic, I.; Stajcic, A.; Serpa, C.; Vasiljevic-Radovic, D.; Randjelovic, B.; Radojevic, V.; Fecht, H. Microstructure of Epoxy-Based Composites: Fractal Nature Analysis. Fractal Fract. 2022, 6, 741. [Google Scholar] [CrossRef]
  9. Peng, D.; Li, X. Fractal Contact Analysis for Transversely Isotropic Piezoelectric Materials: Theoretical and Numerical Predictions. Tribol. Int. 2023, 181, 108323. [Google Scholar] [CrossRef]
  10. Wei, H.; Lv, X.; Zhao, Y.; Li, C.; Yan, H.; Sun, R.; Kang, M. Quantitative Description of Filler Dispersion in Composite Materials by Fractal Analysis and Fluorescent labeling-LSCM Visualization Technology. Polym. Compos. 2022, 43, 3598–3608. [Google Scholar] [CrossRef]
  11. Li, C.; Xu, Y.; Jiang, Z.; Yu, B.; Xu, P. Fractal Analysis on the Mapping Relationship of Conductivity Properties in Porous Material. Fractal Fract. 2022, 6, 527. [Google Scholar] [CrossRef]
  12. Khamoushi, K.; Serpa, C. Fractal Analysis and Microwave Properties of La (Mg ½ Ti ½) O3. Mater. Today Commun. 2024, 38, 107995. [Google Scholar] [CrossRef]
  13. Ahmed, M.A.; Mahmoud, S.A.; Mohamed, A.A. Unveiling the Photocatalytic Potential of Graphitic Carbon Nitride (g-C3N4): A State-of-the-Art Review. RSC Adv. 2024, 14, 25629–25662. [Google Scholar] [CrossRef] [PubMed]
  14. Khan, S.; Noor, T.; Iqbal, N.; Yaqoob, L. Photocatalytic Dye Degradation from Textile Wastewater: A Review. ACS Omega 2024, 9, 21751–21767. [Google Scholar] [CrossRef] [PubMed]
  15. Sarkar, S.; Ponce, N.T.; Banerjee, A.; Bandopadhyay, R.; Rajendran, S.; Lichtfouse, E. Green Polymeric Nanomaterials for the Photocatalytic Degradation of Dyes: A Review. Environ. Chem. Lett. 2020, 18, 1569–1580. [Google Scholar] [CrossRef]
  16. Sarkodie, B.; Amesimeku, J.; Frimpong, C.; Howard, E.K.; Feng, Q.; Xu, Z. Photocatalytic Degradation of Dyes by Novel Electrospun Nanofibers: A Review. Chemosphere 2023, 313, 137654. [Google Scholar] [CrossRef]
  17. Shabil Sha, M.; Anwar, H.; Musthafa, F.N.; Al-Lohedan, H.; Alfarwati, S.; Rajabathar, J.R.; Khalid Alahmad, J.; Cabibihan, J.-J.; Karnan, M.; Kumar Sadasivuni, K. Photocatalytic Degradation of Organic Dyes Using Reduced Graphene Oxide (rGO). Sci. Rep. 2024, 14, 3608. [Google Scholar] [CrossRef]
  18. Deepracha, S.; Ayral, A.; Ogawa, M. Acceleration of the Photocatalytic Degradation of Organics by In-Situ Removal of the Products of Degradation. Appl. Catal. B Environ. 2021, 284, 119705. [Google Scholar] [CrossRef]
  19. Günnemann, C.; Curti, M.; Sieland, F.; Bahnemann, D.W. Charge Carriers in Commercial Photocatalysts: Fractal Kinetics and Effect of “Inert” Additives. Top. Catal. 2021, 64, 737–747. [Google Scholar] [CrossRef]
  20. Wang, C.L. Fractional Kinetics of Photocatalytic Degradation. J. Adv. Dielect. 2018, 8, 1850034. [Google Scholar] [CrossRef]
  21. Sieland, F.; Schneider, J.; Bahnemann, D.W. Fractal Charge Carrier Kinetics in TiO2. J. Phys. Chem. C 2017, 121, 24282–24291. [Google Scholar] [CrossRef]
  22. Dobrescu, G.; Papa, F.; State, R.; Raciulete, M.; Berger, D.; Balint, I.; Ionescu, N.I. Modified Catalysts and Their Fractal Properties. Catalysts 2021, 11, 1518. [Google Scholar] [CrossRef]
  23. Hou, D.; Hu, X.; Ho, W.; Hu, P.; Huang, Y. Facile Fabrication of Porous Cr-Doped SrTiO3 Nanotubes by Electrospinning and Their Enhanced Visible-Light-Driven Photocatalytic Properties. J. Mater. Chem. A 2015, 3, 3935–3943. [Google Scholar] [CrossRef]
  24. Siqueira, F.B.L.B.; Campos, D.C. Application of Impedance Spectroscopy to Analyze the Electrical Properties of Cobalt Doped SrTiO3. Solid State Ion. 2023, 391, 116140. [Google Scholar] [CrossRef]
  25. Liu, J.; Wang, Y.; Zhai, X.; Xue, Y.; Hao, L.; Zhu, H.; Liu, C.; Cheng, H.; Ouyang, J. Energy Storage Properties of Sol–Gel-Processed SrTiO3 Films. Materials 2022, 16, 31. [Google Scholar] [CrossRef]
  26. Xie, T.; Wang, Y.; Liu, C.; Xu, L. New Insights into Sensitization Mechanism of the Doped Ce (IV) into Strontium Titanate. Materials 2018, 11, 646. [Google Scholar] [CrossRef]
  27. Sharma, N.; Hernadi, K. The Emerging Career of Strontium Titanates in Photocatalytic Applications: A Review. Catalysts 2022, 12, 1619. [Google Scholar] [CrossRef]
  28. Fadlallah, M.M.; Gogova, D. Theoretical Study on Electronic, Optical, Magnetic and Photocatalytic Properties of Codoped SrTiO3 for Green Energy Application. Micro Nanostruct. 2022, 168, 207302. [Google Scholar] [CrossRef]
  29. Rocha-Rangel, E.; Pech-Rodríguez, W.J.; López-Hernández, J.; Calles-Arriaga, C.A.; Armendáriz-Mireles, E.N.; Castillo-Robles, J.A.; Rodríguez-García, J.A. Synthesis of SrTiO3 by the Calcination of SrCO3 and TiO2 Mixtures Intensively Ground by Means of High Energy Milling. Arch. Metall. Mater. 2020, 65, 621–626. [Google Scholar] [CrossRef]
  30. Yuan, Z.; Guo, M.; Shi, Q.; Liang, S.; Chen, Z.; Wang, S.; Chen, D.; Jiang, X.; Wei, F.; Liang, Z. Preparation and Piezoelectric Assisted Photocatalytic Degradation of BaTiO3/SrTiO3 Nanocomposites. Ceram. Int. 2024, 50, S0272884224027123. [Google Scholar] [CrossRef]
  31. Xin, X.; Zou, H.; Du, S.; Bao, Y.; Zhang, F. Visible-Light Harvesting SrTiO3 Solid Solutions for Photocatalytic Hydrogen Evolution from Water. ChemSusChem 2024, e202400533. [Google Scholar] [CrossRef] [PubMed]
  32. Basumatary, P.; Saha, S.; Ramchiary, A.; Konwar, D. Development of Bifunctional SrTiO3/SrMoO4 Heterojunction Catalyst for Efficient Adsorption and Photocatalytic Performance Evaluation. J. Phys. Chem. Solids 2024, 188, 111939. [Google Scholar] [CrossRef]
  33. Zhang, Y.; Wu, X.; Wang, Z.-H.; Peng, Y.; Liu, Y.; Yang, S.; Sun, C.; Xu, X.; Zhang, X.; Kang, J.; et al. Crystal Facet Engineering on SrTiO3 Enhances Photocatalytic Overall Water Splitting. J. Am. Chem. Soc. 2024, 146, 6618–6627. [Google Scholar] [CrossRef] [PubMed]
  34. Kala, K.; Jeyalakshmi, M.S.; Mohandoss, S.; Chandrasekaran, R. Evolution of Anticancer, Antioxidant and Photocatalytic Activities of Biosynthesized MnO2 Nanoparticles Using Aqueous Extract of Sida Acuta. Surf. Interfaces 2023, 40, 103136. [Google Scholar] [CrossRef]
  35. Malhotra, M.; Poonia, K.; Singh, P.; Khan, A.A.P.; Thakur, P.; Van Le, Q.; Helmy, E.T.; Ahamad, T.; Nguyen, V.-H.; Thakur, S.; et al. An Overview of Improving Photocatalytic Activity of MnO2 via the Z-Scheme Approach for Environmental and Energy Applications. J. Taiwan Inst. Chem. Eng. 2024, 158, 104945. [Google Scholar] [CrossRef]
  36. Arunpandian, M.; Oh, T.H.; Sriram, G. Breakthrough in High-Efficiency Photocatalytic Degradation of Acebutolol by Advanced Binary CeO2–MnO2 Oxide System. Molecules 2024, 29, 2854. [Google Scholar] [CrossRef]
  37. Singh, V.K.; Kumar, K.; Prasad, T.; Rai, S.; Chaudhary, A.; Tungala, K.; Das, A. Fabrication of Cationic Microgels Doped MnO2/Fe3O4 Nanocomposites, and Study of Their Photocatalytic Performance and Reusability in Organic Transformations. Polym. Adv. Technol. 2024, 35, e6295. [Google Scholar] [CrossRef]
  38. Elhmali, H.T.; Stajcic, I.; Stajcic, A.; Pesic, I.; Jovanovic, M.; Petrovic, M.; Radojevic, V. Influence of Novel SrTiO3/MnO2 Hybrid Nanoparticles on Poly (Methyl Methacrylate) Thermal and Mechanical Behavior. Polymers 2024, 16, 278. [Google Scholar] [CrossRef]
  39. Meneses-Franco, A.; Campos-Vallette, M.; Vásquez, S.O.; Soto-Bustamante, E.A. Er-Doped Nanostructured BaTiO3 for NIR to Visible Upconversion. Materials 2018, 11, 1950. [Google Scholar] [CrossRef]
  40. Charan Prasanth, S.; Jose, R.; Vijay, A.; Vineetha, P.; Venkata Saravanan, K. An Investigation of Thermoelectric Power Factor of Mn and Nb Doped SrTiO3 Ceramics. Mater. Today Proc. 2022, 51, 1751–1753. [Google Scholar] [CrossRef]
  41. Shannon, R.D. Revised Effective Ionic Radii and Systematic Studies of Interatomic Distances in Halides and Chalcogenides. Acta Cryst. A 1976, 32, 751–767. [Google Scholar] [CrossRef]
  42. Mote, V.; Purushotham, Y.; Dole, B. Williamson-Hall Analysis in Estimation of Lattice Strain in Nanometer-Sized ZnO Particles. J. Theor. Appl. Phys. 2012, 6, 6. [Google Scholar] [CrossRef]
  43. Hassanzadeh-Tabrizi, S.A. Precise Calculation of Crystallite Size of Nanomaterials: A Review. J. Alloys Compd. 2023, 968, 171914. [Google Scholar] [CrossRef]
  44. Fiat Varol, S.; Babür, G.; Çankaya, G.; Kölemen, U. Synthesis of Sol–Gel Derived Nano-Crystalline ZnO Thin Films as TCO Window Layer: Effect of Sol Aging and Boron. RSC Adv. 2014, 4, 56645–56653. [Google Scholar] [CrossRef]
  45. Kelly, M.N.; Rheinheimer, W.; Hoffmann, M.J.; Rohrer, G.S. Anti-Thermal Grain Growth in SrTiO3: Coupled Reduction of the Grain Boundary Energy and Grain Growth Rate Constant. Acta Mater. 2018, 149, 11–18. [Google Scholar] [CrossRef]
  46. Chen, C.-C.; Lu, C.-S.; Chung, Y.-C. Photocatalytic Degradation of Ethyl Violet in Aqueous Solution Mediated by TiO2 Suspensions. J. Photochem. Photobiol. A Chem. 2006, 181, 120–125. [Google Scholar] [CrossRef]
  47. Lam, S.-M.; Sin, J.-C.; Abdullah, A.Z.; Mohamed, A.R. Degradation of Wastewaters Containing Organic Dyes Photocatalysed by Zinc Oxide: A Review. Desalin. Water Treat. 2012, 41, 131–169. [Google Scholar] [CrossRef]
  48. Konstantinou, I.K.; Albanis, T.A. TiO2-Assisted Photocatalytic Degradation of Azo Dyes in Aqueous Solution: Kinetic and Mechanistic Investigations. Appl. Catal. B Environ. 2004, 49, 1–14. [Google Scholar] [CrossRef]
  49. Brites, F.F.; Santana, V.S.; Fernandes-Machado, N.R.C. Effect of Support on the Photocatalytic Degradation of Textile Effluents Using Nb2O5 and ZnO: Photocatalytic Degradation of Textile Dye. Top Catal. 2011, 54, 264–269. [Google Scholar] [CrossRef]
  50. Ran, X.; Wang, L.; Xiao, B.; Lei, L.; Zhu, J.; Liu, Z.; Xi, X.; Feng, G.; Li, R.; Feng, J. Effective Removal of Methylene Blue on EuVO4/g-C3N4 Mesoporous Nanosheets via Coupling Adsorption and Photocatalysis. Int. J. Mol. Sci. 2022, 23, 10003. [Google Scholar] [CrossRef]
  51. Li, X.; Anwer, S.; Guan, Q.; Li, B.; Chan, V.; Palmisano, G.; Zheng, L. Surface Diffusion Induced Degradation Enhancement and Zero-Order Kinetics in Edge-Connected MoS2/Au/TiO2 Z-Scheme Photocatalytic System. Chem. Eng. Sci. 2024, 284, 119501. [Google Scholar] [CrossRef]
  52. Buescu, J.; Serpa, C. Fractal and Hausdorff Dimensions for Systems of Iterative Functional Equations. J. Math. Anal. Appl. 2019, 480, 123429. [Google Scholar] [CrossRef]
  53. Kopelman, R. Fractal Reaction Kinetics. Science 1988, 241, 1620–1626. [Google Scholar] [CrossRef] [PubMed]
  54. Guo, X.Y.; Zhong, B.; Peng, S.Y. Kinetics of the First-Order Reaction on Fractals and Monte Carlo Simulations. Chem. Phys. Lett. 1995, 242, 228–231. [Google Scholar] [CrossRef]
Figure 1. FTIR spectra of hybrid SrTiO3/MnO2 and Mn@SrTiO3.
Fractalfract 08 00560 g001
Figure 2. XRD pattern of the modified SrTiO3.
Fractalfract 08 00560 g002
Figure 3. Williamson–Hall plot of βcosϴ vs. sinϴ of modified SrTiO3.
Fractalfract 08 00560 g003
Figure 4. FESEM images of sintered Mn@SrTiO3.
Fractalfract 08 00560 g004
Figure 5. Adsorption and photodegradation of EV dye in the presence of modified SrTiO3 nanopowder.
Fractalfract 08 00560 g005
Figure 6. The structural formula of cationic EV dye used in photocatalytic experiment shown by the MolView 3D v2.4. modeling software (C—grey; N—blue; H—white spheres).
Fractalfract 08 00560 g006
Figure 7. (a) Plots of c0−c, (b) plots of ln(c0/c), and (c) plots of 1/c−1/c0 versus time for the photodegradation of cationic EV dye in the presence of modified SrTiO3 under simulated solar light for 180 min.
Fractalfract 08 00560 g007
Figure 8. Enlarged Mn@SrTiO3 grain (left) and estimated fractal curve of grain (right).
Fractalfract 08 00560 g008
Figure 9. Original and estimated plot in Cartesian coordinate system.
Fractalfract 08 00560 g009
Figure 10. Fractal-like kinetics fit for photodegradation of EV.
Fractalfract 08 00560 g010
Table 1. The unit cell parameter (a), volume (V), average crystallite size (D), and microstrain of the mechanically activated SrTiO3 estimated by the Scherrer and W–H methods.
SampleUnit Cell Parameter (Å) and Volume (Å3)Scherrer MethodW–H Method
D
(nm)
D
(nm)
ε
(%)
δ
(nm–2)
Mn@SrTiO3a = 3.903(5)
V = 59.46(5)
41(1)44(3)0.02(2)5.2 × 10⁻⁴
Table 2. The values of the reaction rate constants (k) and the correlation factor (R2) of EV dye degradation in the presence of modified SrTiO3 for pseudo-zero, -first, and -second order, respectively.
SamplePseudo-Zero Order
c0c = k0t
Pseudo-First Order
ln(c0/c) = k1t
Pseudo-Second Order
1/c – 1/c0 = k2t
k0
(min−1)
R2k1
(min–1)
R2k2
(min−1)
R2
Mn@SrTiO30.0054(9)0.8220.005(1)0.7000.005(2)0.566
Table 3. Estimated coefficients for the fractal curve of Mn@SrTiO3.
01234567891011
a j −0.061−0.0230.3040.026−0.001−0.0450.186−0.080.0310.038−0.0510.035
b j −0.5770.4480.247−0.220.052−0.131−0.4610.0130.3460.194−0.5640.311
c j 3.2562.5592.5023.4263.2983.4312.9032.9912.8373.0023.5692.771
Disclaimer/Publisher’s Note: The statements, opinions and data contained in all publications are solely those of the individual author(s) and contributor(s) and not of MDPI and/or the editor(s). MDPI and/or the editor(s) disclaim responsibility for any injury to people or property resulting from any ideas, methods, instructions or products referred to in the content.