Abstract
It is of great significance to understand the particle distribution characteristics at different heights to effectively control particle pollution. Based on fractal theory, the fractal dimension of outdoor particles in a high-rise building in Xi’an and its relationship with the concentration of particles with different particle sizes are discussed and analyzed in this paper. The results indicate that the atmosphere in Xi’an is mainly composed of fine particles and that the average proportion of particles ranging from 0 to 1.0 µm is approximately 99.885% of the total particulates. The fractal dimension of particles in the atmosphere at different heights ranges from 5.014 to 5.764, with an average fractal dimension of 5.456. In summer, the fractal dimension of the outdoor particles on the 17th floor was the largest, at 5.764. The fractal dimension in summer is relatively high, being 0.158 higher than that in winter on average. The larger the fractal dimension, the higher the proportion of fine particles. In addition, the fractal dimension can characterize the adsorption of toxic and harmful gases by particles well. It provides parameter support for understanding particle distribution and the effective control of atmospheric particles at different heights and application values.
1. Introduction
Environmental pollution has always been a hot issue [1,2,3]. Related studies have shown that different particles can enter different areas in the human body and cause serious harm [4,5] and even death [6]. For example, particle sizes greater than 10 µm remain in the nasal cavity of the human body [6]; particle sizes between 2 and 10 µm will deposit in various parts of the respiratory system, and about 10% of the particles will deposit in the lungs [4,6]; and the particle sizes of less than 2 µm will enter the human blood circulation [5,6]. The toxic and harmful gases in the atmosphere, as well as the spread of viruses, can also exacerbate the damage to people’s physical health [7]. Therefore, people are paying more attention to this and are adopting relevant measures to control or reduce various problems caused by environmental pollution.
With the rapid development of infrastructure in China in recent years, a large number of high-rise and super-high-rise buildings have been built in cities and rural areas [8], and high-rise buildings in various regions have emerged. However, some research exists in the literature on the particle distribution characteristics of high-rise buildings at different heights [9]. At present, scholars worldwide have made some progress in studying the concentration distribution of atmospheric particles [10], the concentration distribution in the district heating period [11], and the correlation between particles and other pollutants [12,13]; however, the research conducted on the distribution characteristics of particles in the atmosphere remains insufficient. The main reason for this is that many factors affect the distribution of atmospheric particles, which can directly or indirectly lead to regional differences [14,15,16], such as urban development layout [14], industrial structure types [15], and the adjustment of energy supply methods [16].
In addition, the relevant literature shows us that particles present in the atmosphere are not spherical with multiform dimensions and that their related characteristics and motion trajectories are significantly different from spherical particles [17,18]. Particulate matter can act as a porous medium to allow some of its gases or organisms to adsorb and adhere to its surface, which results in structural changes [19,20,21,22], such as the adherence of fly ash particles to gas molecules [19], HCl gas adhering to fly ash particles [20], graphene-like nanosheets adsorbing gas molecules [21], and chemical reactions of VOCs or SVOCs occurring at the surface or in the bulk of aerosol or cloud particles [22]. This has resulted in some differences in the relevant research based on the spherical concept, which requires additional research on the counting concentration distribution of particles present in the atmosphere.
Many studies concern the analysis of particulate matter using stochastic methods, such as partial least squares (PLS), support vector machine (SVM), artificial neural networks (ANN) [23], learning models integrating CNN and GRU [24], and machine learning algorithms such as random forest (RF) [25,26]. Air pollutants can be measured in real time and the state of the air quality can be understood at present by using these methods. However, these methods can only predict the distribution and estimated values of particulates, and cannot describe the rules and shapes of particulates further. Fractals were originally introduced by Mandelbrot to describe the fractal behaviors of similar geometries in disordered and irregular objects [27], such as coastlines [28], porous media [29], and biological structures [30]. Fractal theory also can be used to describe the irregular sizes and shape distributions of atmospheric particles [31,32,33,34]. It has the unique advantage of describing the different condensed states, shapes, and distribution of the particles in the environment [31], such as through using the fractal dimension to describe the morphology and size of combustion soot particles [32], the fractal description of finely ground particles of natural quartz using the particle size [33], and the expression of the spray agglomeration of polymer particles [34]. Fractal theory and fractal parameters can provide more accurate descriptions of particle morphology, which can provide specific numerical representations for irregular descriptions. It also can more realistically provide feature parameters and convert abstract content into expressible parameters. Therefore, fractal theory has also been widely studied and applied to the research that has been carried out in recent years. There are currently many methods for calculating fractal dimension, such as the mass method [35], the box counting method [36], and the two-point correlation function method [37]. Those methods have been widely used to describe disordered and irregular objects. At present, some relevant fractal theories have been used in the relevant research conducted on particle morphology in China [38,39]; however, few reports exist on the research of quantitatively characterizing particle distributions with fractal dimensions at different heights in high-rise buildings. Additionally, even less research exists on Xi’an, which is located in the northwest region.
Therefore, based on fractal theory, the fractal dimension of outdoor atmospheric particles in a high-rise building in Xi’an and its relationship with the particle concentration under different particle sizes are discussed and analyzed in this paper. It provides data support for the effective control of the distribution of atmospheric particles at different heights.
2. Mathematical Model for Particle Distribution
2.1. Mathematical Model
The mathematical model for the particle distribution was established using the Mandelbrot fractal theory, which was based on the literature review [27,39,40,41,42]. The calculation is shown in Equation (1) [27,39,40,41,42]:
where is the number of particles larger than x [27,39,40,41,42]; D is the fractal dimension [27,39,40,41,42]; and C is constant [27,39,40,41,42].
The fractal dimension can characterize the non-uniformity of particle size distributions [27,28,40,41,43]. When the fractal dimension is 0, it indicates that the particles are of equal particle size and have no particle size distribution [27,28,40,41,43]; when the fractal dimension is equal to 2, it indicates that the mass of particles with different particle sizes is equal, that is, the mass of particles with different particle sizes is uniformly distributed [27,28,40,41,43]. When the fractal dimension is larger than 2, it indicates that the cumulative mass of small-sized particles is larger than that of large-sized particles [27,28,40,41,43]. When the fractal dimension is smaller than 2, it indicates that the cumulative mass of large-sized particles is greater than that of small-sized particles [27,28,40,41,43].
A flowchart of the calculation steps is presented in Figure 1. The calculation steps were as follows: (1) calculate the quantity percentage of different types of particles within different equivalent particle ranges; (2) obtain a quantity percentage higher than certain particles through the above-mentioned quantity percentage; (3) take the logarithmic form of the particle and quantity percentage values, draw the corresponding scatter plot in the log–log plot, and perform linear fitting; and (4) obtain the fractal dimension D of particles according to the slope of the straight line. The calculation is presented in Equation (2) [27,39,40,41,42,43,44]:
where k is the slope of the straight line.
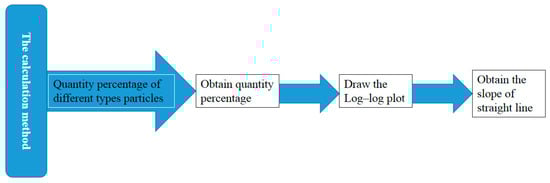
Figure 1.
Flowchart of the calculation steps.
The definition of fractal behavior needs to meet three elements: it must be (1) independent of the fractal generator [27,39,40,41,42,43,44], (2) not constrained by the geometries, spatial patterns, or statistical properties of the fractal generator [27,39,40,41,42,43,44], and (3) scale-invariant [27,39,40,41,42,43,44].
2.2. Particle Concentrations
The GRIMM1.109 aerosol particle size spectrometer was used to test the concentration of the particles, with a measurement range of 2,000,000 P/L and a repeatability value of 5%. The Testo480 instrument was used to measure the temperature and humidity levels, and it was supplied by testo AG, Schwarzwald, Germany; with a temperature measurement range of −100~+400 °C and a measurement accuracy of ±(0.3 °C~0.1% of the measured value). A humidity measurement range of 0~100% RH and a measurement accuracy of ±(1.4% RH~0.7% measurement value) were achieved. An HD37AB1347 indoor air quality monitor was used to measure the velocity, with an accuracy range of ±3%. A 29-floor high-rise building located in the Beilin district of Xi’an in China was selected as the test object. The measurement points were located on the 1st, 7th, 11th, 17th, and 27th floors, respectively, which were 1.5, 23.1, 36.3, 56.1, and 89.1 m above the ground. The five different testing times were as follows: 8:00, 12:00, 15:00, 18:00, and 22:00. The testing date was 22 July 2021 in summer and 15 December 2021 in winter. Each group was tested for 10 min and the average value of 10 min was used for the calculation and analysis.
3. Results
3.1. Particle Distributions at Different Heights
The counting concentration distribution of atmospheric particles during the test period is presented in Figure 2.
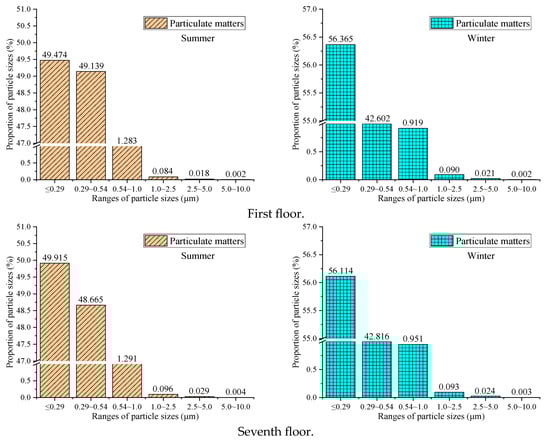
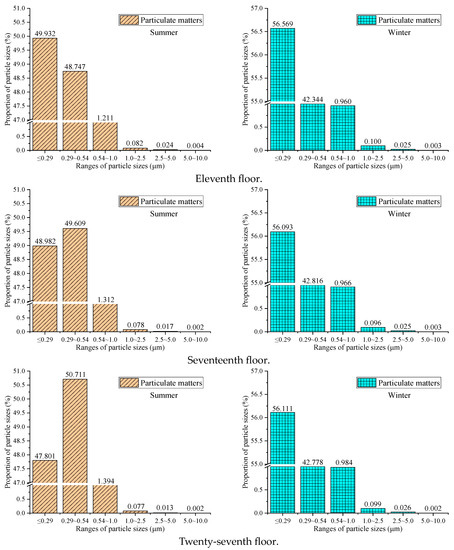
Figure 2.
Outdoor atmospheric particle distribution.
Figure 2 shows that the particles sized 0 to 0.54 µm on different floors (1st, 7th, 11th, 17th, and 27th) accounting for the total number of particles present during the summer period are 98.613%, 98.579%, 98.679%, 98.591%, and 98.512%, respectively. The particles ranging from 0.54 to 1.0 µm on different floors accounting for the total number of particles are 1.283%, 1.291%, 1.211%, 1.312%, and 1.394%, respectively. The particles ranging from 1.0 to 2.5 µm on different floors accounting for the total number of particles are 0.084%, 0.096%, 0.082%, 0.078%, and 0.077%, respectively. The particles larger than 2.5 µm on different floors accounting for the total number of particles are 0.021%, 0.033%, 0.028%, 0.019%, and 0.016%, respectively. It can be observed that, during the summer period, the majority of the particles ranged from 0 to 0.54 µm in size.
The particles ranging from 0 to 0.54 µm on different floors (1st, 7th, 11th, 17th, and 27th) accounting for the total number of particles during the winter period were 98.967%, 98.929%, 98.912%, 98.910%, and 98.889%, respectively. The particles ranging from 0.54 to 1.0 µm on different floors accounting for the total number of particles were 0.919%, 0.951%, 0.960%, 0.966%, and 0.984%, respectively. The particles ranging from 1.0 to 2.5 µm on different floors accounting for the total number of particles were 0.090%, 0.093%, 0.100%, 0.096%, and 0.000%, respectively. The particles larger than 2.5 µm on different floors accounting for the total number of particles were 0.024%, 0.027%, 0.028%, 0.028%, and 0.028%, respectively. The majority of the particles ranged from 0 to 0.54 µm in size during the summer period.
From the analysis of the particle-counting concentration distribution presented in Figure 2, the concentration of particles ranging from 0 to 0.54, 1.0 to 2.5, and above 2.5 µm on different floors in winter is higher than those in summer, while the concentration of particles ranging from 0.54 to 1.0 µm in winter is lower than that in summer. The particles ranging from 0 to 2.5 µm on different floors accounted for the vast majority present during the testing of atmospheric levels below 10 µm; the results were 99.978%, 99.970%, 99.972%, 99.976%, and 99.978%, respectively, with an average of 99.975%. Among them, the particles ranging from 0 to 1.0 µm on different floors accounted for 99.891%, 99.875%, 99.881%, 99.889%, and 99.890%, respectively, with an average of 99.885%. The atmosphere in Xi’an is mainly composed of fine particles. This conclusion is consistent with the results presented in the relevant literature [45], which supports the results presented in this paper. These small particles pose a more serious threat [46]; therefore, there is an urgent need to remove them from the atmosphere. The percentage of particle concentration to total particles at different times is presented in Table 1.

Table 1.
Concentration percentage of particles at different times in the atmosphere.
Table 1 shows that the highest concentration percentage of particles with different particle sizes occurred at 15:00 in summer and at 16:00 in winter. This is because the summer temperature is relatively high, and the outdoor temperature reaches its highest at 12:00 and 15:00, which accelerates the movement of particles, especially small particles [6]. As a result, the concentration percentage of particles with different particle sizes in the atmosphere is the highest. In winter, due to the demand for heating, the concentration of outdoor particles is relatively high. In addition, at the peak of 18:00 in the afternoon, factors such as commuting and cooking also affect the concentration of particles with different particle sizes [6]. Therefore, the study of typical seasons is more meaningful. In addition, it can also be seen that the main distribution of fine particles is in the atmospheric environment.
3.2. Distribution of Fractal Dimension of Particles at Different Heights
The relationship between the particle fractal dimension and particle size in the atmosphere in Xi’an was provided by Equation (1), as shown in Figure 3.
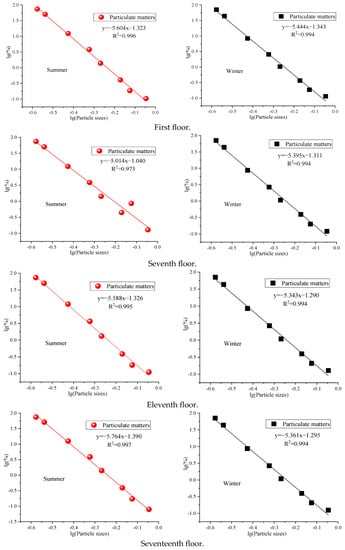
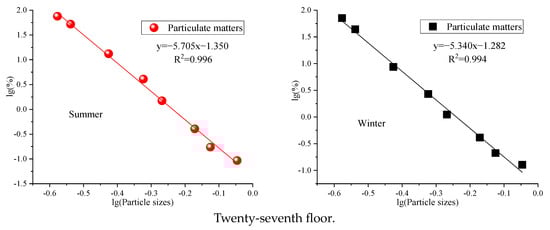
Figure 3.
Fitting curve of the fractal dimension of the particle distribution of fine particles.
It can be observed in Figure 3 that all the fitting curves present a negative correlation during the test period. With the increase in particle sizes, the fractal dimension of the particles shows a decreasing trend with a good linear relationship. The relationship between the proportion of particles and the fractal dimension is presented in Figure 4.
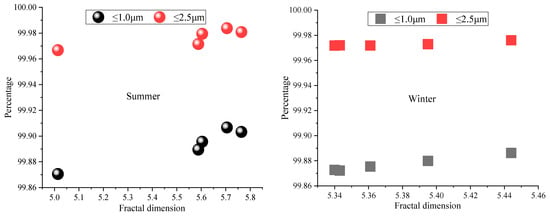
Figure 4.
Change in the proportion of particles with fractal dimensions.
From Figure 4, the following can be observed for the particles ranging from 0 to 1.0 µm: the greater the particle fractal dimension, the higher the number of small particles. At this point, particles ranging from 0 to 1.0 µm account for the total number of particles during the summer period at 99.907%, 99.903%, 99.896%, 99.889%, and 99.871%, with an average of 99.893%. The particles ranging from 0 to 1.0 µm accounted for the total number of particles during the winter period at 99.886%, 99.880%, 99.875%, 99.873%, and 99.872%, with an average of 99.877%. Therefore, the fractal dimension can be used to reflect the uniformity of atmospheric particle compositions. The particle fractal dimensions of fine particles present in the atmosphere at different times during the testing period are presented in Table 2.
Table 2.
Fractal dimensions of particle distributions during different testing times in Xi’an.
Table 2 shows that the fractal dimensions of fine particles on different floors in the summer period range between 5.014 and 5.764, with an average of 5.535. The fractal dimensions of the fine particles on different floors in the winter period range between 5.340 and 5.444, with an average of 5.377. The fractal dimension in summer is relatively high (0.158 higher than that in winter on average). The fractal dimensions of particles present in the atmosphere at different heights ranged from 5.014 to 5.764, with an average fractal dimension of 5.456. The fractal dimension on the 17th floor of outdoor particles was the greatest in summer, at 5.764, and 99.903% of particles were distributed in an equivalent particle size smaller than 1.0 µm at that time. The fractal dimension on the seventh floor of outdoor particles was the lowest in summer, at 5.014, and 99.871% of particles were distributed with equivalent particle sizes smaller than 1.0 µm at that time. This was because there were other buildings with seven floors that had a relatively weak diffusion of particulate matter, while the lower floors were more severely affected by cars and pedestrian flow, and the higher floors were relatively open and prone to more atmospheric environmental factors. Therefore, the fractal dimension of the seventh floor was relatively small. In addition, the height of the building was relatively high, and the area around the 27th floor was more spacious. The wind in the environment can intensify the movement of small particles, which can also cause certain fluctuations in the results. Therefore, compared to the 17th floor, the results are slightly lower. This area of the results can also be confirmed in Figure 2.
However, most research results at present show that the values of fractal dimensions range from 1 to 3 [47,48,49]. This paper presents a relatively large range of fractal dimension values for atmospheric particles in Xi’an. On the one hand, it indicates that the morphology of atmospheric particles in Xi’an during the testing period is relatively irregular and rough [50]. From Figure 2 and Figure 4, it can be confirmed that the distribution of particles with different particle sizes is uneven, and there are also differences in the fractal dimensions corresponding to these particles. This leads to differences in the trajectory of particles in air motion, resulting in a more irregular particle morphology due to their collision and adsorption processes. This result is consistent with the results presented in the relevant papers [39,51], which verify the validity of this paper. On the other hand, it indicates that the main distribution of Xi’an’s atmosphere involves fine particles [52,53]. In addition, the fractal dimensions of particles during the testing period may have also been related to the outdoor weather conditions [54]. The temperature and humidity in the outdoor air, wind force, air pressure, and other factors cause certain differences in the number and concentration of particles. This is because weather parameters can affect the viscosity and motion trajectory of particles, such as high temperatures accelerating the diffusion of small particles, wind power exacerbating the diffusion of small particles, and humidity intensifying the combination of particles. Therefore, weather parameters are also an important influencing factor. In general, the fractal dimensions of particles can be used to express the distribution of atmospheric particles. Particulate matter can be considered as a scalar quantity advected by a vector quantity, such as the atmospheric wind speed, which is a quantity that exhibits multifractal properties. This phenomenon can explain this fractal behavior.
3.3. Relationship between Particle Fractal Dimensions and Adsorption
The relevant literature indicates that some harmful substances can adsorb onto particulates [39,55], which causes greater harm. The adsorption capacity is shown in Equation (3) [39,55]:
where C is the proportional coefficient and D is the fractal dimension of the adsorbent.
Assuming that the molecular weight of the adsorbate is M and the density is , the adsorption capacity is Q [39,55].
This can be expressed as [39,55]
It can be observed that the adsorption of toxic gases by atmospheric particles is related to the fractal dimension. Figure 5 shows the relationship between the fractal dimensions of particles with different small particles and the cumulative percentage of the corresponding specific surface areas.
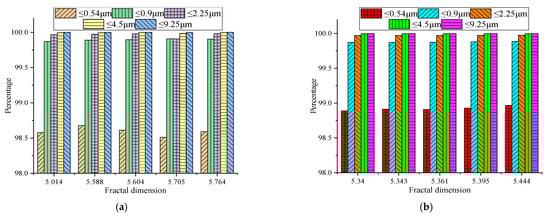
Figure 5.
Fractal dimensions of particles and corresponding cumulative percentage of specific surface area. (a) Summer. (b) Winter.
Figure 5 shows that with the increase in the fractal dimension, the specific surface area and other parameters of particles rapidly increase. The adsorption capacity for toxic and harmful pollutants also gradually increased. With the increase in the fractal dimension in summer, the particles ranging from 0 to 0.54 µm increased by 0.166%, particles ranging from 0 to 0.9 µm increased by 0.036%, particles ranging from 0 to 0.2.25 µm increased by 0.074%, particles ranging from 0 to 4.5 µm increased by 0.014%, and particles ranging from 0 to 9.25 µm increased by 0.003%. With the increase in the fractal dimension in winter, the particles ranging from 0 to 0.54 µm increased by 0.078%, particles ranging from 0 to 0.9 µm increased by 0.014%, particles ranging from 0 to 0.2.25 µm increased by 0.004%, particles ranging from 0 to 4.5 µm increased by 0.001%, and particles ranging from 0 to 9.25 µm increased by almost 0. The adsorption of toxic and harmful pollutants in summer was higher than in winter. This was because the overall outdoor temperature in summer was relatively high compared to winter. An increase in the air temperature exacerbates the resuspension and thermal diffusion of particulate matter, exacerbating the diffusion and collision of small particles, while large-sized particles settle due to the effect of gravity. Therefore, in summer, the adsorption effect of small and fine particles on toxic and harmful pollutants was greater. Thus, the fractal dimension can be used to characterize the relevant parameters of particles, and it provides a new technical method for their comprehensive treatment. In addition, in underground mine environments [56,57], it presents a wide range of applications and scenarios.
4. Conclusions
In this paper, fractal theory was used to discuss and analyze the fractal dimensions of outdoor particles in a high-rise building in Xi’an and their relationship with particle concentration values. The conclusions are as follows:
- The particles ranging from 0 to 2.5 µm on different floors accounted for the vast majority of particles less than 10 µm: 99.978%, 99.970%, 99.972%, 99.976%, and 99.978%, respectively, with an average of 99.975%. Among them, the particles ranging from 0 to 1.0 µm on different floors accounted for 99.891%, 99.875%, 99.881%, 99.889%, and 99.890%, respectively, with an average of 99.885%. The atmosphere in Xi’an is mainly composed of fine particles.
- The concentrations of particles ranging from 0 to 0.54, 1.0 to 2.5, and larger than 2.5 µm on different floors in winter were higher than those in summer, while the concentration of particles ranging from 0.54 to 1.0 µm in winter was lower than that in summer.
- The fractal dimension of fine particles on different floors in the summer period was between 5.014 and 5.764, with an average of 5.535. The fractal dimension of fine particles on different floors in the winter period was between 5.340 and 5.444, with an average of 5.377. The fractal dimension in summer was relatively high (0.158 higher than that in winter on average). The fractal dimension of particles in the atmosphere at different heights ranged from 5.014 to 5.764, with an average fractal dimension of 5.456.
- The adsorption of toxic gases by atmospheric particles was related to the fractal dimension. With the increase in the fractal dimension, the adsorption capacity of toxic and harmful pollutants also gradually increased. The adsorption of toxic and harmful pollutants in summer was greater than in winter. Therefore, the fractal dimension can be used to characterize the relevant parameters of particles, and it provided a new technical method for their comprehensive treatment in the research, with strong practical significance.
Author Contributions
Conceptualization, F.L.; methodology, T.Y. and X.Z.; data curation, W.L.; resources, X.Z.; writing—original draft preparation, F.L. and T.Y.; writing—review and editing, W.L. and T.Y. All authors have read and agreed to the published version of the manuscript.
Funding
This study was supported by the XAUAT Engineering Technology Co., Ltd. (No. XAJD-YF23N003), the Internal Scientific Research Project of the Shaanxi Provincial Land Engineering Construction Group (No. DJNY-YB-2023-13).
Data Availability Statement
Not applicable.
Conflicts of Interest
The authors declare no conflict of interest.
References
- Zhou, F.R.; Yang, J.R.; Wen, G.; Ma, Y.; Pan, H.; Geng, H.; Cao, J.; Zhao, M.; Xu, C. Estimating spatio-temporal variability of aerosol pollution in Yunnan Province, China. Atmos. Pollut. Res. 2022, 13, 101450. [Google Scholar] [CrossRef]
- Zhang, X.; Sun, H.; Li, K.P.; Nie, X.X.; Fan, Y.S.; Wang, H.; Ma, J.Y. Comparison of the Application of Three Methods for the Determination of Outdoor PM2.5 Design Concentrations for Fresh Air Filtration Systems in China. Int. J. Environ. Res. Public Health 2022, 19, 16537. [Google Scholar] [CrossRef]
- Song, H.; Dong, Y.H.; Yang, J.Y.; Zhang, X.; Nie, X.X.; Fan, Y.X. Concentration Characteristics and Correlations with Other Pollutants of Atmospheric Particulate Matter as Affected by Relevant Policies. Int. J. Environ. Res. Public Health 2023, 20, 1051. [Google Scholar] [CrossRef] [PubMed]
- Kumar, P.; Singh, A.B.; Arora, T.; Singh, S.; Singh, R. Critical review on emerging health effects associated with the indoor air quality and its sustainable management. Sci. Total Environ. 2023, 872, 162163. [Google Scholar] [CrossRef]
- Brook, R.D.; Motairek, I.; Rajagopalan, S.; Al-Kindi, S. Excess Global Blood Pressure Associated with Fine Particulate Matter Air Pollution Levels Exceeding World Health Organization Guidelines. J. Am. Heart Assoc. 2023, 12, e029206. [Google Scholar] [CrossRef]
- Zhang, X.; Fan, Y.S.; Wei, S.X.; Wang, H.; Zhang, J.X. Spatiotemporal Distribution of PM2.5 and Its Correlation with Other Air Pollutants in Winter During 2016~2018 in Xi’an, China. Pol. J. Environ. Stud. 2021, 30, 1457–1464. [Google Scholar] [CrossRef]
- Ophe, K.T. Diseases in the Room. Nature 2023, 615, 206–208. [Google Scholar]
- Zeng, C.; Deng, X.Z.; Dong, J.N.; Hu, P.Y. Urbanization and Sustainability: Comparison of the Processes in “BIC” Countries. Sustainability 2016, 8, 400. [Google Scholar] [CrossRef]
- Zhang, X.; Fan, Y.S.; Yu, W.Q.; Wang, H.; Niu, B.B.; Li, M.Y. Vertical Distribution Characteristics of Outdoor Particles Concentrations in High-Rise Buildings. Pol. J. Environ. Stud. 2021, 30, 1913–1922. [Google Scholar] [CrossRef]
- Ahn, H.; Lee, J.; Hong, A. Urban form and air pollution: Clustering patterns of urban form factors related to particulate matter in Seoul, Korea. Sustain. Cities Soc. 2022, 81, 103859. [Google Scholar] [CrossRef]
- Wang, J.; Li, T.N.; Li, Z.Q.; Fang, C.S. Study on the Spatial and Temporal Distribution Characteristics and Influencing Factors of Particulate Matter Pollution in Coal Production Cities in China. J. Environ. Res. Public Health 2022, 19, 3228. [Google Scholar] [CrossRef]
- Mi, K.; Zhuang, R.L.; Zhang, Z.H.; Gao, J.; Pei, Q. Spatiotemporal characteristics of PM2.5 and its associated gas pollutants, a case in China. Sustain. Cities Soc. 2019, 45, 287–295. [Google Scholar] [CrossRef]
- Zhang, X.; Fan, Y.S.; Yu, W.Q.; Wang, H.; Zhang, X.L. Variation of Particulate Matter and Its Correlation with Other Air Pollutants in Xi’an, China. Pol. J. Environ. Stud. 2021, 30, 3357–3364. [Google Scholar] [CrossRef]
- Wang, J.Y.; He, D.Q. Sustainable urban development in China: Challenges and achievements. Mitig. Adapt. Strateg. Glob. Chang. 2015, 20, 665–682. [Google Scholar] [CrossRef]
- Hu, F.; Zhao, S.M.; Bing, T.; Chang, Y.M. Hierarchy in industrial structure: The cases of China and the USA. Physica A 2017, 469, 871–882. [Google Scholar] [CrossRef]
- Sun, J.S.; Li, G.; Wang, Z.H. Optimizing China’s energy consumption structure under energy and carbon constraints. Struct. Chang. Econ. D 2018, 47, 57–72. [Google Scholar] [CrossRef]
- Davies, C.N. Particles in the atmosphere: A review. J. Aerosol. Sci. 1987, 18, 469–477. [Google Scholar] [CrossRef]
- Fan, D.Y. Research on the Spatial-Temporal Characteristics of Outdoor PM2.5 Pollution and Indoor Control Methods in Typical Cities. Ph.D. Thesis, China Academy of Building Research, Beijing, China, 2020. (In Chinese). [Google Scholar]
- Rajmohan, B.; Reddy, S.N.; Meikap, B.C. Removal of SO2 from Industrial Effluents by a Novel Twin Fluid Air-Assist Atomized Spray Scrubber. Ind. Eng. Chem. Res. 2008, 47, 7833–7840. [Google Scholar] [CrossRef]
- Bal, M.; Siddiqi, H.; Mukherjee, S.; Meikap, B.C. Design of self priming venturi scrubber for the simultaneous abatement of HCl gas and particulate matter from the flue gas. Chem. Eng. Res. Des. 2019, 150, 311–319. [Google Scholar] [CrossRef]
- Yang, Y.; Tian, C.G.; Sun, L.; Lü, R.J.; Zhou, W.; Shi, K.Y.; Kan, K.; Wang, J.C.; Fu, H.G. Growth of small sized CeO2 particles in the interlayers of expanded graphite for high-performance room temperature NOx gas sensors. J. Mater. Chem. A 2013, 1, 12742. [Google Scholar] [CrossRef]
- Pöschl, U. Atmospheric aerosols: Composition, transformation, climate and health effects. Angew. Chem. Int. Edit. 2005, 44, 7520–7540. [Google Scholar] [CrossRef] [PubMed]
- Yang, D.; Wang, J.; Yan, X.; Liu, H. Subway air quality modeling using improved deep learning framework. Process Saf. Environ. 2022, 163, 487–497. [Google Scholar] [CrossRef]
- Guo, Z.Y.; Yang, G.Y.; Wang, D.S.; Liu, H.B. A novel deep learning model integrating CNN and GRU to predict particulate matter concentrations. Process Saf. Environ. 2023, 173, 604–613. [Google Scholar] [CrossRef]
- Ferreira Mercuri, E.G.; Bergami, I.; Manfred Noe, S.; Junninen, H.; Norbisrath, U. Prediction of particulate matter concentration in urban environment using Random Forest. In Proceedings of the 1st International Workshop on Advances in Environmental Sensing Systems for Smart Cities, Helsinki, Finland, 18 June 2023; pp. 7–12. [Google Scholar]
- Luo, B.R.; Cao, R.H.; Yang, W.B.; Wang, Z.Y.; Hu, X.S.; Xu, J.Q.; Fan, Z.M.; Zhang, L.Y. Analysing and predicting the fine-scale distribution of traffic particulate matter in urban nonmotorized lanes by using wavelet transform and random forest methods. Stoch. Env. Res. Risk A 2023, 37, 2657–2676. [Google Scholar] [CrossRef]
- Mandelbrot, B.B. The Fractal Geometry of Nature; WH Freeman: San Francisco, CA, USA, 1982. [Google Scholar]
- Mandelbrot, B.B. How long is the coast of britain? statistical self-similarity and fractional dimension. Science 1967, 156, 636–638. [Google Scholar] [CrossRef]
- Smidt, J.M.; Monro, D.M. Fractal modeling applied to reservoir characterization and flow simulation. Fractals 1998, 6, 401–408. [Google Scholar] [CrossRef]
- West, G.B.; Brown, J.H.; Enquist, B.J. A general model for the origin of allometric scaling laws in biology. Science 1997, 276, 122–126. [Google Scholar] [CrossRef]
- Arasan, S.; Akbulut, S.; Hasiloglu, A.S. The relationship between the fractal dimension and shape properties of particles. Ksce J. Civ. Eng. 2011, 15, 1219–1225. [Google Scholar] [CrossRef]
- Pang, Y.E.; Chen, M.H.; Wang, Y.Y.; Chen, X.Y.; Teng, X.M.; Kong, S.F.; Zheng, Z.H.; Li, W.J. Morphology and Fractal Dimension of Size-Resolved Soot Particles Emitted from Combustion Sources. J. Geophys. Res. 2023, 128, e2022JD037711. [Google Scholar] [CrossRef]
- Guzzo, P.L.; Ţălu, S.; Kulesza, S.; Bramowicz, W. A Fractal Description of Finely Ground Particles of Natural Quartz Using Particle Size and Image Analyses. JOM 2023, 75, 1333–1344. [Google Scholar] [CrossRef]
- Düsenberg, B.; Singh, A.K.; Schmidt, J.; Bück, A. Spray agglomeration of polymer particles: Influence of spray parameters on shape factors. Powder Technol. 2023, 422, 118491. [Google Scholar] [CrossRef]
- Davy, P.; Sornette, A.; Sornette, D. Some consequences of a proposed fractal nature of continental faulting. Nature 1990, 348, 56–58. [Google Scholar] [CrossRef]
- Chilès, J.P. Fractal and geostatistical methods for modeling of a fracture network. Math. Geol. 1988, 20, 631–654. [Google Scholar] [CrossRef]
- Bour, O. Transferts de Fluids dans les Milieu Fractures: Effects D’echelle. Ph.D. Thesis, University of Rennes, Rennes, France, 1997. [Google Scholar]
- Chen, Y. The Physicochemical Characteristics and Fractal Analysis of PM10 and PM2.5 in the Atmosphere around the Campus of Beijing Forestry University. Master’s Thesis, Beijing Forestry University, Beijing, China, 2008. (In Chinese). [Google Scholar]
- Zhang, X.; Fan, Y.S.; Wei, S.X.; Wang, H.; Zhang, J.X. Fractal approach to concentration distribution of atmospheric fine particle sizes. Therm. Sci. 2021, 25, 1337–1343. [Google Scholar] [CrossRef]
- Jin, Y.; Wu, Y.; Li, H.; Zhao, M.Y.; Pan, J.N. Definition of fractal topography to essential understanding of scale-invariance. Sci. Rep. 2017, 7, 46672. [Google Scholar] [CrossRef]
- Liu, R.C.; Yu, L.Y.; Jiang, Y.J.; Wang, Y.C.; Li, B. Recent developments on relationships between the equivalent permeability and fractal dimension of two-dimensional rock fracture networks. J. Nat. Gas. Sci. Eng. 2017, 45, 771–785. [Google Scholar] [CrossRef]
- Yang, S.S.; Shao, L.Y.; Shen, R.R.; Li, W.J.; Zhang, G.L.; Tan, M.G. Fractal dimensions of size distribution of PM10 in Shanghai. China Environ. Sci. 2007, 27, 594–598. (In Chinese) [Google Scholar]
- Shao, L.Y.; Yang, S.S.; Zhao, H.Y.; Li, H. Physicochemistry and Toxicology of Indoor Airborne Inhalable Particles; China Meteorological Press: Beijing, China, 2012; pp. 180–203. [Google Scholar]
- Miao, L.C.; Qiu, Y.; Liu, S.Y. Fractal feature of coal mine waste discrete material. J. Southeast Univ. 2003, 33, 79–81. (In Chinese) [Google Scholar]
- Zhang, X.; Ma, J.Y.; Wang, J.H.; Shi, H.X.; Guo, J.P.; Fan, Y.S.; Nie, X.X.; Guo, T.; Luo, X.X. Modifying the Fiber Structure and Filtration Performance of Polyester Materials Based on Two Different Preparation Methods. Langmuir 2023, 39, 3502–3511. [Google Scholar] [CrossRef]
- Wu, Z.T.; Chen, X.; Li, G.X.; Tian, L.; Wang, Z.; Xiong, X.Q.; Yang, C.; Zhou, Z.J.; Pan, X.C. Attributable risk and economic cost of hospital admissions for mental disorders due to PM2.5 in Beijing. Sci. Total Environ. 2020, 718, 137274. [Google Scholar] [CrossRef]
- Valle, F.; Brucale, M.; Chiodini, S.; Bystrenova, E.; Albonetti, C. Nanoscale morphological analysis of soft matter aggregates with fractal dimension ranging from 1 to 3. Micron 2017, 100, 60–72. [Google Scholar] [CrossRef] [PubMed]
- Zhou, L.T.; Dong, L.M.; Zhao, Y.; Qin, Z.M. Particle size distribution and fractal dimension characteristics of urban road dust in four seasons in Beijing. China Environ. Sci. 2015, 35, 1610–1619. (In Chinese) [Google Scholar]
- Lu, S.; Tang, H.M.; Zhang, Y.Q.; Gong, W.P.; Wang, L.Q. Effects of the particle-size distribution on the micro and macro behavior of soils: Fractal dimension as an indicator of the spatial variability of a slip zone in a landslide. Bull. Eng. Geol. Environ. 2018, 77, 665–677. [Google Scholar] [CrossRef]
- Zhang, X.; Ma, J.Y.; Nie, X.X.; Fan, Y.S.; Wang, H.; Cui, Y. Establishment of air fiber filtration model based on fractal theory and analysis of filtration performances. Mater. Today Commun. 2023, 34, 105301. [Google Scholar] [CrossRef]
- Knoll, M.; Gerhardter, H.; Prieler, R.; Muhlbock, M.; Tomazic, P.; Hochenauer, C. Particle classification and drag coefficients of irregularly-shaped combustion residues with various size and shape. Powder Technol. 2019, 345, 405–414. [Google Scholar] [CrossRef]
- Zhang, X.; Fan, Y.S.; Zhang, J.X.; Wang, H.; Wei, S.X. Research on outdoor design PM2.5 concentration for fresh air filtration systems based on mathematical inductions. J. Build. Eng. 2021, 34, 101883. [Google Scholar] [CrossRef]
- Zhang, H.L.; Hao, Q.L.; Li, G.L. Analysis of Pollution Concentration of Particulate Matter after Adjusting Heating Measures in Xi’an. Build. Energy Environ. 2020, 39, 54–57. (In Chinese) [Google Scholar]
- Tian, Y.L.; Li, X.Y.; Sun, H.T.; Xue, W.H.; Song, J.X. Characteristics of atmospheric pollution and the impacts of environmental management over a megacity, northwestern China. Urban. Clim. 2022, 42, 101114. [Google Scholar] [CrossRef]
- Mei, D.Q.; Zhu, Z.N.; Mei, C.W.; Chen, Z.; Yuan, Y.N. Fractal morphology features and carbon component analysis of diesel particulates. Environ. Sci. Pollut. R 2019, 26, 14014–14023. [Google Scholar] [CrossRef] [PubMed]
- Wu, S.; Zhang, Z.R.; Chen, J.H.; Yao, Y.; Li, D.Q. Characterisation of stress corrosion durability and time-dependent performance of cable bolts in underground mine environments. Eng. Fail. Anal. 2023, 150, 107292. [Google Scholar] [CrossRef]
- Wu, S.; Hao, W.Q.; Yao, Y.; Li, D.Q. Investigation into durability degradation and fracture of cable bolts through laboratorial tests and hydrogeochemical modelling in underground conditions. Tunn. Undergr. Space Technol. 2023, 138, 105198. [Google Scholar] [CrossRef]
Disclaimer/Publisher’s Note: The statements, opinions and data contained in all publications are solely those of the individual author(s) and contributor(s) and not of MDPI and/or the editor(s). MDPI and/or the editor(s) disclaim responsibility for any injury to people or property resulting from any ideas, methods, instructions or products referred to in the content. |
© 2023 by the authors. Licensee MDPI, Basel, Switzerland. This article is an open access article distributed under the terms and conditions of the Creative Commons Attribution (CC BY) license (https://creativecommons.org/licenses/by/4.0/).