Abstract
The innovation of structural forms and the increase in the energy-saving requirements of buildings have led to higher requirements regarding the application conditions of steel slag foam concrete (SSFC) to ensure that the SSFC has a lower thermal conductivity and sufficient compressive strength, which has become the primary research object. Through a comprehensive consideration of 7 d compressive strength and thermal conductivity, the recommend mix ratio of SSFC was as follows: maximum SS size = 1.18 mm, water–cement ratio = 0.45, replacement rate of SS = 20–30%. Moreover, a theoretical formula was derived to determine thermal conductivity versus porosity based on fractal theory. The measured values of the foam concrete found elsewhere corroborate the fractal relationship regarding thermal conductivity versus porosity. This fractal relationship offers a straightforward and scientifically sound way to forecast the thermal conductivity of SSFC.
1. Introduction
Foam concrete (FC) exhibits a variety of merits and is widely used in civil engineering. However, making foam concrete requires a lot of cement and natural aggregate, which is not friendly to the environment. Steel slag (SS), a side product of steel manufacture, possesses a high amount (15–20%) of crude steel while the comprehensive consumption of the crude steel rate falls below 30% [1]. In the last five years, the annual production of SS in China exceeded 1.4 × 10⁸ tons and approached almost 1.6 × 10⁸ tons in 2022. The SS is buried or stacked at a wide scale due to its lower utilization rate, which tends to pollute the soil and atmosphere, wasting resources [2,3]. SS is relatively similar in chemical composition to cement and is able to react with water in a hydration process, which has a certain cementitious effect. Although SS is less cementitious than cement, the energy consumption involved in its production is greatly reduced compared to cement [4,5]. Based on previous studies, Rashad [6,7] summarized the application of SS as a binder or aggregates for mortar or concrete and found that the utilization of steel slag could lead to excellent engineering indicators. Therefore, when SS is mixed in foam concrete to form a steel slag foam concrete (SSFC), it can effectively improve the utilization rate of SS [8,9,10] and can even enhance the engineering performance of foam concrete [11,12,13,14].
Thermal conductivity (TC) is the key parameter in the application of foam concrete. It is a practical demand of engineering to establish a scientific and reasonable prediction model for the TC of foam concrete. Several models have been proposed for predicting the TC of foam concrete [15,16,17]; they usually describe TC as a function of the test conditions. Therefore, when the test conditions change, especially when the raw materials change, the calculation parameters in the models will be very different, which makes it difficult for these calculation models to predict the TC of foam concrete under different test conditions. In fact, the macroscopic properties of foam concrete are highly dependent on its microstructure. Lü et al. [18] consider that the fractal dimension (D) indicates how a complex structure of concrete was established; therefore, the fractal dimension is intimately related to the macro-mechanical properties of concrete. They [18] also found correlations between the fractal dimension and the CS, as well as penetration for concrete incorporating silicon-ash. Some scholars have investigated the relationship between the porosity of concrete and the fractal dimension, and also looked for correlations with the surface’s fractal dimension with different properties. After fractal analysis, Huang et al. [19] found that the fractal dimension Df of magnesium oxysulfate (MOS) slurry is directly proportional to the porosity, and it is possible to improve the structure of the slurry by reducing the fractal dimension. Peng et al. [20] modeled the hydration reaction of magnesium phosphate cement (MPC) slurries, performed a fractal analysis of different slurry porosities, and found that a smaller magnesium–phosphorus molar ratio and a smaller water-cement ratio were beneficial in reducing the fractal dimension of MPC slurries. Wang et al. [21] investigated the effect of finely ground phosphorous slag and fly ash on the fractal characteristics of hydraulic concrete, and found that the pore surface fractal dimension can characterize the pore structure of hydraulic concrete, but the correlation with frost resistance is poor. Wang et al. [22] found that hydraulic concrete with MgO and PVA fibers had significant fractal characteristics, but the compressive strength and abrasion resistance did not significantly correlate with the surface fractal dimensions. Furthermore, Chen et al. [23] established a fractal model of CS for FC. At present, the relevance of the fractal dimension of foam concrete to TC has not been published, but other porous substances were found to be relevent. Yu [24] formulated a model of a dual-dispersed fractally woven mesoporous medium for TC. Shen et al. [25] and Feng et al. [26] presented a fractal molding for the TC of a non-saturated porosity medium. These findings offer valuable insights into the establishment of TC fractal model for SSFC.
In this paper, we were committed to partially replacing cement with fine steel slag to produce an SSFC with higher compressive strength and lower thermal conductivity. In order to solve the problem of the underutilization of SS waste in China, we are using fine SS aggregates left over from plant production in our trials. This economically efficient, eco-friendly option increases utilization and removes the requirements for processing and stacking. This is very much in line with the concept of going green. The effects of the replacement rate of SS, water–binder ratio, and SS size-grading on the CS and TC of SSFC were investigated, so that the optimal mix ratio was determined. In addition, a fractal correlation of TC to the SSFC porosity was established on the basis of the fractal characteristics of the pore structure of FC. The estimated values agreed with the tested TC in this paper and the literature. It provides a user-friendly and scientifically sound way to forecast the TC of SSFC.
2. Materials and Tests Method
2.1. Raw Test Materials
The cement is P.O 42.5 Ordinary Portland cement and is produced in Anhui Conch brand. Its apparent density is about 3.0 × 10³ kg/m3. The steel slag (SS) is produced by Masteel Group, Maansh City, Anhui Province, China. The SS was aged for two years under natural conditions, and its f-CaO content is only 2.7%, exhibiting good stability. The apparent density of this SS is 3.4 ~ 3.6 × 10³ kg/m3. The chemical composition was obtained through XRF test and is listed in Table 1. The chemical compositions of SS are similar to that of cement, which shows that the SS exhibits a cementitious nature and could partially replace cement. In addition, the alkalinity of this SS is 4.1, suggesting the SS is highly alkaline. The blowing compound is a clear liquid and has a pH value of 8.3. The main chemical component is sodium dodecyl sulfate. Its foaming multiple is 40.

Table 1.
Chemical composition of cement and SS.
2.2. Preparation of Specimens
As shown in Figure 1, the preparation process of SSFC was as follows: Weigh the steel slag and cement according to the design mix ratio, and dry-mix them evenly, then place them into the concrete mixer and add water to stir evenly. After that, the blowing agent is diluted proportionally and added to the foam-making machine, and when the blowing foam is stable, the air bubbles are incorporated into the cement slurry. Mix cement slurry with the foam for 3 min for uniform distribution of the foam, and pour the cement paste for 24 h inside the experimental model. Once demolded, blocks will be sent to the curing room, and the maintenance will be taken out after the predetermined age. Finally, the test block is put into a drying oven at (60 ± 5) °C and dried to constant weight (the differential quality at 4 h should be less than 1 g) while waiting for the relevant performance test. Production patterns of SSFC are shown in Figure 2.

Figure 1.
Preparation process flow of SSFC.
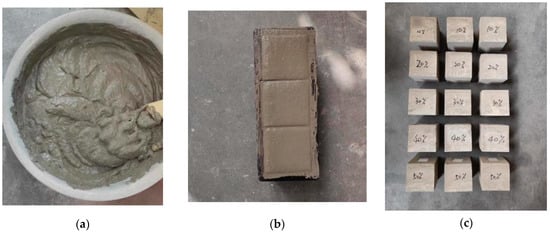
Figure 2.
Production images of SSFC: (a) slurry mixing process, (b) injection molding, (c) well-made tested blocks.
2.3. Measurement of Compressive Strength
The CS tests of SSFC were conducted under the guidance of JG/T266-2011 [27]. The size of the specimen was 100 mm × 100 mm × 100 mm. The CS tests of SSFC were conducted on a universal material test machine. The loading was controlled by displacement and the loading rate was 1.0 mm/min. The axial load and axial displacement were automatically collected by the computer during the loading process.
2.4. Measurement of Thermal Conductivity
The TC of SSFC was measured by the transient plane source method recommended in GB/T 32064-2015 [28]. The specimen should be placed in the drying oven at 60 ± 5 °C prior to the experiment. Afterwards, the heat disk transducer was placed in the middle of the two dry samples. The TC tester was started and the software was used to determine the basic settings. After finishing the thermal equilibrium test, TC measurements were made of the SSFC specimen.
2.5. SEM Tests
Scanning electron microscopy (SEM) tests were carried out to observe the microstructure of SSFC and measure its fractal dimensions. Sheet materials of about 5 mm × 5 mm were taken from the test pieces in a cross-section, and vacuum gold-plating was performed on the test pieces as required before scanning.
3. Experimental Results
3.1. Compressive Strength of SSFC
The dry bulk density of the SSFC in this section is controlled at 700 (±20) kg/m3. Figure 3 shows the relationship between the CS of SSFC and the replacement of steel slag (RSS). The SSFC specimens possess three different SS particle sizes but a water-binder ratio (w/b) of only 0.45. With the same SS particle size, the CS of SSFC always grows first, and then reduces as the RSS rises. The CS has higher values when the RSS is 20% and 30%, indicating that adding a certain amount of SS can increase the value of CS. Cement and SS have a synergistic effect; increasing RSS can promote hydration reactions and is conducive to the formation of cementitious materials. In addition, the use of SS as a fine aggregate also contributes to the CS. Consequentially, the CS is comparatively higher. However, when the RSS is high, it is easy to sink due to the high density of SS, resulting in the stratification of slurry, uneven distribution of bubbles and loose structure, which reduces the CS of SSFC. In addition, the hydration reaction of SS is weaker than that of cement, a high RSS means that the amount of cement is reduced, and the final hydration gelling product is reduced, which also leads to the reduction in CS.
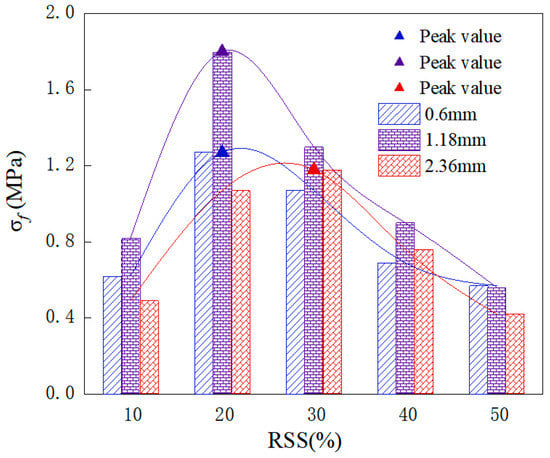
Figure 3.
Correlation of CS with RSS of SSFC.
From Figure 3, it also can be seen that, under the same RSS, the CS of SSFC with the maximum SS size (MSZ) of 1.18 mm is always larger than that of SSFC with the other two MSZ, i.e., 0.06 and 2.36 mm. When the size of SS is too fine, its aggregate effect is low, and it cannot effectively enhance the strength of SSFC. Furthermore, fine SS has a large specific surface area and can easily absorb water from the slurry [29], impacting the hydration reaction of SSFC. However, if the SS particle size is too large, hydration primarily occurs at its surface but is unlikely to occur in the interior of SS, so the overall hydration products are fewer, which is not conducive to the development of CS.
Figure 4 demonstrates the dependency between CS and w/b for SSFC. The CS of SSFC initially increases and then decreases with further increases in w/b under different RSS and SS sizes. When the w/b is small, the hydration reaction will be incomplete. However, when the w/b is higher, the foam has a tendency to flow upward. It is hard to uniformly mix the foam and slurry, leading to an obvious delamination phenomenon.
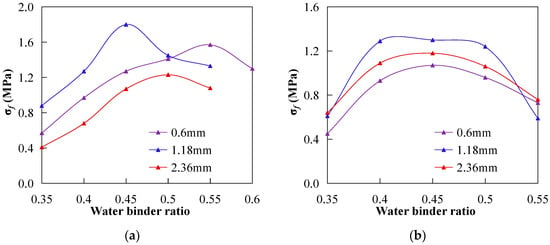
Figure 4.
Correlation of CS with w/b under different RSS. (a) 20% RSS; (b) 30% RSS.
3.2. Thermal Conductivity of SSFC
According to the results of 7 d CS, the SSFC made of 1.18 mm MSZ and 0.45 w/b possesses a high compressive strength. Therefore, TC tests were also conducted on the SSFC made of these mix proportions. Figure 5 shows that the TC of SSFC decreases with the increase in RSS at different densities. This is mainly due to the high density of SS. When preparing concrete with the same dry volume density, the greater the SS content, the less the volume of raw materials required, the greater the porosity of the prepared concrete, the looser the internal structure, and the smaller the TC. The porosity of concrete with a dry bulk density of 700 kg/m3 was tested using the saturated water method, which was developed by Montes et al. [30]. It was found that the porosity of SSFC was 0.402, 0.416, 0.439 and 0.447 when the RSS was 10%, 20%, 30% and 40%, respectively, indicating that the porosity of SSFC increased with the increase in RSS.
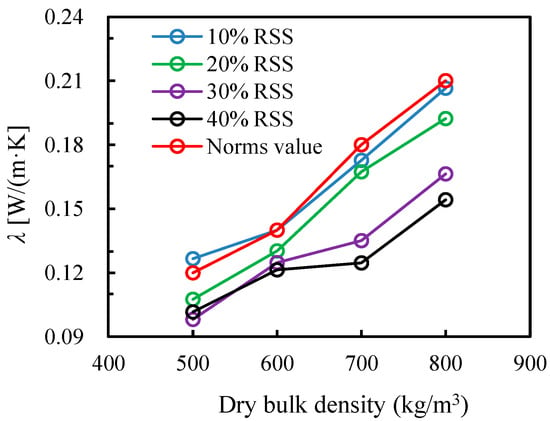
Figure 5.
Correlation of TC with dry bulk density under different RSS.
This phenomenon can also be seen in SEM images. Figure 6 shows the SEM images of SSFC with 700 kg/m3 dry bulk density. It can be seen from Figure 6a,b that when the RSS is relatively small, the pore structure in the concrete is relatively uniform and no large cracks appear. However, when the RSS exceeds 30%, the internal structure of SSFC is relatively loose and obvious cracks or large pores appear, which are indicated by the red circles in Figure 6c,d.
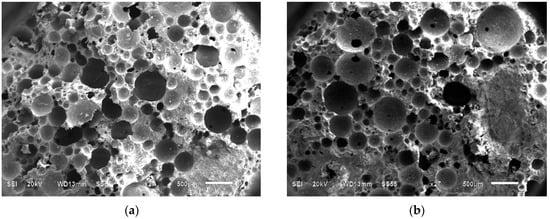
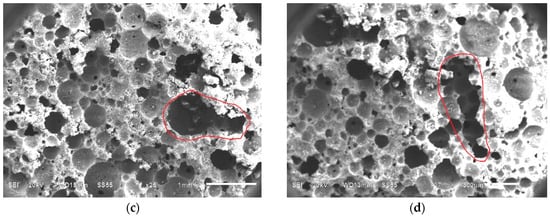
Figure 6.
SEM images of SSFC with different RSS. (a) 10% RSS; (b) 20% RSS; (c) 30% RSS; (d) 40% RSS.
Figure 5 also shows the maximum allowable value of TC of foam concrete under different dry bulk densities in the Chinese standard of JG/T266-2011 [27]. It can be seen that the TC of SSFC with 10% RSS is close to the allowable value of the standard, but the TC of this kind of concrete exceeds the allowable value when the dry bulk density is 500 kg/m3; therefore, 10% RSS cannot be used. When the RSS exceeds 10%, the TC of SSFC is lower than the allowable value, showing a better thermal insulation performance. However, when the RSS increases from 30% to 40%, the TC of SSFC decreases by 3.54% on average, while the compressive strength decreases by more than 20%. Therefore, considering both strength and TC, the optimal mix ratio of SSFC should be 1.18 mm MSZ, 0.45 w/b and 20–30% RSS, so that the prepared SSFC can have a higher strength and lower TC.
4. Prediction Model for Thermal Conductivity of SSFC
4.1. Relational Formula between Effective Thermal Conductivity and Porosity
Krone [31] proposed an internal structure model for foam concrete based on the order of gelation, as shown in Figure 7. It assumes that cementation particles are formed by the agglomeration of cement cells, which are not compressed and maintain their density. The cementation particles further combine to form a concrete block. The number of cementation particles, N, can be expressed as [32]:
where Sc is the scaling factor of particles, D is the fractal dimension dc and dp are the average diameter and minimum diameter of cementation particles, respectively.
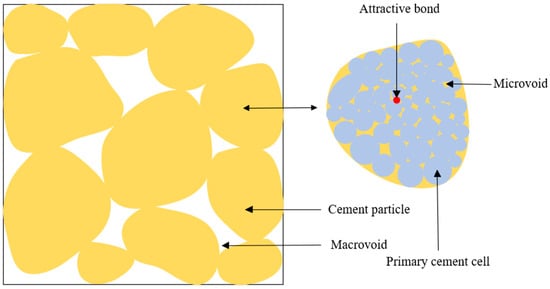
Figure 7.
Composition diagram of concrete blocks.
The total porosity (φ) of foam concrete can be expressed as [23]:
However, the pores in foam concrete can be divided into macro-pores and micro-pores. The macro-pores are distributed among the cementation particles, and the micro-pores exist inside the particles. The TC of pore gases is very poor. Thus, the heat is mainly transferred through the contact bonds between cement cells. The number of contact bonds (Nc) in a cementation skeleton formed by cement cells can be expressed as [33]:
The ratio of the volume of the binding skein (Vs) with respect to that of foam concrete gross volume (V) is given by [33]:
The densities of active touching bonds in the cementing particles are Nc/Vs, and the density of cementation particles in foam concrete is N/V. Then, the relative density of valid touch bonds (ρ) in FC may be represented as:
Generally, a larger value of ρ means more heat transfer channels. Therefore, the higher the ρ, the greater the TC. Assuming that the TC of foam concrete is proportional to ρ:
Combining Equations (2)–(6), the TC of foam concrete can be expressed as:
where
λ0 is the TC of the foam concrete with φ = 0.
4.2. Determination of Fractal Dimension
The specimens were first sectioned and then subjected to SEM analysis. Finally, from five to six SEM images were obtained for each specimen under different mix proportions, followed by binarization. Assume that ε is the length of the side of the box and N(ε) is the box count. If ε approaches 0, N(ε) tends to infinity; thus, the box-counting dimension Dc can be written as [34,35]:
The fractal dimension, D, of concrete is [36]:
D ≈ Dc + 1
Figure 8 illustrates the calculation of the box-counting dimension of SSFC with different RSS. The grayscale threshold of 0.435 was chosen according to Hao et al. [37]. Pictures of SSFC with the same RSS are selected, and the average D is adopted. According to the results, the fractal dimensions of SSFC with 10%, 20%, 30% and 40% RSS are 2.78, 2.80, 2.83, and 2.85, respectively. The fractal dimension increases almost linearly with the increase in RSS, which can be attributed to the uneven SS surface, comprising numerous holes [38], making the surface of concrete matrices more uneven. As shown in Figure 6, the concrete matrices are homogeneous and dense at a low RSS but heterogeneous and porous at a high RSS.
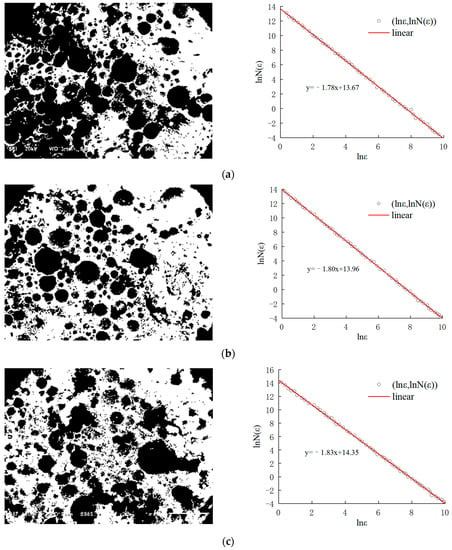
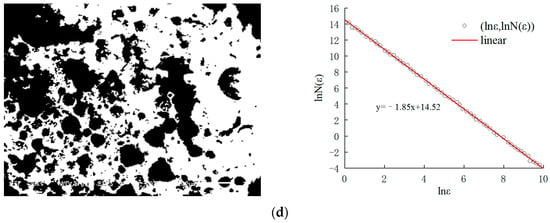
Figure 8.
Binary images and lnN(ε)-lnε plots of SSFC with different RSS. (a) 10% RSS; (b) 20% RSS; (c) 30% RSS; (d) 40% RSS.
4.3. Validation of the Proposed Model
The fractal dimension of SSFC with 20% and 30% SSR are 2.80 and 2.83, respectively; accordingly, the values of parameter b are 1.33 and 1.63, which are calculated by Equation (8).
Figure 9 illustrates a comparison of the predicted TCs, comparing the different porosities. The TC of SSFC declines with increasing porosity in a nonlinear manner. In Figure 9, the scatter plots are the experimental data, and the curves are the predicted values of TC. It was observed that the forecasted TCs were in good accordance with the experiment data, which indicates that the proposed model is reliable.
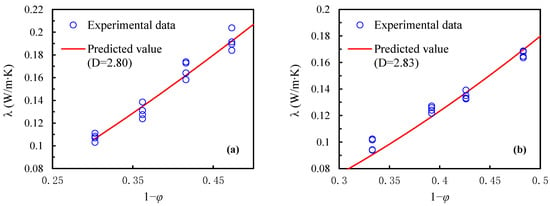
Figure 9.
Comparison of the calculated TC with the experimental data. (a) 20% RSS; (b) 30% RSS.
The actual TC values of FC were adopted from the literature [39,40,41], as shown in Figure 10, and they were compared with the predicted values of the computational model. The hollow points are test TC data, and the solid curves are the predicted values calculated by the λ~φ relations, as listed in Table 2; they are found in good agreement. This also demonstrates the accuracy of the computational model.
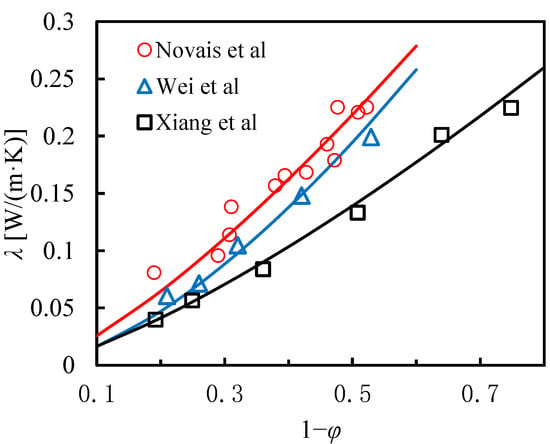
Figure 10.
Comparison of actual and predicted values of thermal conductivity in the literature [39,40,41].

Table 2.
Parameters and reliability obtained by fitting data from other papers.
5. Conclusions
- (1)
- With the same dry bulk density, the CS for SSFC first increases, followed by a reduction with the increase in SS particle size, w/b, and RSS, but the TC of SSFC always decrease with the increase in RSS. Through a comprehensive consideration of compressive strength and TC, the recommended mix ratio of SSFC is: SS with 1.18 mm maximum size, 0.45 w/b, 20–30% RSS.
- (2)
- On the basis of the constituent structure of FC, a fractal correlation between the TC and the porosity can be developed. This method utilizes a measurable parameter, the fractal dimension, which can be measured easily by the SEM images.
- (3)
- By utilization of the fractal correlation and measured D values, the TC of an SSFC made of the recommended mix ratios was estimated. The estimates values are in good agreement with the tested data. Therefore, this offers a new method to express the TC of SSFC.
Author Contributions
Conceptualization, G.X. and D.S.; methodology, G.X. and Y.Z.; validation, G.X.; validation, D.S., H.L. and H.W.; funding acquisition, G.X., D.S. and Y.Z.; writing—original draft preparation, H.L., Y.Z., G.S. and Z.Z.; writing—review and editing, D.S.; data curation, H.L. and H.W.; software, H.W. All authors have read and agreed to the published version of the manuscript.
Funding
National Natural Science Foundation of China (52109125), and Natural Science Foundation of Anhui Province (2208085MD98 and 2108085QD168) are acknowledged for their financial support.
Data Availability Statement
Not applicable.
Conflicts of Interest
The authors declare no conflict of interest.
References
- Baalamurugan, J.; Kumar, V.G.; Chandrasekaran, S.; Balasundar, S.; Venkatraman, B.; Padmapriya, R.; Raja, V.K.B. Utilization of induction furnace steel slag in concrete as coarse aggregate for gamma radiation shielding. J. Hazard. Mater. 2019, 369, 561–568. [Google Scholar] [CrossRef] [PubMed]
- Baalamurugan, J.; Kumar, V.G.; Padmapriya, R.; Raja, V.K.B. Recent applications of steel slag in construction industry. Environ. Dev. Sustain. 2023, 1–32. [Google Scholar] [CrossRef]
- Guo, J.; Bao, Y.; Wang, M. Steel slag in China: Treatment, recycling, and management. Waste Manag. 2018, 78, 318–330. [Google Scholar] [CrossRef] [PubMed]
- Gao, W.; Zhou, W.; Lyu, X.; Liu, X.; Su, H.; Li, C.; Wang, H. Comprehensive utilization of steel slag: A review. Powder Technol. 2023, 422, 118449. [Google Scholar] [CrossRef]
- Chen, W.; Wang, M.; Liu, L.; Wang, H.; Wang, X. Three-Stage Method Energy–Mass Coupling High-Efficiency Utilization Process of High-Temperature Molten Steel Slag. Metall. Mater. Trans. B 2021, 52, 3004–3015. [Google Scholar] [CrossRef]
- Rashad, A.M. A synopsis manual about recycling steel slag as a cementitious material. J. Mater. Res. Technol. 2019, 8, 4940–4955. [Google Scholar]
- Rashad, A.M. Behavior of steel slag aggregate in mortar and concrete-A comprehensive overview. J. Build. Eng. 2022, 53, 104536. [Google Scholar] [CrossRef]
- Nunes, V.A.; Borges, P.H.R. Recent advances in the reuse of steel slags and future perspectives as binder and aggregate for alkali-activated materials. Constr. Build. Mater. 2021, 281, 122605. [Google Scholar]
- Gencel, O.; Karadag, O.; Oren, O.H.; Biliret, T. Steel slag and its applications in cement and concrete technology: A review. Constr. Build. Mater. 2021, 283, 122783. [Google Scholar] [CrossRef]
- Zeng, Z.; Li, X.; Huang, F.; Zhan, W.; Su, H.; Li, W.; Liu, X. Study on novel steel slag foam concrete pore structure and bp neural network prediction model. Eng. Res. Express 2023, 5, 015082. [Google Scholar]
- Park, B.; Choi, Y.C. Investigation of carbon-capture property of foam concrete using stainless steel AOD slag. J. Clean. Prod. 2021, 288, 125621. [Google Scholar] [CrossRef]
- Zhou, D.; Gao, H.; Liao, H.; LI, F.; Cheng, F. Enhancing the performance of foam concrete containing fly ash and steel slag via a pressure foaming process. J. Clean. Prod. 2021, 329, 129664. [Google Scholar] [CrossRef]
- Xiang, G.; Song, D.; Li, H.; Jalal, F.E.; Wang, H.; Zhou, Y. Investigation on preparation and compressive strength model of steel slag foam concrete. J. Build. Eng. 2023, 72, 106548. [Google Scholar] [CrossRef]
- Zhan, P.; Zhang, X.; He, Z.; Shi, J.; Gencel, O.; Yen, N.T.H.; Wang, G. Strength, microstructure and nanomechanical properties of recycled aggregate concrete containing waste glass powder and steel slag powder. J. Clean. Prod. 2022, 341, 130892. [Google Scholar] [CrossRef]
- Bi, J.; Chen, W.; Zhang, J.; Zhang, Y.; Fan, W.; Jia, B. A modified calculation model for the saturation-dependent thermal conductivity of fine-textured soils. Results Phys. 2019, 15, 102673. [Google Scholar] [CrossRef]
- Zhang, M.; Bi, J.; Chen, W.; Zhang, X.; Lu, J. Evaluation of calculation models for the thermal conductivity of soils. Int. Commun. Heat Mass 2018, 94, 14–23. [Google Scholar] [CrossRef]
- Miled, K.; Limam, O. Effective thermal conductivity of foam concretes: Homogenization schemes vs. experimental data and FEM simulations. Mech. Res. Commun. 2016, 76, 96–100. [Google Scholar] [CrossRef]
- Lü, Q.; Qiu, Q.; Zheng, J.; Wang, J.; Zeng, Q. Fractal dimension of concrete incorporating silica fume and its correlations to pore structure, strength and permeability. Constr. Build. Mater. 2019, 228, 116986. [Google Scholar] [CrossRef]
- Huang, J.; Li, W.; Huang, D.; Wang, L.; Chen, E.; Wu, C.; Wang, B.; Deng, H.; Tang, S.; Shi, Y.; et al. Fractal analysis on pore structure and hydration of magnesium oxysulfate cements by first principle, thermodynamic and microstructure-based methods. Fractal Fract. 2021, 5, 164. [Google Scholar] [CrossRef]
- Peng, Y.; Tang, S.; Huang, J.; Tang, C.; Wang, L.; Liu, Y. Fractal analysis on pore structure and modeling of hydration of magnesium phosphate cement paste. Fractal Fract. 2022, 6, 337. [Google Scholar] [CrossRef]
- Wang, L.; Huang, Y.; Zhao, F.; Huo, T.; Chen, E.; Tang, S. Comparison between the influence of finely ground phosphorous slag and fly ash on frost resistance, pore structures and fractal features of hydraulic concrete. Fractal Fract. 2022, 6, 598. [Google Scholar] [CrossRef]
- Wang, L.; Zeng, X.; Li, Y.; Yang, H.; Tang, S. Influences of MgO and PVA fiber on the abrasion resistance, cracking risk, pore structure and fractal features of hydraulic concrete. Fractal Fract. 2022, 6, 674. [Google Scholar] [CrossRef]
- Chen, Y.; Xu, Y. Compressive strength of fractal textured foamed concrete. Fractals 2019, 27, 1940003. [Google Scholar] [CrossRef]
- Yu, B. Analysis of Flow in Fractal Porous Media. Appl. Mech. Rev. 2008, 61, 050801. [Google Scholar] [CrossRef]
- Shen, Y.; Xu, P.; Qiu, S.; Rao, B.; Yu, B. A generalized thermal conductivity model for unsaturated porous media with fractal geometry. Int. J. Heat Mass Transf. 2020, 152, 119540. [Google Scholar] [CrossRef]
- Feng, Y.; Yu, B.; Zou, M.; Xu, P. A Generalized Model for the Effective Thermal Conductivity of Unsaturated Porous Media Based on Self-Similarity. J. Porous Media 2007, 10, 551–568. [Google Scholar] [CrossRef]
- JG/T266-2011; Foamed Concrete. Standards Press of China: Beijing, China, 2011.
- GB/T 32064-2015; Determination of Thermal Conductivity and Thermal Diffusivity of Building Matertials: Transient Plane Heat Sourse Method. State Administration for Market Regulation: Beijing, China, 2015.
- Roslan, N.H.; Ismail, M.; Khalid, N.H.A.; Muhammadet, B. Properties of concrete containing electric arc furnace steel slag and steel sludge. J. Build. Eng. 2020, 28, 101060. [Google Scholar] [CrossRef]
- Dean, S.; Montes, F.; Valavala, S.; Haselbach, L.M. A new test method for porosity measurements of Portland cement pervious concrete. J. ASTM Int. 2005, 2, 1–13. [Google Scholar] [CrossRef]
- Krone, R.B. A Study of Rheologic Properties of Estuarial Sediments; Hydraulic Engineering Laboratory and Sanitary Engineering Research Laboratory, University of California: Berkeley, CA, USA, 1963. [Google Scholar]
- Xu, Y.; Jiang, H.; Chu, F.; Liu, C. Fractal model for surface erosion of cohesive sediments. Fractals 2014, 22, 1440006. [Google Scholar] [CrossRef]
- Son, M.; Hsu, T.J. The effect of variable yield strength and variable fractal dimension on flocculation of cohesive sediment. Water Res. 2009, 43, 3582–3592. [Google Scholar] [CrossRef]
- Buczkowski, S.; Kyriacos, S.; Nekka, F.; Cartilier, L. The modified box-counting method: Analysis of some characteristic parameters. Pattern Recognit. 1998, 31, 411–418. [Google Scholar] [CrossRef]
- Fu, J.; Yu, Y. Experimental study on pore characteristics and fractal dimension calculation of pore structure of aerated concrete block. Adv. Civ. Eng. 2019, 2019, 8043248. [Google Scholar] [CrossRef]
- Shibuichi, S.; Onda, T.; Satoh, N.; Tsujii, K. Super water-repellent surfaces resulting from fractal structure. J. Phys. Chem. 1996, 100, 19512–19517. [Google Scholar] [CrossRef]
- Hao, K.; Li, Y.; Zhang, N. Application of fractal dimension to activated sludge SEM images in MATLAB environment. Environ. Sci. Technol. 2020, 43, 22–27. (In Chinese) [Google Scholar]
- Yildirim, I.Z.; Prezzi, M. Chemical, mineralogical, and morphological properties of steel slag. Adv. Civ. Eng. 2011, 2011, 463638. [Google Scholar] [CrossRef]
- Novais, R.M.; Ascensão, G.; Buruberri, L.H.; Senff, L.; Labrincha, J.A. Influence of blowing agent on the fresh-and hardened-state properties of lightweight geopolymers. Mater. Des. 2016, 108, 551–559. [Google Scholar] [CrossRef]
- Wei, S.; Chen, Y.; Zhang, Y.; Jones, M.R. Characterization and simulation of microstructure and thermal properties of foamed concrete. Constr. Build. Mater. 2013, 47, 1278–1291. [Google Scholar] [CrossRef]
- Xiang, G.; Li, H.; Zhou, Y.; Huang, Z. Thermal Conductivity of Fractal-Textured Foamed Concrete. Fractal Fract. 2023, 7, 475. [Google Scholar] [CrossRef]
Disclaimer/Publisher’s Note: The statements, opinions and data contained in all publications are solely those of the individual author(s) and contributor(s) and not of MDPI and/or the editor(s). MDPI and/or the editor(s) disclaim responsibility for any injury to people or property resulting from any ideas, methods, instructions or products referred to in the content. |
© 2023 by the authors. Licensee MDPI, Basel, Switzerland. This article is an open access article distributed under the terms and conditions of the Creative Commons Attribution (CC BY) license (https://creativecommons.org/licenses/by/4.0/).