
Comparing Market Efficiency in Developed, Emerging, and Frontier Equity Markets: A Multifractal Detrended Fluctuation Analysis


Abstract
1. Introduction
2. Literature Review
2.1. Global Stock Markets
2.2. Time-Varying Market Efficiency
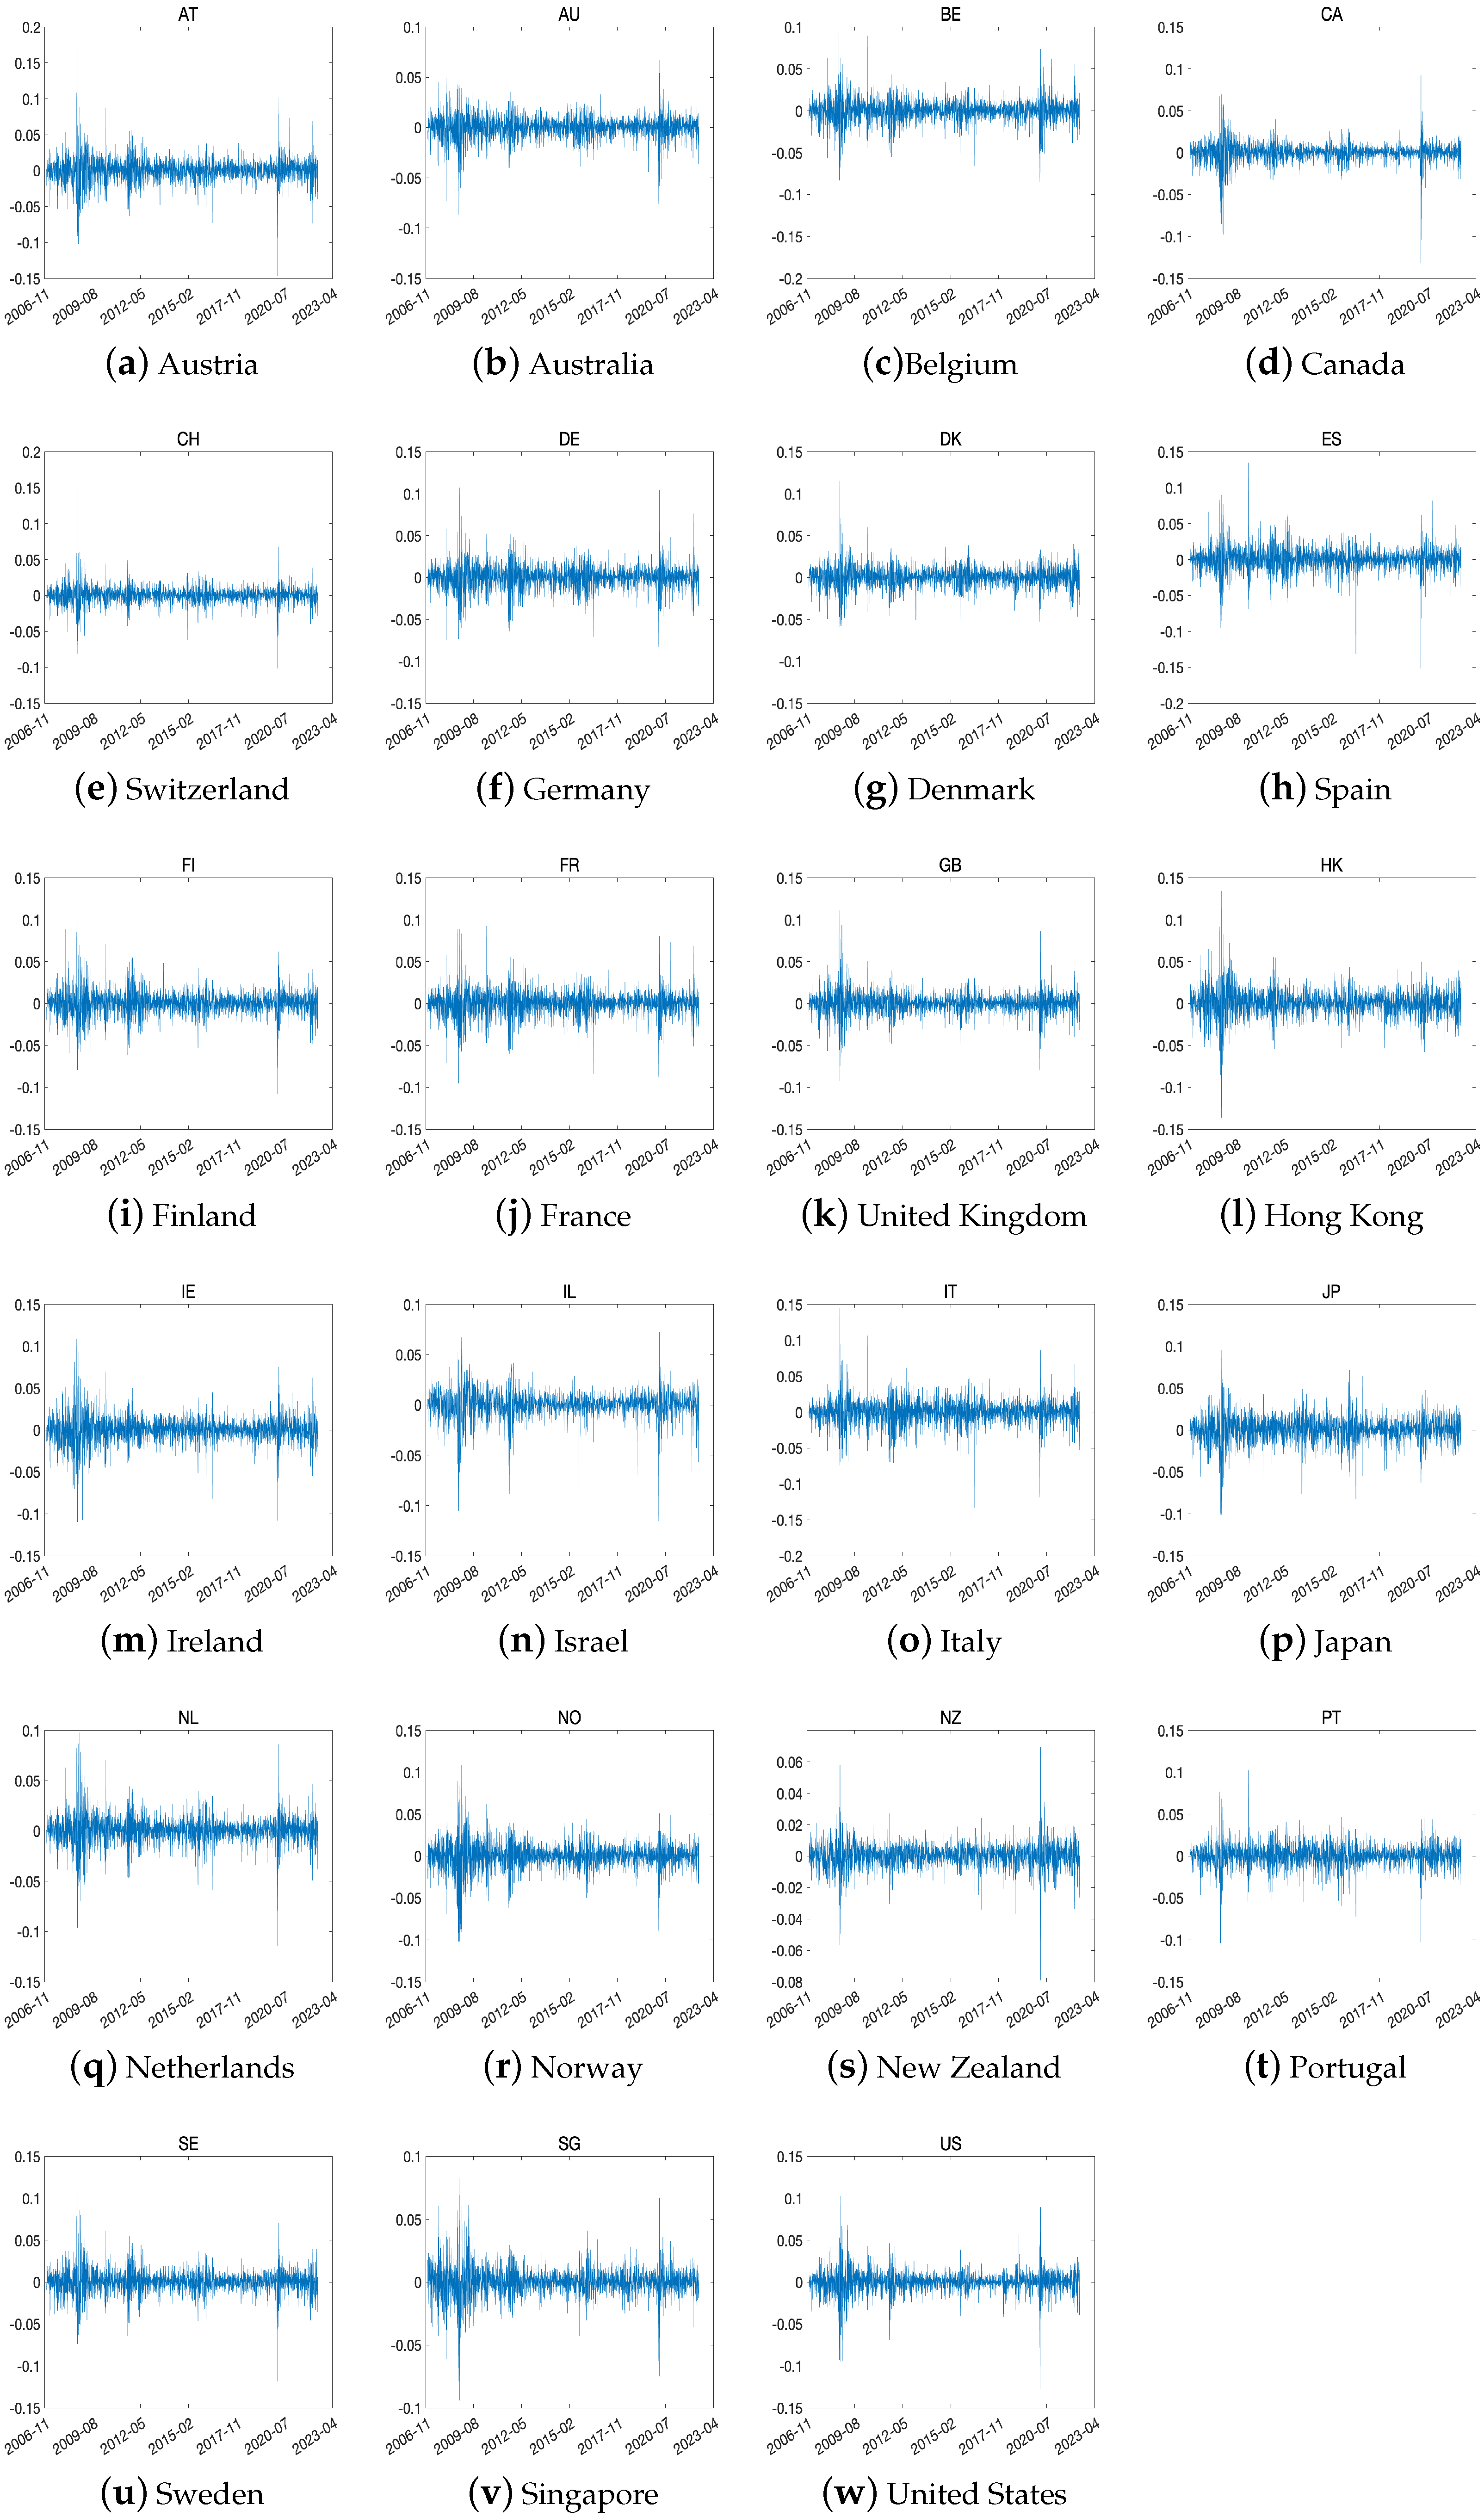
3. Data Description
4. Multifractal Detrended Fluctuation Analysis
- Step 1. Determine the profilewhere
- Step 2. Divide the profile into non-overlapping segments of equal length s. To ensure that the entire sample is covered, the same procedure is repeated starting from the end of the sample. By doing so, a total of segments are obtained:
- Step 3. Calculate the local trend for each of the segments. To estimate the local trend in each segment, a least-squares fitting polynomial is used. Once the local trend has been determined, the variance is calculated accordingly.The fitting polynomial with order m in segment is denoted as . Typically, a linear (), quadratic (), or cubic () polynomial is used to estimate the local trend in each segment, as reported in previous studies ([27,28,29]). However, in this study, in order to avoid overfitting and simplify the calculation process, a linear polynomial () is employed, as suggested in [30,31].
- Step 4. Average over all the segments. Then, we obtain the q-th order fluctuation function:
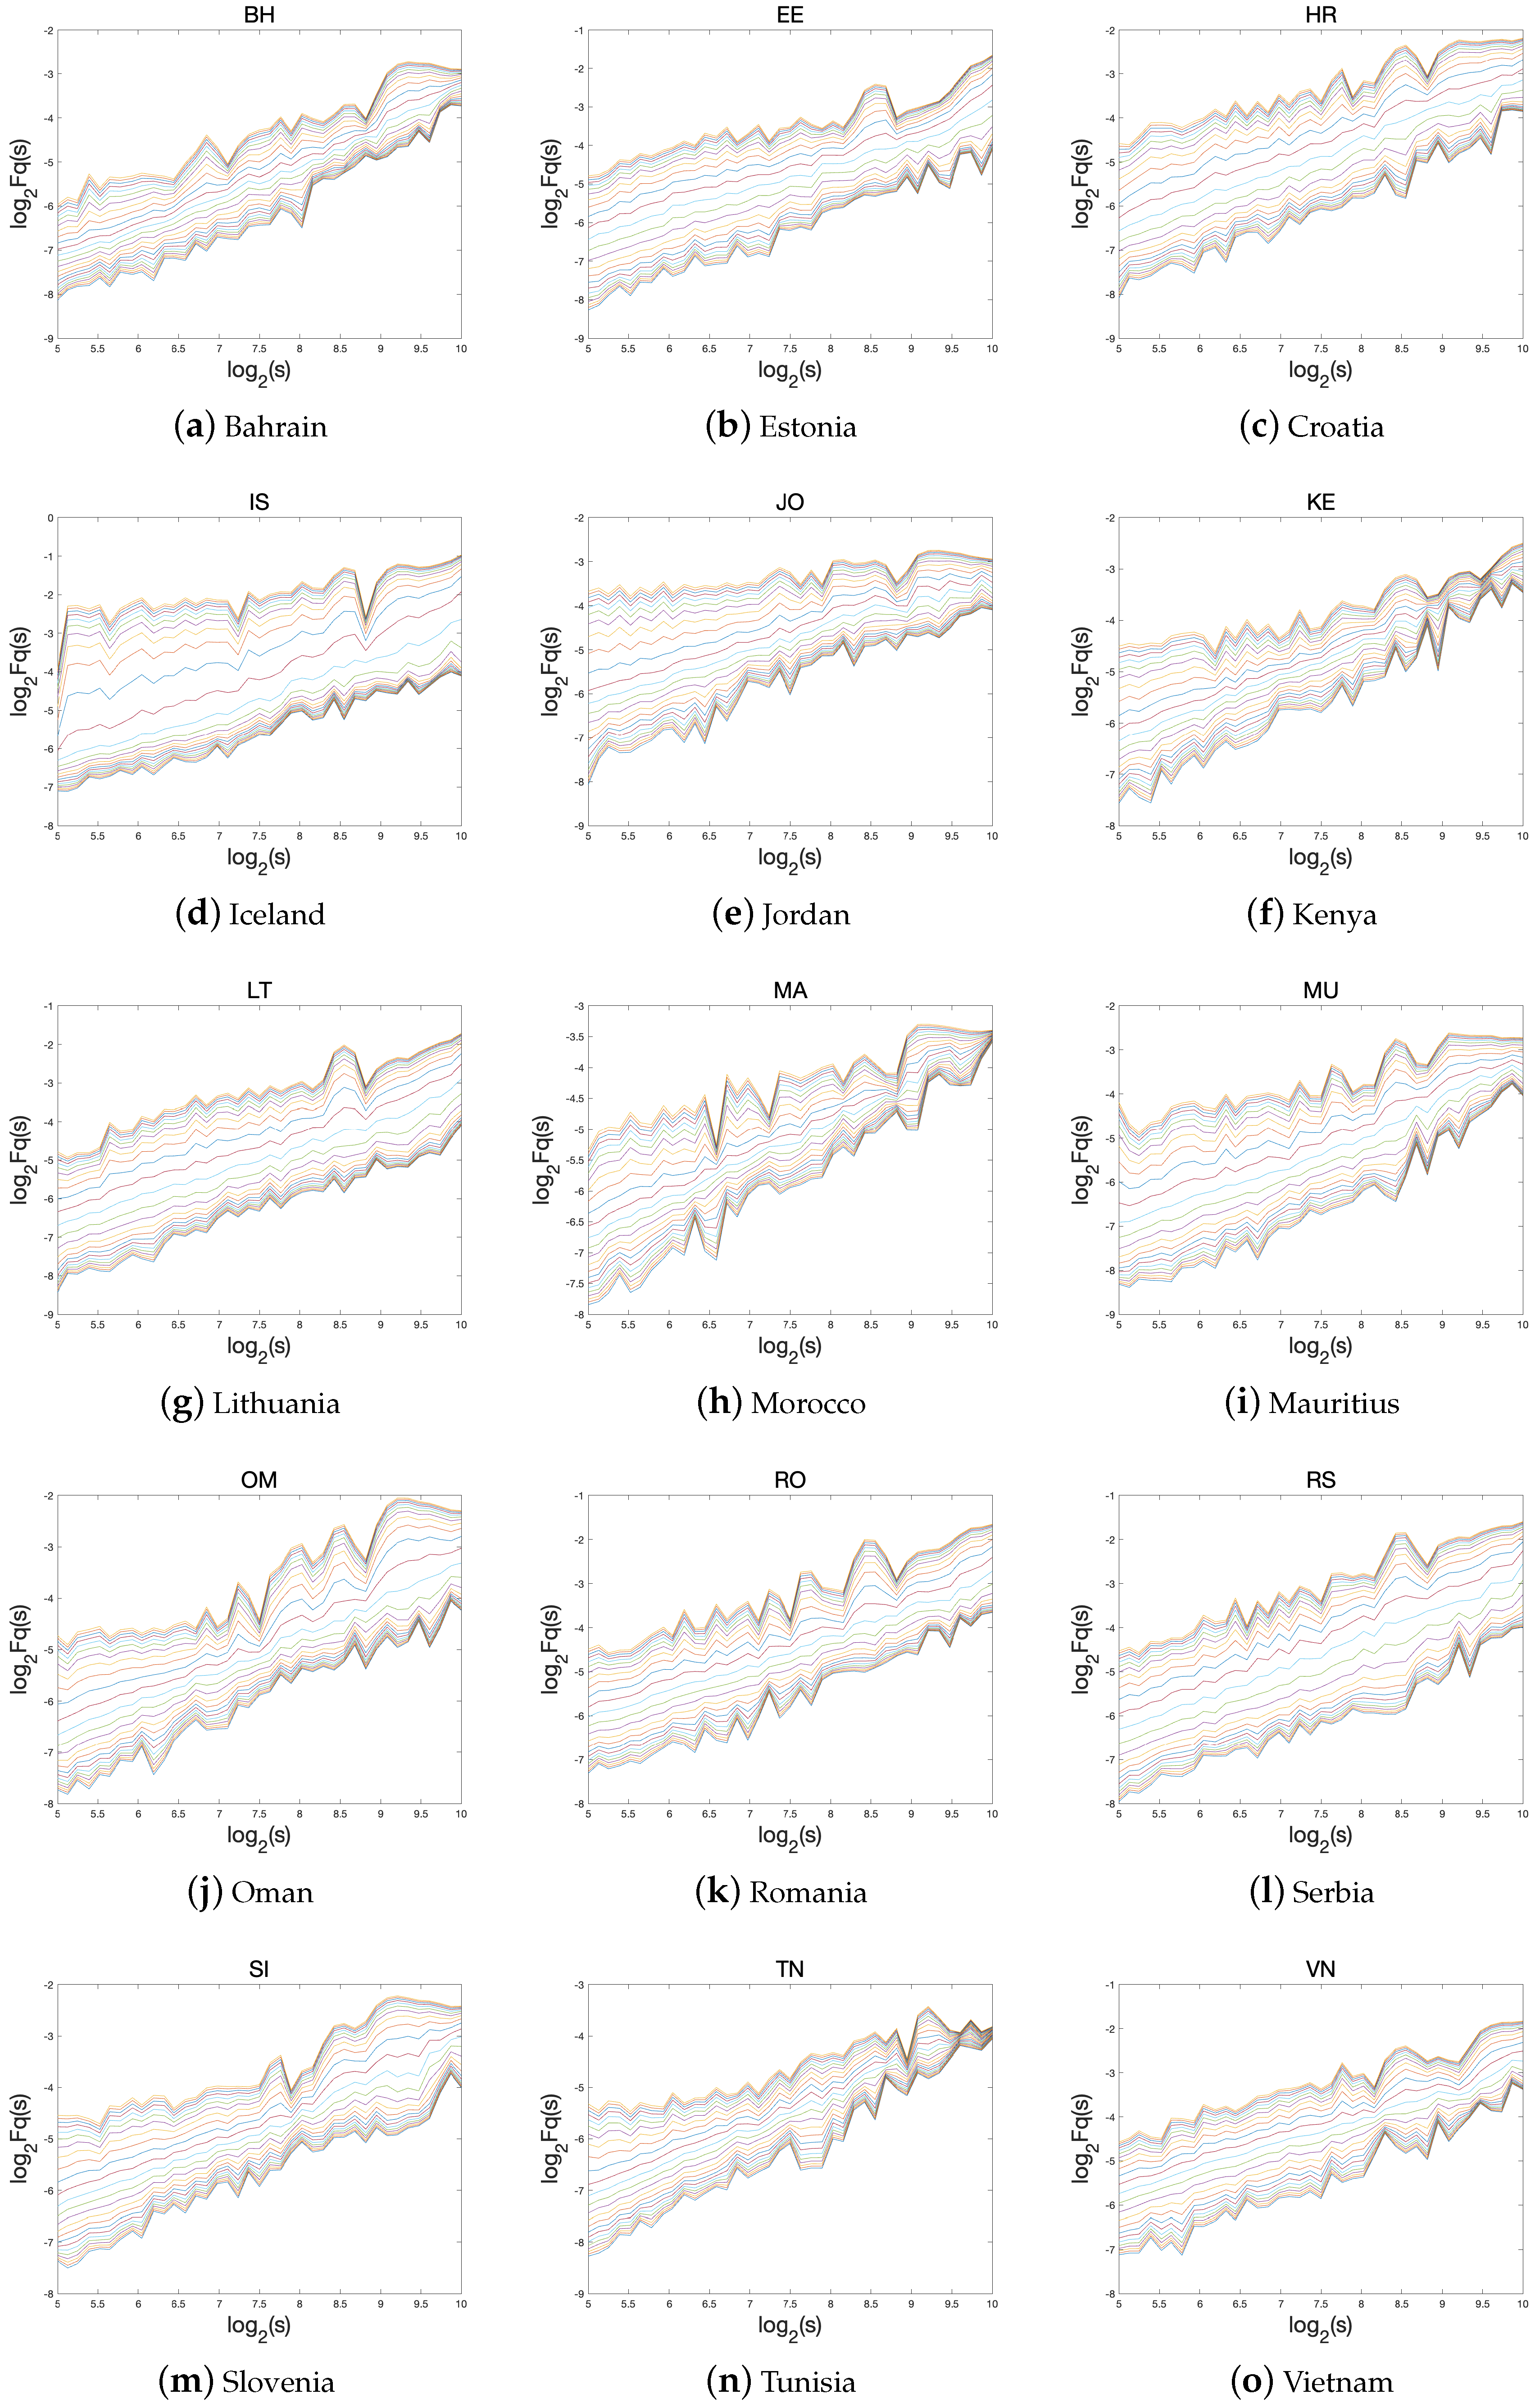
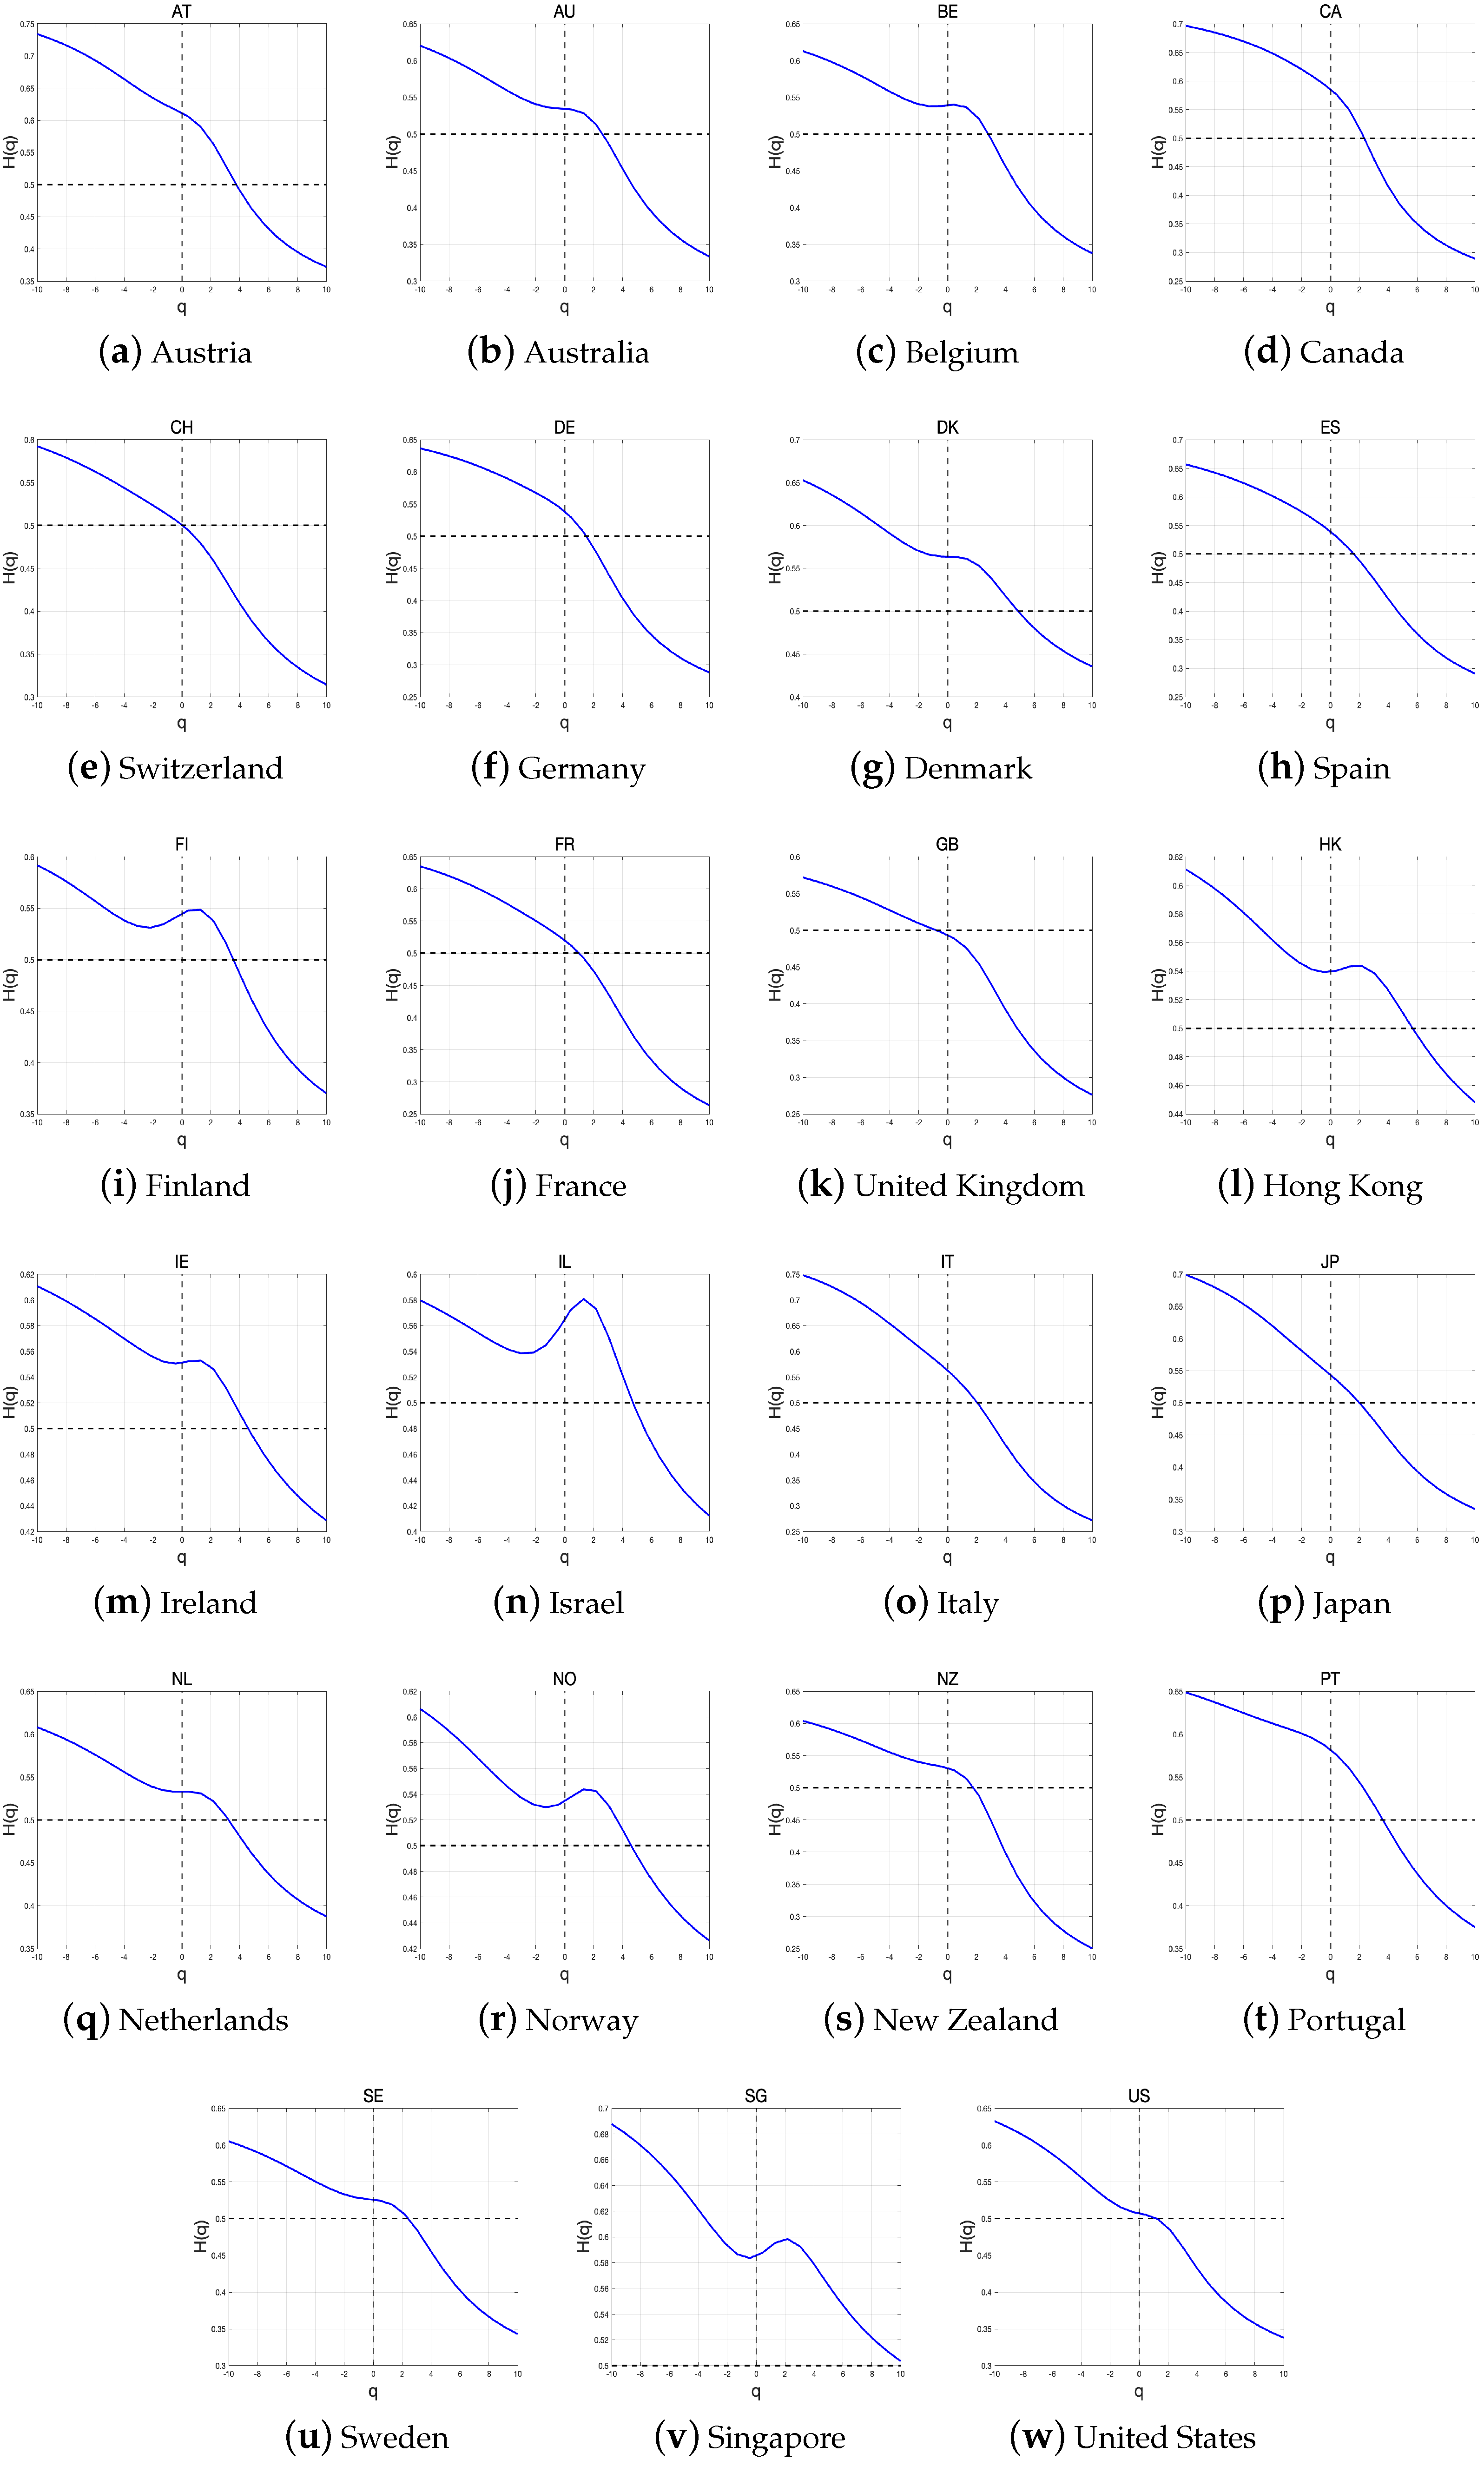
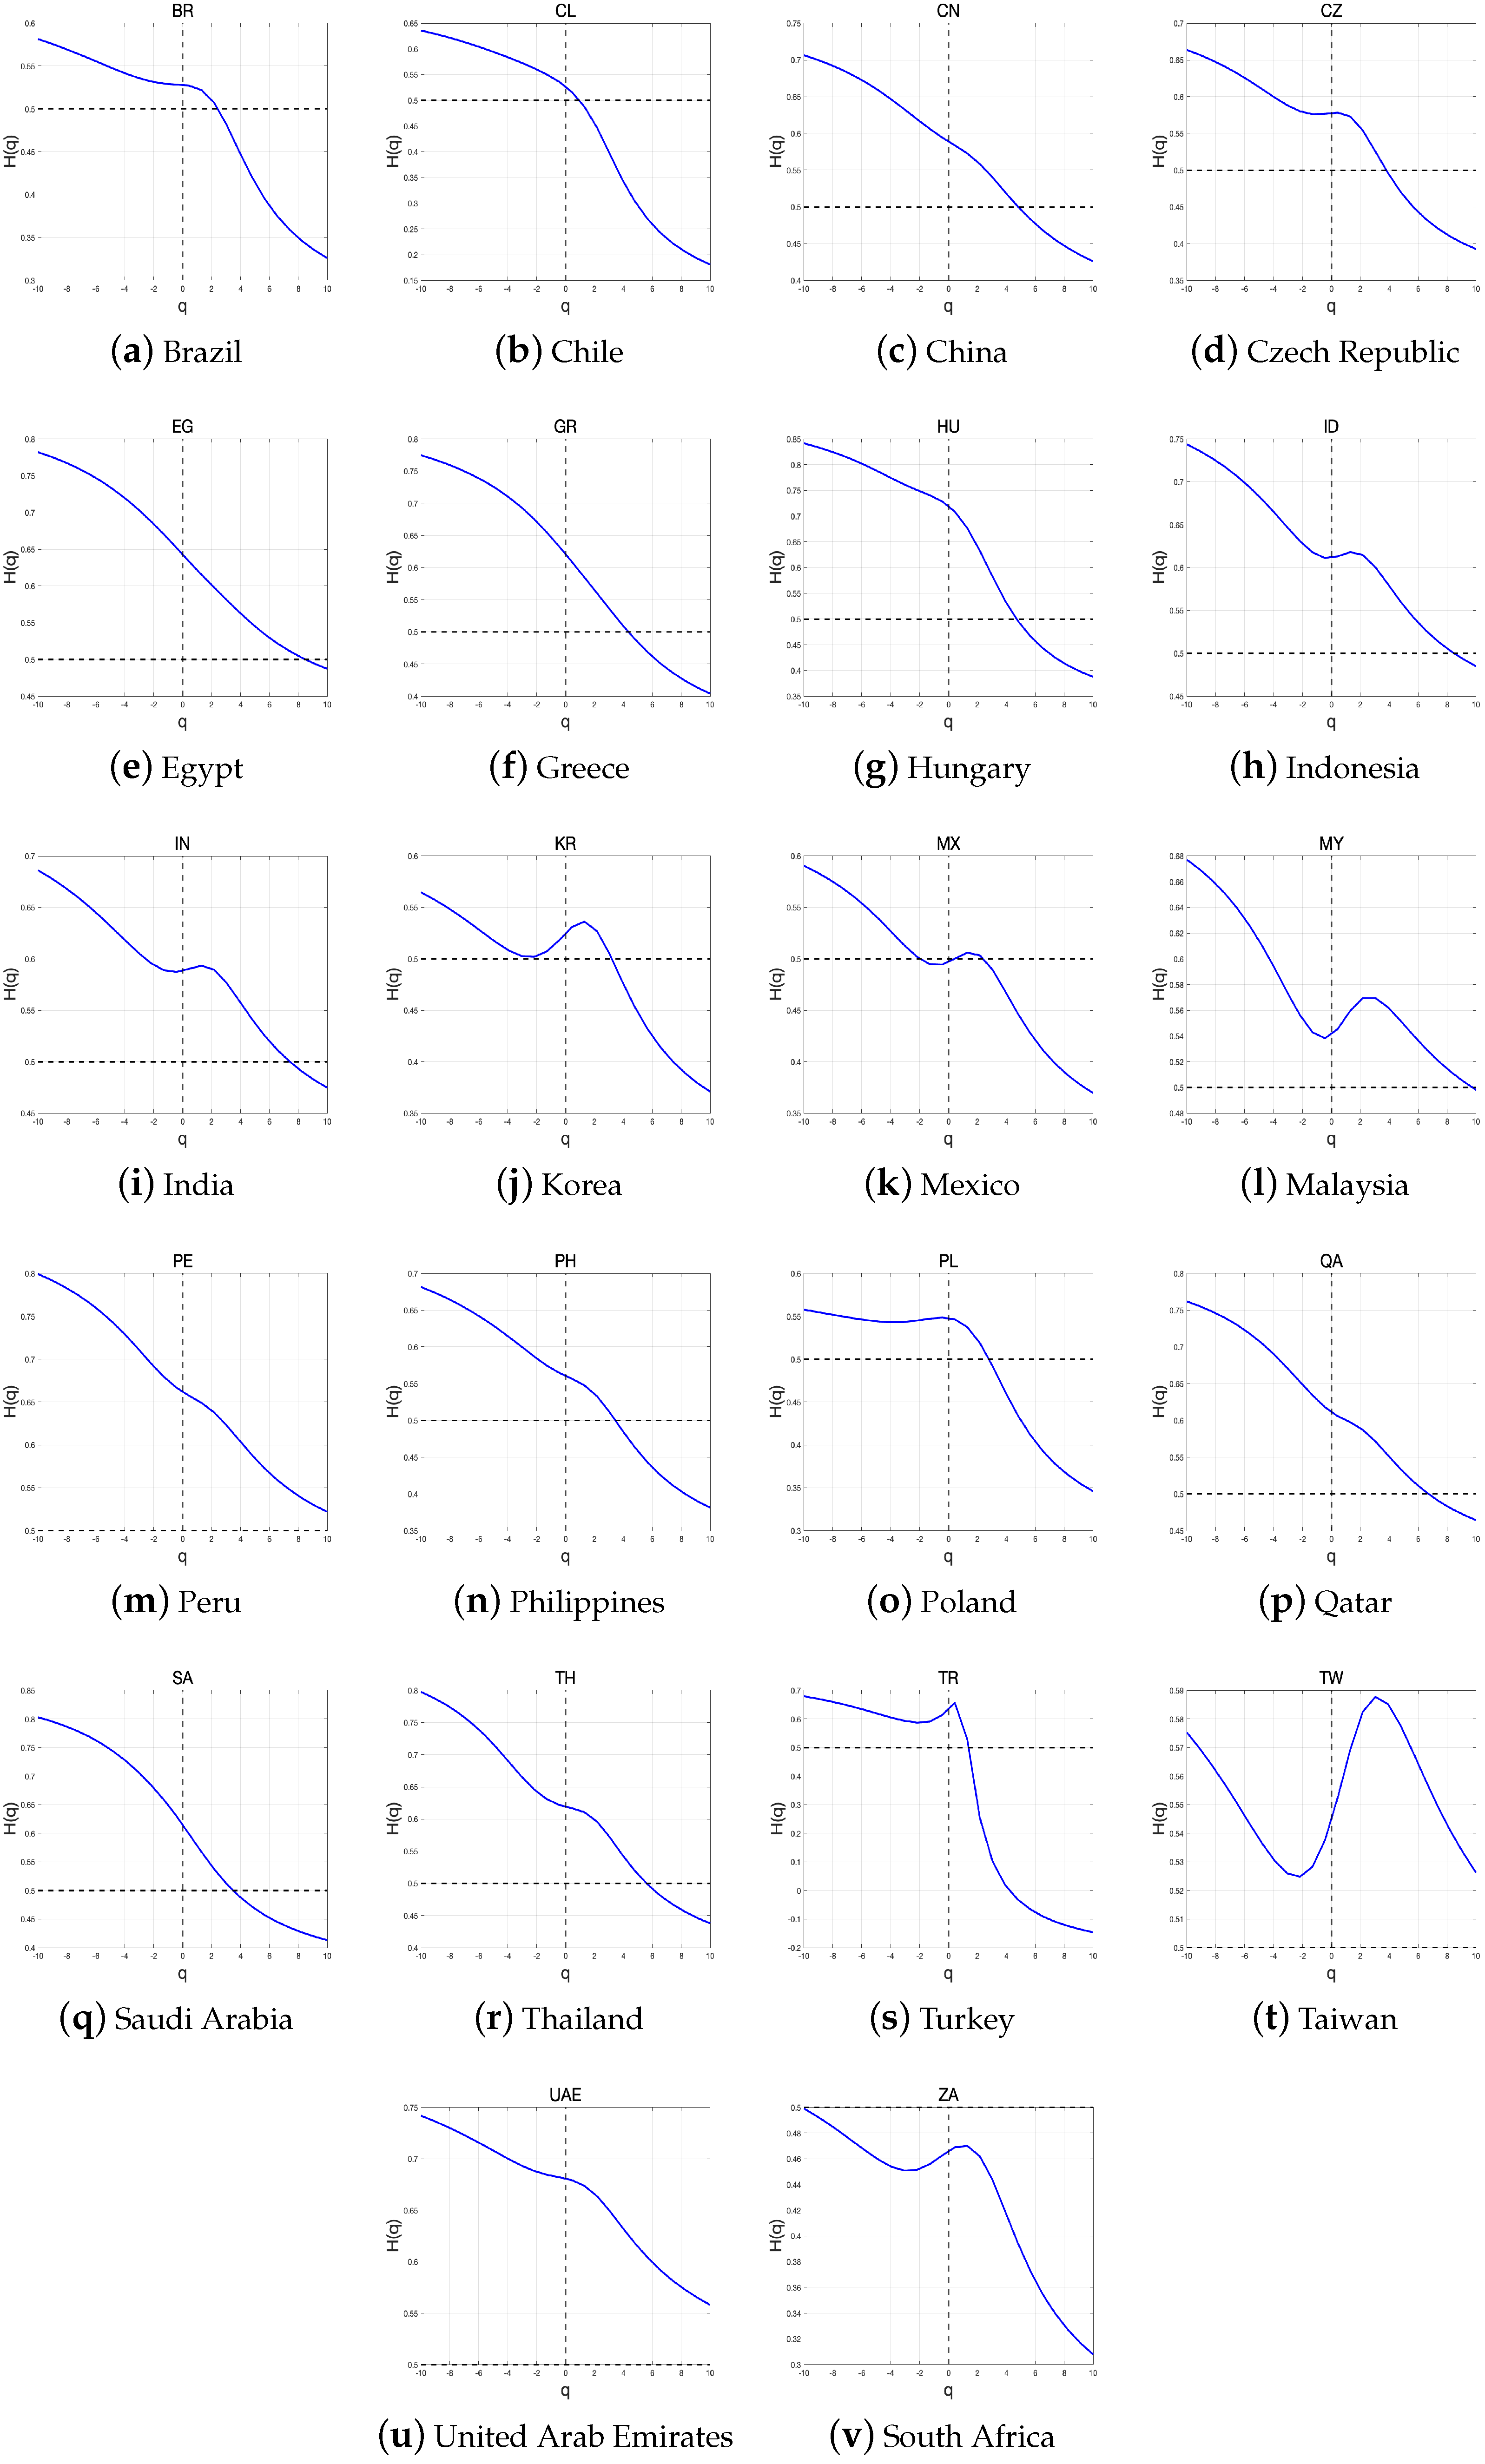
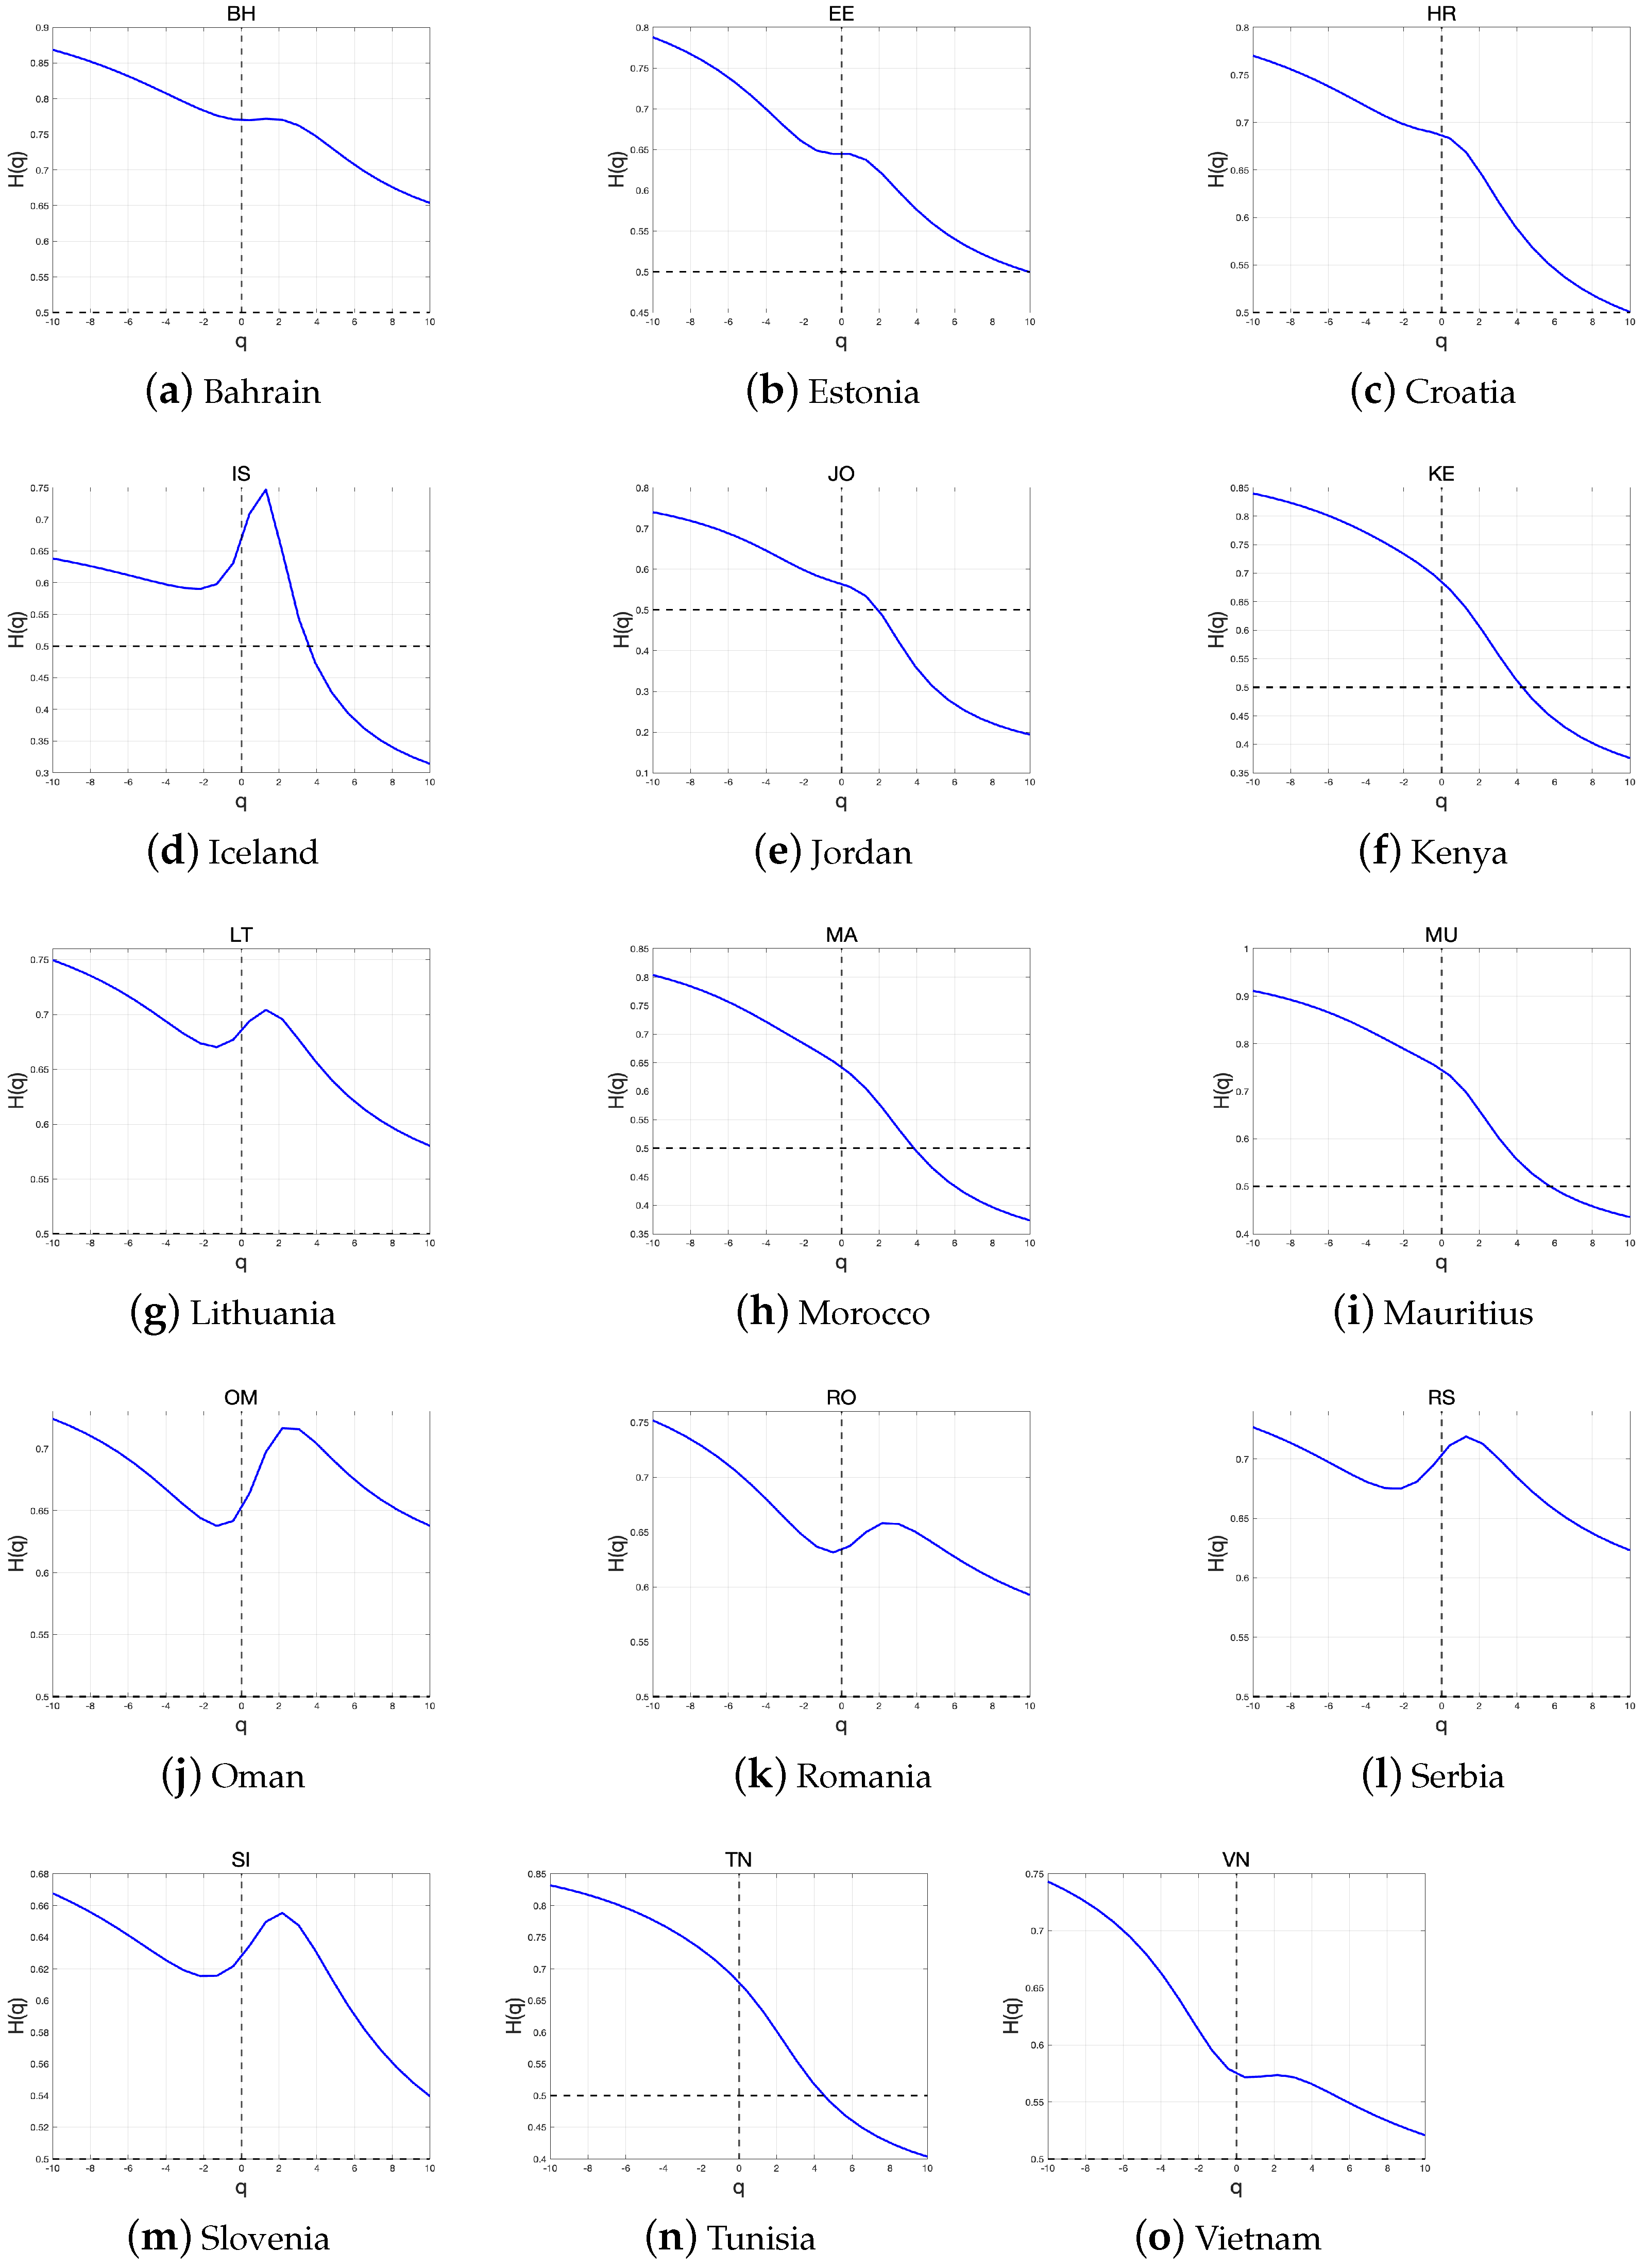
- Step 5. Determine the scaling behavior of the fluctuation functions. To determine if a long-range power law correlation exists, the log–log plots of are compared for each value of q. If the series exhibits long-range power law correlation, will increase as s becomes large. The power law relationship can be expressed in the following form.where represents the generalized Hurst exponent. Equation (7) can be written as . After taking the logarithms of both sides,where c is a constant.
5. Empirical Results
5.1. Static Analysis
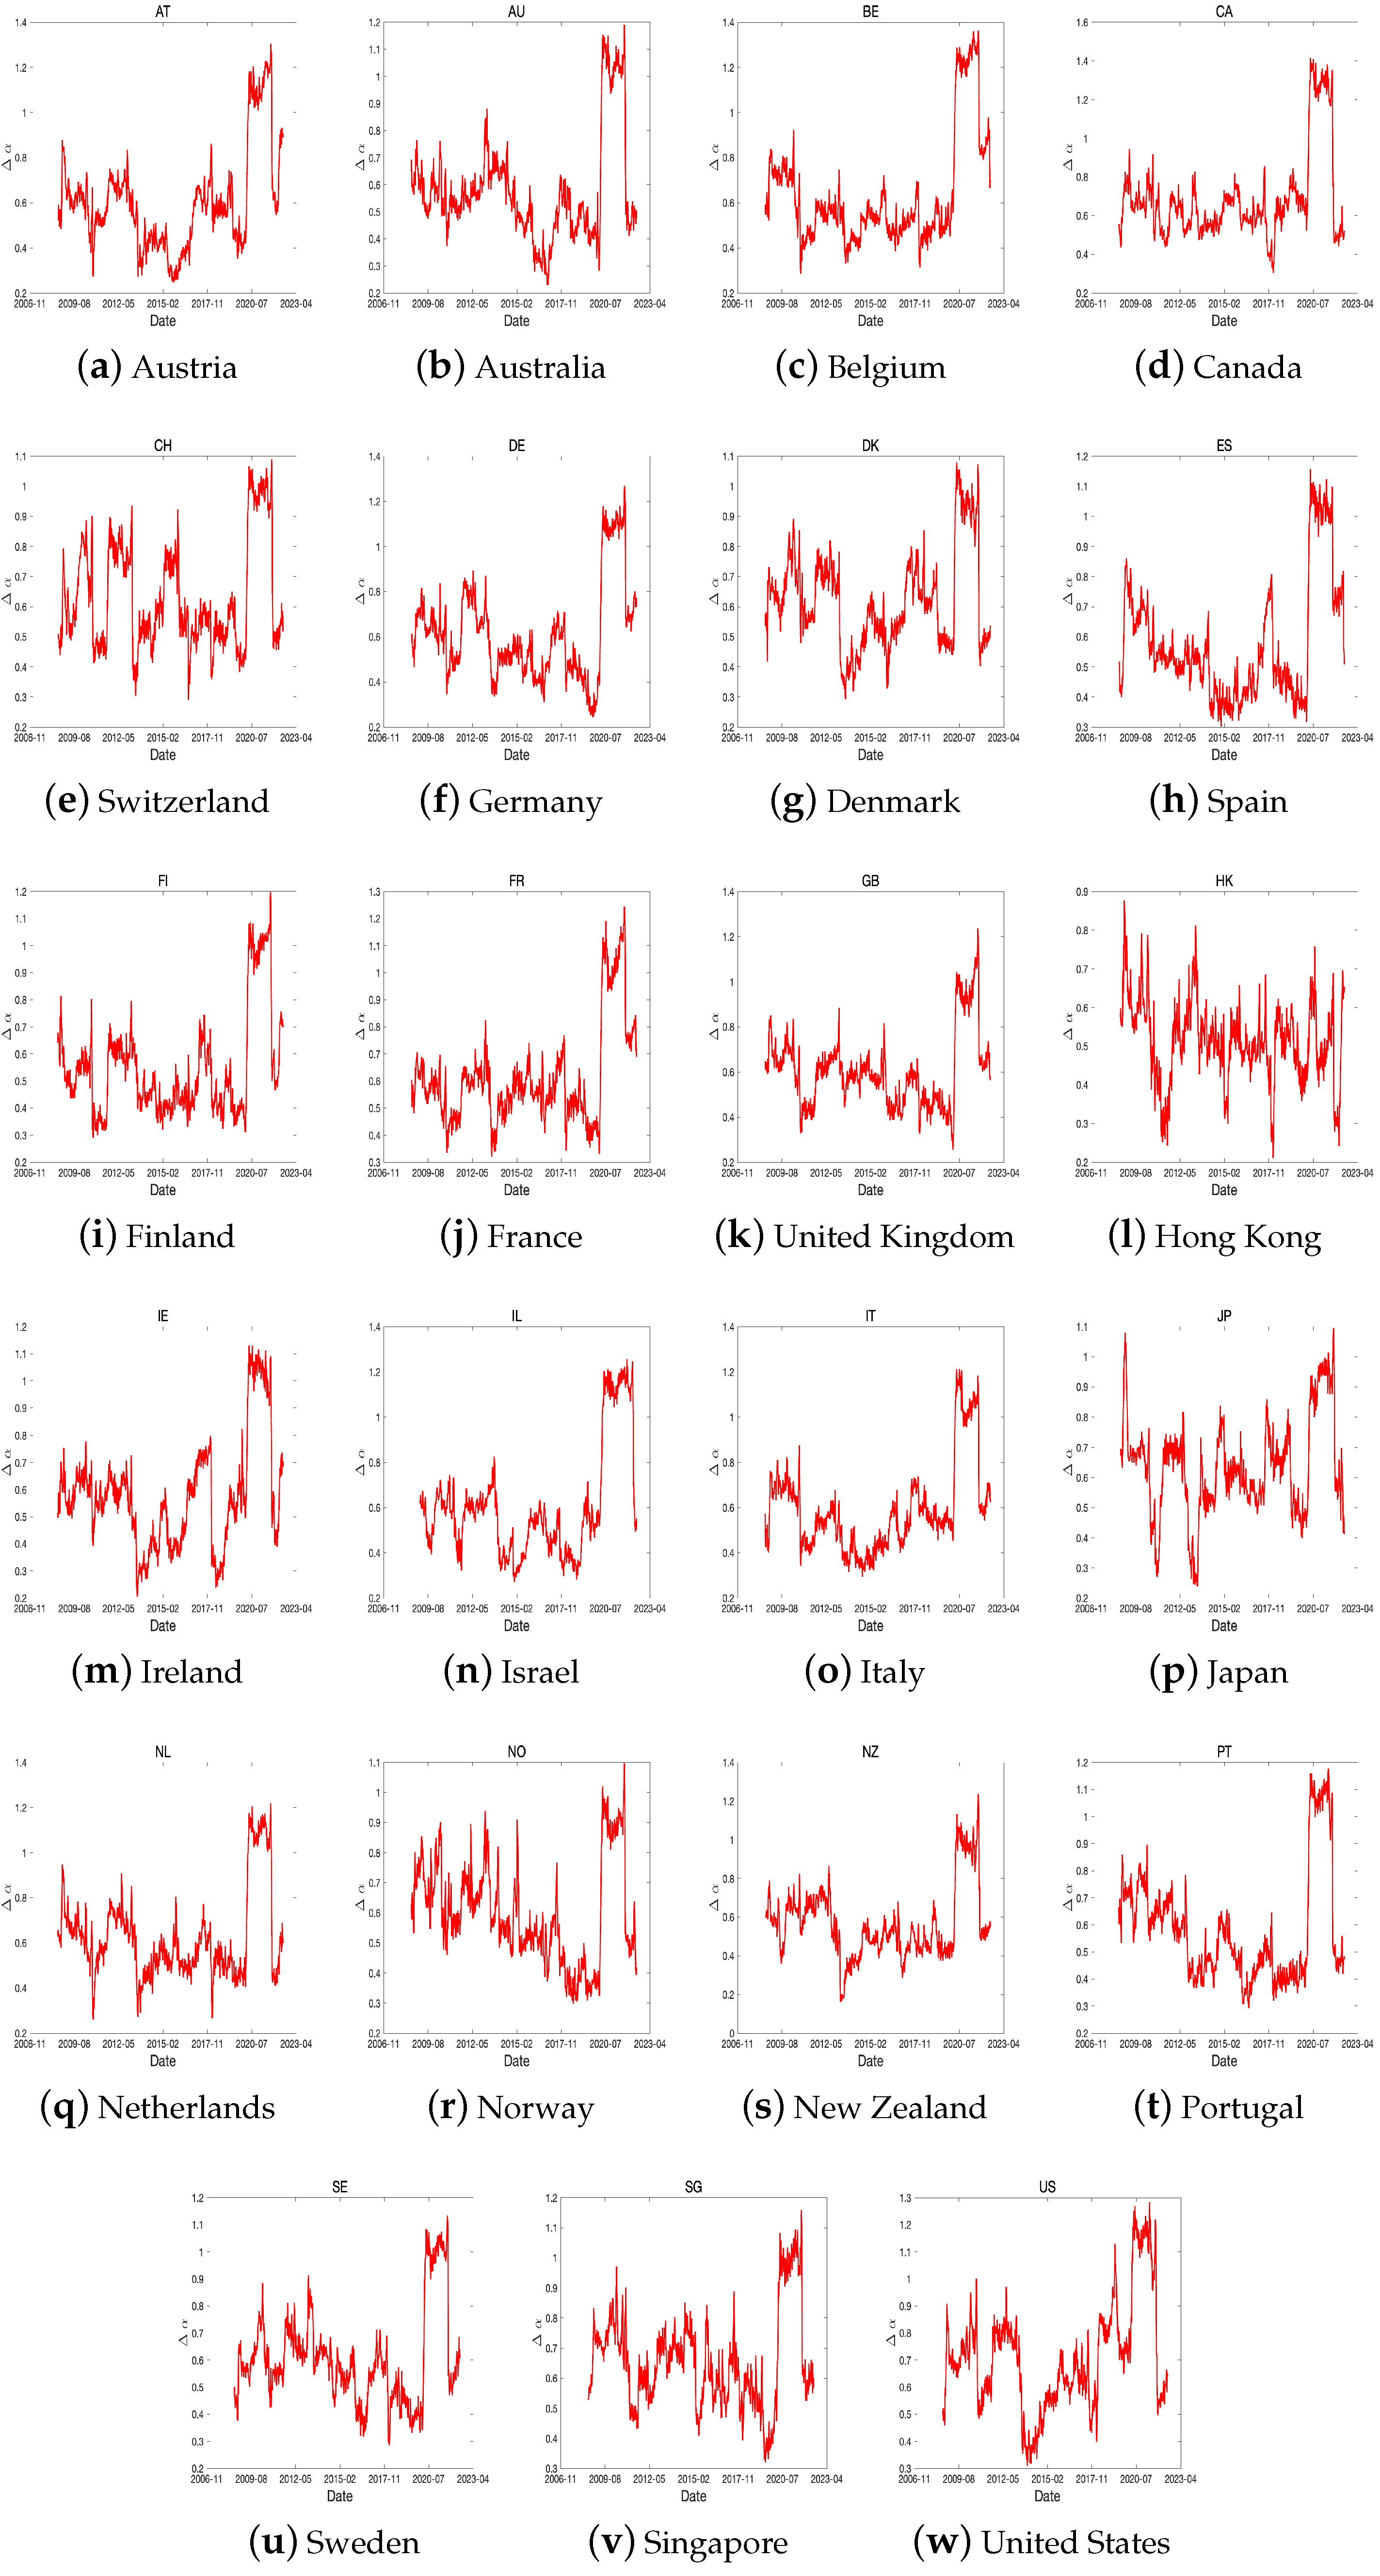
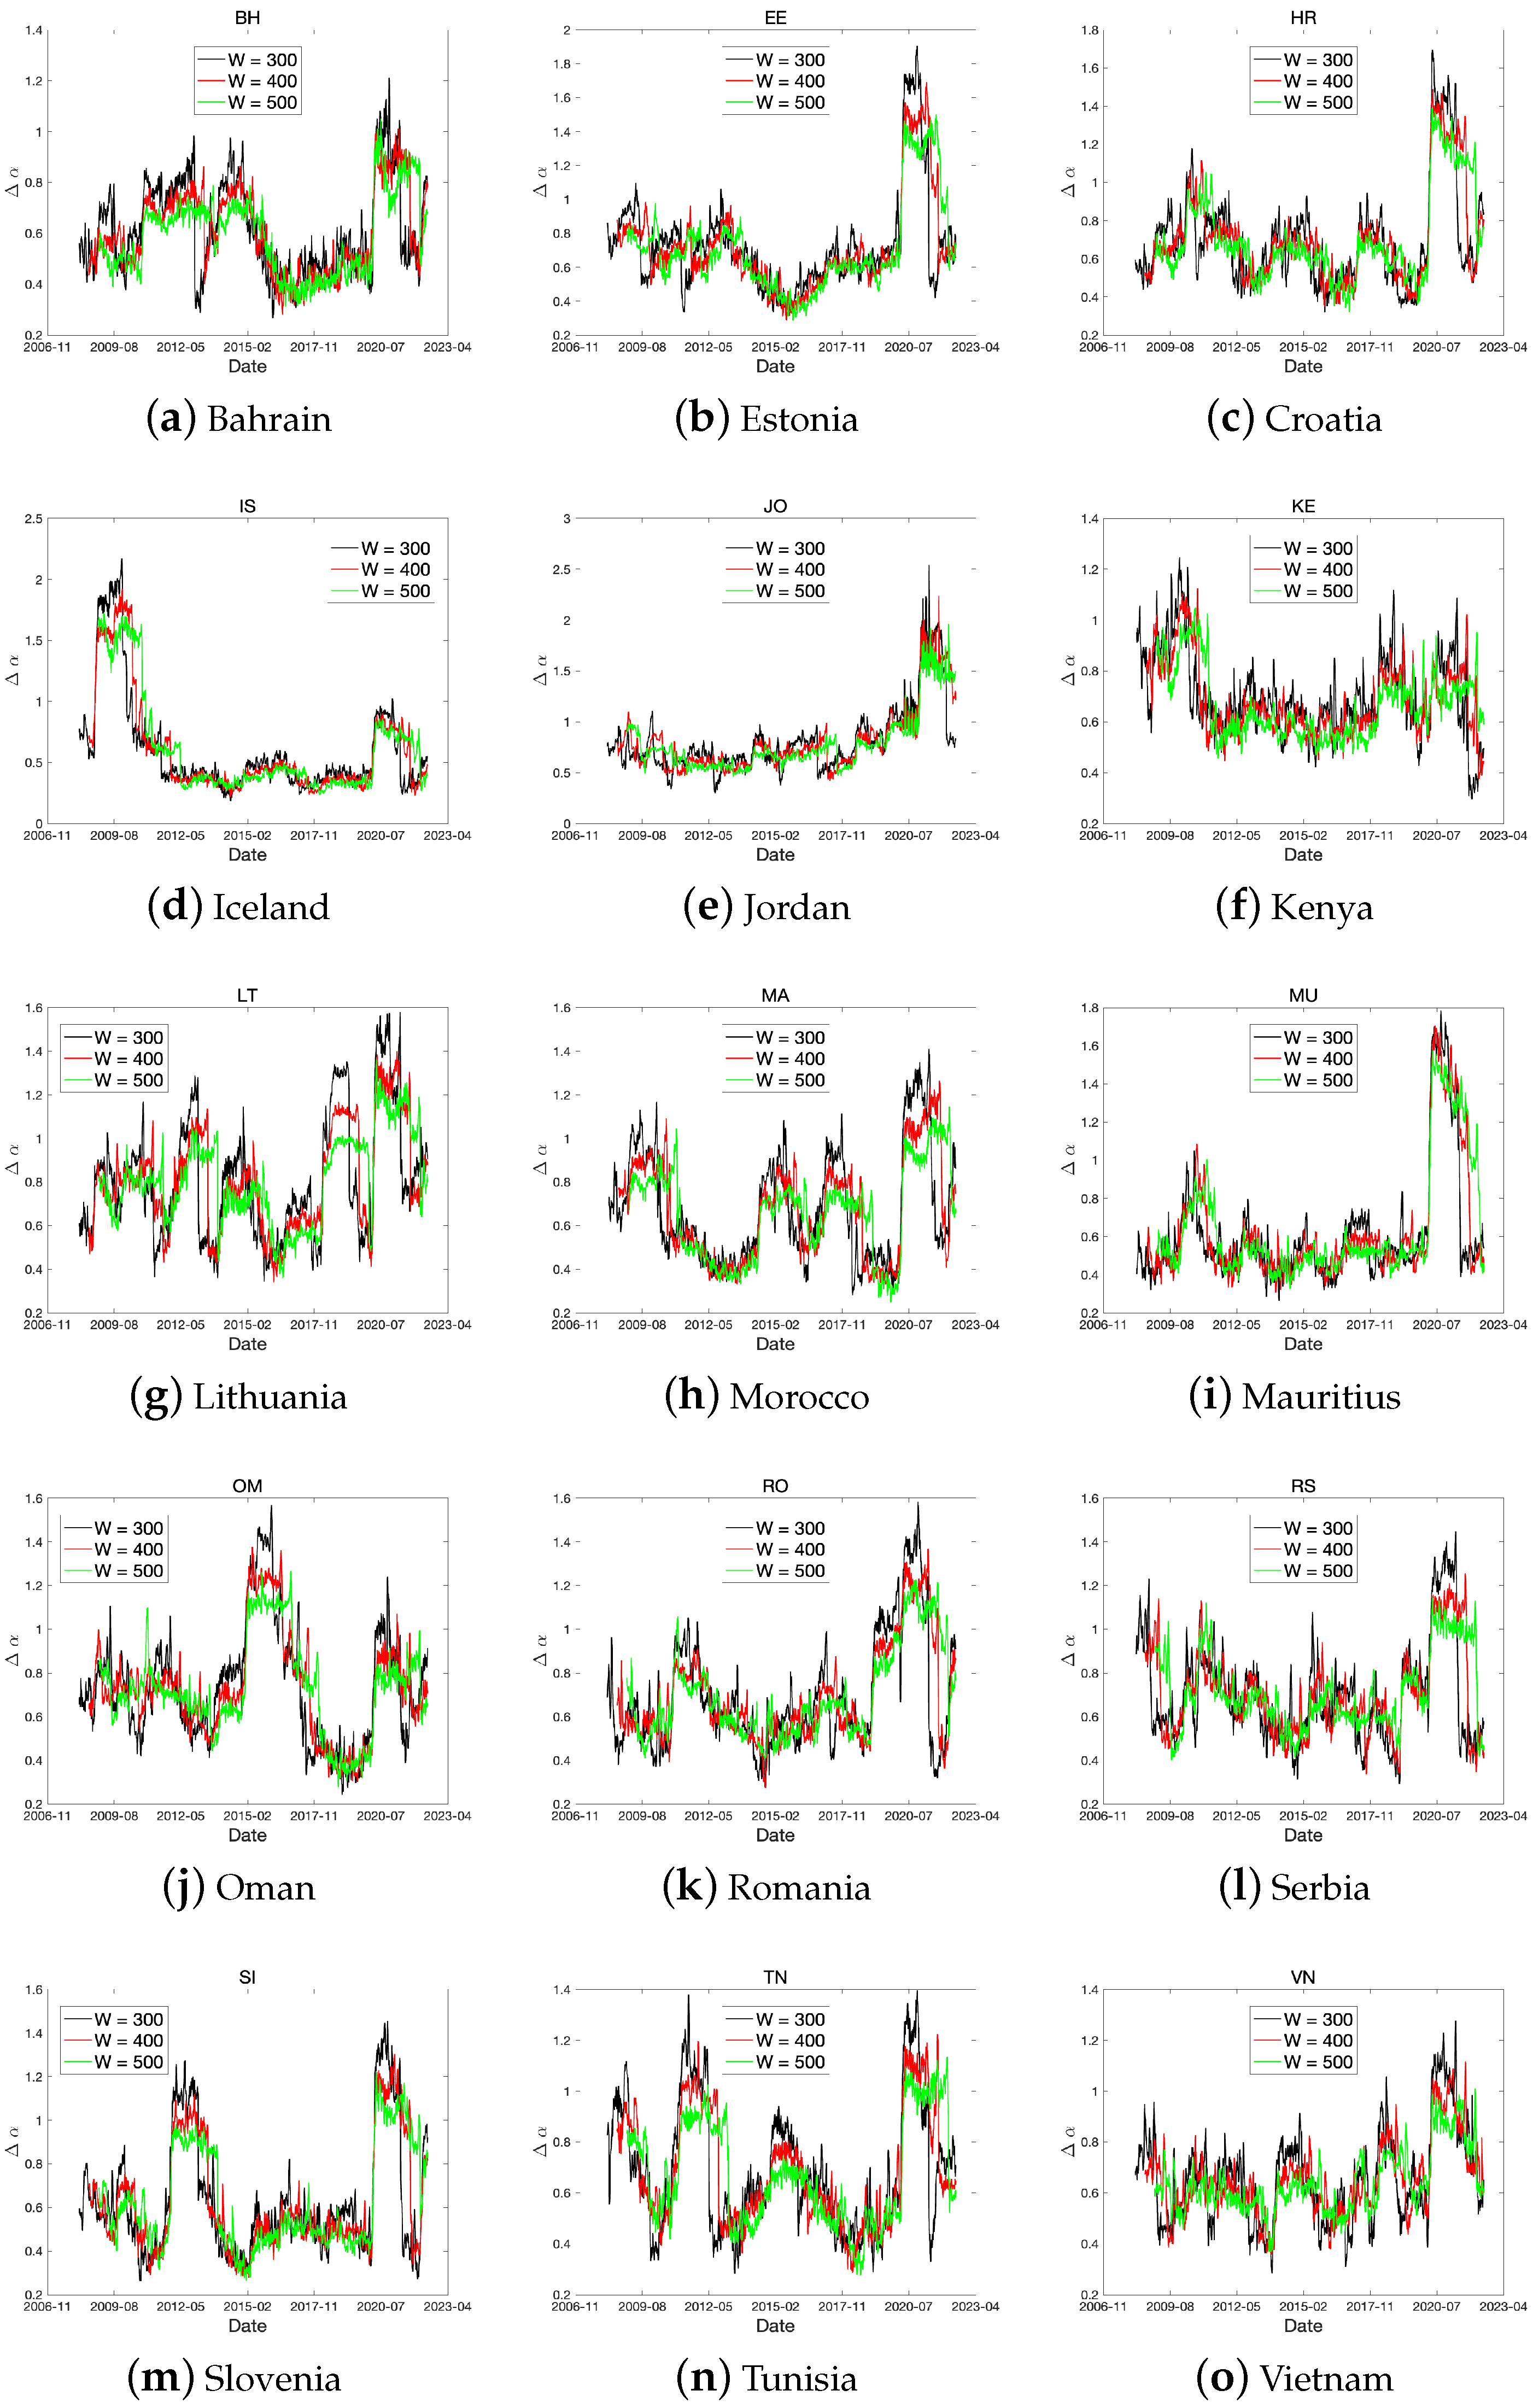
5.2. Rolling Window Analysis
6. Discussion and Concluding Remarks
Author Contributions
Funding
Data Availability Statement
Acknowledgments
Conflicts of Interest
Appendix A

| Developed | Emerging | Frontier | |||
|---|---|---|---|---|---|
| Country | Index | Country | Index | Country | Index |
| Austria | Austrian Traded Index | Brazil | IBOVESPA | Bahrain | Bahrain BHSEASI |
| Australia | S&P/ASX 200 | Chile | S&P/CLX | Estoina | Tallinn SE General |
| Belgium | BEL 20 | China | CSI 300 | Croatia | CROBEX |
| Canda | S&P/TSX | Czech Republic | PX | Iceland | OMX Iceland All-Share |
| Switzerland | SMI | Egypt | EGX 30 | Jordan | MSCI JORDAN US |
| Germany | DAX | Greece | FTSE Athex Large Cap | Kenya | Kenya NSE 20 |
| Denmark | OMX Copenhagen 25 | Hungary | BUMIX | Lituania | Vilnius SE General |
| Spain | IBEX 35 | Indonesia | IDX | Morocco | Morocco MASI |
| Finland | OMX Helsinki 25 | India | NIFTY 50 | Mauritius | Semdex |
| France | CAC 40 | Korea | KOSPI | Oman | Oman MSM |
| United Kingdom | UK 100 | Mexico | S&P/BMV IPC | Romania | BET |
| Hong Kong | Hang Senng | Malaysia | KLCI | Serbia | Belex 15 |
| Ireland | ISEQ 20 | Peru | S&P Lima General | Slovenia | SLOVENIAN BLUE CHIP |
| Israel | TA 125 | Philippines | PSEi | Tunisia | Tunindex |
| Italy | Italy 40 | Poland | WIG 20 | Vietnam | VNI |
| Japan | Nikkei 225 | Qatar | QE General | ||
| Netherlands | AEX | Saudi Arabia | Tadawul All Share | ||
| Norway | OBX Price | Thailand | SET | ||
| New Zealand | S&P/NZX 50 | Turkey | BIST 100 | ||
| Portugal | PSI | Taiwan | TSEC Taiwan 50 | ||
| Sweden | OMX Stockholm 30 | United Arab Emirates | DFM General | ||
| Singapore | FTSE Singapore | South Africa | iShares MSCI South Africa | ||
| United States | S&P 500 | ||||


References
- Horta, P.; Lagoa, S.; Martins, L. The impact of the 2008 and 2010 financial crises on the Hurst exponents of international stock markets: Implications for efficiency and contagion. Int. Rev. Financ. Anal. 2014, 35, 140–153. [Google Scholar] [CrossRef]
- Hull, M.; McGroarty, F. Do emerging markets become more efficient as they develop? Long memory persistence in equity indices. Emerg. Mark. Rev. 2014, 18, 45–61. [Google Scholar] [CrossRef]
- Rizvi, S.A.R.; Dewandaru, G.; Bacha, O.I.; Masih, M. An analysis of stock market efficiency: Developed vs. Islamic stock markets using MF-DFA. Phys. A Stat. Mech. Its Appl. 2014, 407, 86–99. [Google Scholar] [CrossRef]
- Charfeddine, L.; Khediri, K.B. Time varying market efficiency of the GCC stock markets. Phys. A Stat. Mech. Its Appl. 2016, 444, 487–504. [Google Scholar] [CrossRef]
- Ali, S.; Shahzad, S.J.H.; Raza, N.; Al-Yahyaee, K.H. Stock market efficiency: A comparative analysis of Islamic and conventional stock markets. Phys. A Stat. Mech. Its Appl. 2018, 503, 139–153. [Google Scholar] [CrossRef]
- Miloş, L.R.; Haţiegan, C.; Miloş, M.C.; Barna, F.M.; Boțoc, C. Multifractal detrended fluctuation analysis (MF-DFA) of stock market indexes. Empirical evidence from seven central and eastern European markets. Sustainability 2020, 12, 535. [Google Scholar] [CrossRef]
- Choi, S.Y. Analysis of stock market efficiency during crisis periods in the US stock market: Differences between the global financial crisis and COVID-19 pandemic. Phys. A Stat. Mech. Its Appl. 2021, 574, 125988. [Google Scholar] [CrossRef]
- Yin, T.; Wang, Y. Market efficiency and nonlinear analysis of soybean futures. Sustainability 2021, 13, 518. [Google Scholar] [CrossRef]
- Pak, D.; Choi, S.Y. Economic Policy Uncertainty and Sectoral Trading Volume in the US Stock Market: Evidence from the COVID-19 Crisis. Complexity 2022, 2022, 2248731. [Google Scholar] [CrossRef]
- Gaio, L.E.; Stefanelli, N.O.; Júnior, T.P.; Bonacim, C.A.G.; Gatsios, R.C. The impact of the Russia-Ukraine conflict on market efficiency: Evidence for the developed stock market. Financ. Res. Lett. 2022, 50, 103302. [Google Scholar] [CrossRef]
- Caraiani, P. Evidence of multifractality from emerging European stock markets. PLoS ONE 2012, 7, e40693. [Google Scholar] [CrossRef] [PubMed]
- Arshad, S.; Rizvi, S.A.R.; Ghani, G.M.; Duasa, J. Investigating stock market efficiency: A look at OIC member countries. Res. Int. Bus. Financ. 2016, 36, 402–413. [Google Scholar] [CrossRef]
- Aslam, F.; Ferreira, P.; Mohti, W. Investigating efficiency of frontier stock markets using multifractal detrended fluctuation analysis. Int. J. Emerg. Mark. 2021; ahead of print. [Google Scholar]
- Nargunam, R.; Lahiri, A. Persistence in daily returns of stocks with highest market capitalization in the Indian market. Digit. Financ. 2022, 4, 341–374. [Google Scholar] [CrossRef]
- Lee, M.; Song, J.W.; Kim, S.; Chang, W. Asymmetric market efficiency using the index-based asymmetric-MFDFA. Phys. A Stat. Mech. Its Appl. 2018, 512, 1278–1294. [Google Scholar] [CrossRef]
- Aslam, F.; Latif, S.; Ferreira, P. Investigating long-range dependence of emerging Asian stock markets using multifractal detrended fluctuation analysis. Symmetry 2020, 12, 1157. [Google Scholar] [CrossRef]
- Aslam, F.; Ferreira, P.; Ali, H.; Kauser, S. Herding behavior during the COVID-19 pandemic: A comparison between Asian and European stock markets based on intraday multifractality. Eurasian Econ. Rev. 2021, 12, 333–359. [Google Scholar] [CrossRef]
- Mensi, W.; Yousaf, I.; Vo, X.V.; Kang, S.H. Multifractality during upside/downside trends in the MENA stock markets: The effects of the global financial crisis, oil crash and COVID-19 pandemic. Int. J. Emerg. Mark. 2022; ahead of print. [Google Scholar]
- Saâdaoui, F. Skewed multifractal scaling of stock markets during the COVID-19 pandemic. Chaos Solitons Fractals 2023, 170, 113372. [Google Scholar] [CrossRef]
- Lim, K.P. Ranking market efficiency for stock markets: A nonlinear perspective. Phys. A Stat. Mech. Its Appl. 2007, 376, 445–454. [Google Scholar] [CrossRef]
- Anagnostidis, P.; Varsakelis, C.; Emmanouilides, C.J. Has the 2008 financial crisis affected stock market efficiency? The case of Eurozone. Phys. A Stat. Mech. Its Appl. 2016, 447, 116–128. [Google Scholar] [CrossRef]
- Rizvi, S.A.R.; Arshad, S. Investigating the efficiency of East Asian stock markets through booms and busts. Pac. Sci. Rev. 2014, 16, 275–279. [Google Scholar] [CrossRef]
- Smith, G. The changing and relative efficiency of European emerging stock markets. Eur. J. Financ. 2012, 18, 689–708. [Google Scholar] [CrossRef]
- Sensoy, A. Generalized Hurst exponent approach to efficiency in MENA markets. Phys. A Stat. Mech. Its Appl. 2013, 392, 5019–5026. [Google Scholar] [CrossRef]
- Kantelhardt, J.W.; Zschiegner, S.A.; Koscielny-Bunde, E.; Havlin, S.; Bunde, A.; Stanley, H.E. Multifractal detrended fluctuation analysis of nonstationary time series. Phys. A Stat. Mech. Its Appl. 2002, 316, 87–114. [Google Scholar] [CrossRef]
- Wang, F.; Ye, X.; Wu, C. Multifractal characteristics analysis of crude oil futures prices fluctuation in China. Phys. A Stat. Mech. Its Appl. 2019, 533, 122021. [Google Scholar] [CrossRef]
- Jiang, Z.Q.; Chen, W.; Zhou, W.X. Detrended fluctuation analysis of intertrade durations. Phys. A Stat. Mech. Its Appl. 2009, 388, 433–440. [Google Scholar] [CrossRef]
- Qian, X.Y.; Gu, G.F.; Zhou, W.X. Modified detrended fluctuation analysis based on empirical mode decomposition for the characterization of anti-persistent processes. Phys. A Stat. Mech. Its Appl. 2011, 390, 4388–4395. [Google Scholar] [CrossRef]
- Han, C.; Wang, Y.; Xu, Y. Efficiency and multifractality analysis of the Chinese stock market: Evidence from stock indices before and after the 2015 stock market crash. Sustainability 2019, 11, 1699. [Google Scholar] [CrossRef]
- Lashermes, B.; Abry, P.; Chainais, P. New insights into the estimation of scaling exponents. Int. J. Wavelets Multiresolut. Inf. Process. 2004, 2, 497–523. [Google Scholar] [CrossRef]
- Ning, Y.; Wang, Y.; Su, C.w. How did China’s foreign exchange reform affect the efficiency of foreign exchange market? Phys. A Stat. Mech. Its Appl. 2017, 483, 219–226. [Google Scholar] [CrossRef]
- Calvet, L.; Fisher, A. Multifractality in asset returns: Theory and evidence. Rev. Econ. Stat. 2002, 84, 381–406. [Google Scholar] [CrossRef]
- Alvarez-Ramirez, J.; Cisneros, M.; Ibarra-Valdez, C.; Soriano, A. Multifractal Hurst analysis of crude oil prices. Phys. A Stat. Mech. Its Appl. 2002, 313, 651–670. [Google Scholar] [CrossRef]
- Wang, Y.; Wu, C.; Pan, Z. Multifractal detrending moving average analysis on the US Dollar exchange rates. Phys. A Stat. Mech. Its Appl. 2011, 390, 3512–3523. [Google Scholar] [CrossRef]
- da Silva Filho, A.C.; Maganini, N.D.; de Almeida, E.F. Multifractal analysis of Bitcoin market. Phys. A Stat. Mech. Its Appl. 2018, 512, 954–967. [Google Scholar] [CrossRef]
- Ruan, Q.; Zhang, S.; Lv, D.; Lu, X. Financial liberalization and stock market cross-correlation: MF-DCCA analysis based on Shanghai-Hong Kong Stock Connect. Phys. A Stat. Mech. Its Appl. 2018, 491, 779–791. [Google Scholar] [CrossRef]
- Zhou, W.; Dang, Y.; Gu, R. Efficiency and multifractality analysis of CSI 300 based on multifractal detrending moving average algorithm. Phys. A Stat. Mech. Its Appl. 2013, 392, 1429–1438. [Google Scholar] [CrossRef]
- Gao, X.L.; Shao, Y.H.; Yang, Y.H.; Zhou, W.X. Do the global grain spot markets exhibit multifractal nature? Chaos Solitons Fractals 2022, 164, 112663. [Google Scholar] [CrossRef]
- Wang, Y.; Wei, Y.; Wu, C. Analysis of the efficiency and multifractality of gold markets based on multifractal detrended fluctuation analysis. Phys. A Stat. Mech. Its Appl. 2011, 390, 817–827. [Google Scholar] [CrossRef]
- Sensoy, A.; Tabak, B.M. Time-varying long term memory in the European Union stock markets. Phys. A Stat. Mech. Its Appl. 2015, 436, 147–158. [Google Scholar] [CrossRef]
- Gajardo, G.; Kristjanpoller, W. Asymmetric multifractal cross-correlations and time varying features between Latin-American stock market indices and crude oil market. Chaos Solitons Fractals 2017, 104, 121–128. [Google Scholar] [CrossRef]
- Aloui, C.; Shahzad, S.J.H.; Jammazi, R. Dynamic efficiency of European credit sectors: A rolling-window multifractal detrended fluctuation analysis. Phys. A Stat. Mech. Its Appl. 2018, 506, 337–349. [Google Scholar] [CrossRef]
- Fukuda, S.i. Abenomics: Why was it so successful in changing market expectations? J. Jpn. Int. Econ. 2015, 37, 1–20. [Google Scholar] [CrossRef]
- Kawamoto, T.; Nakazawa, T.; Kishaba, Y.; Matsumura, K.; Nakajima, J. Estimating the macroeconomic effects of Japan’s expansionary monetary policy under Quantitative and Qualitative Monetary Easing during 2013–2020. Econ. Anal. Policy 2023, 78, 208–224. [Google Scholar] [CrossRef]
- Hu, G.X.; Pan, J.; Wang, J. Chinese Capital Market: An Empirical Overview; NBER: Cambridge, MA, USA, 2018. [Google Scholar]
- Petry, J. Same same, but different: Varieties of capital markets, Chinese state capitalism and the global financial order. Compet. Change 2021, 25, 605–630. [Google Scholar] [CrossRef]
- Ahmed, W.M. Asymmetric impact of exchange rate changes on stock returns: Evidence of two de facto regimes. Rev. Account. Financ. 2020, 19, 147–173. [Google Scholar] [CrossRef]
- Kim, Y.; Jo, G.J. The impact of foreign investors on the stock price of Korean enterprises during the global financial crisis. Sustainability 2019, 11, 1576. [Google Scholar] [CrossRef]
- Kang, S.; Sul, W.; Kim, S. Impact of foreign institutional investors on dividend policy in Korea: A stock market perspective. J. Financ. Manag. Anal. 2010, 23, 10–26. [Google Scholar]
- Huang, R.D.; Shiu, C.Y. Local effects of foreign ownership in an emerging financial market: Evidence from qualified foreign institutional investors in Taiwan. Financ. Manag. 2009, 38, 567–602. [Google Scholar] [CrossRef]
- Nagpal, P. An empirical study on impact of flow of FDI & FII on Indian stock market. SSRN 2016, 3, 19–25. [Google Scholar]
- Meziani, A.S. Frontier Markets: Understanding the Risks. J. Beta Invest. Strateg. 2020, 11, 43–56. [Google Scholar] [CrossRef]
- Lim, K.P.; Brooks, R.D. The Evolving and Relative Efficiencies of Stock Markets: Empirical Evidence from Rolling Bicorrelation Test Statistics; SSRN: Rochester, NY, USA, 2006. [Google Scholar]
- Bouoiyour, J.; Selmi, R.; Wohar, M.E. Are Islamic stock markets efficient? A multifractal detrended fluctuation analysis. Financ. Res. Lett. 2018, 26, 100–105. [Google Scholar] [CrossRef]
- Mookerjee, R.; Yu, Q. An empirical analysis of the equity markets in China. Rev. Financ. Econ. 1999, 8, 41–60. [Google Scholar] [CrossRef]
- Islam, S.M.; Watanapalachaikul, S.; Clark, C. Some tests of the efficiency of the emerging financial markets: An analysis of the Thai stock market. J. Emerg. Mark. Financ. 2007, 6, 291–302. [Google Scholar] [CrossRef]
- Zunino, L.; Bariviera, A.F.; Guercio, M.B.; Martinez, L.B.; Rosso, O.A. On the efficiency of sovereign bond markets. Phys. A Stat. Mech. Its Appl. 2012, 391, 4342–4349. [Google Scholar] [CrossRef]
- Tongurai, J.; Vithessonthi, C. Financial Openness and Financial Market Development. J. Multinatl. Financ. Manag. 2023, 67, 100782. [Google Scholar] [CrossRef]
- Vo, X.V. Do foreign investors promote stock price efficiency in emerging markets? Int. Rev. Financ. 2019, 19, 223–235. [Google Scholar] [CrossRef]
- Rejeb, A.B.; Boughrara, A. Financial liberalization and stock markets efficiency: New evidence from emerging economies. Emerg. Mark. Rev. 2013, 17, 186–208. [Google Scholar] [CrossRef]
- Goodell, J.W.; Li, M.; Liu, D.; Peng, H. Depoliticization and market efficiency: Evidence from China. Financ. Res. Lett. 2022, 47, 102712. [Google Scholar] [CrossRef]


| Group | Country | Mean | Std.Dev. | Skew. | Kurt. | J.-B. |
|---|---|---|---|---|---|---|
| Developed | Austria | −0.0003 | 0.0286 | −2.23 | 23.97 | 34,312.3 |
| Australia | 0.0001 | 0.0181 | −1.37 | 14.29 | 12,225.4 | |
| Belgium | −0.0001 | 0.0227 | −2.49 | 33.61 | 66,593.6 | |
| Canada | 0.0003 | 0.0186 | −3.59 | 54.18 | 172,326.9 | |
| Switzerland | 0.0001 | 0.0178 | −0.89 | 8.43 | 4291.6 | |
| Germany | 0.0005 | 0.0236 | −1.46 | 13.40 | 10,865.4 | |
| Denmark | 0.0008 | 0.0207 | −1.45 | 17.40 | 17,969.6 | |
| Spain | −0.0004 | 0.0243 | −0.64 | 5.78 | 2030.5 | |
| Finland | 0.0001 | 0.0229 | −1.01 | 8.93 | 4844.8 | |
| France | 0.0001 | 0.0228 | −1.2 | 10.69 | 6959.5 | |
| United Kingdom | 0.0001 | 0.0193 | −1.54 | 19.23 | 21,893.2 | |
| Hong Kong | 0.0001 | 0.0250 | −0.33 | 7.19 | 3015.5 | |
| Ireland | −0.0002 | 0.0267 | −1.98 | 19.56 | 23,003.4 | |
| Israel | 0.0005 | 0.0182 | −1.35 | 11.96 | 8688.4 | |
| Italy | −0.0005 | 0.0262 | −0.99 | 7.53 | 3508.5 | |
| Japan | 0.0003 | 0.0234 | −1.13 | 11.26 | 7612.8 | |
| Netherlands | 0.0002 | 0.0223 | −2.58 | 33.46 | 66,148.6 | |
| Norway | 0.0004 | 0.0254 | −2.58 | 36.18 | 77,071.1 | |
| New Zealand | 0.0007 | 0.0135 | −1.35 | 17.00 | 17,098.1 | |
| Portugal | −0.0004 | 0.0230 | −0.90 | 7.33 | 3295.8 | |
| Sweden | 0.0005 | 0.0212 | −1.45 | 12.99 | 10,230.5 | |
| Singapore | 0.0001 | 0.0197 | −1.36 | 26.08 | 39,688.4 | |
| United States | 0.0007 | 0.0195 | −2.44 | 30.52 | 55,108.3 | |
| Emerging | Brazil | 0.0006 | 0.0275 | −1.35 | 16.90 | 16,904.2 |
| Chile | 0.0005 | 0.0208 | −1.51 | 21.89 | 28,191.9 | |
| China | 0.0010 | 0.0381 | −0.84 | 6.52 | 2622.6 | |
| Czech Republic | −0.0001 | 0.0225 | −2.11 | 24.99 | 37,082.7 | |
| Egypt | 0.0002 | 0.0285 | −0.85 | 9.12 | 4970.4 | |
| Greece | −0.0012 | 0.0352 | −0.56 | 5.68 | 1941.4 | |
| Indonesia | 0.0010 | 0.0225 | −1.31 | 19.56 | 22,467.4 | |
| India | 0.0010 | 0.0243 | −1.46 | 19.31 | 22,025.8 | |
| South Korea | 0.0004 | 0.0216 | −2.00 | 23.92 | 33,942.8 | |
| Mexico | 0.0004 | 0.0191 | −0.62 | 9.94 | 5792.5 | |
| Malaysia | 0.0002 | 0.0144 | −1.60 | 19.73 | 23,069.1 | |
| Peru | 0.0003 | 0.0277 | −1.07 | 20.70 | 25,000.7 | |
| Philippines | 0.0005 | 0.0231 | −1.83 | 30.66 | 55,014.2 | |
| Poland | −0.0004 | 0.0251 | −1.33 | 11.32 | 7812.2 | |
| Qatar | 0.0004 | 0.0229 | −0.10 | 12.68 | 9282.7 | |
| Saudi Arabia | 0.0003 | 0.0219 | −1.30 | 11.51 | 8030.4 | |
| Thailand | 0.0007 | 0.0209 | −1.87 | 24.35 | 35,040.5 | |
| Turkey | −0.0020 | 0.1294 | −34.34 | 1239.47 | 88,866,224 | |
| Taiwan | 0.0005 | 0.0219 | −1.00 | 13.11 | 10,152.5 | |
| U.A.E. | −0.0002 | 0.0286 | −0.91 | 19.27 | 21,636.1 | |
| South Africa | −0.0002 | 0.0371 | −1.29 | 24.93 | 36,242.1 | |
| Frontier | Bahrain | −0.0001 | 0.0103 | −1.06 | 9.22 | 5171.3 |
| Estonia | 0.0005 | 0.0196 | −1.32 | 18.41 | 19,949.7 | |
| Croatia | −0.0003 | 0.0196 | −1.19 | 23.81 | 33,047.3 | |
| Iceland | −0.0007 | 0.0433 | −25.71 | 818.68 | 38,803,863 | |
| Jordan | −0.0009 | 0.0236 | −4.71 | 103.63 | 624,502.1 | |
| Kenya | −0.0010 | 0.0181 | −1.39 | 17.91 | 18,944.9 | |
| Lithuania | 0.0004 | 0.0185 | −1.55 | 36.21 | 76,200.1 | |
| Morocco | 0.0001 | 0.0151 | −2.14 | 34.50 | 69,721.5 | |
| Mauritius | 0.0004 | 0.0149 | −2.33 | 66.04 | 252,860.5 | |
| Oman | −0.0002 | 0.0164 | −0.41 | 14.93 | 12,911.4 | |
| Romania | 0.0003 | 0.0254 | −1.41 | 14.45 | 12,514.1 | |
| Serbia | −0.0005 | 0.0234 | −0.92 | 28.09 | 45,734.8 | |
| Slovenia | −0.0002 | 0.0250 | −0.45 | 101.78 | 597,553.8 | |
| Tunisia | 0.0008 | 0.0102 | −1.82 | 22.05 | 28,837.1 | |
| Vietnam | 0.0002 | 0.0269 | 0.01 | 7.56 | 3302.1 |
| Developed | Emerging | Frontier | |||
|---|---|---|---|---|---|
| Country | Country | Country | |||
| Austria | 0.5278 | Brazil | 0.404 | Bahrain | 0.3762 |
| Australia | 0.4531 | Chile | 0.6333 | Estoina | 0.4434 |
| Belgium | 0.4315 | China | 0.4274 | Croatia | 0.4039 |
| Canada | 0.5514 | Czech Republic | 0.4204 | Iceland | 0.5567 |
| Switzerland | 0.4183 | Egypt | 0.4296 | Jordan | 0.7454 |
| Germany | 0.4921 | Greece | 0.5321 | Kenya | 0.6379 |
| Denmark | 0.3635 | Hungary | 0.6306 | Lithuania | 0.2978 |
| Spain | 0.5384 | Indonesia | 0.4228 | Morocco | 0.6059 |
| Finland | 0.3852 | India | 0.3645 | Mauritius | 0.6464 |
| France | 0.5453 | Korea | 0.3497 | Oman | 0.2073 |
| United Kingdom | 0.443 | Mexico | 0.3681 | Romania | 0.2951 |
| Hong Kong | 0.3024 | Malaysia | 0.3257 | Serbia | 0.2197 |
| Ireland | 0.3125 | Peru | 0.4241 | Slovenia | 0.2665 |
| Israel | 0.3101 | Philippines | 0.4638 | Tunisia | 0.5804 |
| Italy | 0.684 | Poland | 0.3303 | Vietnam | 0.3494 |
| Japan | 0.5402 | Qatar | 0.4415 | ||
| Netherlands | 0.3639 | Saudi Arabia | 0.5248 | ||
| Norway | 0.3343 | Thailand | 0.5434 | ||
| New Zealand | 0.5209 | Turkey | 1.0386 | ||
| Portugal | 0.4261 | Taiwan | 0.1773 | ||
| Sweden | 0.4222 | United Arab Emirates | 0.3078 | ||
| Singapore | 0.3291 | South Africa | 0.3442 | ||
| United States | 0.4544 | ||||
Disclaimer/Publisher’s Note: The statements, opinions and data contained in all publications are solely those of the individual author(s) and contributor(s) and not of MDPI and/or the editor(s). MDPI and/or the editor(s) disclaim responsibility for any injury to people or property resulting from any ideas, methods, instructions or products referred to in the content. |
© 2023 by the authors. Licensee MDPI, Basel, Switzerland. This article is an open access article distributed under the terms and conditions of the Creative Commons Attribution (CC BY) license (https://creativecommons.org/licenses/by/4.0/).
Share and Cite
Lee, M.-J.; Choi, S.-Y. Comparing Market Efficiency in Developed, Emerging, and Frontier Equity Markets: A Multifractal Detrended Fluctuation Analysis. Fractal Fract. 2023, 7, 478. https://doi.org/10.3390/fractalfract7060478
Lee M-J, Choi S-Y. Comparing Market Efficiency in Developed, Emerging, and Frontier Equity Markets: A Multifractal Detrended Fluctuation Analysis. Fractal and Fractional. 2023; 7(6):478. https://doi.org/10.3390/fractalfract7060478
Chicago/Turabian StyleLee, Min-Jae, and Sun-Yong Choi. 2023. "Comparing Market Efficiency in Developed, Emerging, and Frontier Equity Markets: A Multifractal Detrended Fluctuation Analysis" Fractal and Fractional 7, no. 6: 478. https://doi.org/10.3390/fractalfract7060478
APA StyleLee, M.-J., & Choi, S.-Y. (2023). Comparing Market Efficiency in Developed, Emerging, and Frontier Equity Markets: A Multifractal Detrended Fluctuation Analysis. Fractal and Fractional, 7(6), 478. https://doi.org/10.3390/fractalfract7060478