Article

Investigation of Fractal Characteristics of Karman Vortex for NACA0009 Hydrofoil

1
College of Water Resources and Civil Engineering, China Agricultural University, Beijing 100083, China
2
College of Engineering, China Agricultural University, Beijing 100083, China
3
Beijing Engineering Research Center of Safety and Energy Saving Technology for Water Supply Network System, China Agricultural University, Beijing 100083, China
4
State Key Laboratory of Hydroscience and Engineering, Tsinghua University, Beijing 100084, China
*
Author to whom correspondence should be addressed.
Fractal Fract. 2023, 7(6), 467; https://doi.org/10.3390/fractalfract7060467
Submission received: 3 May 2023 / Revised: 1 June 2023 / Accepted: 8 June 2023 / Published: 10 June 2023
(This article belongs to the Special Issue Turbulence Structure and Fractal Characteristics in Turbomachinery)

Abstract

:
A Karman vortex is a phenomenon of fluid flow that can cause fluctuation and vibration. As a result, it leads to fatigue damage to structures and induces safety accidents. Therefore, the analysis of the shedding law and strength of the Karman vortex is significant. To further understand the laws of turbulent Karman vortex shedding and strength, this study conducts a numerical vorticity simulation of a Karman vortex at the trailing edge of a hydrofoil based on the two-dimensional simplified model of the NACA0009 hydrofoil under different Reynolds numbers. Combined with image segmentation technology, the fractal characteristics of a turbulent Karman vortex at the trailing edge of a hydrofoil are extracted, the number and total area of vortex cores are calculated, and the fractal dimension of the vortex is obtained. The results show that the fractal dimension can characterize the change in vortex shape and strength under different Reynolds numbers, and that the fractal analysis method is feasible and effective for the shedding analysis of a turbulent Karman vortex.

1. Introduction

With the depletion of renewable energy sources in the world, the International Energy Agency has released the ‘2050 Net Zero Emissions Roadmap for the Global Energy Industry’, which sets requirements for the global use of clean, green, and renewable energy. Among the many renewable energy sources, such as wind energy, solar energy, hydropower, and tidal energy, hydraulic energy is widely used as a clean and pollution-free form of energy with a high conversion rate, abundant reserves, and high stability, while water conservancy projects are being built around the world and hydropower stations are thriving worldwide [1,2,3].
However, with the rapid advancement and development of the hydropower industry, abnormal vibration and noise problems caused by Karman vortices in hydraulic turbines have repeatedly appeared [4]. Although industry scholars have gradually mastered the causes of various hydraulic-induced vibrations in hydraulic turbine generator sets, and have effectively solved most hydraulic vibration problems through effective hydraulic design, a high-precision manufacturing industry, and high-level installation technology, there is little research on the vibration mechanism of hydraulic turbines induced by Karman vortices [5].
When the fluid bypasses the solid, the object wake produces symmetrical vortices in pairs, alternating the arrangement and rotation direction between the left and right. Based on this phenomenon, the theoretical basis for the stability of this vortex was proposed by Von Karman from the view of aerodynamics. Therefore, this type of vortex is also called a Karman vortex in the theoretical study of fluid mechanics [6,7]. When the Karman vortex appears, the water flow will generate a periodic transverse alternating force on the object. If the frequency of the force is similar to the natural frequency of the fluid around it, it may cause resonance [8]. In a hydraulic turbine, when water flows around hydrofoils such as stay vanes and runner blades, a detachment vortex train will be generated near the outlet of the vanes or runner blades, which is a Karman vortex [9]. Karman vortex resonance has an astonishing destructive power, which can cause high-frequency dynamic stress in flow components due to a dynamic stress response, leading to severe fatigue failure of the flow components in a short period of time [10]. Scholars have also conducted in-depth research on issues related to Karman vortex resonance. Hernandez et al. [11] conducted an experimental study on a flexible plate immersed in a von Kamen vortex street, and found that the ratio of the length of the plate to the resonant wake wavelength was fixed. Ausoni et al. [12] studied the shedding process of a Karman vortex at the trailing edge of two-dimensional hydrofoil with a high Reynolds number, and studied the influence of cavitation and fluid–solid interaction on the generation mechanism of the vortex. However, practice has shown that the frequency of the Karman vortex is difficult to accurately calculate during the design phase due to the complexity of boundary conditions, and the resonance problem of the Karman vortex cannot be completely avoided in the field of electromechanical design and manufacturing [13,14,15]. The harm caused by unit vibration is obvious to all, and includes major accidents caused by unit vibration at the Sayan-Shushensk hydropower station in Russia, noise caused by Karman vortex resonance at power stations around the world, and blade fatigue damage, which are common problems [16,17]. Ultimately, the inability to completely avoid the resonance problem caused by the Karman vortex is due to a lack of understanding of the mechanism of the Karman vortex. Studying its failure mechanism and developing more rigorous, effective, and reliable elimination measures are of great significance for improving the safe and stable operation of hydropower stations.
In traditional research, the understanding of Karman vortices is mainly based on research on vortex identification, vortex strength, vortex visualization, and other aspects [18]. For the study of Karman vortices, most scholars use numerical simulation and fractal processing methods to study the simulation results. Liu et al. [19] used the ratio of the squared vorticity to the sum of the squared deformation to measure relative rotational strength. By defining the net spin tensor and net vorticity vector, an objective approach was proposed, the ω vortex identification method. Xu et al. [20] extracted vortex core lines from well-defined Liutex and used computer automatic generation and large-scale visualization for the first time. Deng et al. [21] proposed a novel eddy current identification method based on convolutional neural networks; the method combines the advantages of local and global eddy current identification methods, achieving higher accuracy and an efficient recall rate. In the field of image recognition, the quantitative description of vortices through their edge lines requires the processing of their two-dimensional images. Image segmentation can divide an image into many non-overlapping subregions, each of which is a continuous set of pixels and has its own characteristics. Its features can be the color, shape, grayscale, or texture of the image. That is to say, an image can be represented as a set of physically meaningful connected regions through image segmentation. This method can extract the features of eddy currents on a two-dimensional cross-section [22,23]. Del-Pozo-Velazquez et al. [24] processed high-resolution satellite images based on image segmentation, quadtree algorithm and fractal dimension method to detect surface water. Ma et al. [25] proposed a segmentation method of mouse cortical synaptic fissure on an EM image stack based on the fractal dimension. Zhuang et al. [26] proposed a fractal dimension image segmentation technology combining fuzzy enhancement technology and the fractional Brownian motion model. The application of fractal analysis in other fields has been very advanced, but there is almost no combination in vortex analysis. Therefore, the combination of fractal dimension and Karman vortex research can enable us to further understand the shedding law and strength law of the Karman vortex, which is of reference significance for the study of noise vibration and blade fatigue damage caused by the Karman vortex resonance of hydraulic turbine units. Extracting information from simulation results using image segmentation technology is more comprehensive than directly reading the information from simulation results images, which can further explore the content at the mechanism level.
In this study, the NACA0009 hydrofoil is taken as a simplified model, and based on the visualization results of the combination of steady and transient numerical simulation, the visualization characteristics of the turbulent Karman vortex intensity at the trailing edge of the hydrofoil with different Reynolds numbers are obtained. The fractal characteristics of the turbulent Karman vortex can be extracted by image segmentation technology, and fractal dimension, the number of vortex cores and the total area of vortex cores are calculated. This study describes the shedding characteristics of the Karman vortex in a simplified and new way, which can be applied to hydraulic machinery such as water turbines to help determine the strength and shedding characteristics of the Karman vortex in the unit. It has reference significance for the study of the Karman vortex in hydraulic turbines and other related research.

2. Research Objective

This research mainly studied a two-dimensional planar model of the NACA0009 hydrofoil. This is a foil that moves in water and generates lift during movement. The initial chord length (c0) of the NACA0009 hydrofoil is 110 mm, and the variation pattern of hydrofoil thickness (b) with chord length (c0) is shown by Equation (1), where the ratio of the flow direction coordinate (X) to the hydrofoil chord length (x/c) represents the position of different flow direction planes. The two-dimensional hydrofoil studied in this research is a two-dimensional planar hydrofoil truncated at c = 100 mm.
{ 0 x c 0 0.5 b c 0 = 0.1737 ( x c 0 ) 0.5 0.2422 ( x c 0 ) + 0.3046 ( x c 0 ) 2 0.2657 ( x c 0 ) 3 0.5 x c 0 1.0 b c 0 = 0.0004 + 0.1737 ( 1 x c 0 ) 0.1898 ( 1 x c 0 ) 2 + 0.0387 ( 1 x c 0 ) 3
As shown in Figure 1, the inlet to outlet length of the fluid domain is 750 mm, and the height of the two-dimensional fluid domain is 150 mm. The maximum thickness, bmax, of the hydrofoil is 9.9 mm. An X-Y Cartesian coordinate system coordinate system is established with the midpoint of the hydrofoil inlet side as the coordinate origin. The flow direction is along the +X direction, and the midpoint of the maximum thickness section line of the hydrofoil is located at Y = 0. The experiment plotting reference lines are shown in the figure as well, where hTE is the height of the trailing edge of the NACA0009 hydrofoil. The length of three plotting reference lines is 3hTE, and the distance of every two lines is hTE.
A Reynolds number, Re, is a dimensionless number; it is used to characterize fluid flow, and it can be calculated using Equation (2):
R e = ρ v L μ
where ρ is fluid density, μ is fluid viscosity, v is the characteristic velocity of the fluid domain and L is the characteristic length of the fluid domain. The research results for this fluid domain are meaningful.
Based on this dimensionless number, this study will study the fractal characteristics of the turbulent Karman vortex at the trailing edge of the hydrofoil at different Reynolds numbers, and summarize its laws.

3. Numerical Simulation and Experiment

3.1. Turbulence Model

The numerical simulation of this research is based on the commercial software ANSYS CFX turbulence solver. In the process of numerical simulation calculation, the selection of turbulence models is related to the accuracy and convergence of the calculation results. Comparing RNG k-ε, SST k-ω, RSM, LES, and other turbulence models, the SST k-ω turbulence model can accurately predict the beginning of flow and flow separation under a negative pressure gradient because it considers the transmission of turbulent shear stress, and has high calculation accuracy for free shear turbulence, attached boundary layer turbulence and moderately separated turbulence. Compared to other turbulence models, the SST k-ω model not only enhances the wall function, but also avoids the grid density near the wall, which makes the solution result not too sensitive to the wall grid, which makes it highly inclusive and have good convergence and a certain degree of robustness in the whole turbulent solution process [27]. Based on the high requirements for wall mesh and solution accuracy in the numerical simulation of the hydrofoil model, this study selects the SST k-ω model to serve as a turbulence prediction model, where Equation (3) is the kinetic energy equation and Equation (4) is the dissipation rate transport equation of the SST k-ω turbulence model:
( ρ k ) t + ( ρ k u i ) x i = P ˜ k β * ρ ω k + x i ( ( μ + σ k μ t ) k x i )
( ρ ω ) t + ( ρ ω u i ) x i = α ρ S 2 β ρ ω 2 + x i ( ( μ + σ ω μ t ) ω x j ) + 2 ( 1 F 1 ) ρ σ ω 2 1 ω k x i ω x i
where Pk is the production term of turbulent kinetic energy, S is the invariant measure of the strain rate, μ is the dynamic viscosity, F1 is the blending function, μt is the turbulent eddy viscosity, and β, β*, σk, and σω are constants of the turbulence model.

3.2. CFD Setup

According to the turbulence settings, the fluid domain is discretized by using a structured grid, which is shown in Figure 2. The mesh scheme used for numerical simulation adopts a hexahedral structured grid with an element number of 1632026. Quality inspection and refinement of near-wall grids at the boundary layer were carried out. When the Reynolds number is greater than 3.5 × 10⁶, the turbulent Karman vortex will appear [28]. Therefore, in the simulation, the setting of the Reynolds number, Re, ranged from 7.5 × 10⁶ to 7.5 × 10⁷, and the incidence angle was 0 degrees. The boundary conditions were set as follows, The velocity inlet boundary was set at the inlet of the fluid domain. The inlet was a velocity-type boundary, the velocity values were set according to the calculation conditions, and the pressure at the inlet followed the Neumann condition. Then, the outlet was the pressure-type boundary, and the pressure value was set to 0 Pa. Additionally, the velocity followed the Neumann condition. In addition, we set all walls as no-slip walls. Furthermore, in order to simplify the 3D model into 2D, a symmetric boundary perpendicular to the 2D domain was provided. The fluid medium was water, with a temperature of 20°, a density of 1 × 10³ kg/m3, and a dynamic viscosity of 1.01 × 10⁻³ Pa·s. The number of maximum iteration steps for steady simulation was set to 1000, and the convergence criteria for the momentum equation and continuity equation were both 10−5. In order to achieve better convergence performance and temporal flow resolution, transient simulations were conducted using the results of steady simulations as initial conditions. The total time of transient simulation was 0.1 s and every time step was 1 × 10⁻⁵ s. The calculation results indicate that this setting is reasonable.

3.3. Experimental Validation

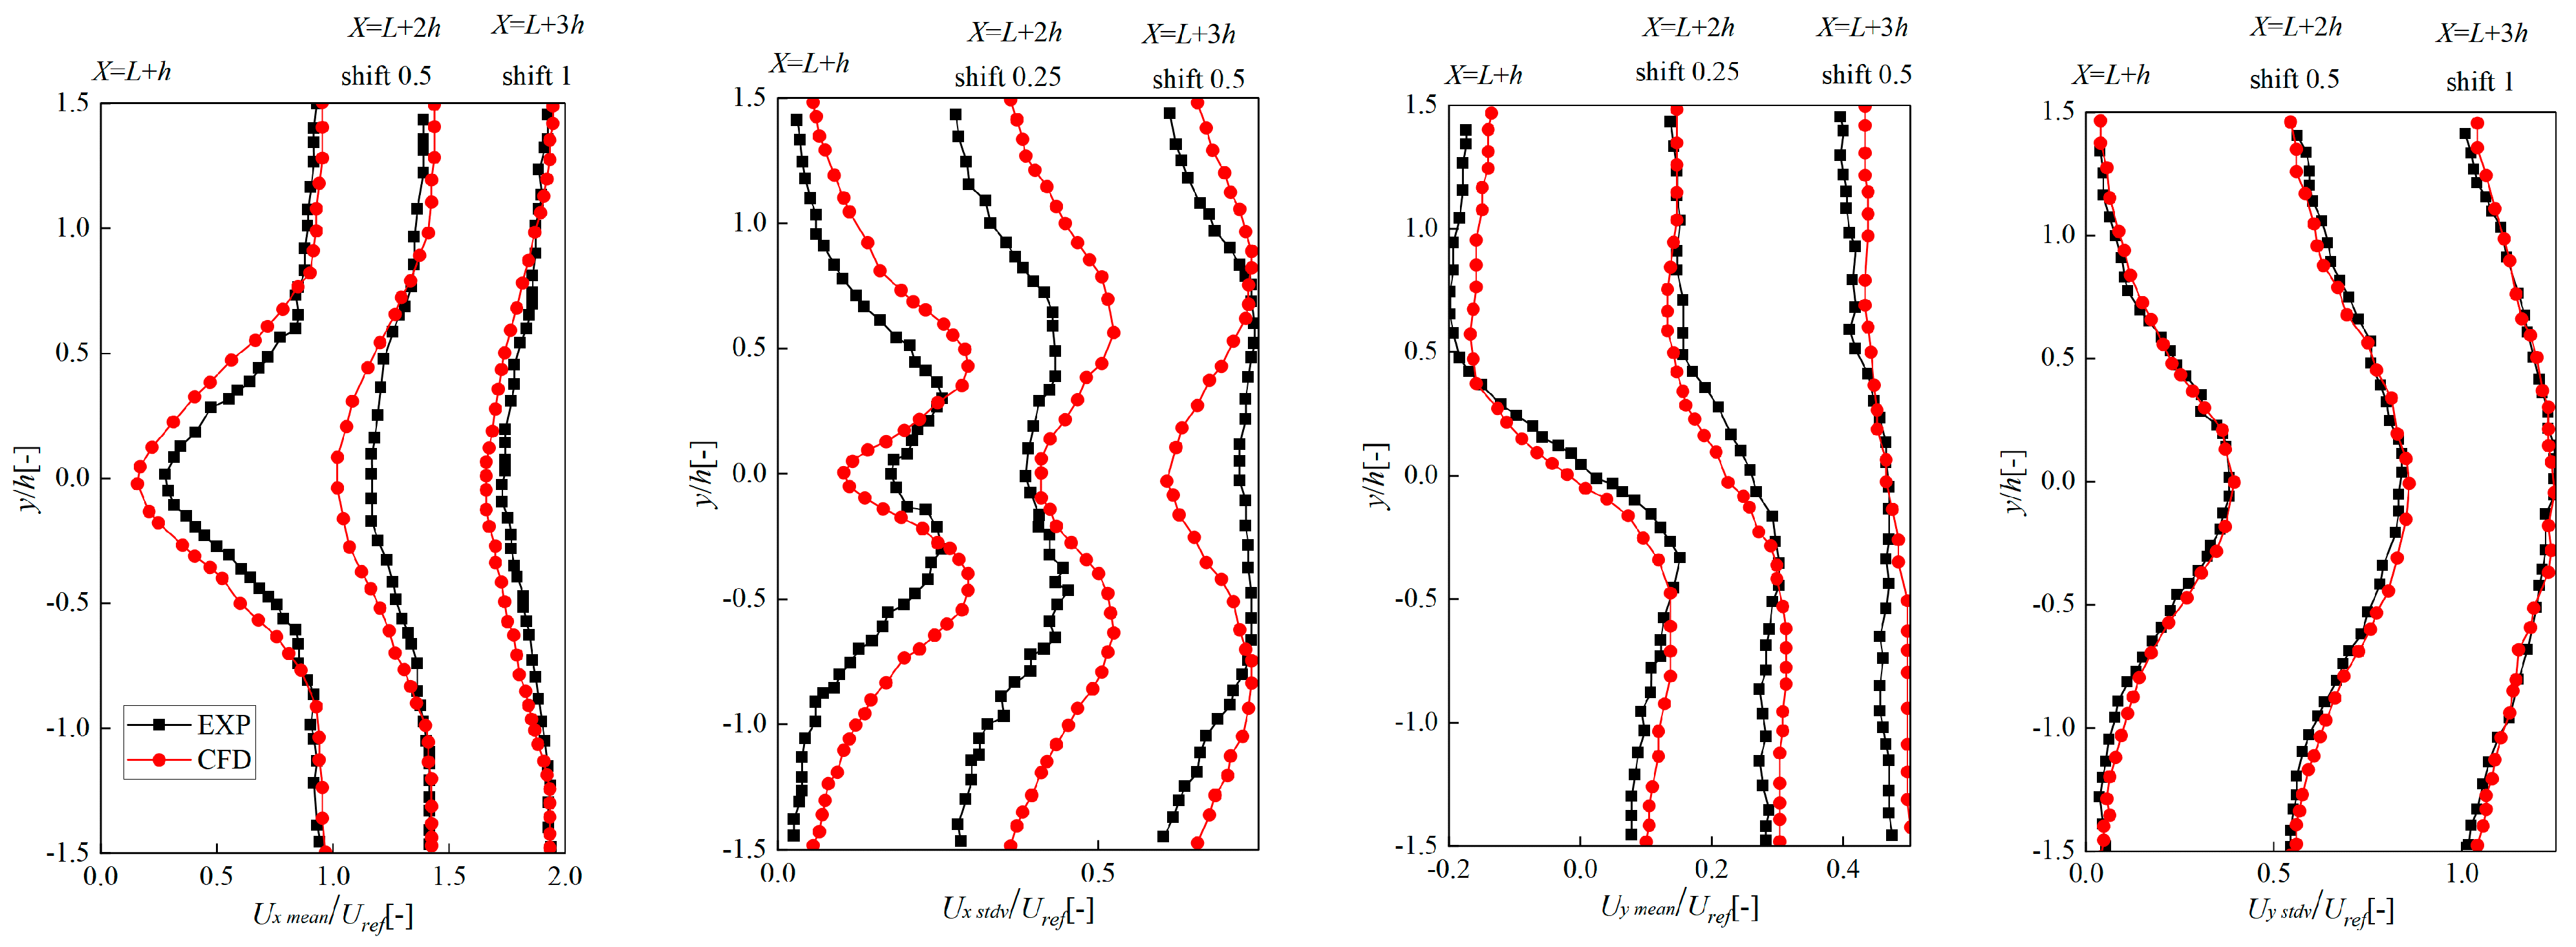
To verify the CFD simulation results, the velocity distribution simulated at the inflow velocity of 20 m/s was compared with that of the experiment [29]. When comparing, we considered the mean component and the pulsing component as follows:
u m e a n = 1 N i = 1 N u i
u p u l = 1 N i = 1 N ( u i u m e a n ) 2
where ui is the transient velocity; umean is the time-averaged velocity; upul is the root mean square of the velocity component; and N represents the number.
Figure 3 shows the mean component and the pulsing component of the X-direction (along the flow) and Y-direction (perpendicular to X) velocities on the reference lines (shown in Figure 1). The reference velocity, uref, is the inflow velocity of 20 m/s. It can be seen that the velocity distribution predicted via CFD is well-matched with the measured value in every velocity direction, which proves that the visualization information of the fluid domain simulated via CFD is more realistic and reliable. Based on the reliable simulation setups, the research on the fractal characteristics of the turbulent Karman vortex for the NACA0009 hydrofoil under different Reynolds numbers will be discussed in detail.

4. Fractal Dimension

For any geometric shape, size is one of the most important parameters that describe its features. In the collision between geometry and topology, the idea of fractal geometry was born. In Euclidean geometry, fractal dimension is the most important parameter for describing fractals. In Euclidean geometry, straight lines or curves are one-dimensional, planes or spheres are two-dimensional, and shapes with length, width, and height are three-dimensional [30,31]. The complexity of fractals such as coastlines, Koch curves, and the Sierpinski sponge cannot be described with numerical values such as dimensions equal to 1, 2, and 3. For example, the first transformation of the Koch curve replaces each side of one foot with three segments, each 4 inches long, resulting in a total length of 3 × 4 × 4/3 = 16 inches; each transformation causes the total length to be multiplied by 4/3, and if it continues indefinitely, the curve itself will be infinitely long. This is a continuous loop that never intersects with itself. The area of enclosure by the loop is smaller than the area of its circumscribed circle. Therefore, the Koch curve with its infinite length squeezed within a finite area, does occupy space. It is more than a one-dimensional graph, but less than a two-dimensional graph, which means its dimensions are between one and two, and the dimension is a fraction [32].
Measuring it on a non-integer scale can accurately reflect its irregularity and complexity. The dimension of this non-integer value is called the fractal dimension in fractal geometry. In general, the fractal dimension of the fractal curve is between one and two. The larger the fractal dimension, the more complex the curve.
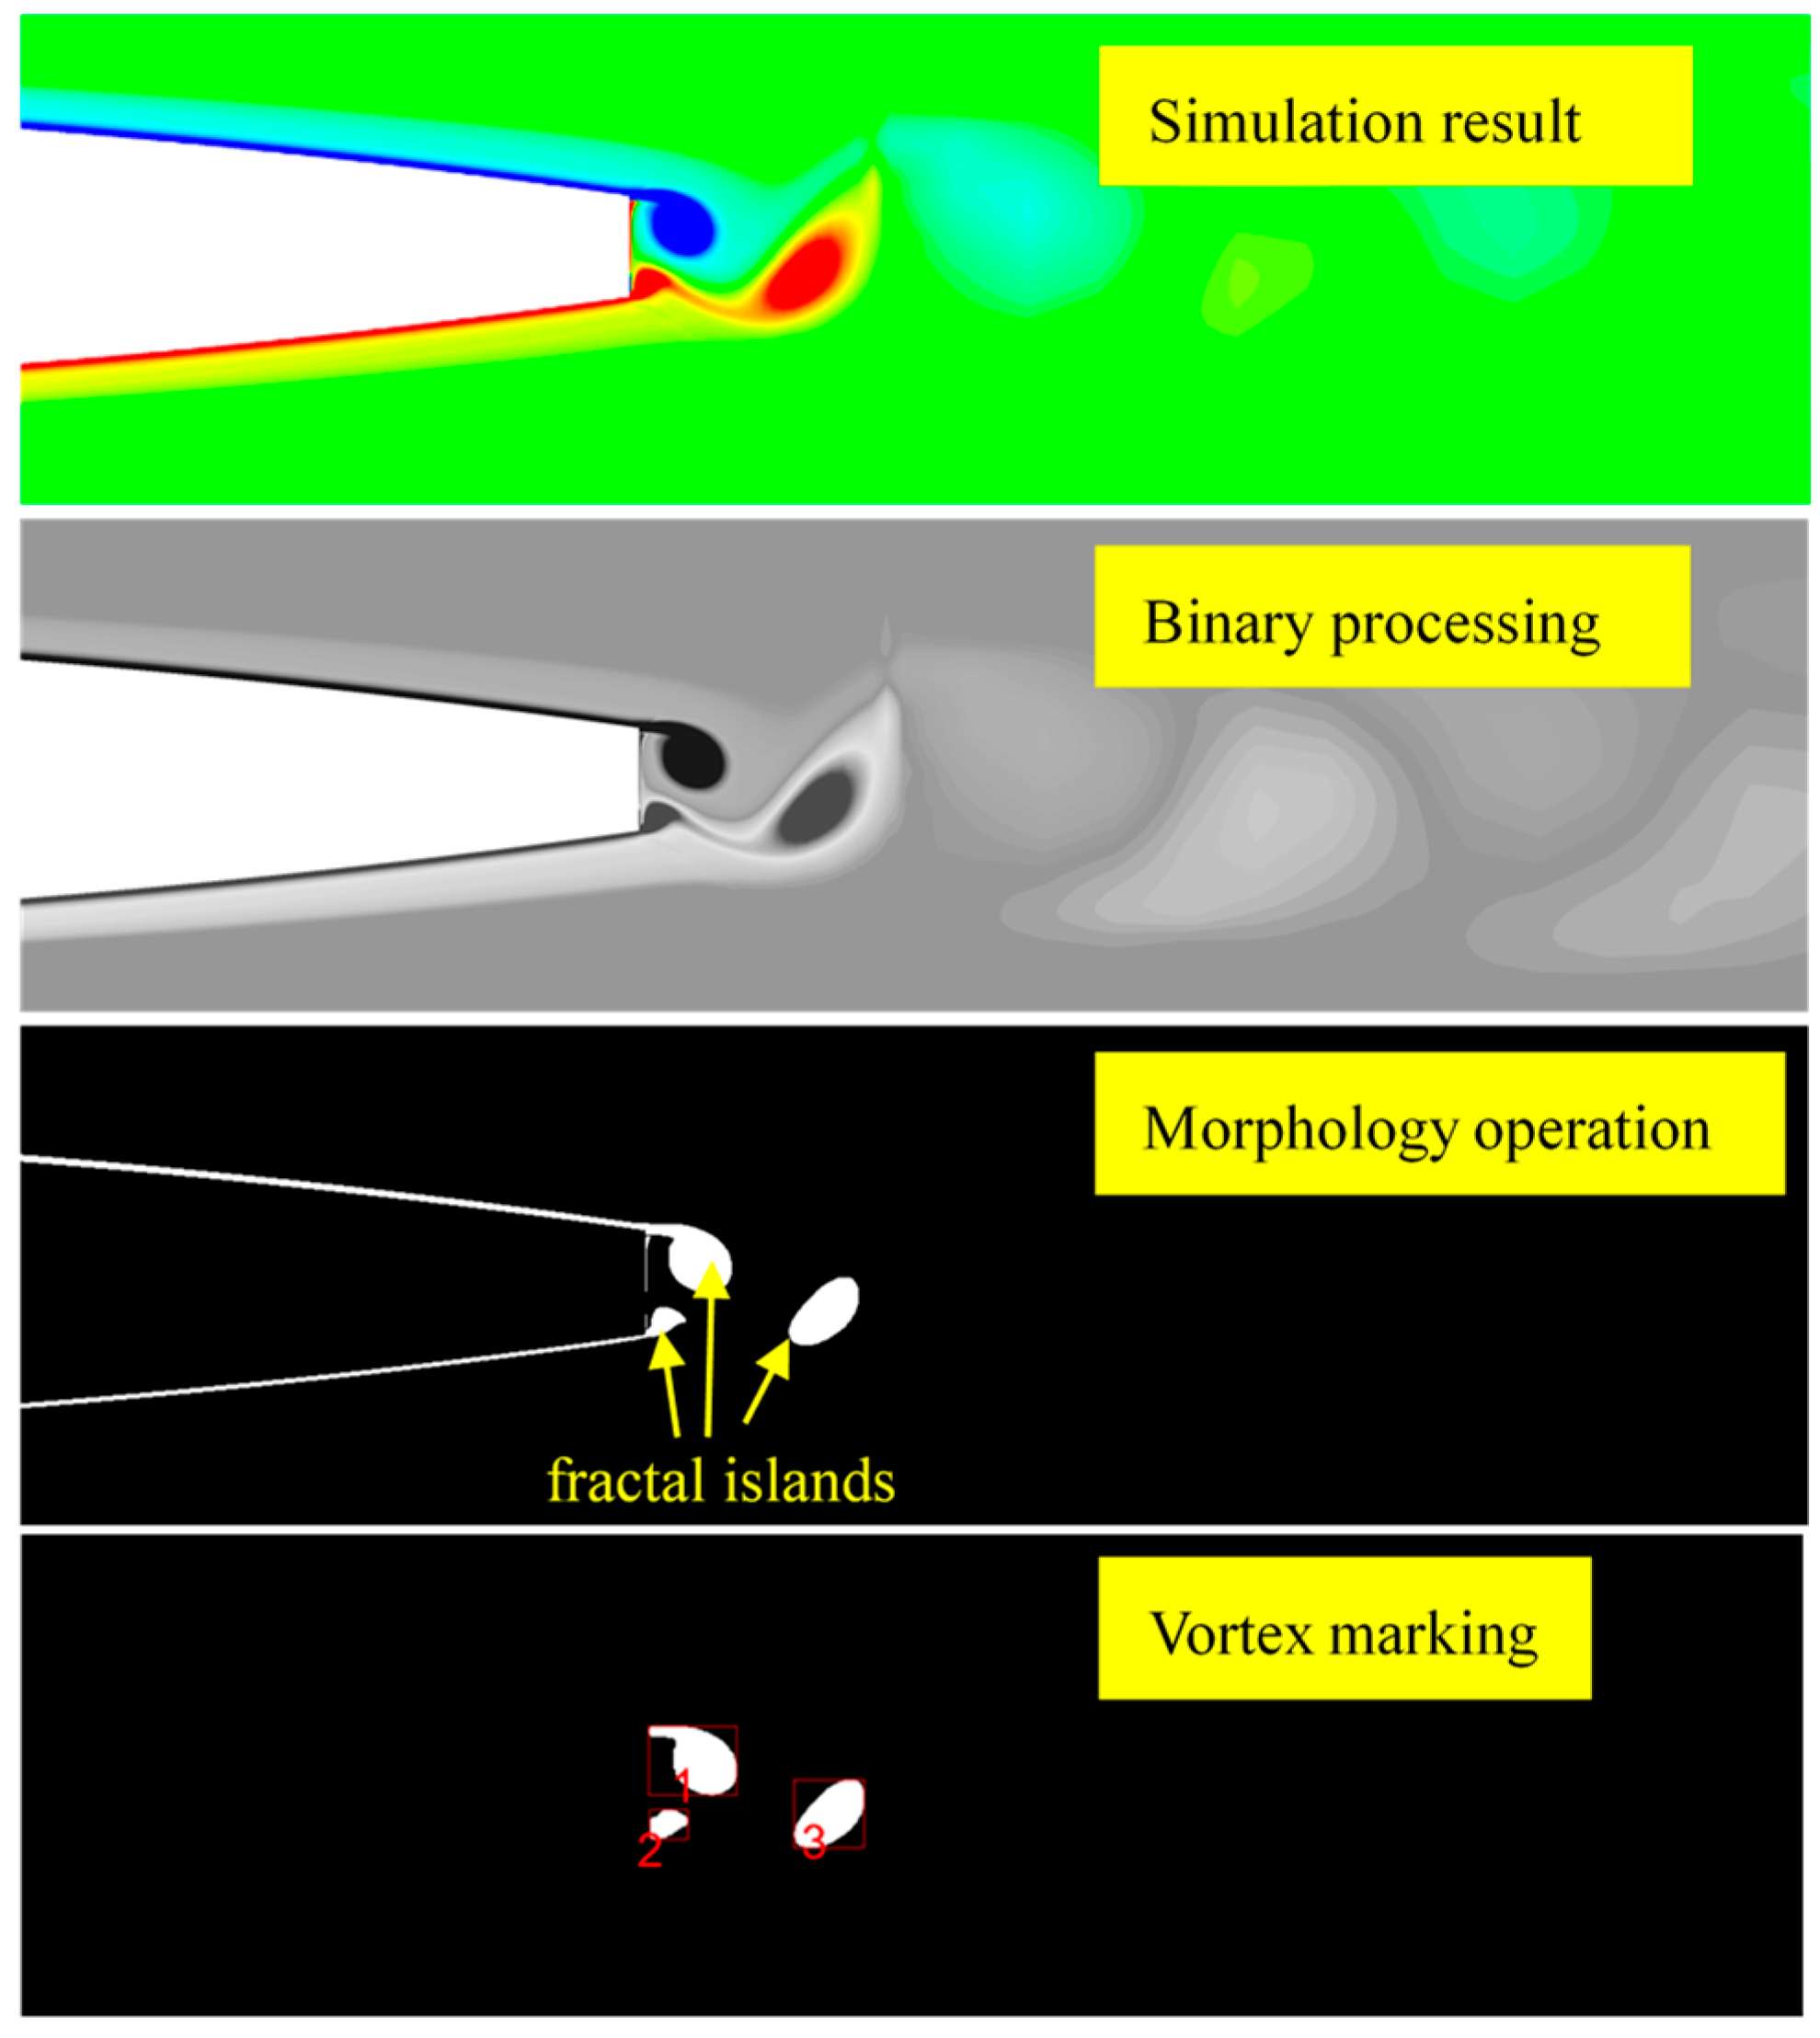
In fractal geometry, the calculation methods of fractal dimension are abundant, and include the classical methods: self-similarity dimension and box number dimension. Additionally, classic methods such as the root mean square method, and area perimeter method have been developed. Figure 4 is the fractal research process of vortex shedding at the trailing edge of the hydrofoil, and the four steps are as follows: obtaining simulation results, binary processing, morphology operation and vortex marking. In the morphology operation process, irregular island shapes often appear, which are called fractal islands. The shedding Karman vortex often appears in a circular or near-circular shape, and this type of fractal island shape is suitable for calculating the fractal dimension of the vortex using the area perimeter method. Based on this feature analysis, the area perimeter method is used to analyze the fractal characteristics of a turbulent Karman vortex at the trailing edge of the hydrofoil in this study.
The fractal dimension of perimeter is obtained from the relationship between the perimeter and area of a fractal island, and the relation can be expressed by Equation (7) [22]:
P = k S D 2
where P is the perimeter, S is the area, D is the fractal dimension of the outer edge, and k is the scale constant.
The perimeter of each island is measured separately. For each island, the fractal dimension of perimeter is expressed by Equation (8):
D = 2 log P log S
In this study, the correlation between vortices of different scales could be expressed by the fractal dimension, and the shedding law and strength of the Karman vortex at the trailing edge of hydrofoil were discussed.

5. Research Results and Analysis

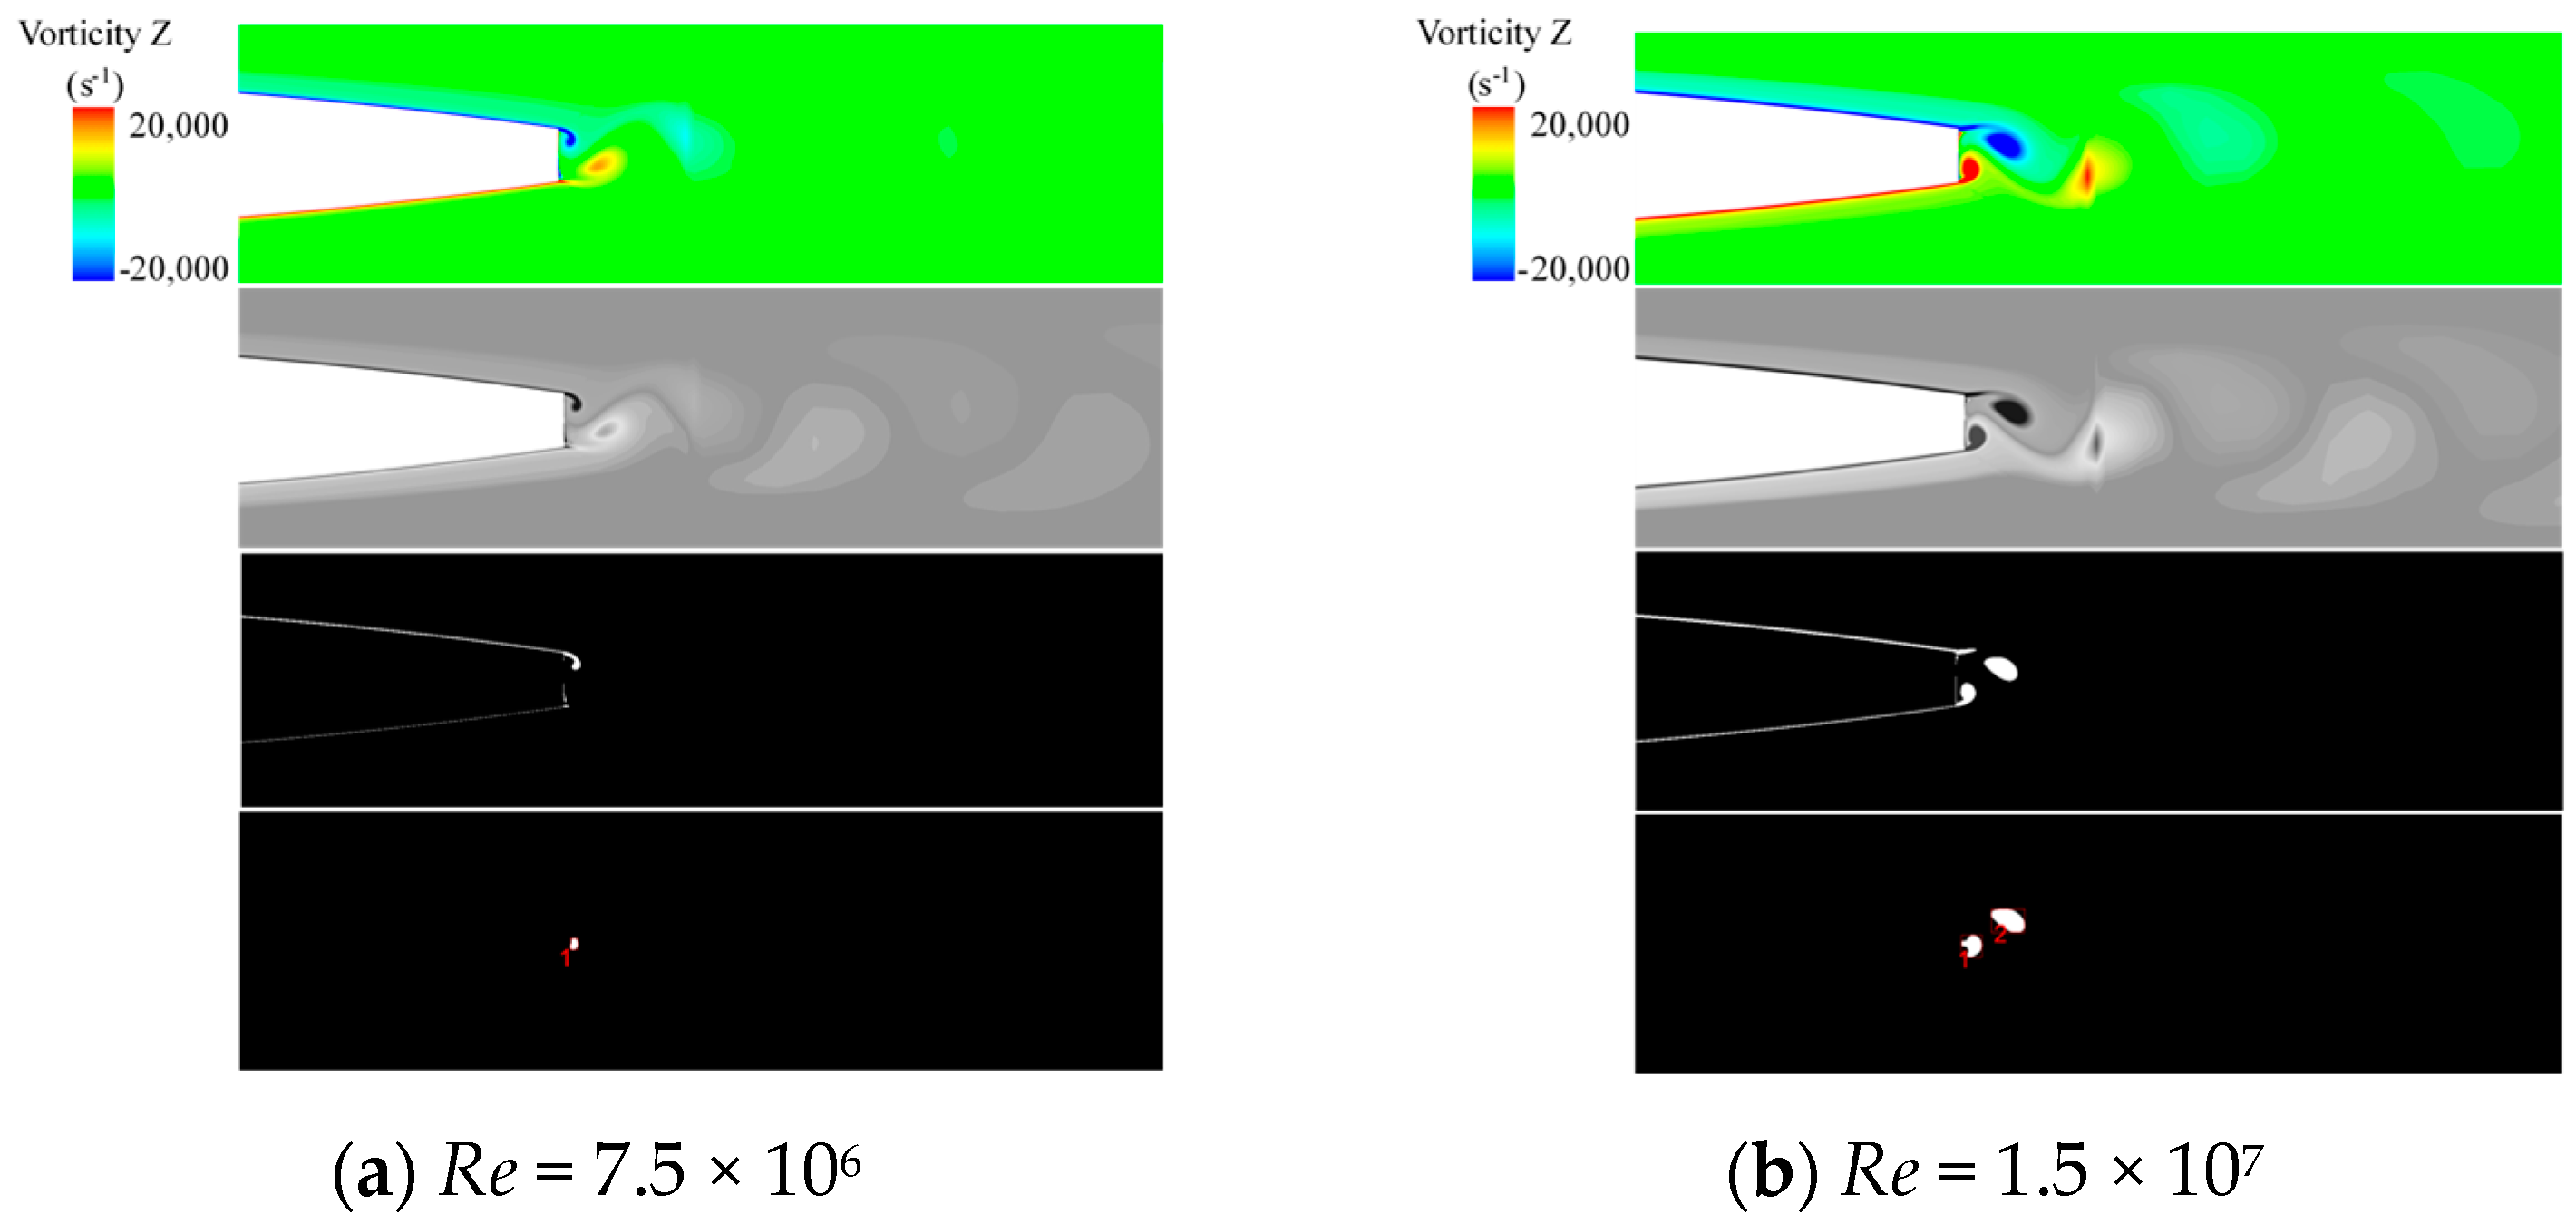
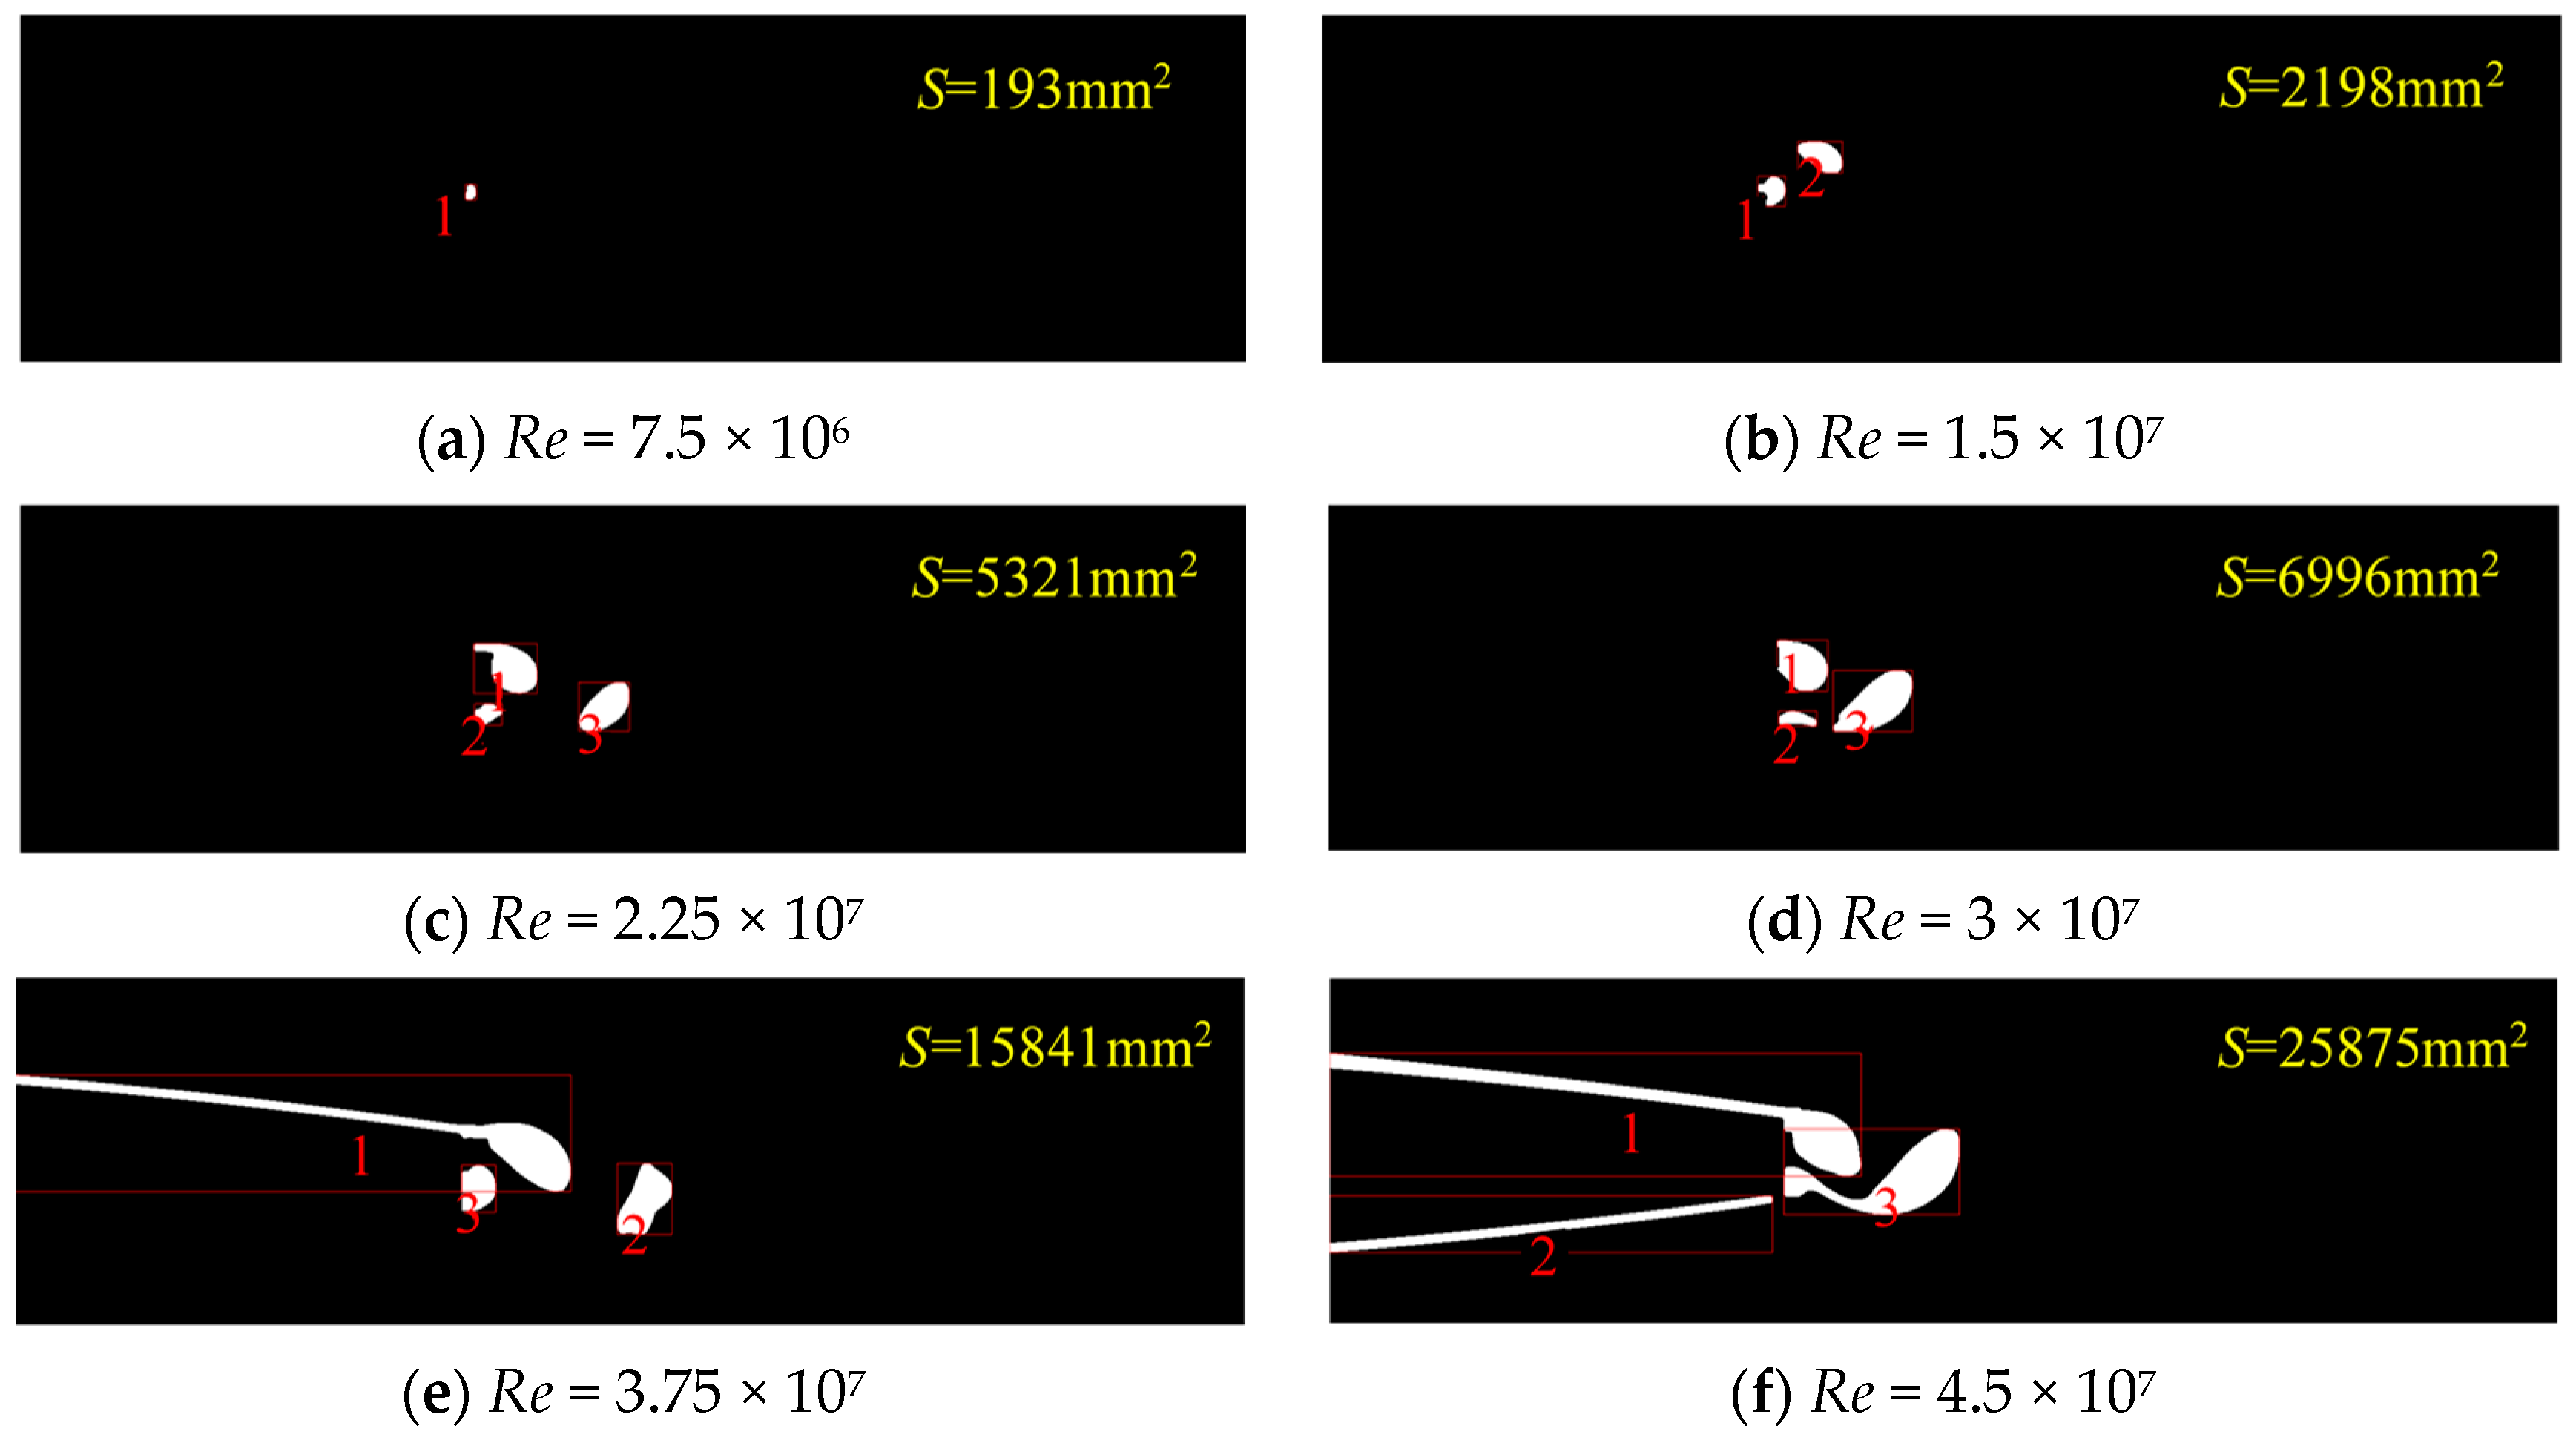
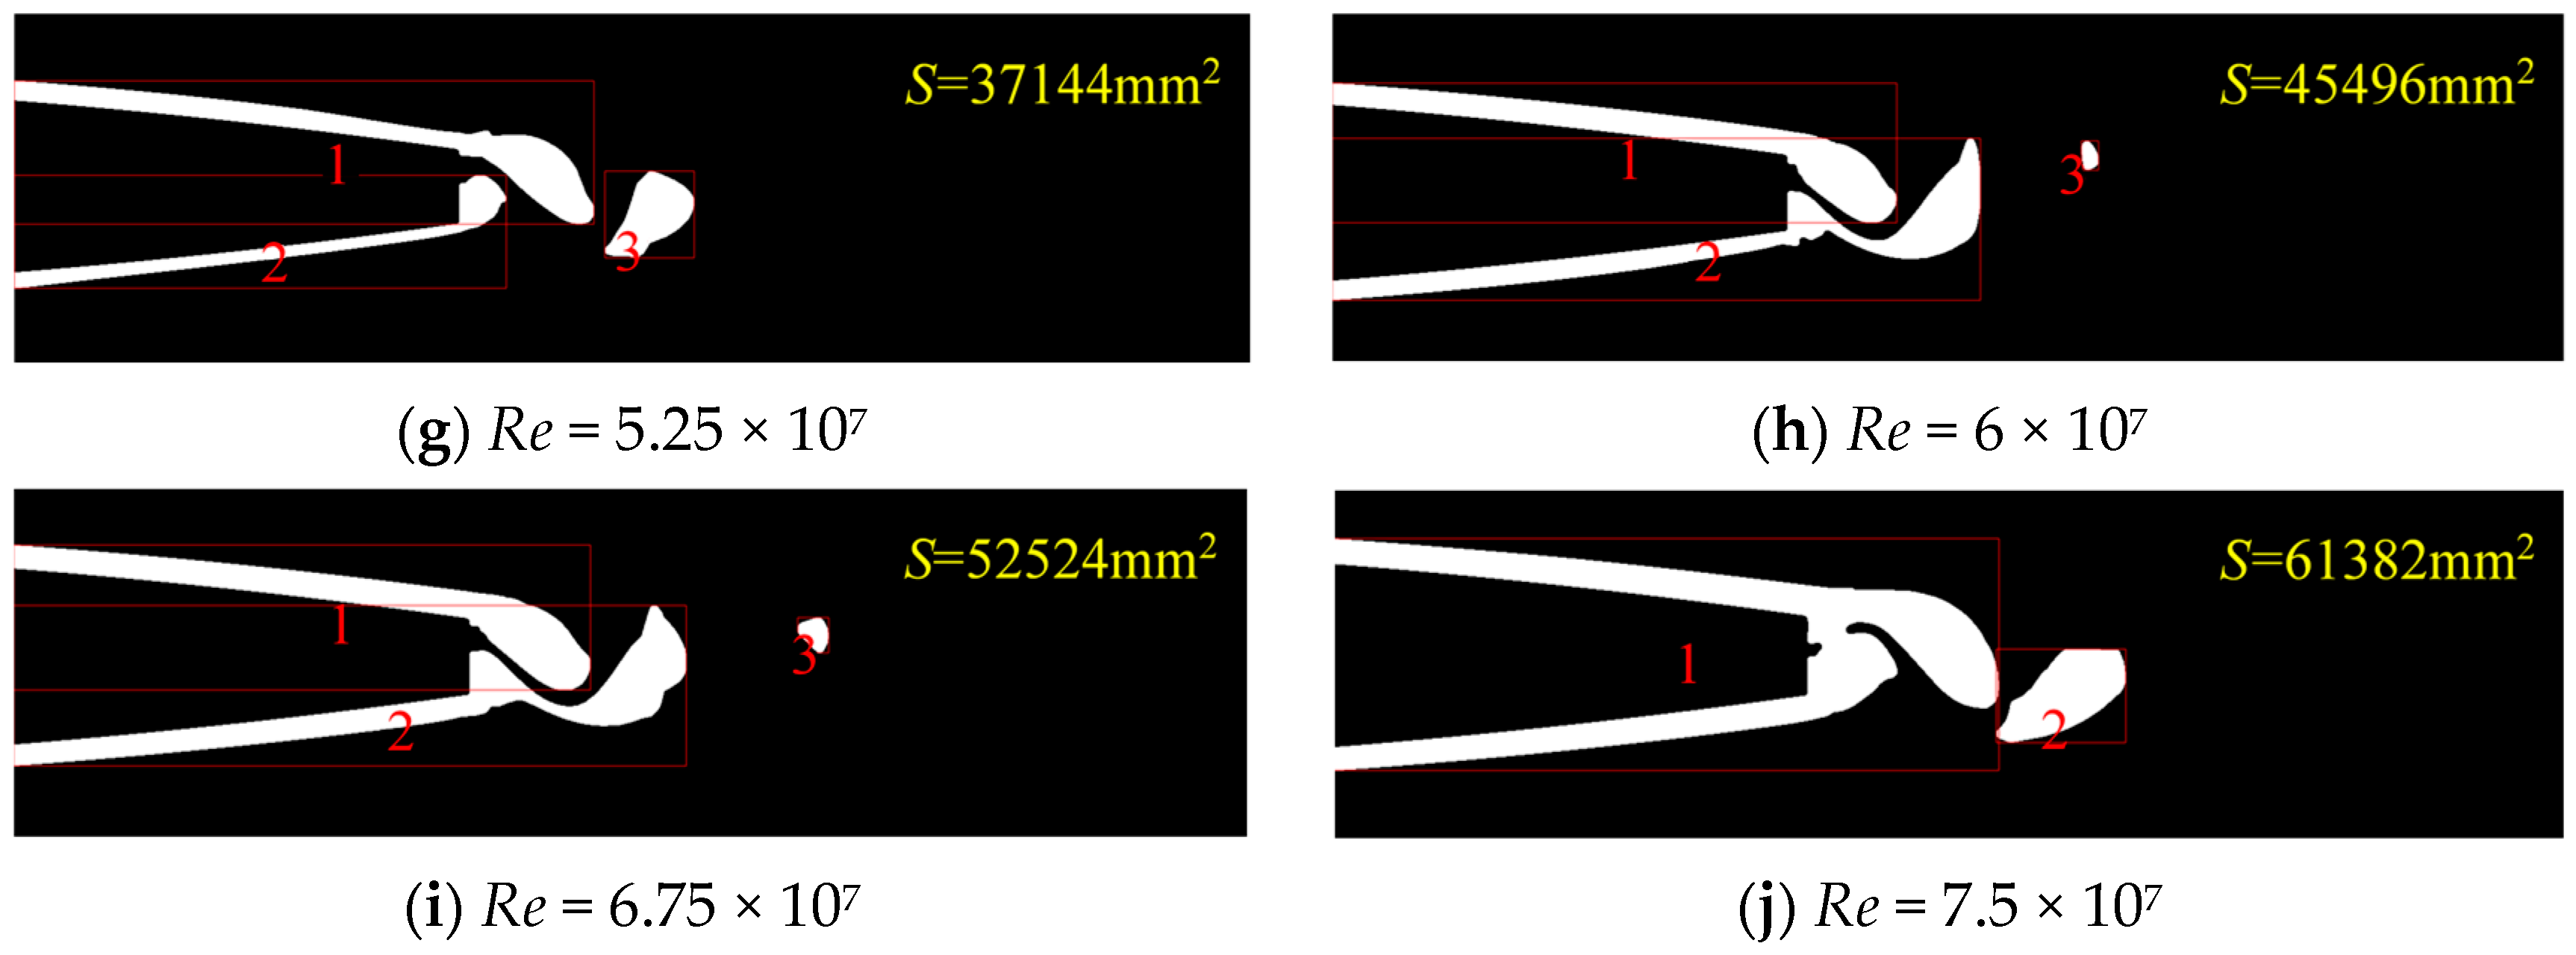
As shown in Figure 5, in the process of extracting the fractal features of vortex shedding at the trailing edge of the hydrofoil, the first step is to obtain the vortex contours of the trailing edge of the hydrofoil which is colored by the vorticity in the Z direction. The second step is binary processing, in which the vortex contour on the cross-section is binary coded, and the grayscale value of every point of the image is set as 0 or 255. The third step is morphological operation; this process is performed to eliminate small vortex structures, but the shape and position of main vortex should be kept unchanged. The last step is vortex marking; the vortex cores are marked with red numbers in each part of the image, and the perimeter and area of each vortex core are calculated, so as to prepare for the subsequent calculation and analysis of the fractal dimension of each vortex core.
In Figure 5, the fractal process of turbulent Karman vortex at the trailing edge of the hydrofoil at different Reynolds number ranges from 7.5 × 10⁶ to 7.5 × 10⁷ is displayed. When the value of the Reynolds number was small, the vortex had a smaller scale and lower intensity, and the morphological operation eliminated most of the vortex structure. With the further increase in the Reynolds number, the size and strength of the vortex core at the trailing edge of the hydrofoil increased, and the number and area of fractal islands formed after morphological treatment further increased. The fractal process at each Reynolds number proceeded smoothly, which laid the foundation for the following research.
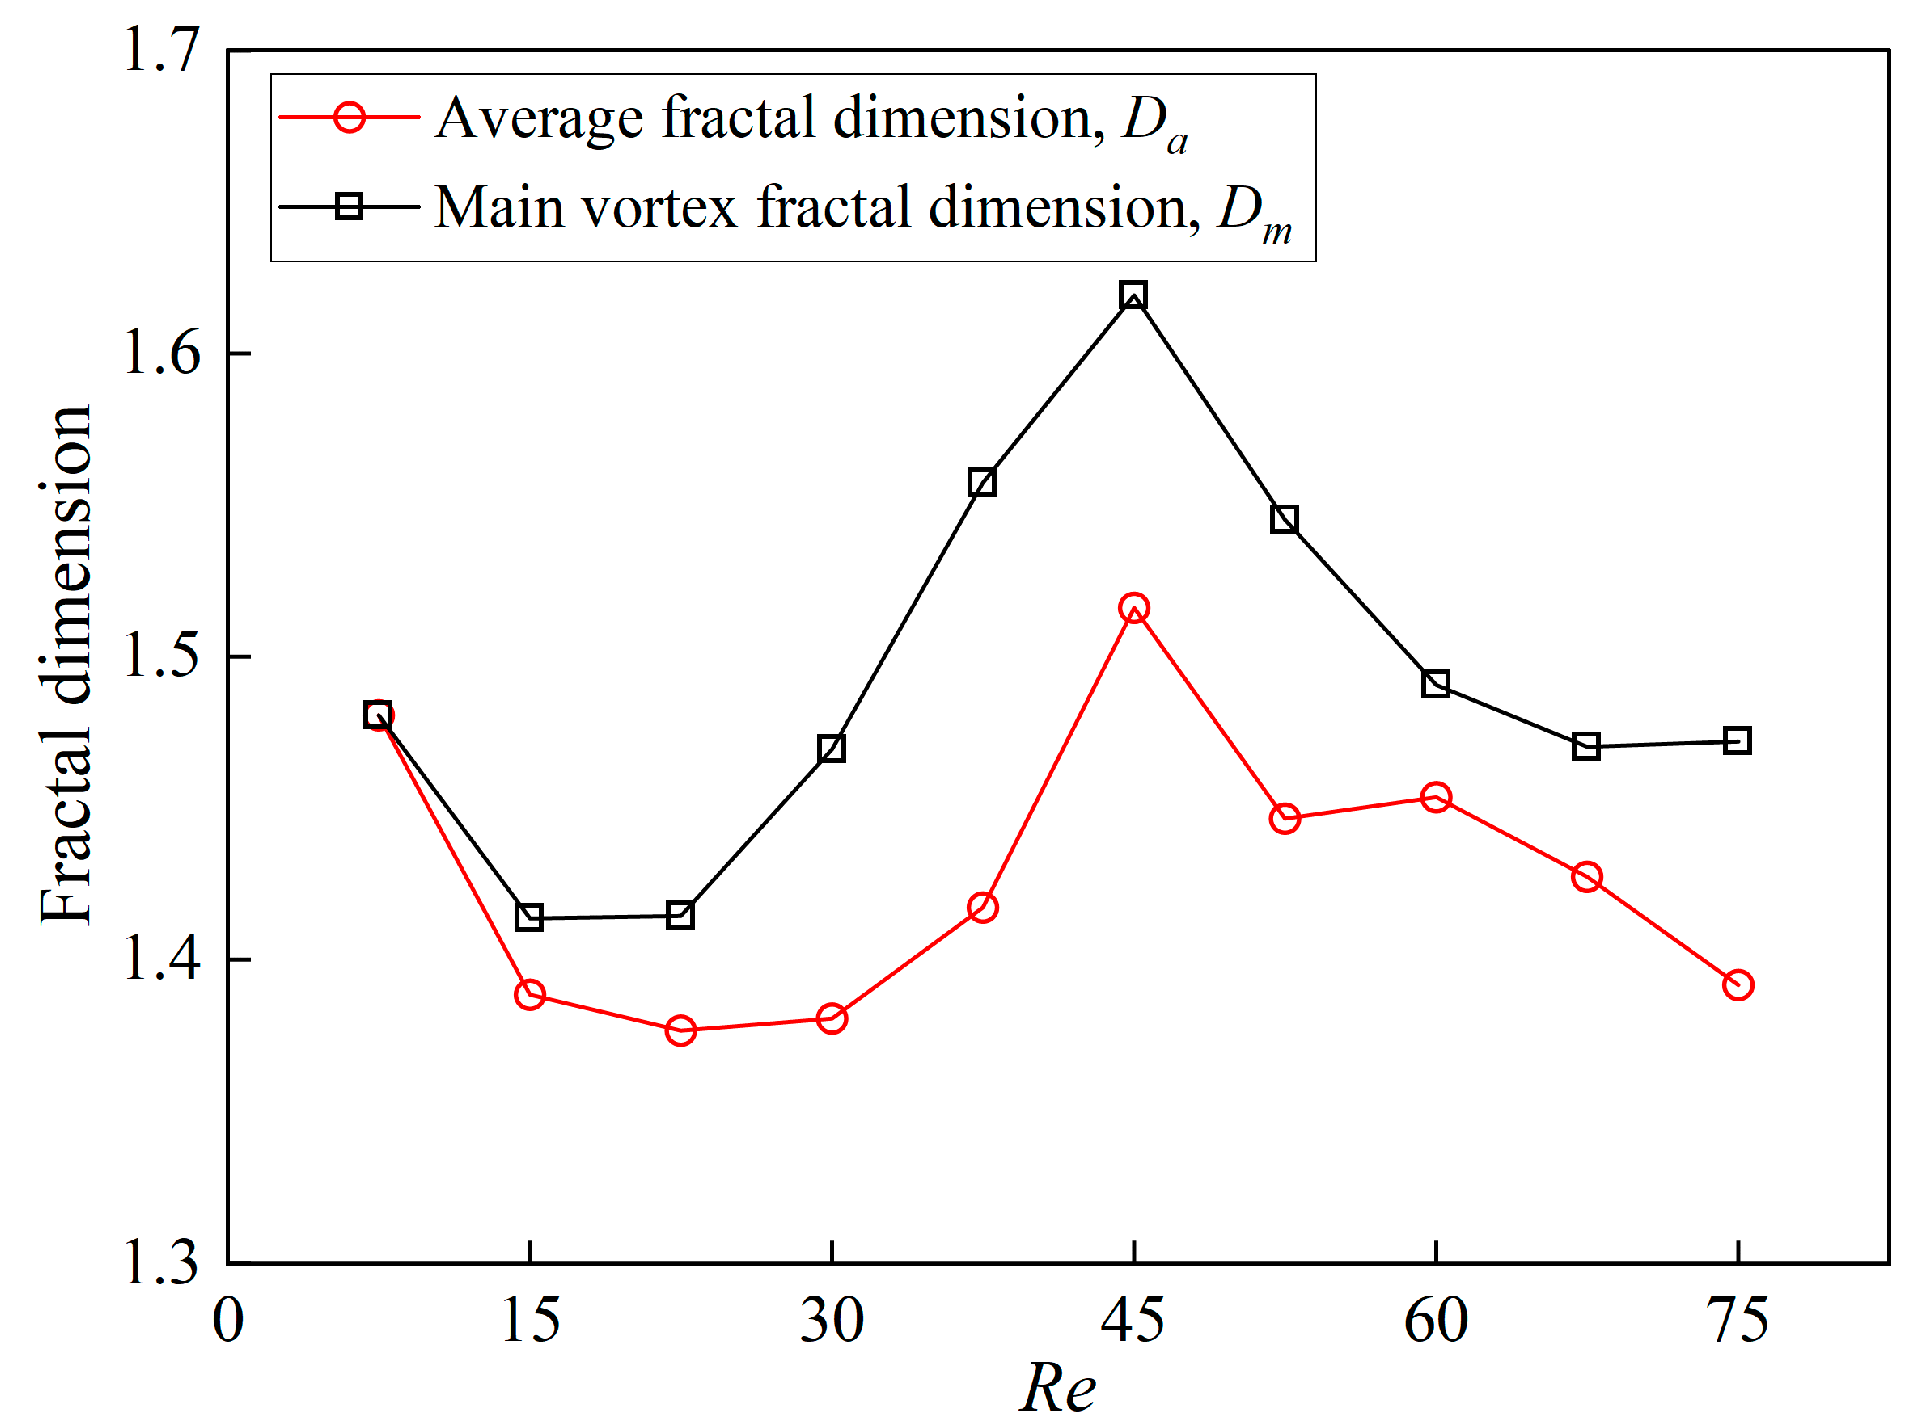
Table 1 is the fractal dimension of perimeter of the Karman vortex at every Reynolds number calculated according to Equation (7). When the area of one vortex is the largest one for the same Reynolds number condition, then this vortex is defined as a main vortex. As shown in Figure 6, since Re = 7.5 × 10⁶, there is only one vortex core, so its main fractal dimension is equal to the average fractal dimension. Except for this Re value, the main fractal dimension, Dm, at all Reynolds numbers is greater than the average fractal dimension, Da. The fractal dimension at each Reynolds number is between 1.41 and 1.62, and the average fractal dimension is between 1.38 and 1.52. According to the statistical results, at the same Reynolds number, the size of the main vortex is the largest, and Da is less than Dm. That is to say, fractal dimension can be used to express the size and shape of a vortex.
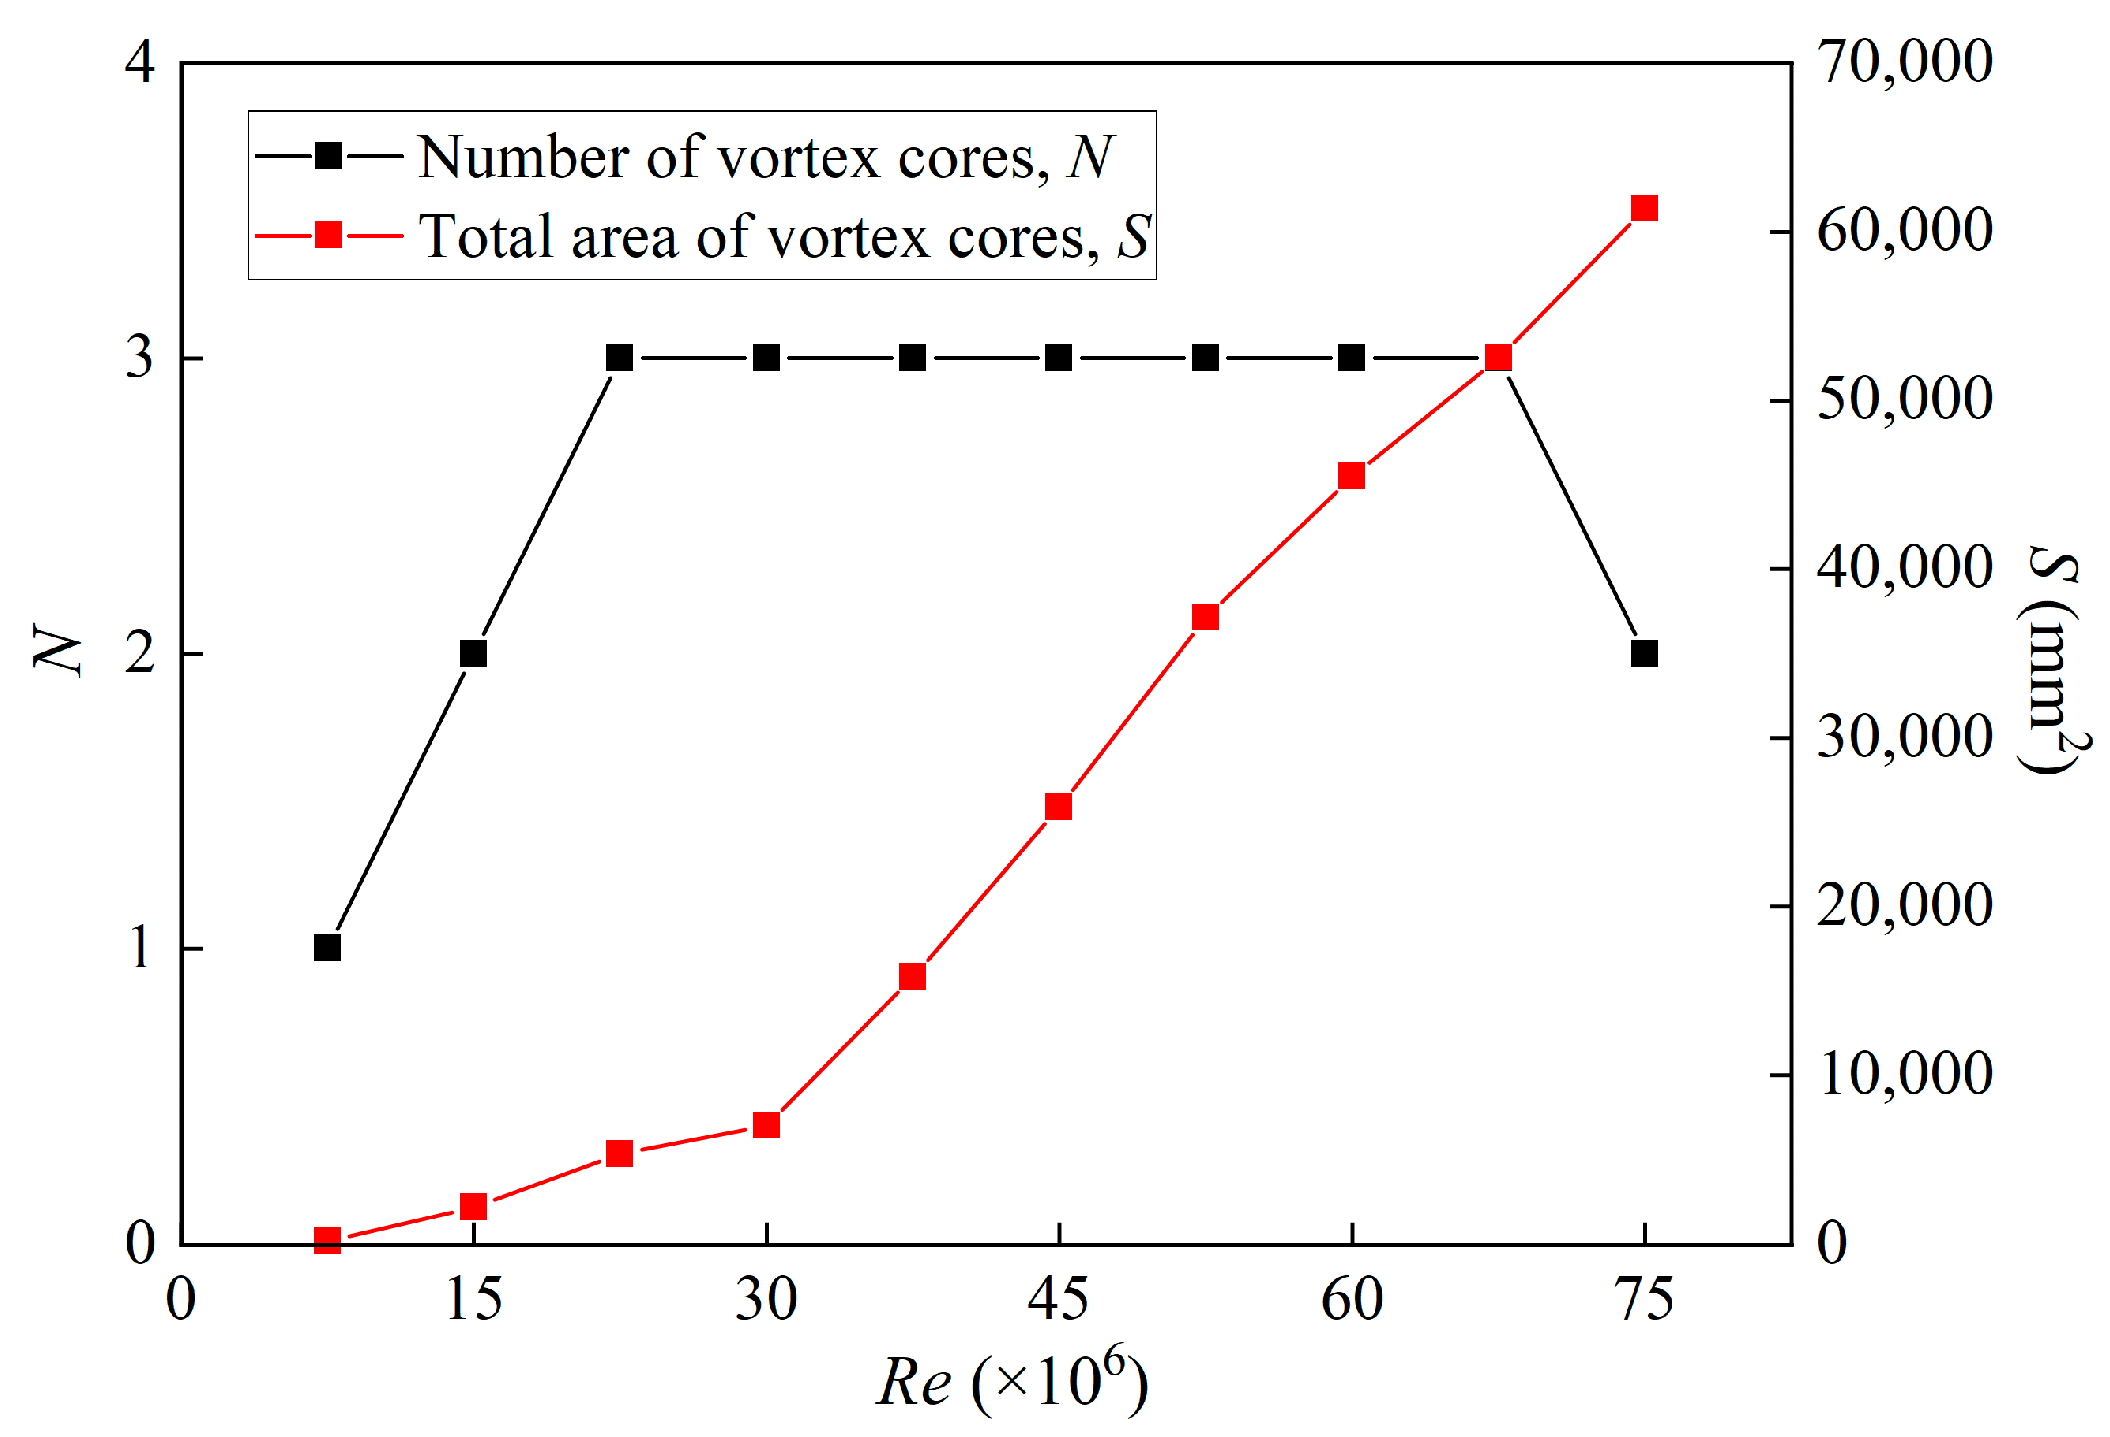
Based on the fractal method and numerical simulation results, the fractal characteristics of the turbulent Karman vortex for the NACA0009 hydrofoil at ten different increasing Reynolds numbers were extracted. Figure 7 is a trend chart of the number of vortex cores and the total area of vortex cores of the turbulent Karman vortex under feature extraction. It shows that when the Reynolds number increases, the number of vortex cores at the trailing edge increases first and then decreases, but the number of vortex cores does not exceed three at most. In the whole process of an increasing Reynolds number, the strength of the single vortex in the first pair of shedding vortices at the trailing edge of the hydrofoil is larger, forming a main vortex core, developing the strength of the first pair of Karman vortices while shedding, forming two main vortex cores, and then the strength of the single vortex in the second pair of shedding vortices, forming three main vortex cores.
However, when the Reynolds number further increases, due to the further increase in the strength of the previously appearing vortex cores, the phenomenon of vortex cores being connected appears, so the number of main vortex cores decreases to two. The total area of the vortex core increases with the increase in the Reynolds number, and it is the same at each Reynolds number.
It is worth noting that during the whole development process of the vortex core area, with the increase in the Reynolds number, the vortex core area can be seen to undergo a linear increase in two stages. That is, when the Reynolds number is less than 3 × 10⁷, the vortex core growth rate increases slowly; however, when the Reynolds number is greater than 3 × 10⁷, the growth rate of the total area of the vortex core accelerates. This is because when the Reynolds number increases to a certain extent, the complexity of flow patterns increases significantly, and the boundary of vortex at the trailing edge of hydrofoil blurs gradually. When the fractal features are extracted, a large area of connected vortex cores is formed, so the total area of the vortex cores increases.
Figure 8 is a comparison chart of the total area of vortex cores at each Reynolds number. It shows that when the Reynolds number increases, the total area of the vortex core gradually increases. In the data comparison, the Reynolds number is greater than 3 × 10⁷, and the growth rate of the total area of the vortex core increases significantly. It can be seen that the complexity of flow patterns increases significantly due to the increase in the Reynolds number, resulting in the first pair of shedding vortices at the trailing edge of the hydrofoil forming long strip wakes on both sides of the trailing edge of the hydrofoil, which are extracted together during the fractal feature extraction of the vorticity map. However, in general, with the increase in the Reynolds number, the total area of the vortex core of the turbulent Karman vortex at the trailing edge of the hydrofoil gradually increases.

6. Conclusions

The NACA0009 hydrofoil was set as the simplified model for the impeller blades of hydraulic machinery. By analyzing the fractal characteristics of the turbulent Karman vortex at the trailing edge of the NACA0009 hydrofoil under different Reynolds numbers, the following conclusions were obtained:
(1)
By combining binary and morphological operations and CFD numerical simulation, image segmentation methods were applied to recognize the shape of the Karman vortex. The results show that this method can efficiently and intuitively obtain the shedding intensity and shape of the vortex. This method can also be extended to related research on the characteristics and evolution of the vortex flow in hydraulic machinery.
(2)
Based on the fractal dimension method of the area and perimeter, the number of vortex cores and the total area of the Karman vortex at trailing edge of hydrofoil were analyzed at different Reynolds numbers. The results show that with the increase in the Reynolds number, the number of vortex cores first increases from 1 to 3 and then decreases to 2, while the total area of the vortex cores keeps increasing.
(3)
Conclusion (2) was obtained by combining the results of the numerical simulation of the vorticity contours. As the Reynolds number increases, the turbulence level increases, leading to the appearance of vortex clusters at the trailing edge of the hydrofoil. The total area of the vortex clusters increases, especially when Re > 3 × 10⁷, and the growth rate of the vortex core area also increases due to the increase in turbulence.
In conclusion, the combination of fractal analysis and numerical simulation is an intuitive and feasible research method for studying the shedding law of the Karman vortex. It can provide a reference for future research on issues such as vibration and noise caused by the Karman vortex while considering changes in turbulence intensity.

Author Contributions

F.Z.: Conceptualization, methodology, writing—original draft preparation, and investigation. Y.Z.: investigation, and validation. D.Z.: methodology, investigation, and validation. R.T.: methodology, investigation, and validation. R.X.: methodology, investigation, and validation. All authors have read and agreed to the published version of the manuscript.

Funding

This research was funded by the National Natural Science Foundation of China (grant number 51909131) and the Open Research Fund Program of State Key Laboratory of Hydroscience and Engineering (No. sklhse-2022-E-01).

Data Availability Statement

Data are available upon request from the corresponding author.

Acknowledgments

The authors would like to acknowledge the National Natural Science Foundation of China and the Open Research Fund Program of State Key Laboratory of Hydroscience and Engineering.

Conflicts of Interest

The authors declare no conflict of interest.

References

  1. Ai, C.; Zhang, L.; Gao, W.; Yang, G.; Wu, D.; Chen, L.; Chen, W.; Plummer, A. A review of energy storage technologies in hydraulic wind turbines. Energy Convers. Manag. 2022, 264, 115584. [Google Scholar] [CrossRef]
  2. Qin, Y.; Li, D.; Wang, H.; Liu, Z.; Wei, X.; Wang, X. Investigation on hydraulic loss component and distribution in hydraulic machinery: A case study of pump-turbine in pump mode. J. Energy Storage 2022, 52, 104932. [Google Scholar] [CrossRef]
  3. Zhang, F.; Fang, M.; Pan, J.; Tao, R.; Zhu, D.; Liu, W.; Xiao, R. Guide vane profile optimization of pump-turbine for grid connection performance improvement. Energy 2023, 274, 127369. [Google Scholar] [CrossRef]
  4. Wang, D.; Chiu, C.; Pham, H. Electromagnetic energy harvesting from vibrations induced by Kármán vortex street. Mechatronics 2012, 22, 746–756. [Google Scholar] [CrossRef]
  5. Luna-Ramírez, A.; Campos-Amezcua, A.; Dorantes-Gómez, O.; Mazur-Czerwiec, Z.; Muñoz-Quezada, R. Failure analysis of runner blades in a Francis hydraulic turbine—Case study. Eng. Fail. Anal. 2016, 59, 314–325. [Google Scholar] [CrossRef]
  6. Roig, R.; Chen, J.; de la Torre, O.; Escaler, X. Understanding the Influence of Wake Cavitation on the Dynamic Response of Hydraulic Profiles under Lock-In Conditions. Energies 2021, 14, 6033. [Google Scholar] [CrossRef]
  7. Demori, M.; Ferrari, M.; Bonzanini, A.; Poesio, P.; Ferrari, V. Autonomous Sensors Powered by Energy Harvesting from von Karman Vortices in Airflow. Sensors 2017, 17, 2100. [Google Scholar] [CrossRef] [Green Version]
  8. Chamoun, G.; Kanso, E.; Newton, P.K. Von Karman vortex streets on the sphere. Phys. Fluids 2009, 21, 116603. [Google Scholar] [CrossRef] [Green Version]
  9. Kreuzahler, S.; Schulz, D.; Homann, H.; Ponty, Y.; Grauer, R. Numerical study of impeller-driven von Kármán flows via a volume penalization method. New J. Phys. 2014, 16, 103001. [Google Scholar] [CrossRef] [Green Version]
  10. Xing, T. Direct numerical simulation of Open Von Kármán Swirling Flow. J. Hydrodyn. 2014, 26, 165–177. [Google Scholar] [CrossRef]
  11. Hernández, E.S.; Llewellyn Smith, S.G.; Cros, A. Resonance of a flexible plate immersed in a von Kármán vortex street. J. Mech. Sci. Technol. 2020, 34, 1459–1465. [Google Scholar] [CrossRef]
  12. Ausoni, P.; Farhat, M.; Escaler, X.; Egusquiza, E.; Avellan, F. Cavitation Influence on von Kármán Vortex Shedding and Induced Hydrofoil Vibrations. J. Fluids Eng.-Trans. ASME 2007, 129, 966–973. [Google Scholar] [CrossRef] [Green Version]
  13. Leung, R.C.K.; So, R.M.C. Noise Generation of Blade–Vortex Resonance. J. Sound Vib. 2001, 245, 217–237. [Google Scholar] [CrossRef]
  14. Su, W.; Li, S.; Zhang, Q.; Li, J.; Ye, Q.; Wang, N. Influence of thermal inhibitor position and temperature on vortex-shedding-driven pressure oscillations. Chin. J. Aeronaut. 2013, 26, 544–553. [Google Scholar] [CrossRef] [Green Version]
  15. Kumar, B.; Mittal, S. On the origin of the secondary vortex street. J. Fluid Mech. 2012, 711, 641–666. [Google Scholar] [CrossRef]
  16. Atrah, A.; Ab-Rahman, M.; Salleh, H.; Nuawi, M.; Mohd Nor, M.; Jamaludin, N. Karman Vortex Creation Using Cylinder for Flutter Energy Harvester Device. Micromachines 2017, 8, 227. [Google Scholar] [CrossRef] [Green Version]
  17. Yao, G.; Wang, H.; Yang, C.; Wen, L. Research and design of underwater flow-induced vibration energy harvester based on Karman vortex street. Mod. Phys. Lett. B 2017, 31, 1750076. [Google Scholar] [CrossRef]
  18. Liu, C.; Wang, Y.; Yang, Y.; Duan, Z. New omega vortex identification method, Science China Physics. Mech. Astron. 2016, 59, 684711. [Google Scholar] [CrossRef]
  19. Liu, J.; Gao, Y.; Wang, Y.; Liu, C. Objective Omega vortex identification method. J. Hydrodyn. 2019, 31, 455–463. [Google Scholar] [CrossRef]
  20. Xu, H.; Cai, X.; Liu, C. Liutex (vortex) core definition and automatic identification for turbulence vortex structures. J. Hydrodyn. 2019, 31, 857–863. [Google Scholar] [CrossRef]
  21. Deng, L.; Wang, Y.; Liu, Y.; Wang, F.; Li, S.; Liu, J. A CNN-based vortex identification method. J. Vis. 2019, 22, 65–78. [Google Scholar] [CrossRef]
  22. Li, P.; Tao, R.; Yang, S.; Zhu, D.; Xiao, R. Temporal and Spatial Analysis on the Fractal Characteristics of the Helical Vortex Rope. Fractal Fract. 2022, 6, 477. [Google Scholar] [CrossRef]
  23. Hu, Z.; Zhu, D.; Xiao, R.; Tao, R. Comparative Evaluation of the Immersed-Solid Method for Simulating the Flow Field around Hydrofoil. Sustainability 2023, 15, 3493. [Google Scholar] [CrossRef]
  24. Del-Pozo-Velázquez, J.; Chamorro-Posada, P.; Aguiar-Pérez, J.M.; Pérez-Juárez, M.Á.; Casaseca-De-La-Higuera, P. Water Detection in Satellite Images Based on Fractal Dimension. Fractal Fract. 2022, 6, 657. [Google Scholar] [CrossRef]
  25. Ma, C.; Shen, L.; Deng, H.; Li, J. Synaptic clef segmentation method based on fractal dimension for ATUM-SEM image of mouse cortex. Int. J. Wavelets Multiresolution Inf. Process. 2022, 20, 2150038. [Google Scholar] [CrossRef]
  26. Zhuang, Z.; Lei, N.; Joseph Raj, A.N.; Qiu, S. Application of fractal theory and fuzzy enhancement in ultrasound image segmentation. Med. Biol. Eng. Comput. 2019, 57, 623–632. [Google Scholar] [CrossRef]
  27. Menter, F.R.; Kuntz, M.; Langtry, R. Ten Years of Industrial Experience with the SST Turbulence Model. Turbul. Heat Mass Transf. 2003, 4, 625–632. [Google Scholar]
  28. Chen, J.; Zhou, Y.; Antonia, R.A.; Zhou, T.M. The turbulent Kármán vortex. J. Fluid Mech. 2019, 871, 92–112. [Google Scholar] [CrossRef]
  29. Ausoni, P. Turbulent Vortex Shedding from a Blunt Trailing Edge Hydrofoil. Ph.D. Thesis, Swiss Federal Institute of Technology Lausanne, Lausanne, Switzerland, 2009. [Google Scholar]
  30. Prażmowska, M.; Prażmowski, K.; Żynel, M. Euclidean geometry of orthogonality of subspaces. Aequ. Math. 2008, 76, 151–167. [Google Scholar] [CrossRef]
  31. Izard, V.; Pica, P.; Spelke, E.S. Visual foundations of Euclidean geometry. Cogn. Psychol. 2022, 136, 101494. [Google Scholar] [CrossRef]
  32. Balogh, Z.M.; Tyson, J.T.; Warhurst, B. Sub-Riemannian vs. Euclidean dimension comparison and fractal geometry on Carnot groups. Adv. Math. 2009, 220, 560–619. [Google Scholar] [CrossRef] [Green Version]
Figure 1. Schematic diagram of the 2D hydrofoil of NACA0009.
Fractalfract 07 00467 g001
Figure 2. Mesh scheme of the 2D NACA0009 hydrofoil.
Fractalfract 07 00467 g002
Figure 3. Comparation of experimental [28] and simulated results.
Fractalfract 07 00467 g003
Figure 4. Fractal research process of vortex shedding.
Fractalfract 07 00467 g004
Figure 5. Fractal feature extraction process for different Re values.
Fractalfract 07 00467 g005aFractalfract 07 00467 g005b
Figure 6. Fractal dimensions of vortex under different Re values.
Fractalfract 07 00467 g006
Figure 7. Trend of number and total area of vortex cores.
Fractalfract 07 00467 g007
Figure 8. Comparison of total areas of vortex cores.
Fractalfract 07 00467 g008aFractalfract 07 00467 g008b
Table 1. Fractal dimensions of vortex under different Re values.
Re (×106)7.51522.53037.54552.56067.575
Da1.481.391.381.381.421.521.451.451.431.39
Dm1.481.411.411.471.561.621.551.491.471.47
Disclaimer/Publisher’s Note: The statements, opinions and data contained in all publications are solely those of the individual author(s) and contributor(s) and not of MDPI and/or the editor(s). MDPI and/or the editor(s) disclaim responsibility for any injury to people or property resulting from any ideas, methods, instructions or products referred to in the content.