


Quantifying the Rock Damage Intensity Controlled by Mineral Compositions: Insights from Fractal Analyses

Abstract
1. Introduction
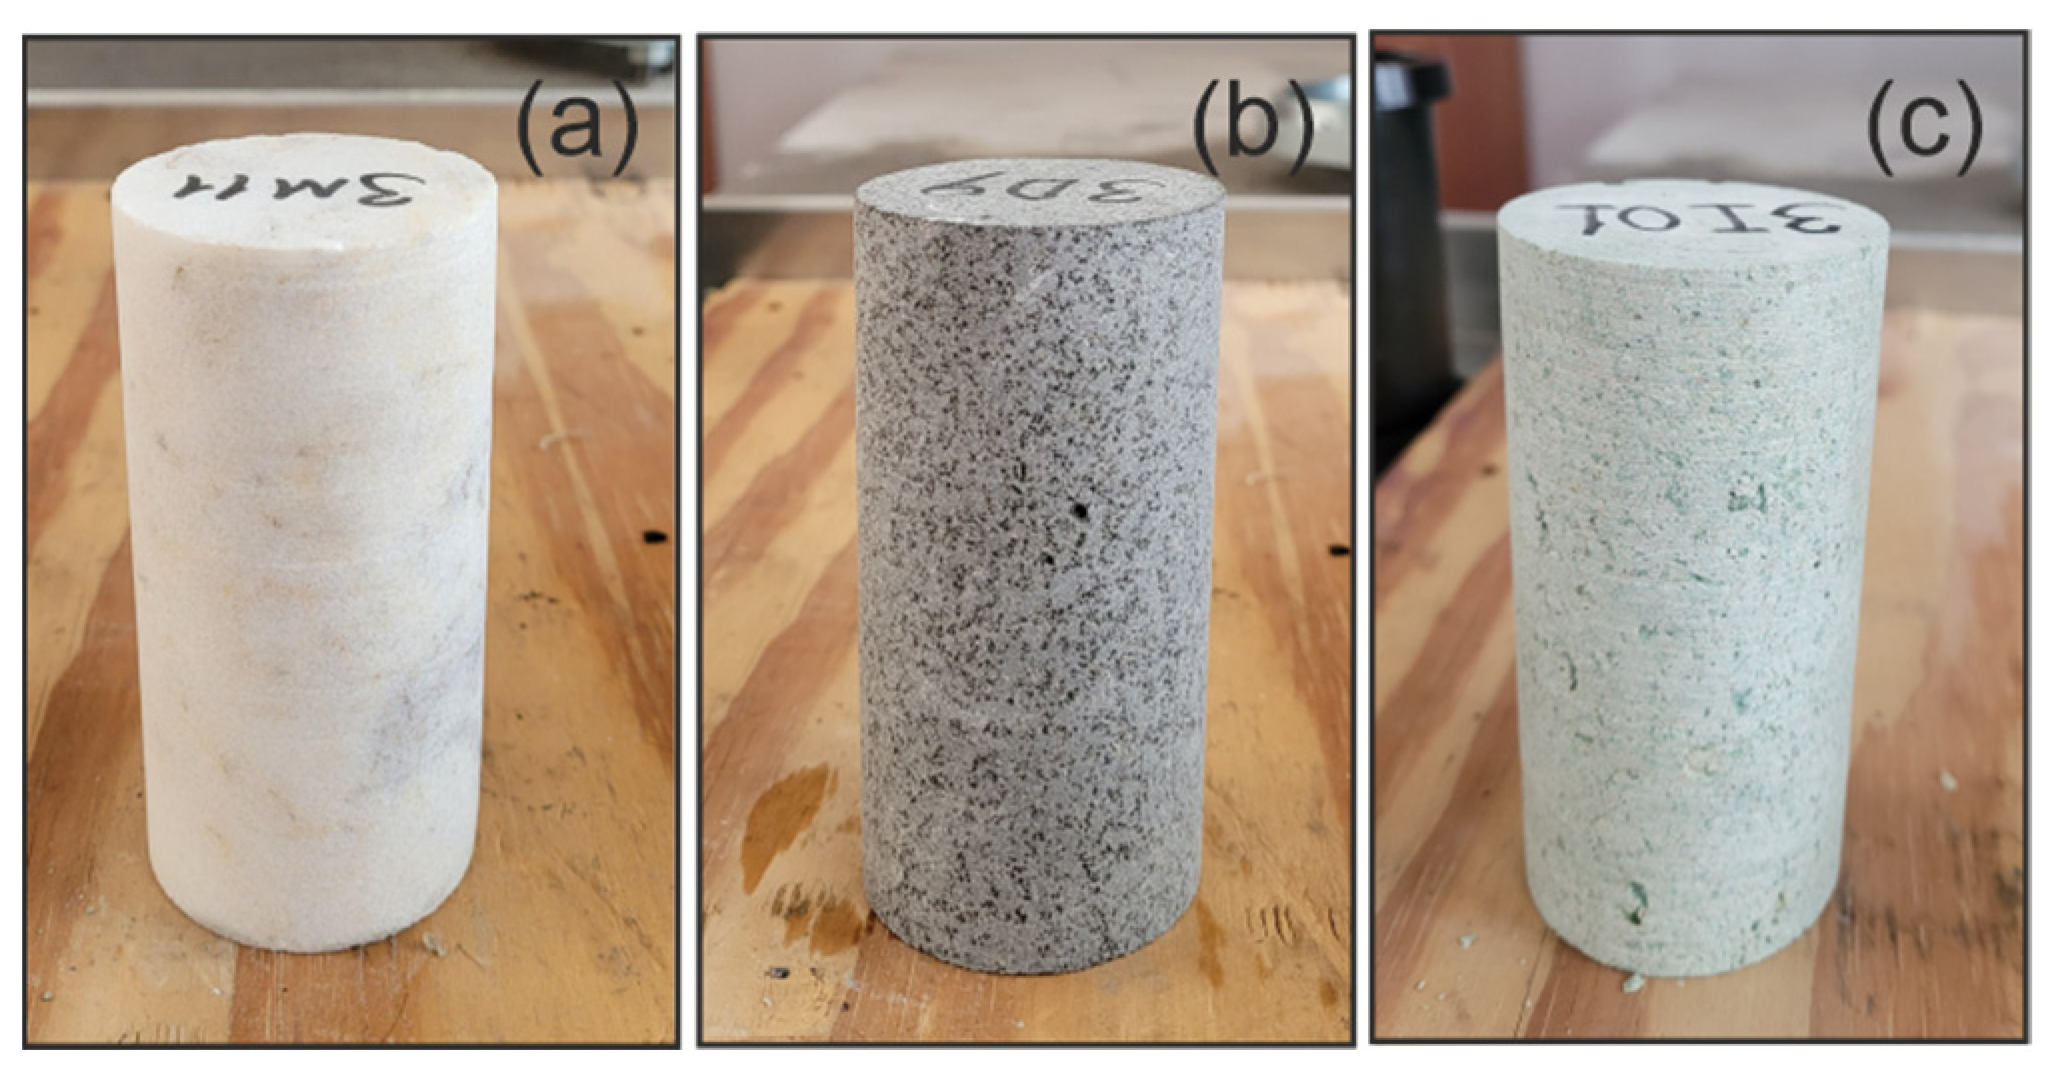
2. Material
3. Method
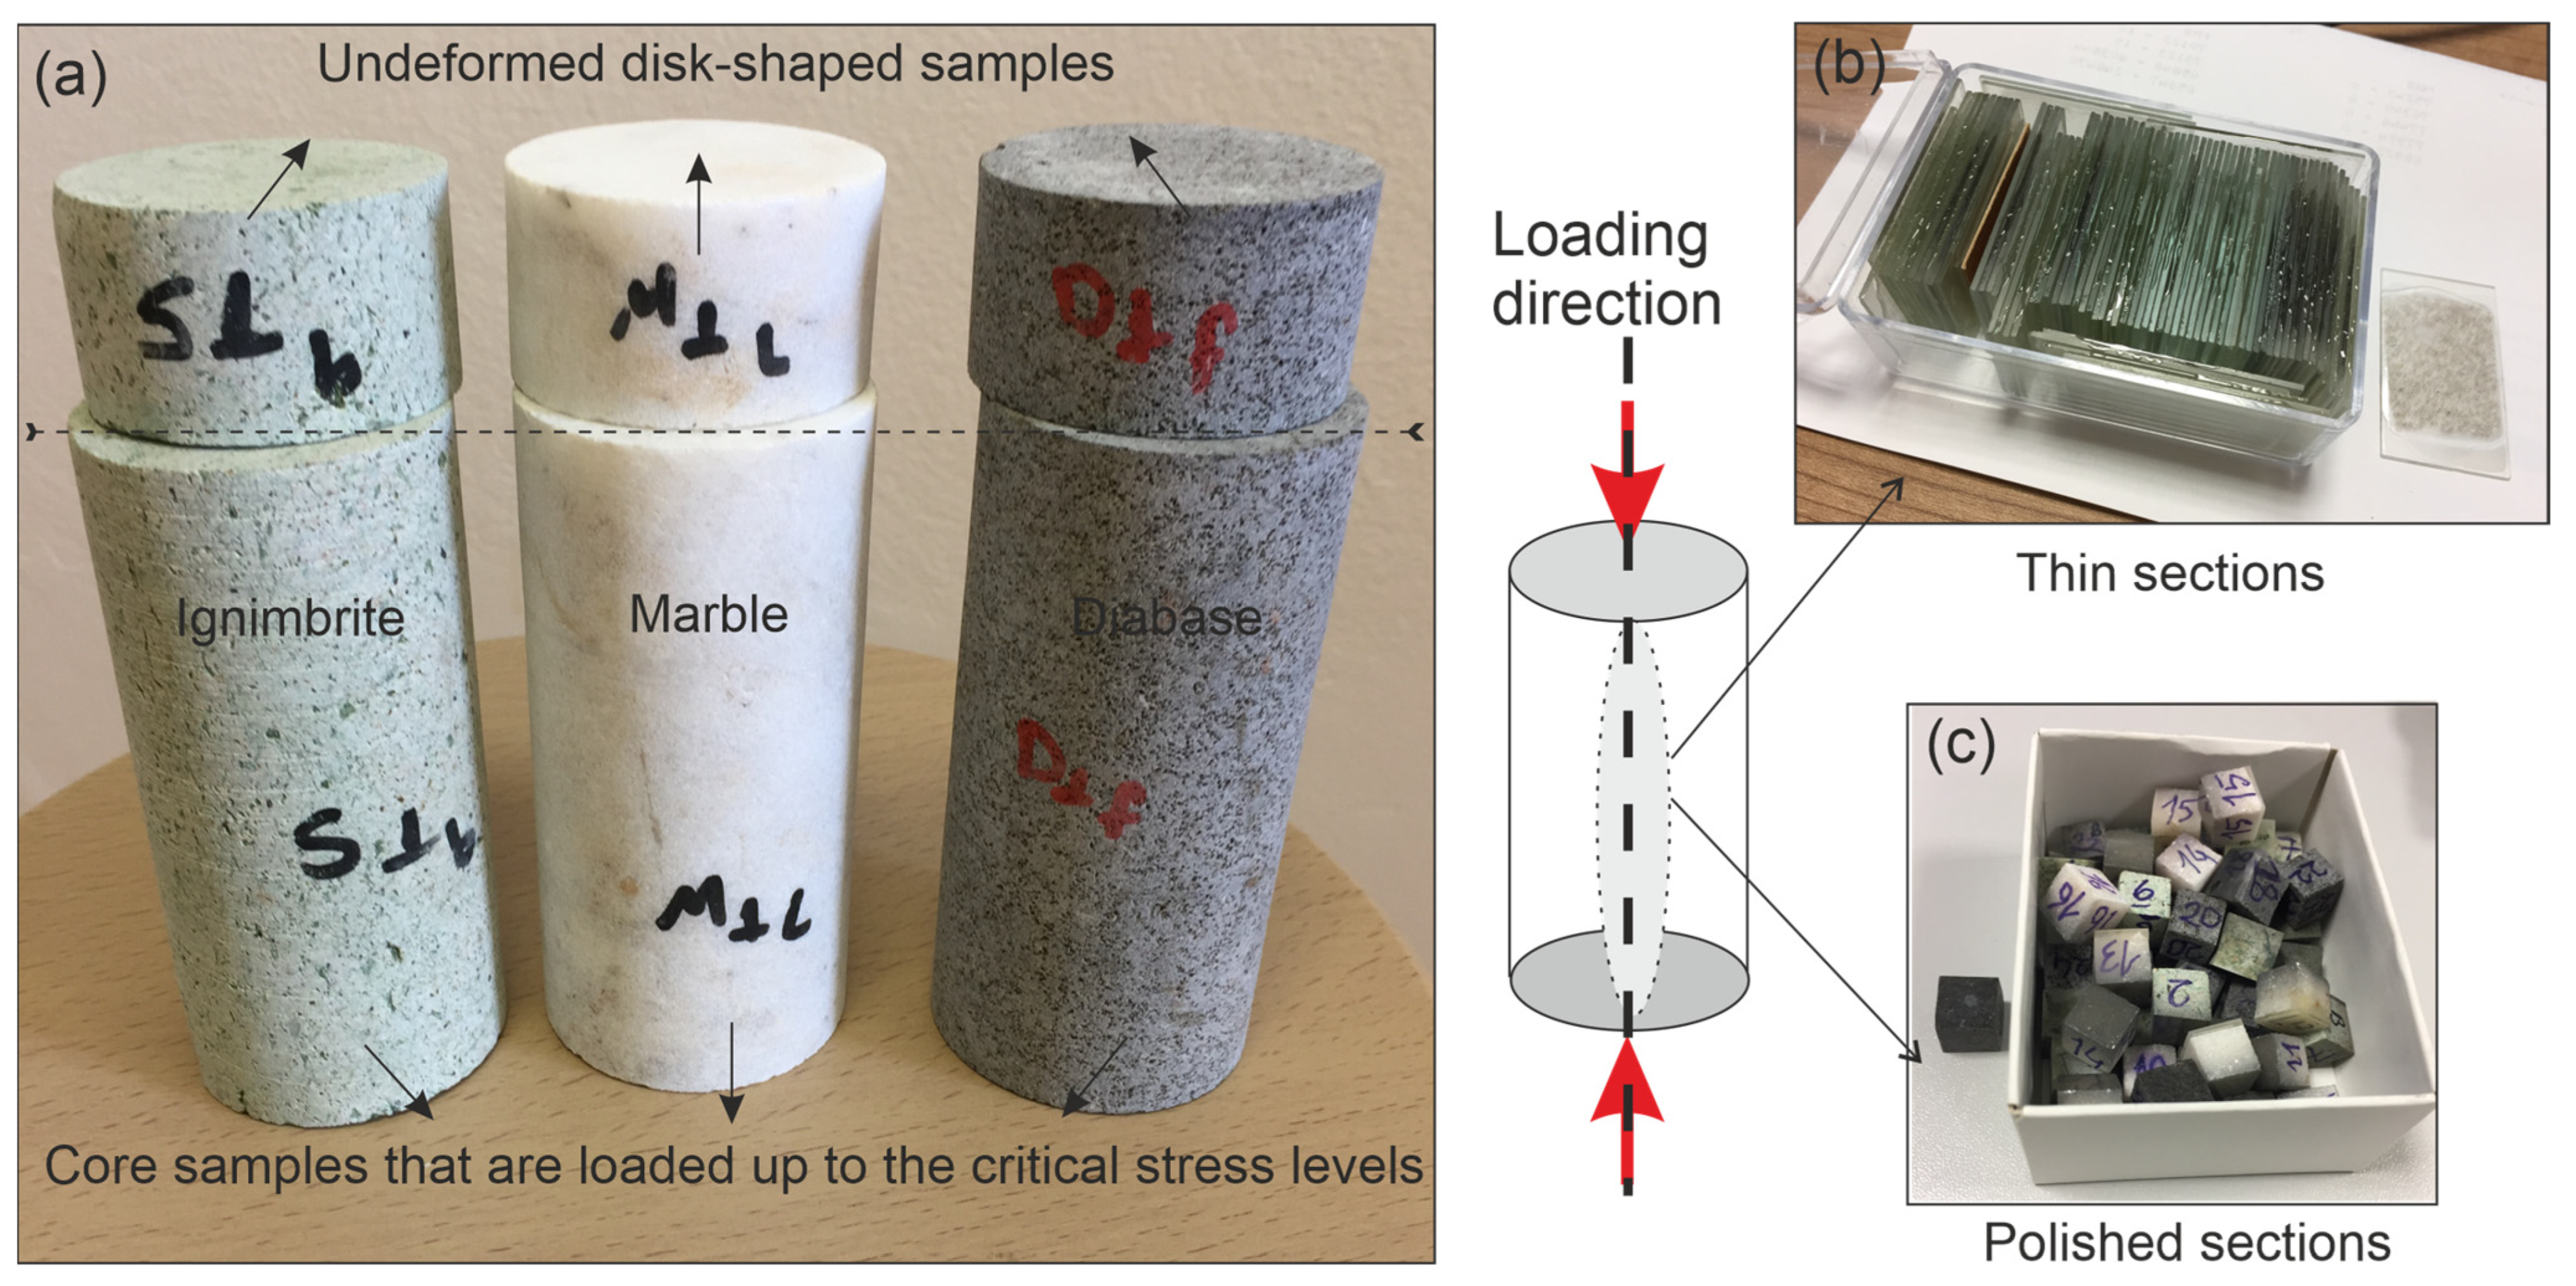
3.1. Three-Dimensional DEM Modeling
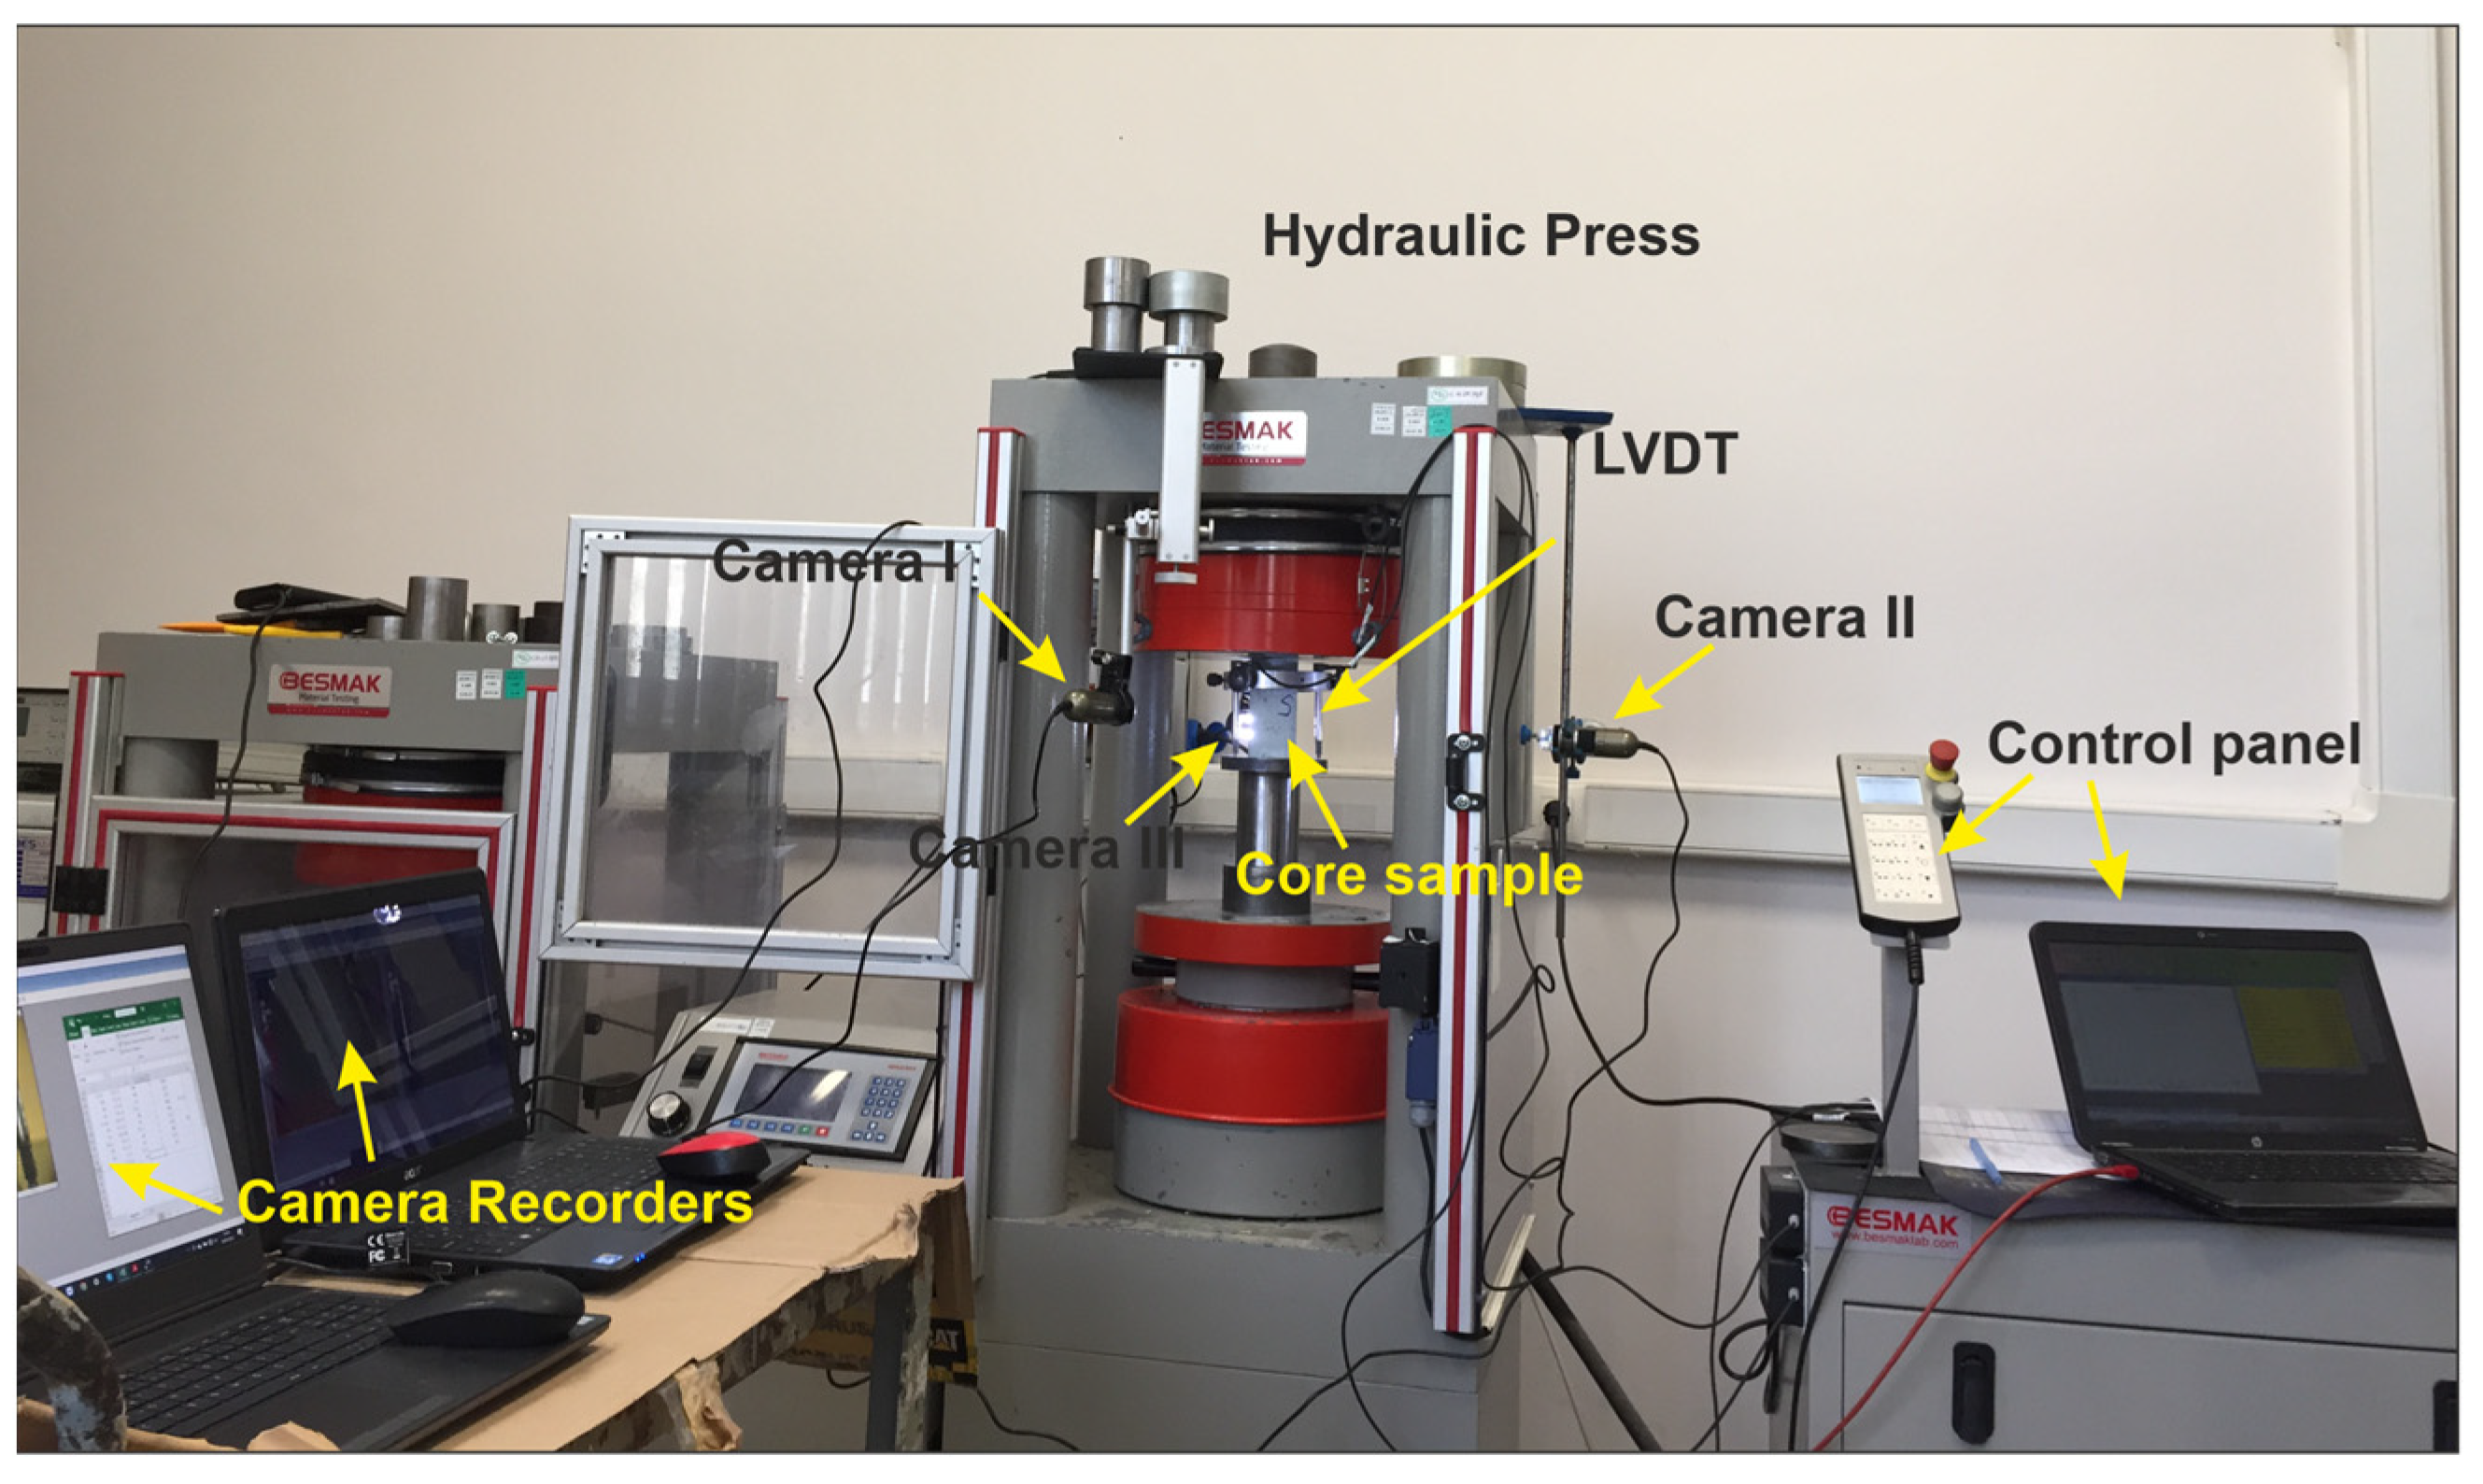
3.2. Experimental Setup
3.3. Mineralogical Analysis
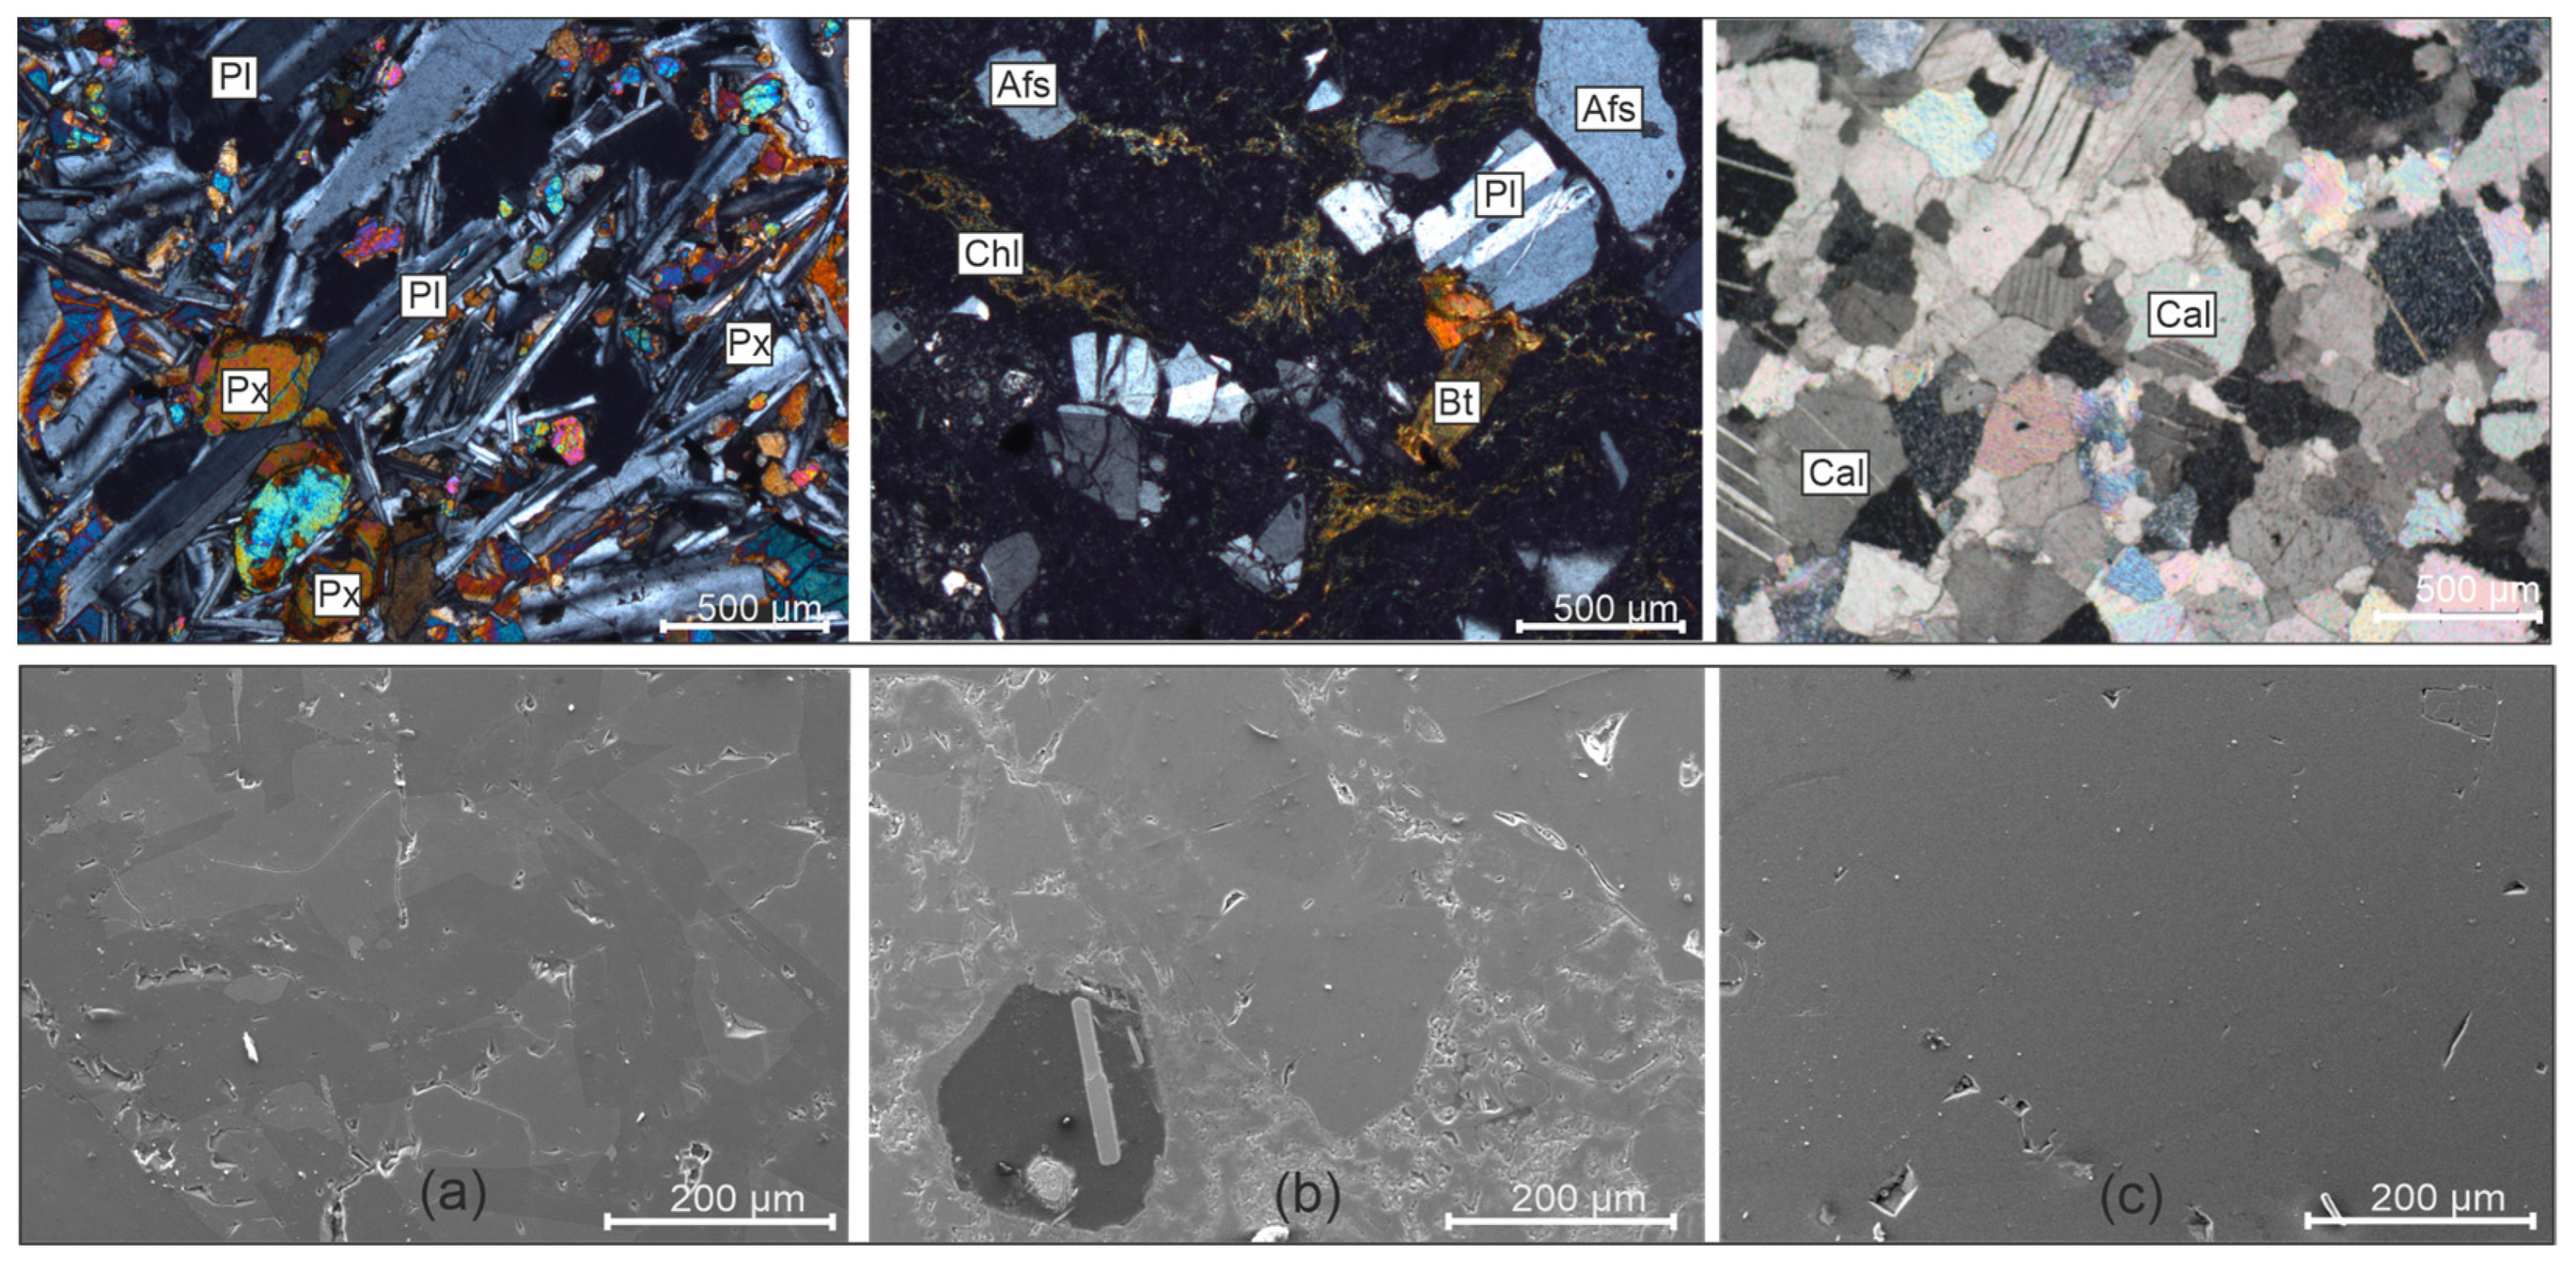
- Diabase and marble consist only of crystals. The ignimbrite has a groundmass-dominated structure, and the crystals are dispersed within the groundmass. Diabase has an equidimensional and interlocking texture. Similarly, calcite crystals in marble also clamp together.
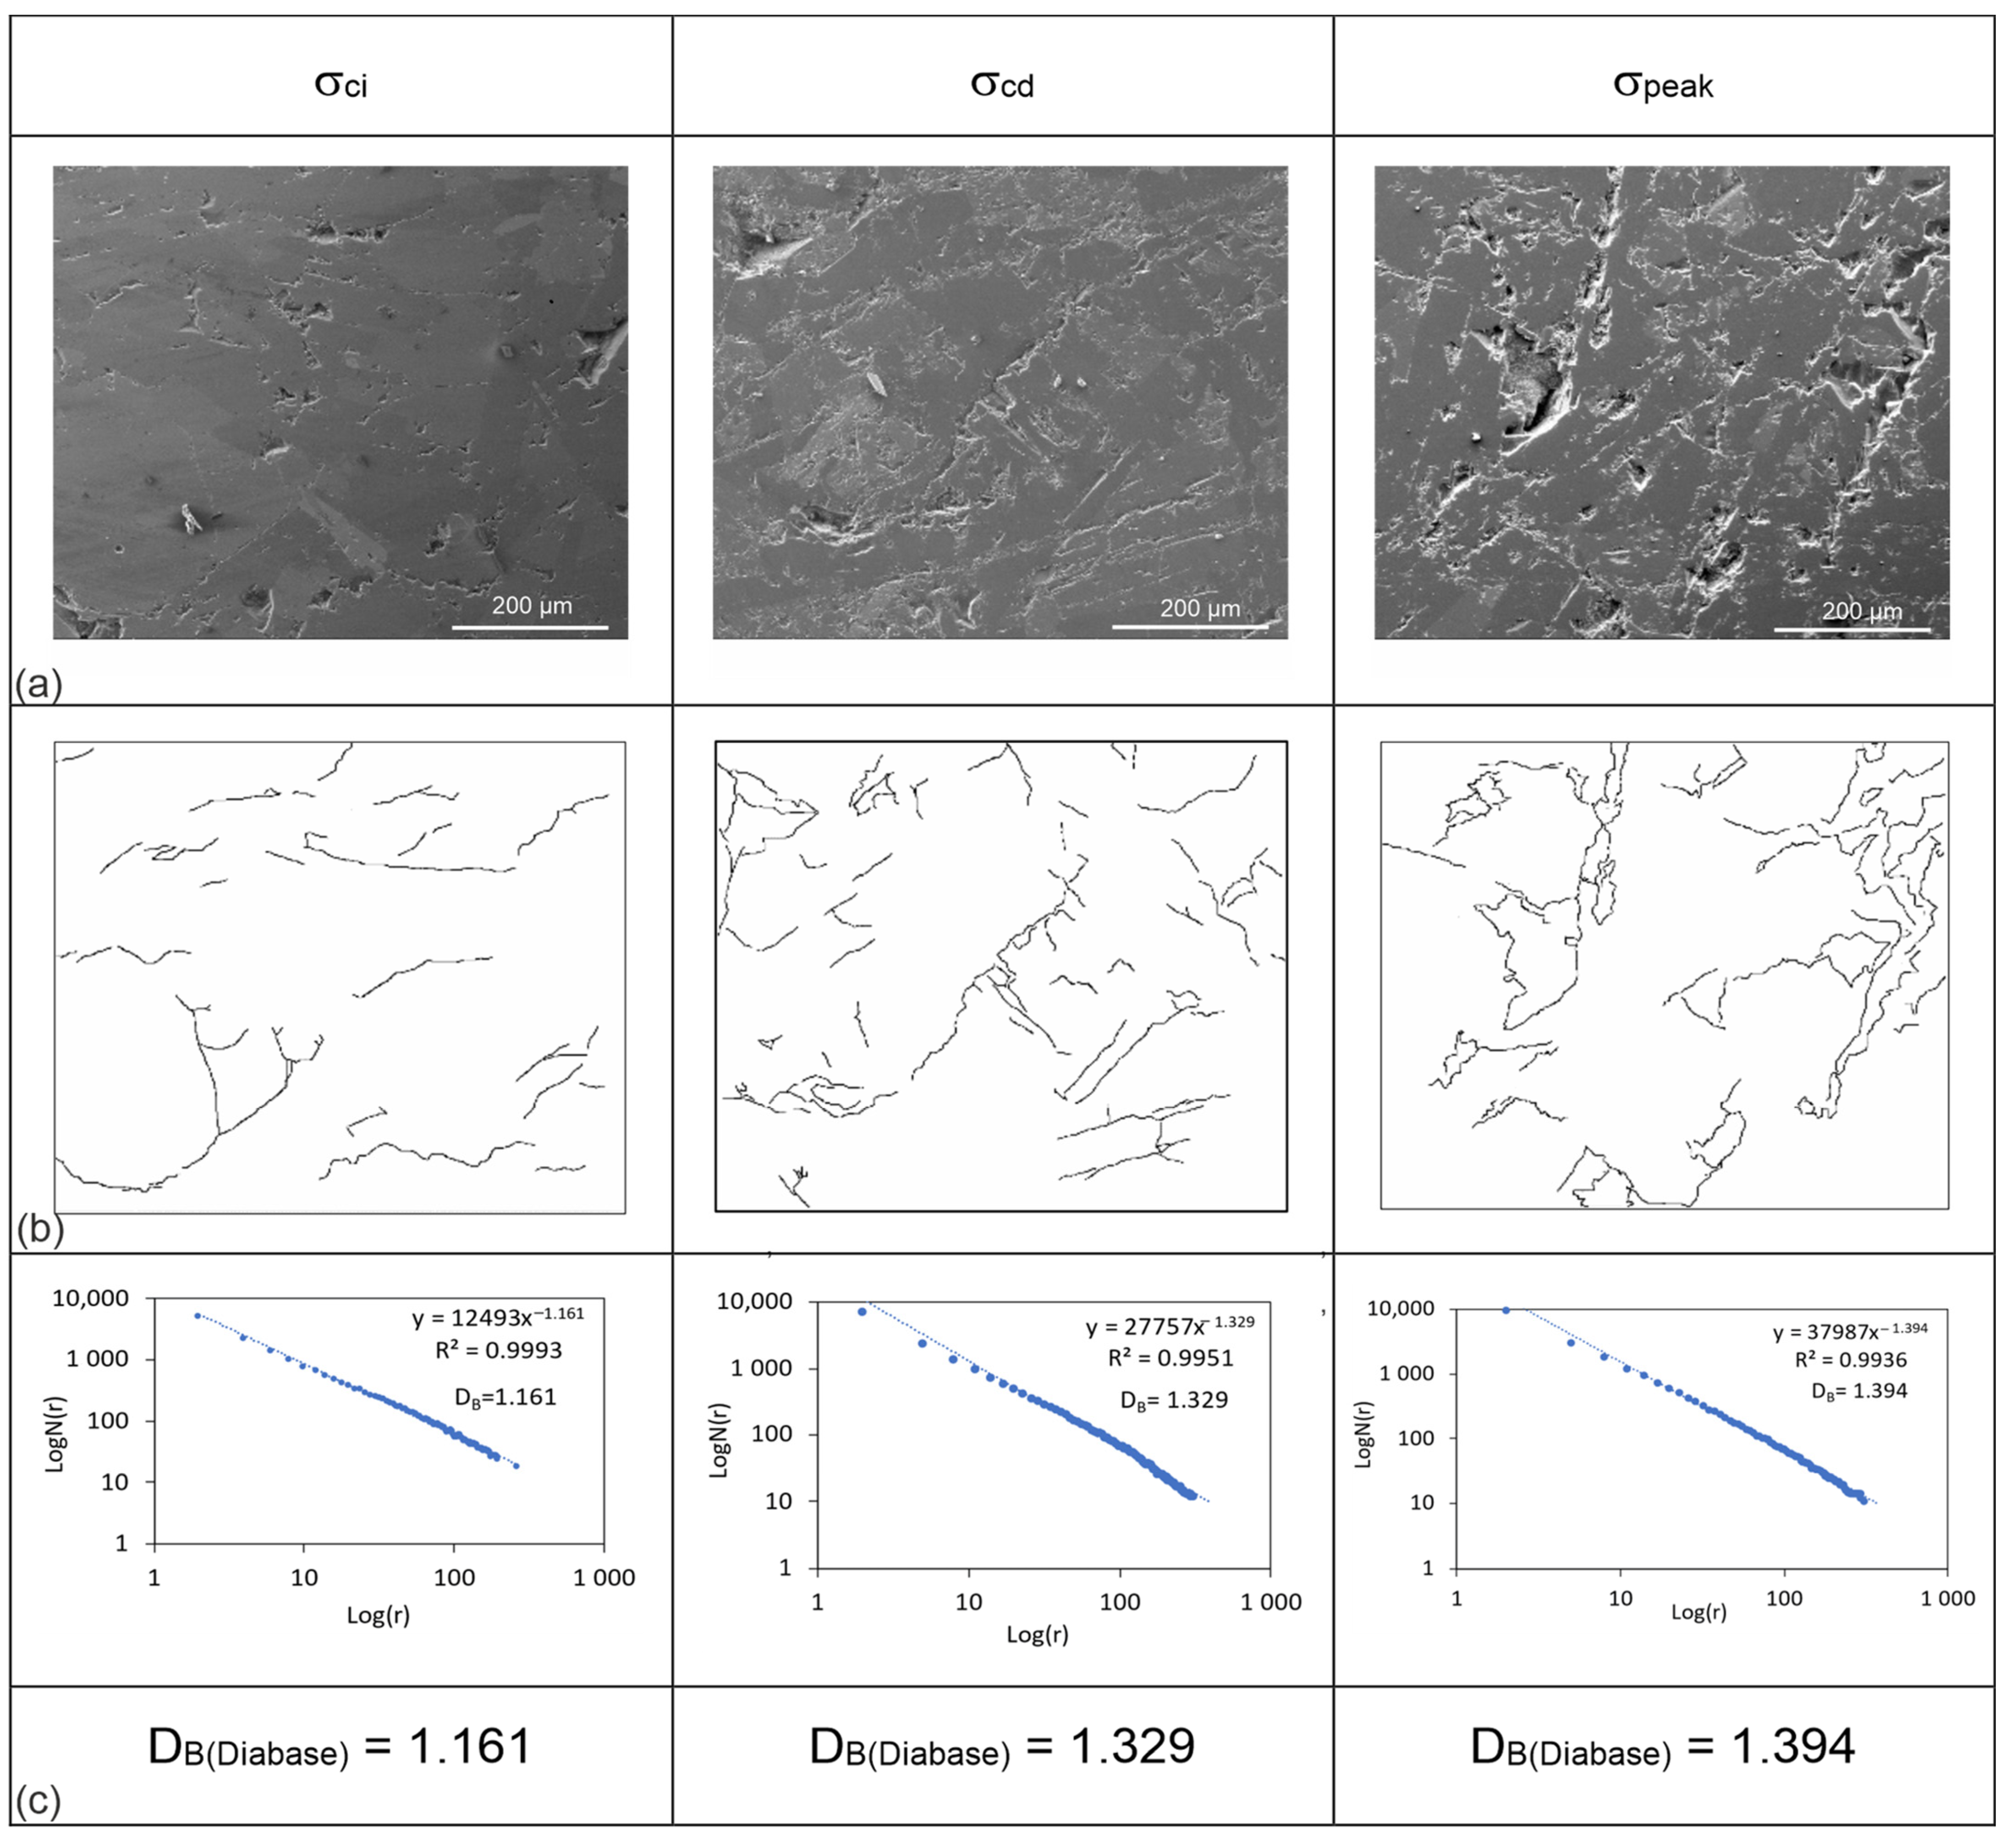
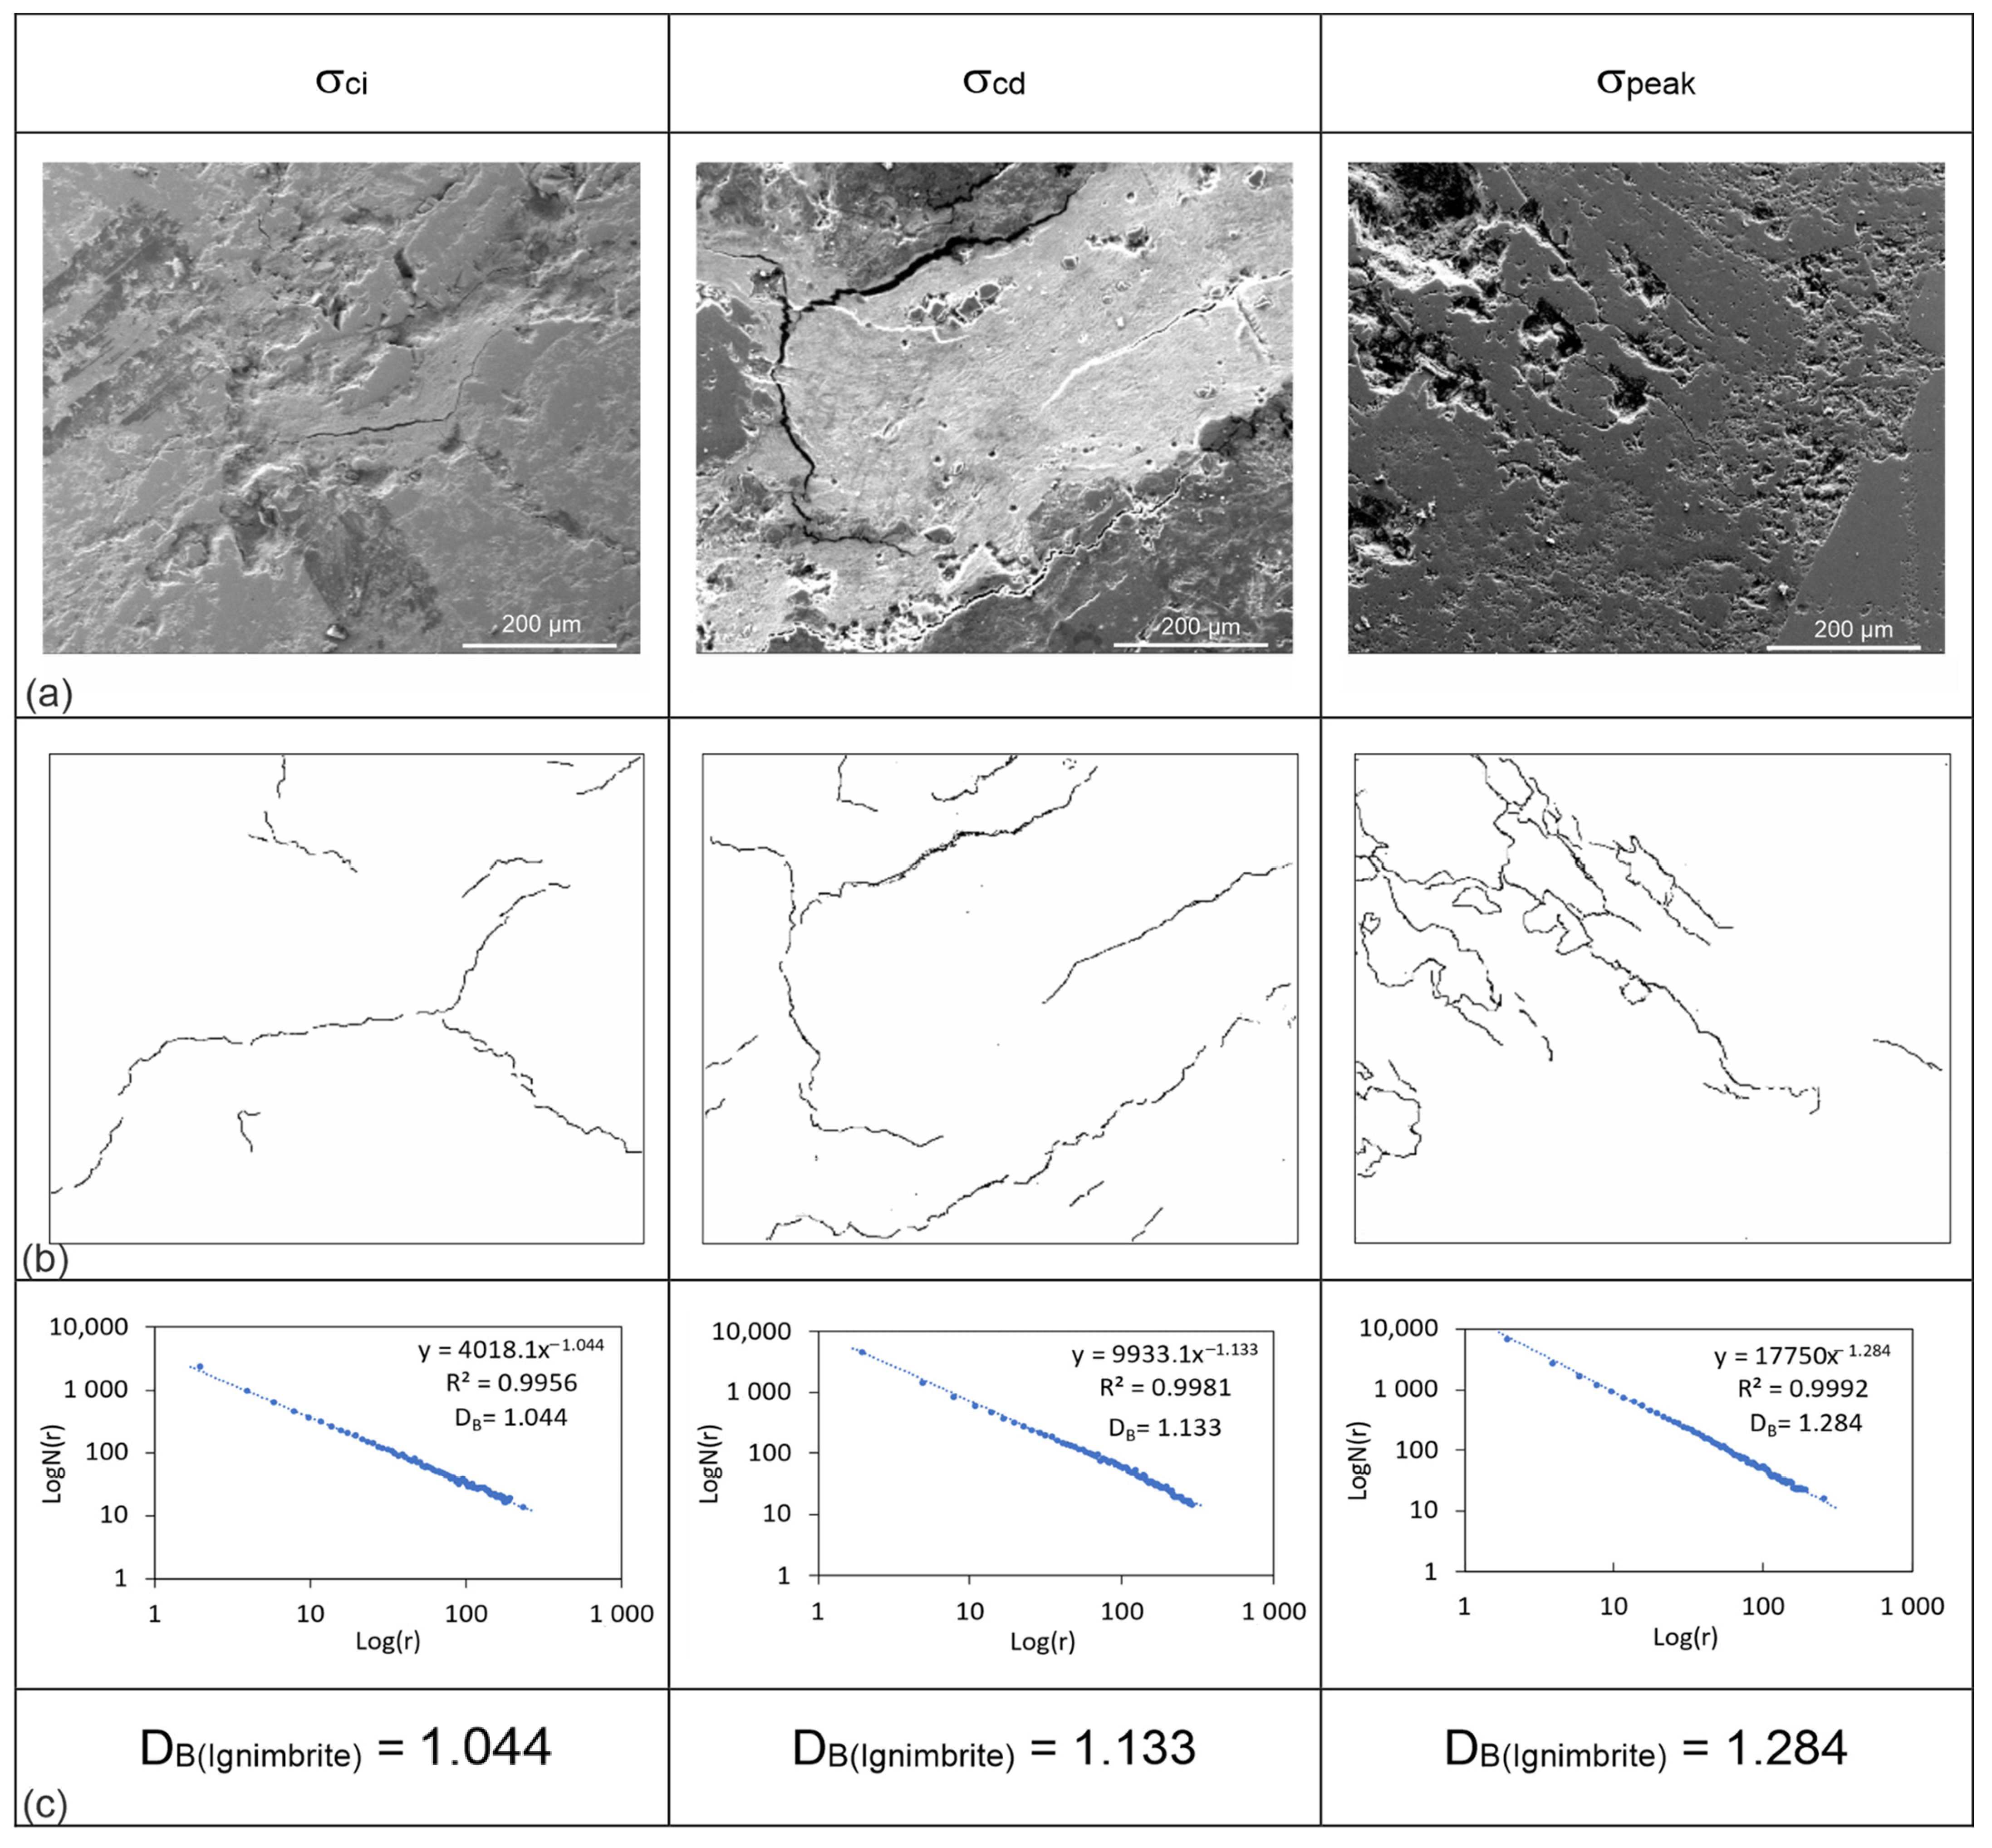
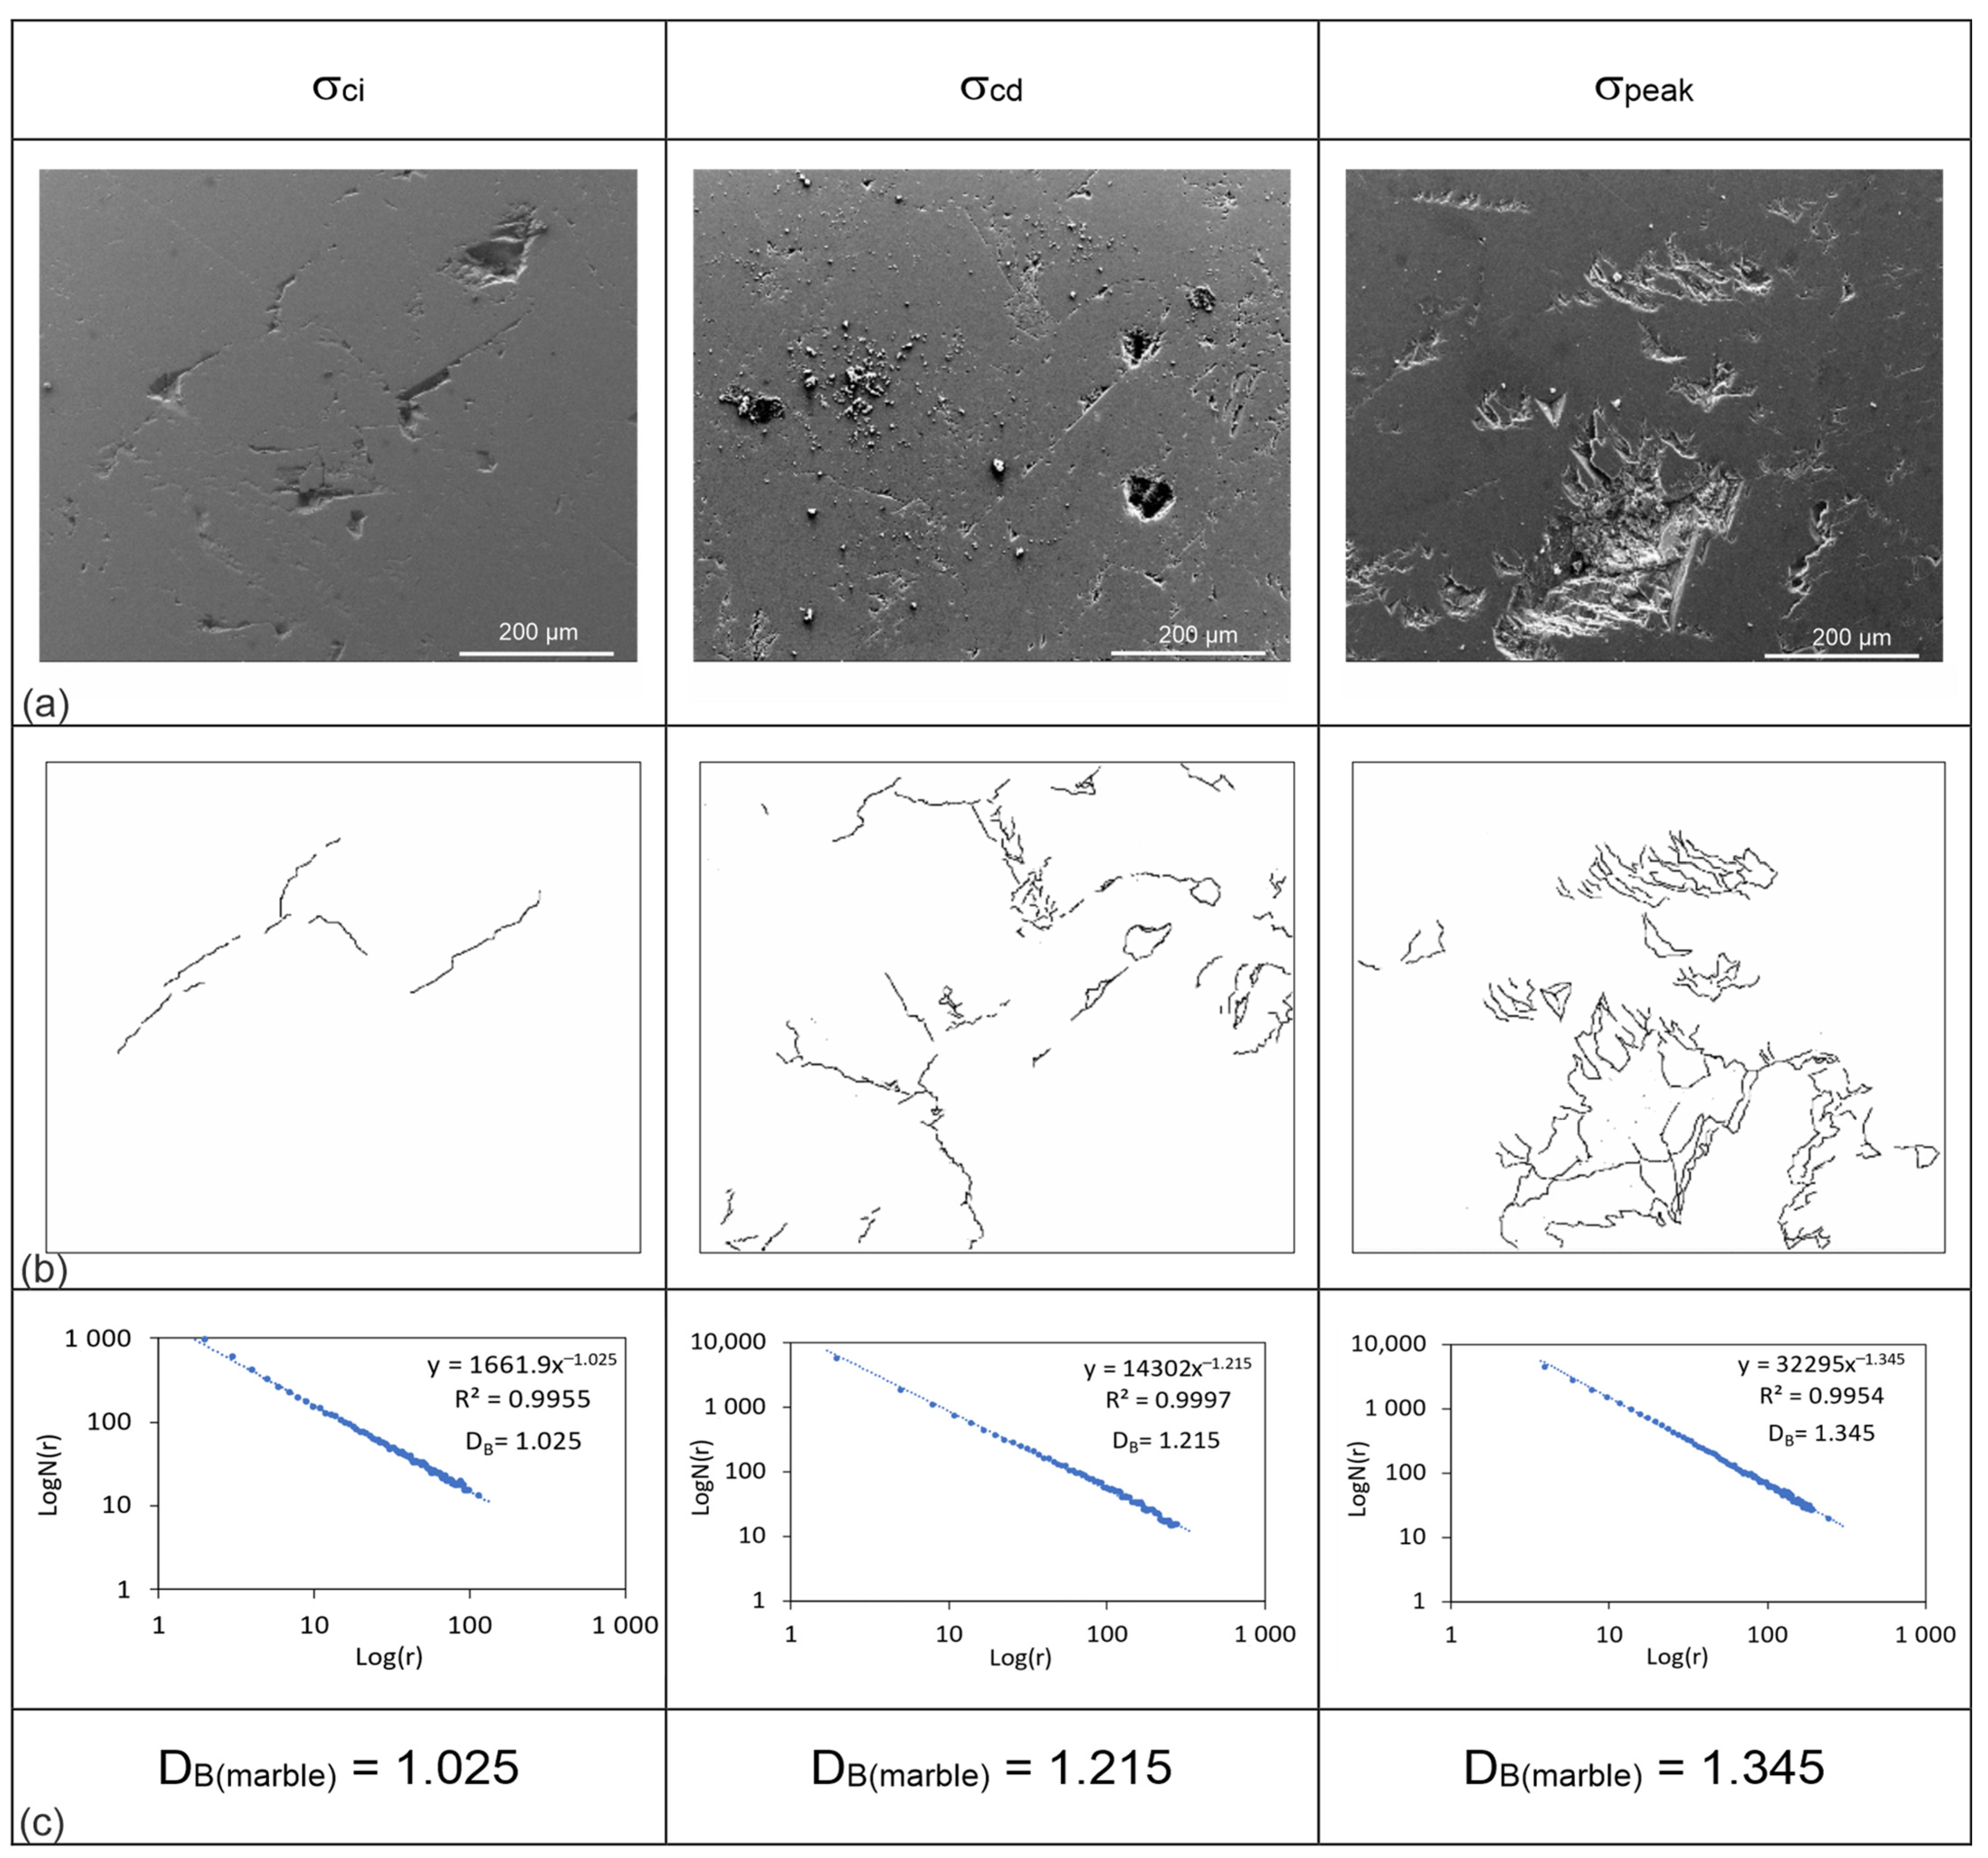
- In SEM images, marble presents a relatively smoother surface than ignimbrite and diabase in the undeformed state (Figure 6). However, the increase in the number of cracks with increasing stress was clearly observed in the SEM images of all three rock types (detailed hereafter in the following section).
- Looking at the compositions of all rock types, plagioclase, pyroxene, and alkali feldspars are the hardest minerals. Calcite and biotite have relatively lower hardness. However, since biotite is very cleaved, it deforms more easily under loading (for instance, the bending of biotites in ignimbrites is demonstrated in Figure 6b).
3.4. Fractal Analysis
4. Analysis of Progressive Rock Damage
5. Discussion
6. Conclusions
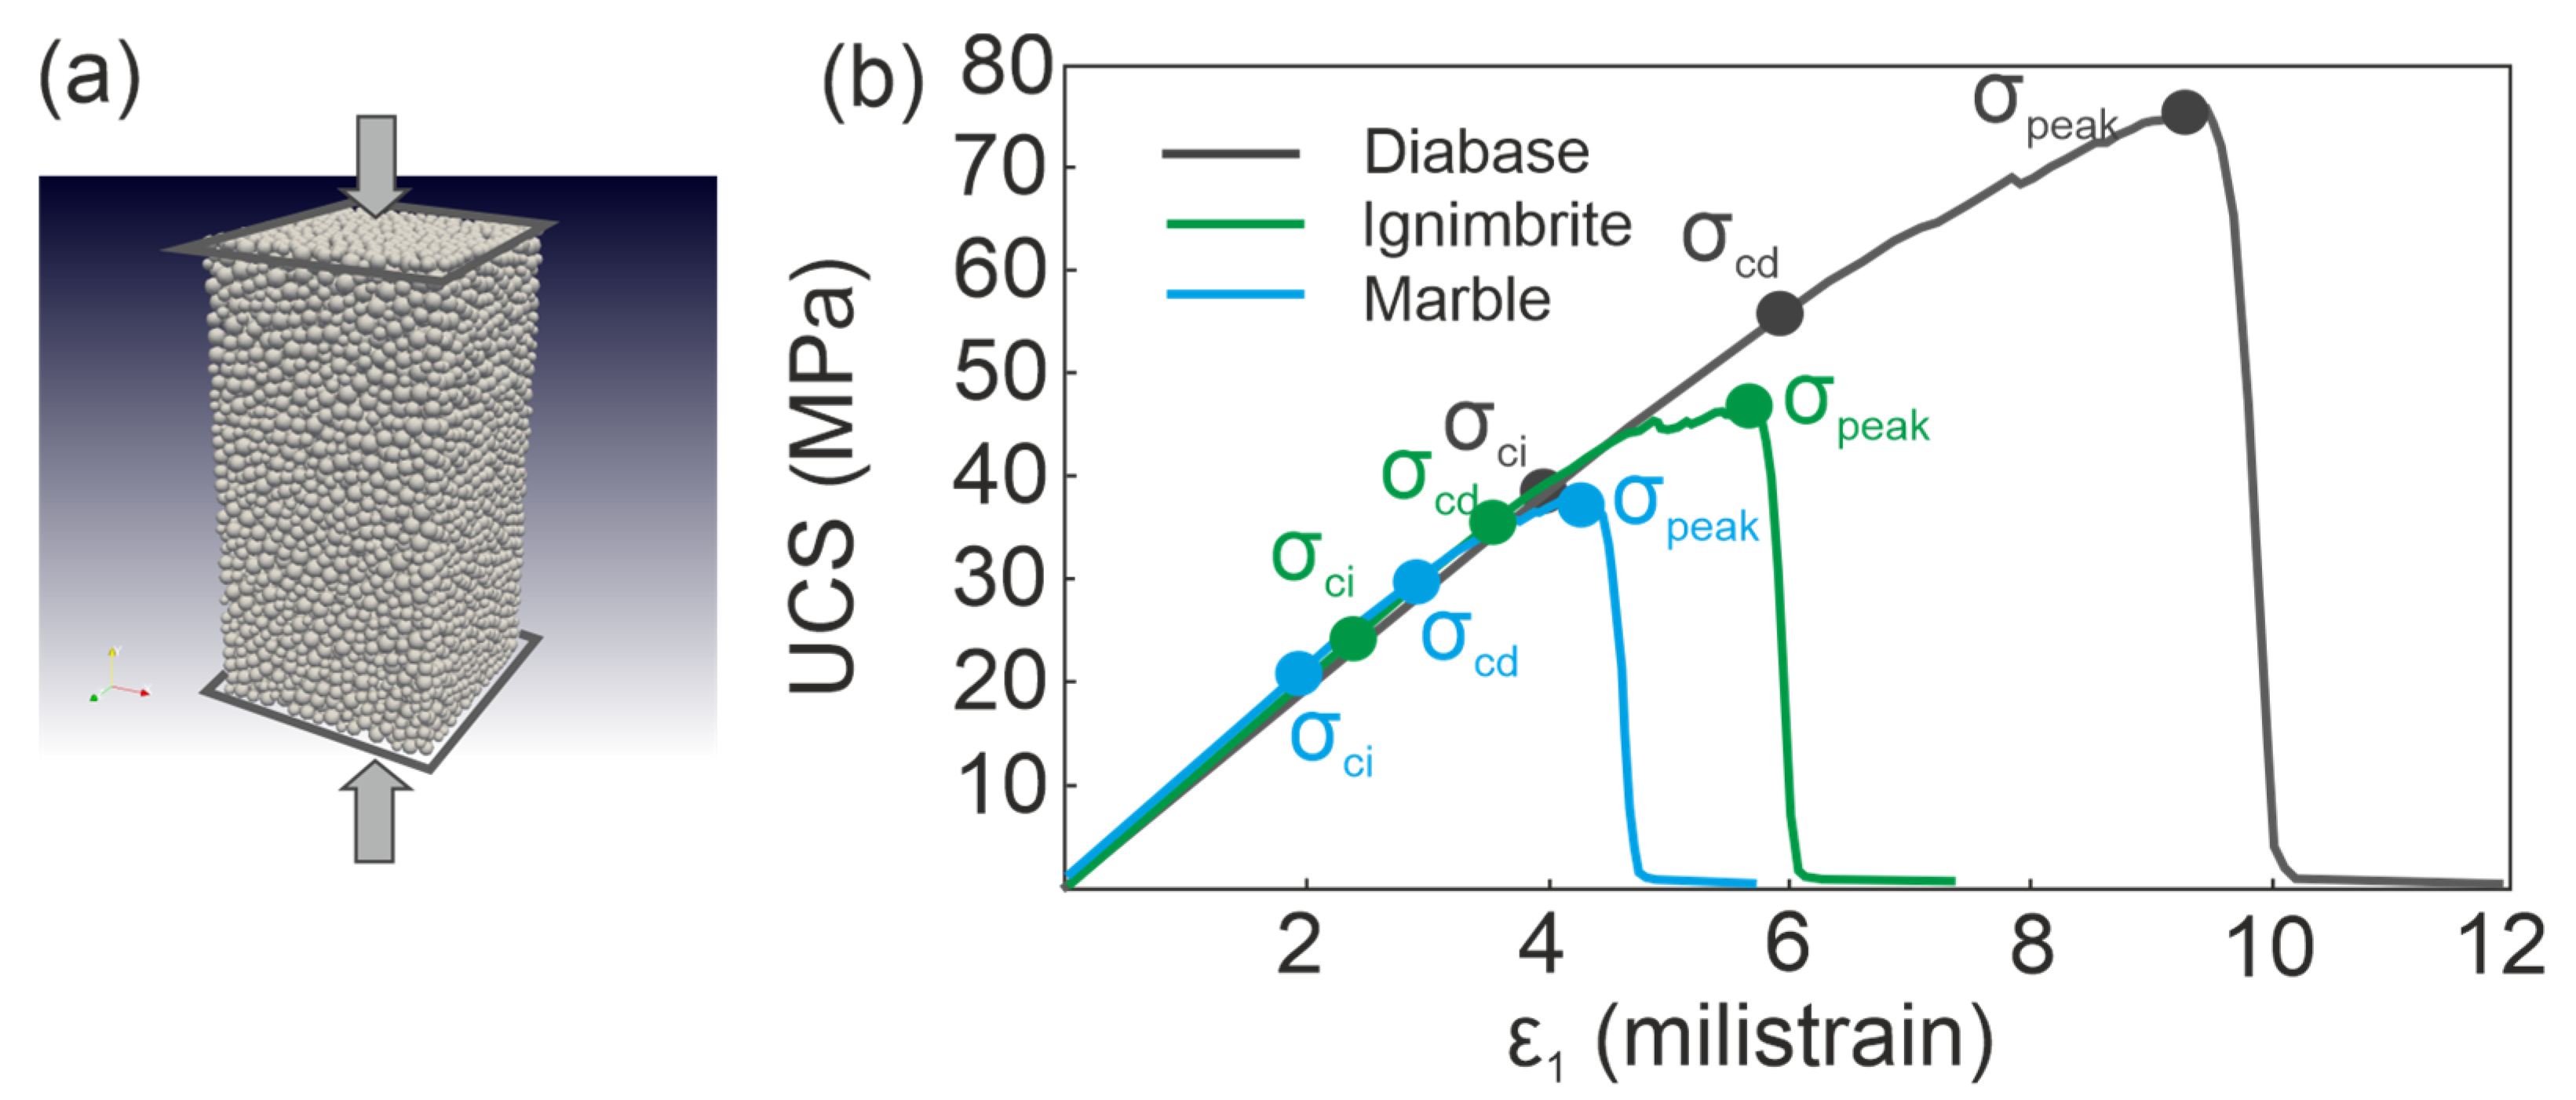
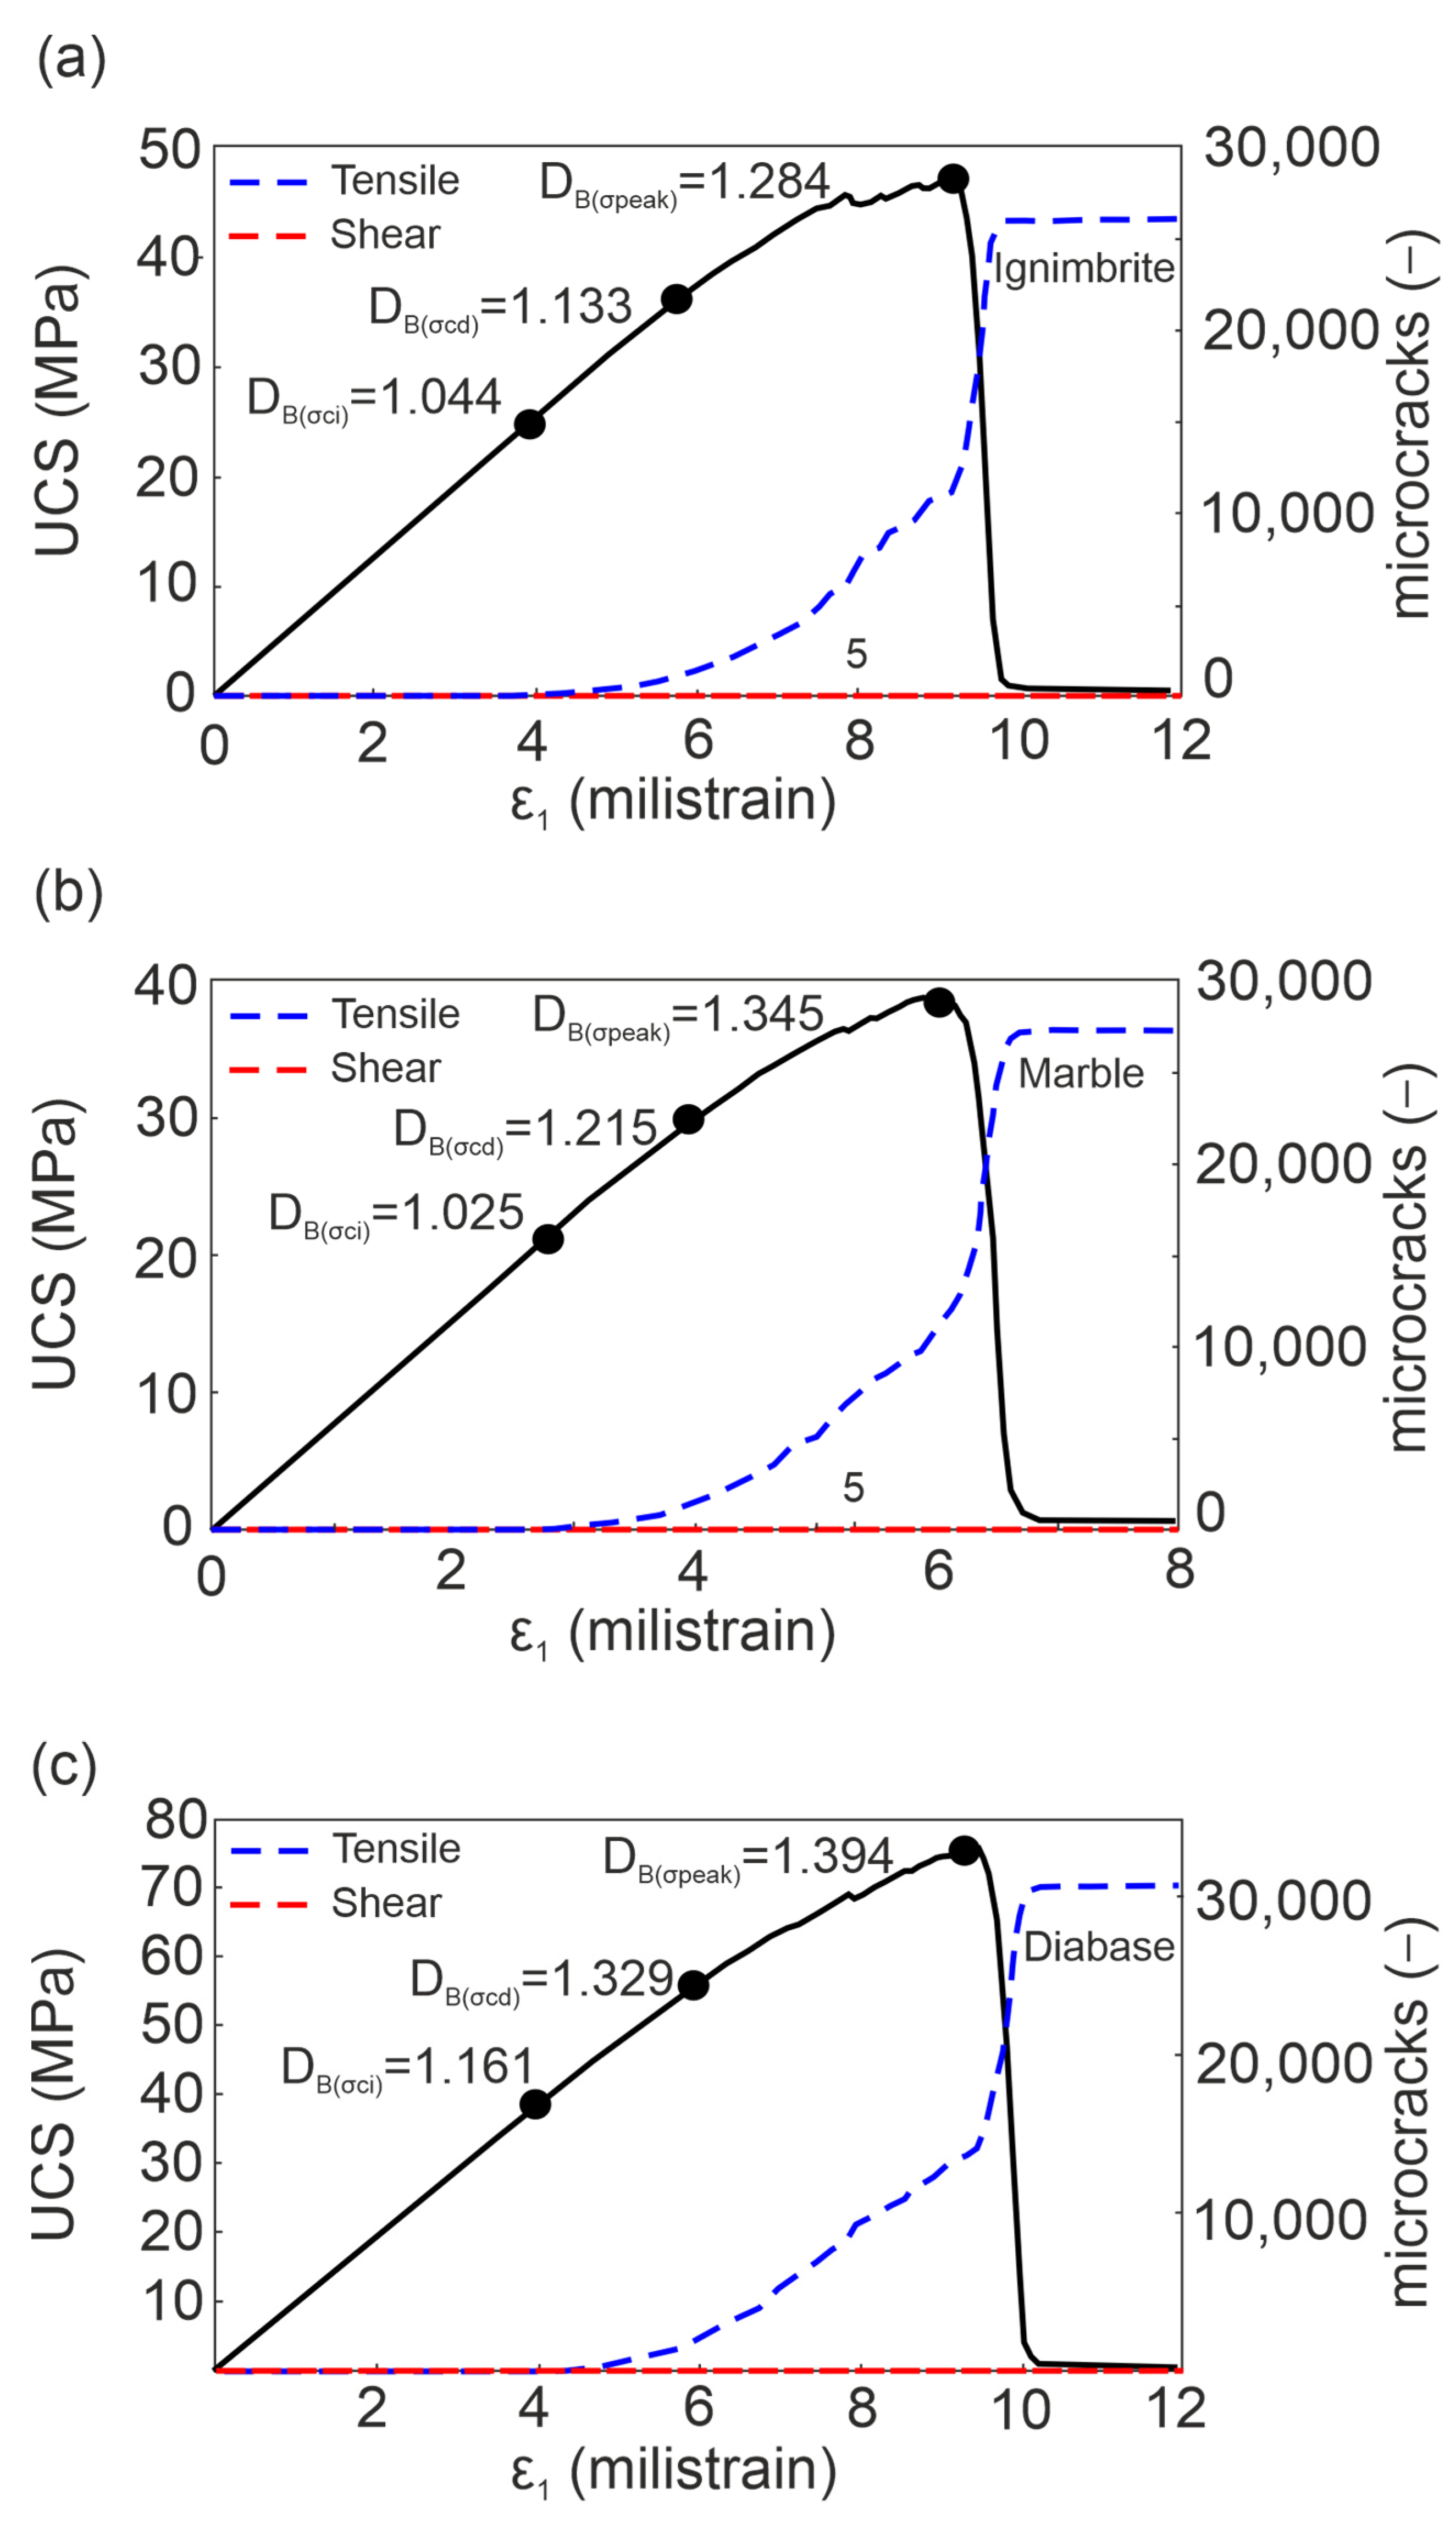
- The 3D DEM model predictions are in good agreement with the laboratory measurements in terms of mechanical parameters. In all DEM samples, the rocks display brittle rock response, and damage is most likely driven by the tensile mechanisms.
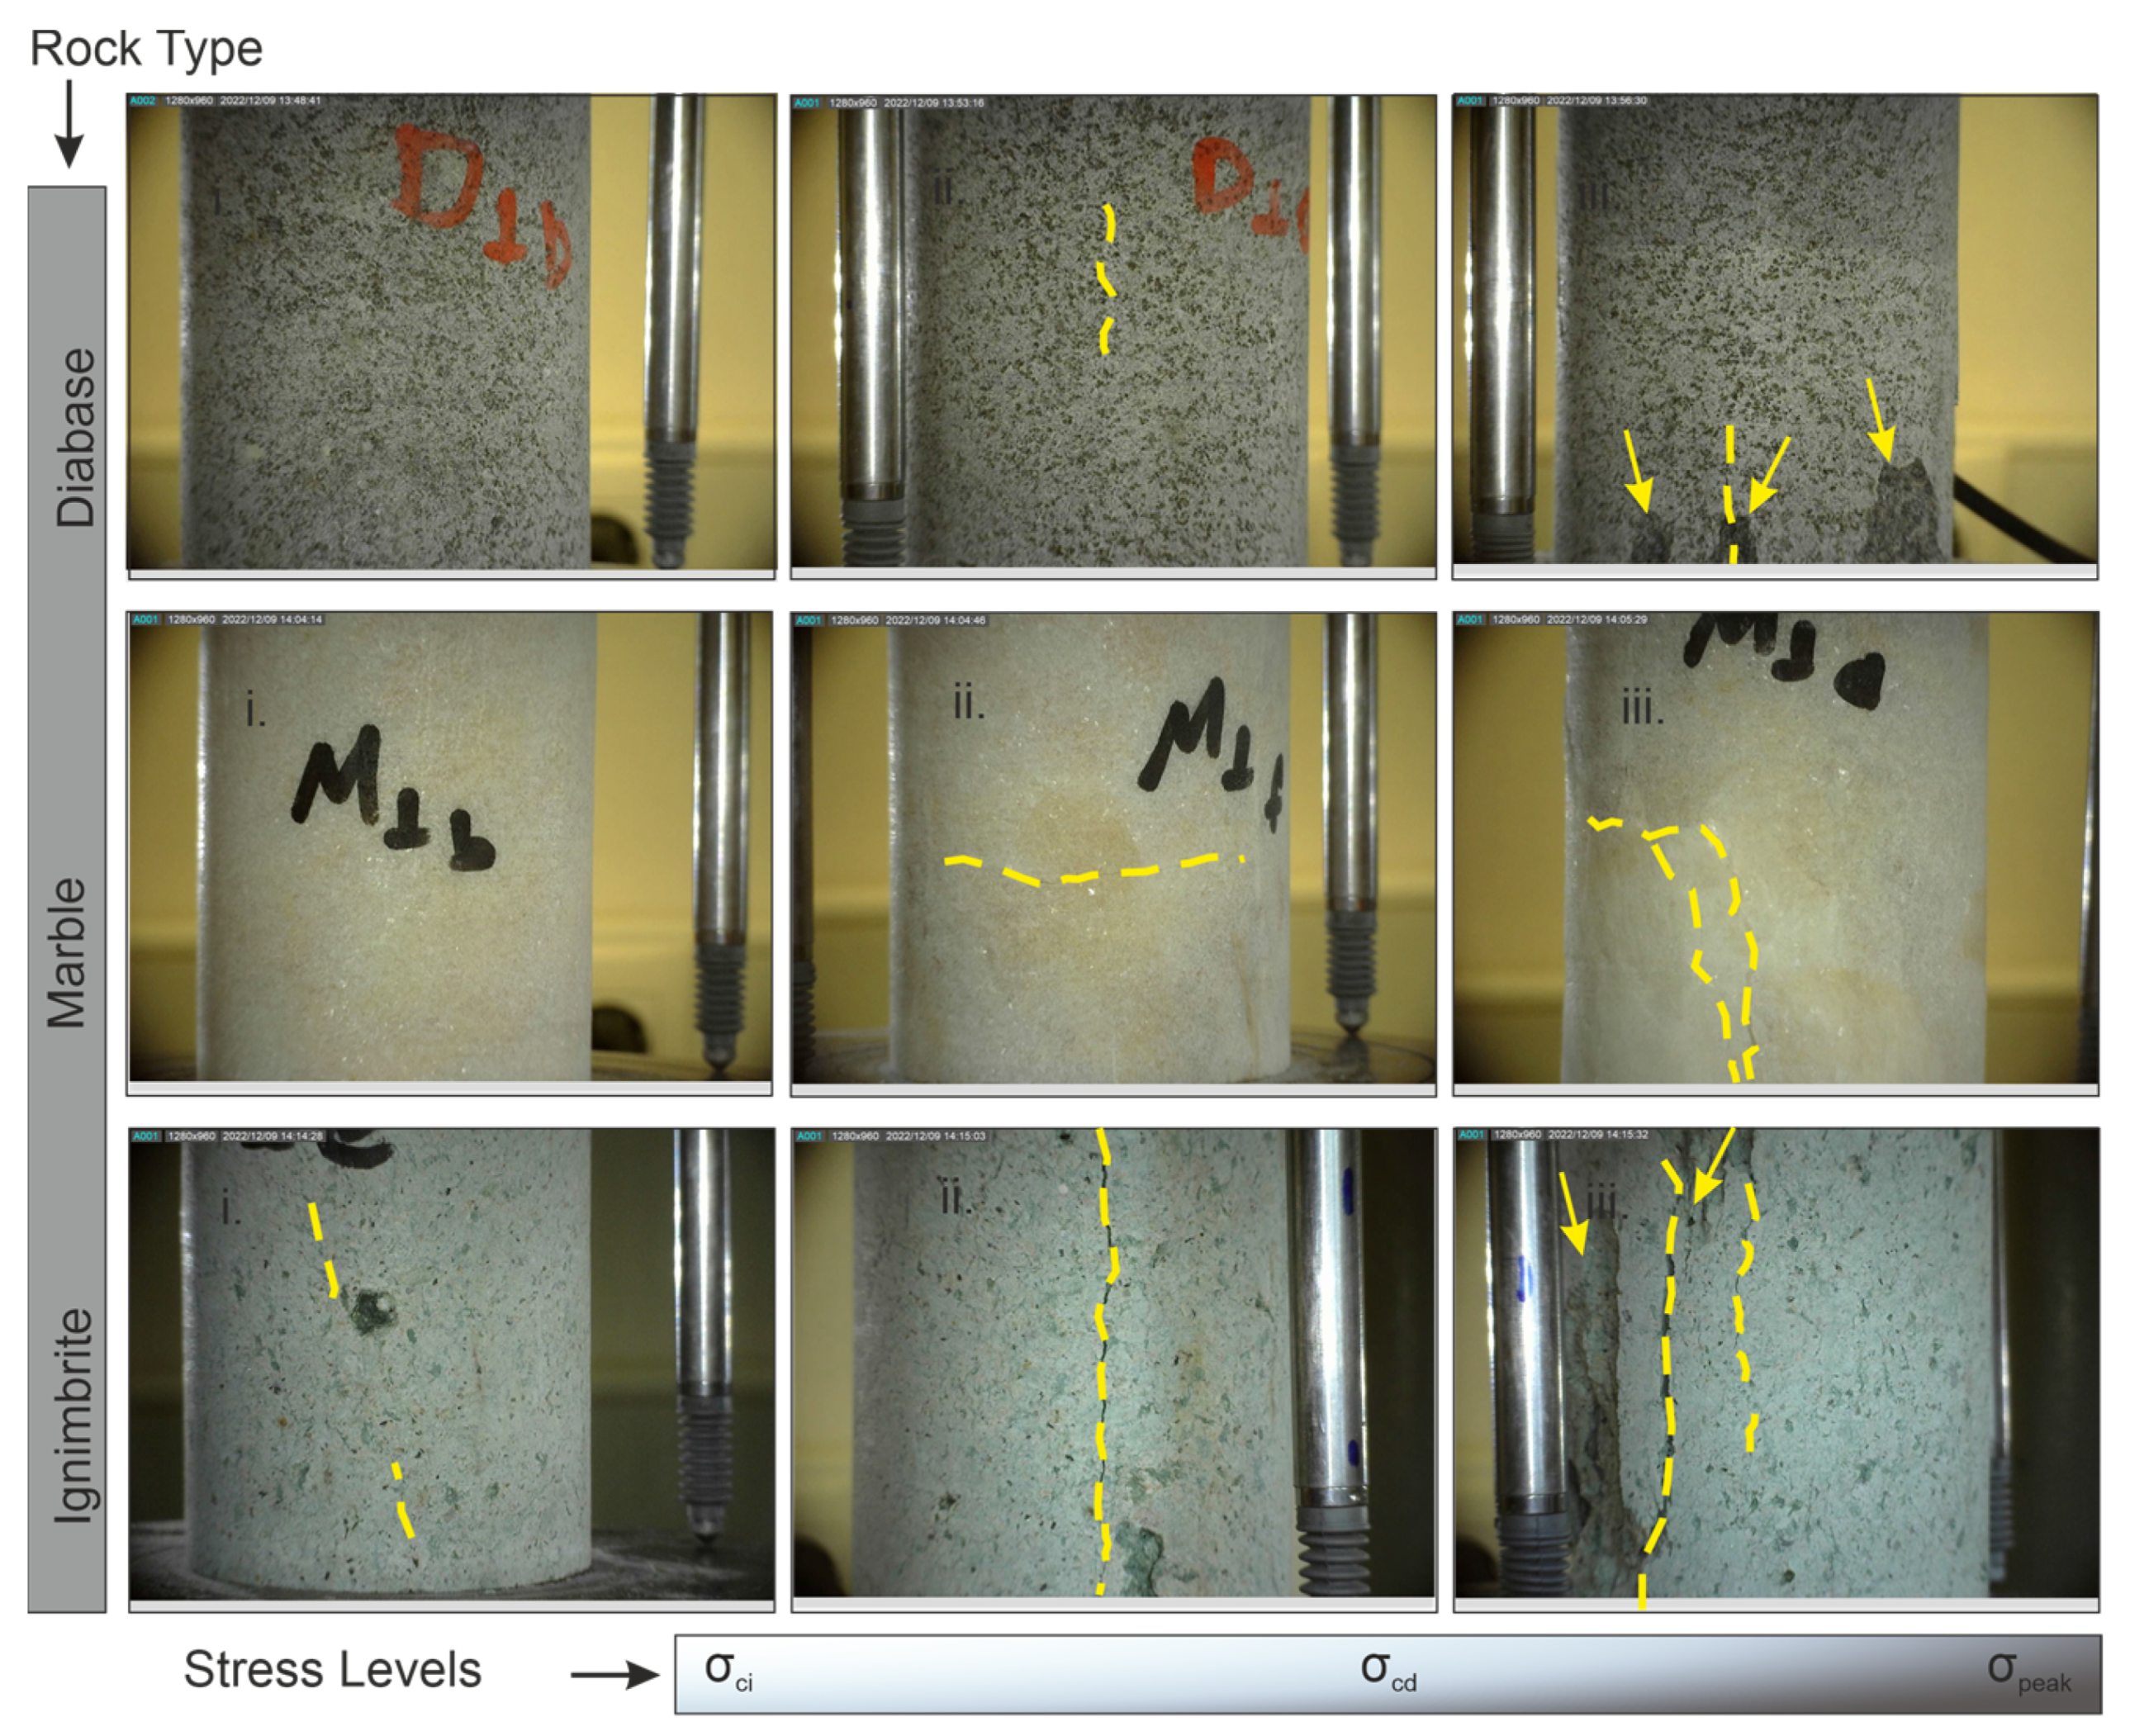
- During the recording of the loading process, the mesoscale cracking patterns could not be detected in marble and diabase by digital cameras, while ignimbrite presented visible crack development. Contrarily, at the microscale (under polarizing and scanning electron microscopes), intensive cracking is mostly detected in marble and diabase.
- In the mineralogical analyses, it is identified that diabase has the hardest minerals, with an equidimensional and interlocking texture. Marble consists only of crystals clamping together. On the other hand, the ignimbrite has a groundmass-dominated texture, and the crystals are dispersed in this groundmass.
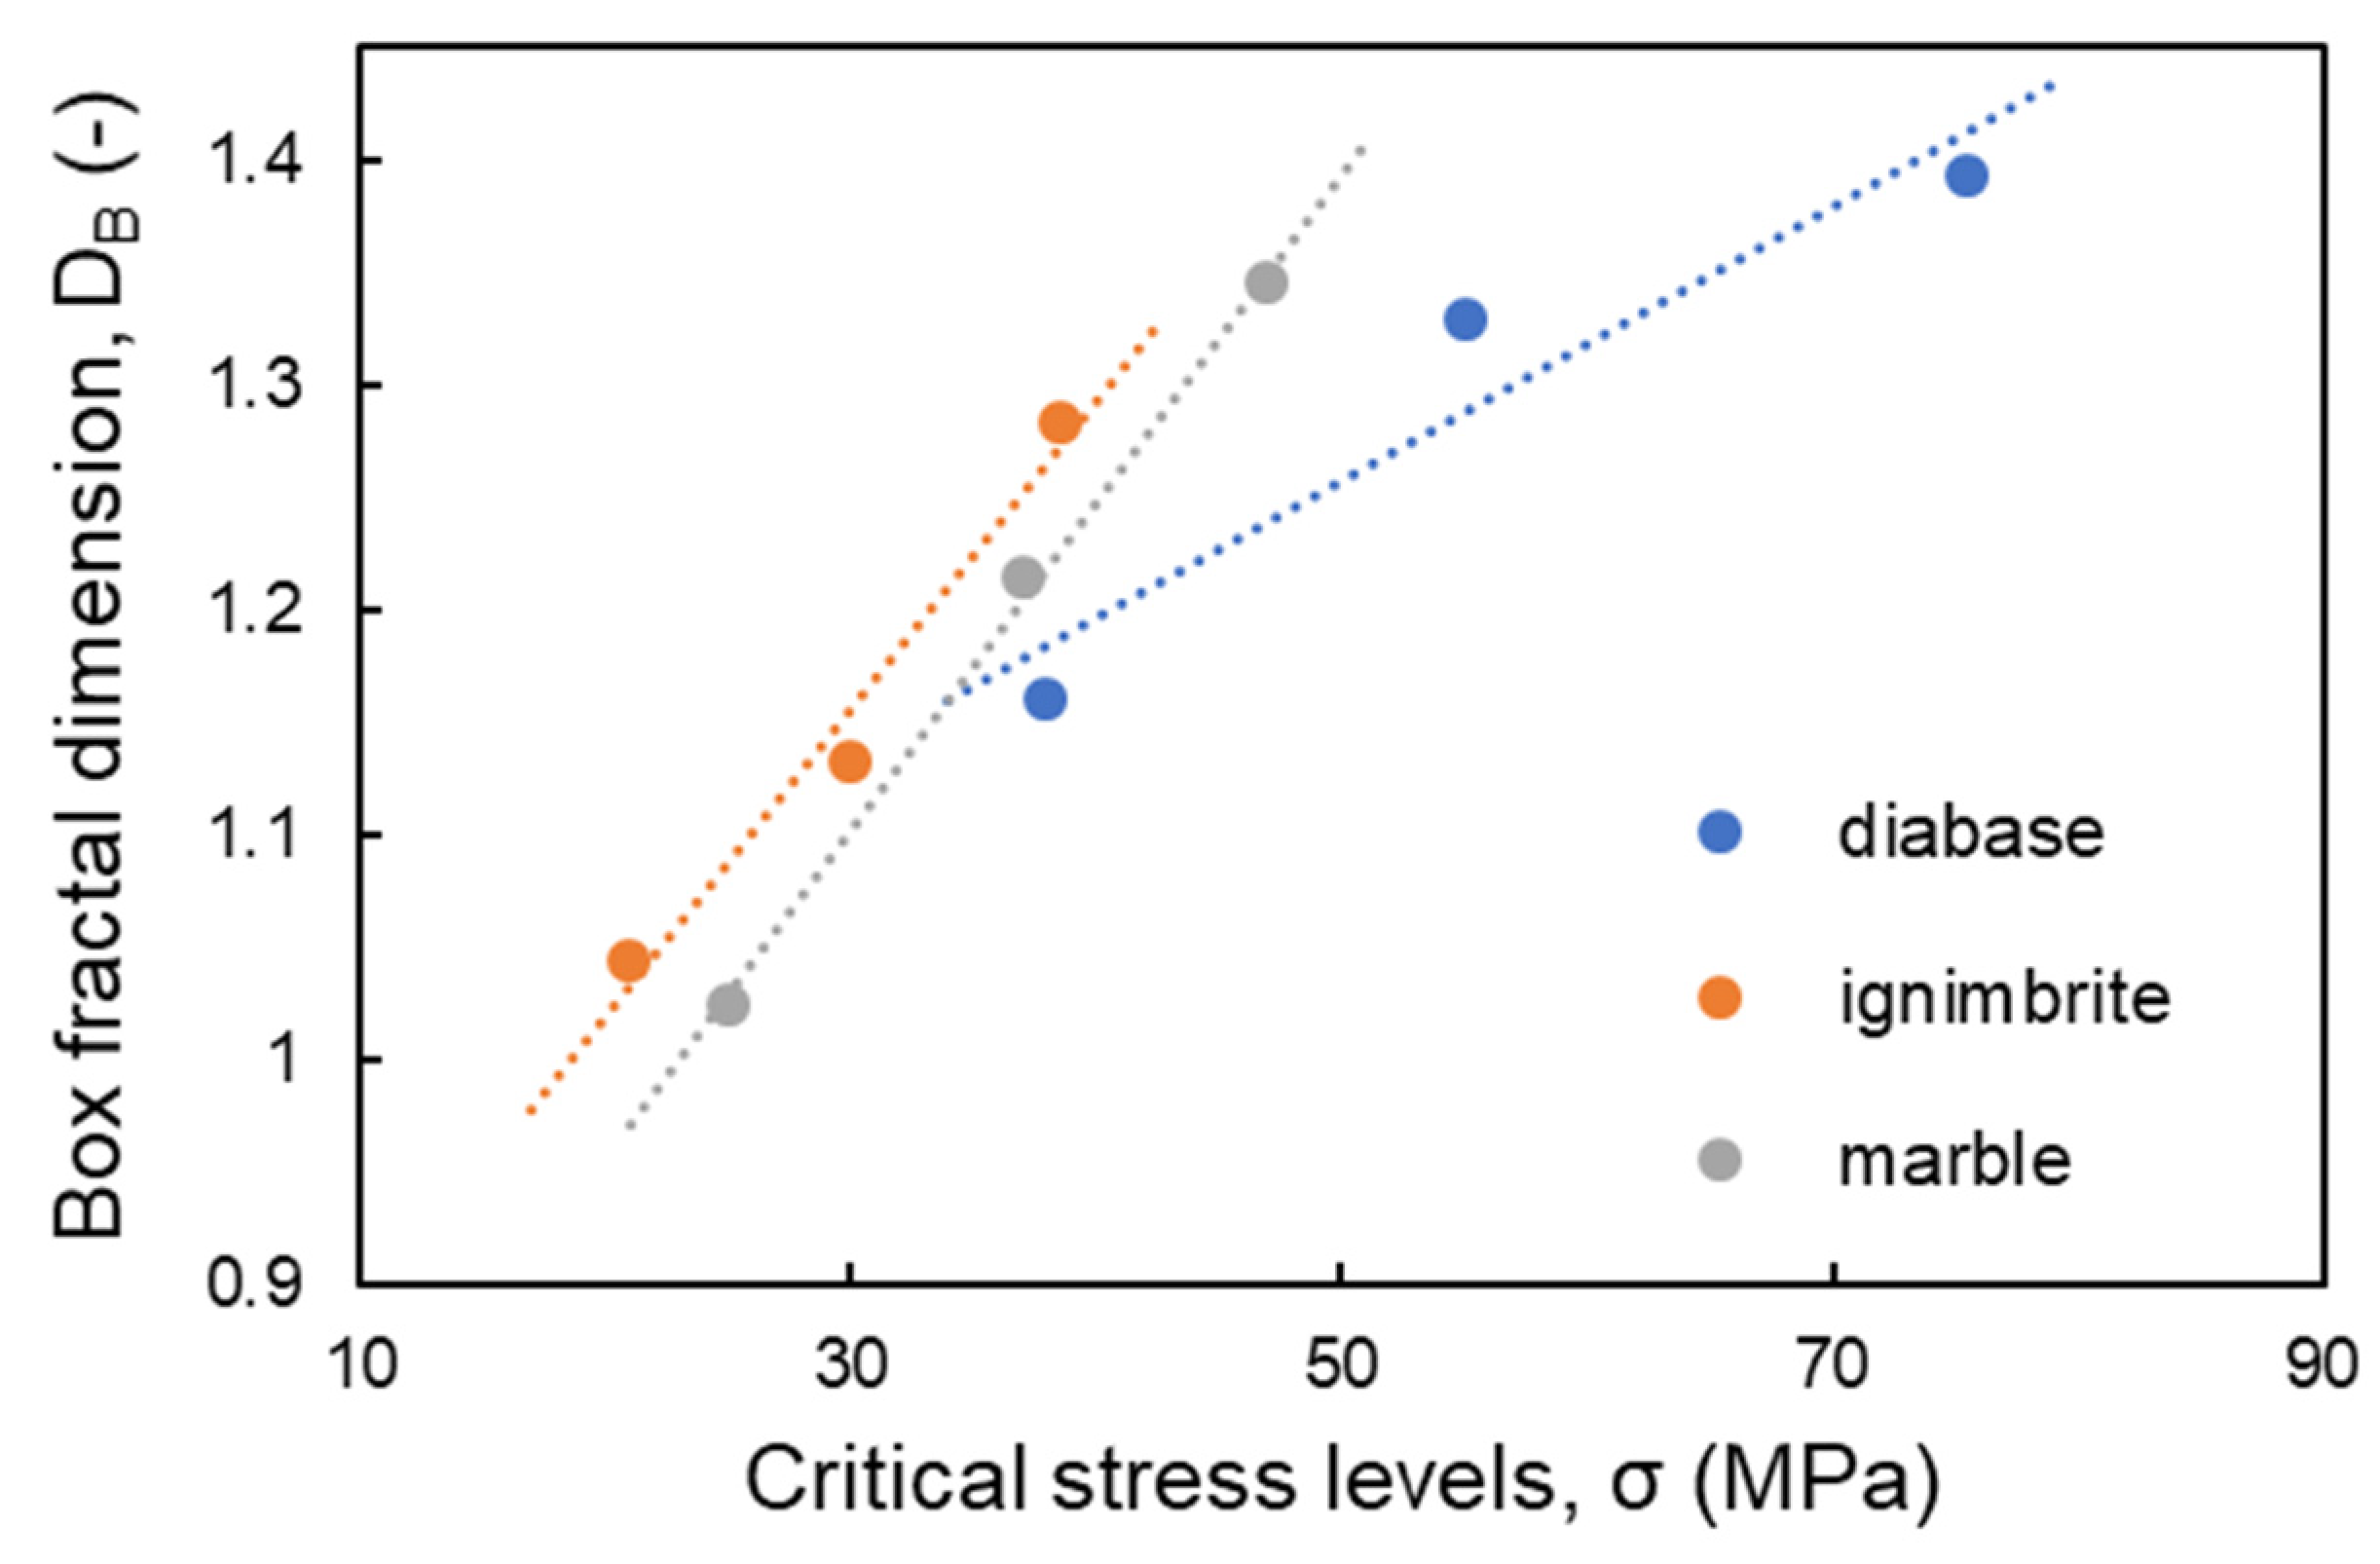
- In all rock types, the DB values increase with increasing critical stress levels (σci, σcd, and σpeak). The diabase has the greatest DB values at all stress levels, demonstrating that it displays the most intensive cracking during the loading due to the hard minerals and interlocking texture.
- Marble is the weakest rock in terms of strength parameters, and it has the lowest DB value at σci stress level. However, marble has a greater DB value than that of ignimbrite once the σcd stress level is reached. This is because the groundmass-dominated texture in ignimbrite controls the rock damage, and it presents a more plastic behavior than the one in crystalline marble after the σcd level.
Author Contributions
Funding
Data Availability Statement
Conflicts of Interest
References
- Griffith, A.A. The Phenomena of Rupture and Flow in Solids. Philos. Trans. R. Soc. A 1921, 221, 163–198. [Google Scholar]
- Hoek, E.; Bieniawski, Z.T. Brittle rock fracture propagation in rock under compression South African Council for scientific and industrial research pretoria. Int. J. Fract. Mech. 1965, 1, 137–155. [Google Scholar] [CrossRef]
- Bieniawski, Z.T. Mechanism of brittle fracture of rock: Part I—Theory of the fracture process. Int. J. Rock Mech. Min. Sci. Geomech. Abstr. 1967, 4, 395–406. [Google Scholar] [CrossRef]
- Lajtai, E.Z. Brittle fracture in compression. Int. J. Fract. 1974, 5, 25–36. [Google Scholar] [CrossRef]
- Tapponnier, P.; Brace, W.F. Development of stress-induced microcracks in Westerly granite. Int. J. Rock Mech. Min. Sci. Geomech. Abstr. 1976, 13, 103–112. [Google Scholar] [CrossRef]
- Horii, H.; Nemat-Nasser, S. Brittle failure in compression: Splitting faulting and brittle-ductile transition. Philos. Trans. R. Soc. A Math. Phys. Eng. Sci. 1986, 319, 337–374. [Google Scholar]
- Martin, C.D.; Chandler, N.A. The progressive fracture of Lac du Bonnet granite. Int. J. Rock Mech. Min. Sci. 1994, 31, 643–659. [Google Scholar] [CrossRef]
- Eberhardt, E.; Stead, D.; Stimpson, B.; Read, R.S. Identifying crack initiation and propagation thresholds in brittle rock. Can. Geotech. J. 1998, 35, 222–233. [Google Scholar] [CrossRef]
- Wong, L.N.; Einstein, H.H. Systematic evaluation of cracking behavior in specimens containing single flaws under uniaxial compression. Int. J. Rock Mech. Min. Sci. 2009, 46, 239–249. [Google Scholar] [CrossRef]
- Renard, F.; Bernard, D.; Jacques Desrues, J.; Ougier-Simonin, A. 3D imaging of fracture propagation using synchrotron X-ray microtomography. Earth Planet. Sci. Lett. 2009, 286, 285–291. [Google Scholar] [CrossRef]
- Renard, F.; Cordonnier, B.; Kobchenko, M.; Kandula, N.; Weiss, J.; Zhu, W. Microscale characterization of rupture nucleation unravels precursors to faulting in rocks. Earth Planet. Sci. Lett. 2017, 476, 69–78. [Google Scholar] [CrossRef]
- McBeck, J.; Ben-Zion, Y.; Renard, F. Predicting fault reactivation and macroscopic failure in discrete element method simulations of restraining and releasing step overs. Earth Planet. Sci. Lett. 2022, 593, 117667. [Google Scholar] [CrossRef]
- Simmons, G.; Richter, D. Microcracks in Rocks. In The Physics and Chemistry of Minerals and Rocks; Strens, R.G.J., Ed.; Wiley: Toronto, ON, Canada, 1976; pp. 105–137. [Google Scholar]
- Kranz, R.L. Microcracks in rocks: A review. Tectonophysics 1983, 100, 449–480. [Google Scholar] [CrossRef]
- Zhao, Y.; Huang, J.; Wang, R. Real-time SEM observations of the microfracturing process in rock during a compression test. Int. J. Rock Mech. Min. Sci. Geomech. Abstr. 1993, 30, 643–652. [Google Scholar] [CrossRef]
- Eberhardt, E.; Stead, D.; Stimpson, B. Quantifying progressive pre-peak brittle fracture damage in rock during uniaxial compression. Int. J. Rock Mech. Min. Sci. 1999, 36, 361–380. [Google Scholar] [CrossRef]
- Howarth, D.F.; Rowlands, J.C. Development of an index to quantify rock texture for qualitative assessment of intact rock properties. Geotech. Test. J. 1986, 9, 169–179. [Google Scholar]
- Howarth, D.F.; Rowlands, J.C. Quantitative assessment of rock texture and correlation with drillability and strength properties. Rock Mech. Rock Eng. 1987, 20, 57–85. [Google Scholar] [CrossRef]
- Fahy, M.P.; Guccione, M.J. Estimating strength of sandstone using petrographic thin-section data. Bull. Int. Assoc. Eng. Geol. 1979, 16, 467–485. [Google Scholar] [CrossRef]
- Shakoor, A.; Bonelli, R.E. Relationship between petrographic characteristics, engineering index properties, and mechanical properties of selected sandstones. Bull. Assoc. Eng. Geol. 1991, 28, 55–71. [Google Scholar] [CrossRef]
- Ulusay, R.; Türeli, K.; Ider, M.H. Prediction of engineering properties of a selected litharenite sandstone from its petrographic characteristics using correlation and multivariate statistical techniques. Eng. Geol. 1994, 38, 135–157. [Google Scholar] [CrossRef]
- Ersoy, A.; Waller, M.D. Textural characterization of rocks. Eng. Geol. 1995, 39, 123–136. [Google Scholar] [CrossRef]
- El Bied, A.; Sulem, J.; Martineau, F. Microstructure of shear zones in Fontainebleau sandstone. Int. J. Rock Mech. Min. Sci. 2002, 39, 917–932. [Google Scholar] [CrossRef]
- Coggan, J.S.; Stead, D.; Howe, J.H.; Faulks, C.I. Mineralogical controls on the engineering behavior of hydrothermally altered granites under uniaxial compression. Eng. Geol. 2013, 160, 89–102. [Google Scholar]
- Özturk, C.A.; Nasuf, E.; Kahraman, S.A. Estimation of rock strength from quantitative assessment of rock texture. J. S. Afr. Inst. Min. Metall. 2014, 114, 471–480. [Google Scholar]
- Ündül, Ö. Assessment of mineralogical and petrographic factors affecting petro-physical properties, strength and cracking processes of volcanic rocks. Eng. Geol. 2016, 210, 10–22. [Google Scholar] [CrossRef]
- Askaripour, M.; Saeidi, A.; Mercier-Langevin, P.; Rouleau, A. A Review of Relationship between Texture Characteristic and Mechanical Properties of Rock. Geotechnics 2022, 2, 262–296. [Google Scholar] [CrossRef]
- Barton, C.C.; Larsen, E. Fractal geometry of two-dimensional fracture networks at Yucca Mountain, southwestern Nevada. In Proceedings of the International Symposium on Fundamentals of Rock Joints, Björkliden, Sweden, 15–20 September 1985; Stephansson, O., Ed.; Centek: Björkliden, Sweden, 1985; pp. 77–84. [Google Scholar]
- Anderson, T.L. Application of fractal geometry to damage development and brittle fracture in materials. Scr. Metall. 1989, 25, 97–102. [Google Scholar] [CrossRef]
- Hirata, T. Fractal dimension of fault systems in Japan: Fractal structure in rock fracture geometry at various scales. Fractals Geophys. 1989, 131, 157–170. [Google Scholar]
- Barton, C.C. Fractal Analysis of Scaling and Spatial Clustering of Fractures. In Fractals in the Earth Sciences; Barton, C.C., La Pointe, P.R., Eds.; Springer Science Business Media: New York, NY, USA, 1995; pp. 141–178. [Google Scholar]
- Berkowitz, B.; Hadad, A. Fractal and multifractal measures of natural and synthetic fracture networks. J. Geophys. Res. Solid Earth 1997, 102, 12205–12218. [Google Scholar] [CrossRef]
- Roy, A.; Perfect, E.; Dunne, W.M.; McKay, L.D. Fractal characterization of fracture networks: An improved box-counting technique. J. Geophys. Res. 2007, 112, B12201. [Google Scholar] [CrossRef]
- Zhao, Y. Crack pattern evolution and a fractal damage constitutive model for rock. Int. J. Rock Mech. Min. Sci. 1998, 35, 349–366. [Google Scholar] [CrossRef]
- Ju, Y.; Xi, C.; Zhang, Y.; Mao, L.; Gao, F.; Xie, H. Laboratory in situ CT observation of the evolution of 3D fracture networks in coal subjected to confining pressures and axial compressive loads: A novel approach. Rock Mech. Rock Eng. 2018, 51, 3361–3375. [Google Scholar] [CrossRef]
- Wang, D.; Zeng, F.; Wei, J.; Zhang, H.; Wu, Y.; Wei, Q. Quantitative analysis of fracture dynamic evolution in coal subjected to uniaxial and triaxial compression loads based on industrial CT and fractal theory. J. Pet. Sci. Eng. 2021, 196, 108051. [Google Scholar] [CrossRef]
- Liu, K.; Zhao, J. Progressive damage behaviours of triaxially confined rocks under multiple dynamic loads. Rock Mech. Rock Eng. 2021, 54, 3327–3358. [Google Scholar] [CrossRef]
- Lai, Y.; Zhao, K.; He, Z.; Yu, X.; Yan, Y.; Li, Q.; Shao, H.; Zhang, X.; Zhou, Y. Fractal characteristics of rocks and mesoscopic fractures at different loading rates. Géomeéch. Energy Environ. 2022, 33, 100431b. [Google Scholar] [CrossRef]
- Nicksiar, M.; Martin, C.D. Evaluation of methods for determining crack initiation in compression tests on low-porosity rocks. Rock Mech. Rock Eng. 2012, 45, 607–617. [Google Scholar] [CrossRef]
- Moradian, Z.; Einstein, H.H.; Ballivy, G. Detection of cracking levels in brittle rocks by parametric analysis of the acoustic emission signals. Rock Mech Rock Eng. 2015, 49, 785–800. [Google Scholar] [CrossRef]
- ASTM. Annual Book of ASTM Standards-Soil and Rock, Building Stones, Section-4, Construction Vol. 04.08; ASTM Publications: Philadelphia, PA, USA, 2000. [Google Scholar]
- Hoek, E.; Carranza-Torres, C.T.; Corkum, B. Hoek–Brown failure criterion—2002 edition. In Proceedings of the Fifth North American Rock Mechanics Symposium, Toronto, ON, Canada, 7–10 July 2002; pp. 267–273. [Google Scholar]
- Smilauer, V.; Catalano, E.; Chareyre, B.; Dorofeenko, S.; Duriez, J.; Dyck, N.; Elias, J.; Er, B.; Eulitz, A.; Gladky, A.; et al. Yade Documentation, 2nd ed.; The Yade Project; Zenodo: Honolulu, HI, USA, 2015. [Google Scholar] [CrossRef]
- Potyondy, D.O.; Cundall, P.A. A bonded-particle model for rock. Int. J. Rock Mech. Min. Sci. 2004, 41, 1329–1364. [Google Scholar] [CrossRef]
- Scholtes, L.; Donze, F.V. A DEM model for soft and hard rocks: Role of grain interlocking on strength. J. Mech. Phys. Solids 2013, 61, 352–369. [Google Scholar] [CrossRef]
- Dinç Göğüş, Ö.D. 3D discrete analysis of damage evolution of hard rock under tension. Arab. J. Geosci. 2020, 13, 661. [Google Scholar] [CrossRef]
- Dinç Göğüş, Ö.; Avşar, E. Stress levels of precursory strain localization subsequent to the crack damage threshold in brittle rock. PLoS ONE 2022, 17, e0276214. [Google Scholar] [CrossRef]
- Whitney, D.L.; Evans, B.W. Abbreviations for names of rock-forming minerals. Am. Min. 2010, 95, 185–187. [Google Scholar] [CrossRef]
- Mandelbrot, B.B. How long is the coast of Britain? Statistical Self-Similarity and Fractal Dimension. Science 1967, 155, 636–638. [Google Scholar] [CrossRef]
- Mandelbrot, B.B.; Passoja, D.E.; Paullay, A.J. Fractal character of fracture surfaces of metals. Nature 1984, 308, 721–722. [Google Scholar] [CrossRef]
- Brown, S.R.; Scholz, C.H. Broad bandwidth study of the topography of natural rock surfaces. J. Geophys. Res. 1985, 90, 575–582. [Google Scholar] [CrossRef]
- Carr, J.R.; Warriner, J.B. Rock mass classification using fractal dimension. In Proceedings of the 28th US Rock Mechanics Symposium, Tucson, AZ, USA, 29 June–1 July 1987; Balkema: Rotterdam, The Netherlands, 1987; pp. 73–80. [Google Scholar]
- Turk, N.; Greig, M.J.; Dearman, W.R.; Amin, F.F. Characterization of rock joint surfaces by fractal dimension. In Proceedings of the 28th US Rock Mechanics Symposium, Tucson, AZ, USA, 29 June–1 July 1987; Balkema: Rotterdam, The Netherlands, 1987; pp. 1223–1236. [Google Scholar]
- Lee, Y.H.; Carr, J.R.; Barr, D.J.; Haas, C.J. The fractal dimension as a measure of the roughness of rock discontinuity profiles. Int. J. Rock Mech. Min. Sci. Geomech. Abstr. 1990, 27, 453–464. [Google Scholar] [CrossRef]
- Power, W.L.; Tullis, T.E. Euclidean and fractal models for the description of rock surface roughness. J. Geophys. Res. 1991, 96, 415–424. [Google Scholar] [CrossRef]
- Sakellariou, M.; Nakosi, B.; Mitsakaki, C. On the fractal character of rock surfaces. Int. J. Rock Mech. Min. Sci. Geomech. Abstr. 1991, 28, 527–533. [Google Scholar] [CrossRef]
- Odling, N.E. Natural fracture profiles, fractal dimension and joint roughness coefficients. Rock Mech. Rock Eng. 1994, 27, 135–153. [Google Scholar] [CrossRef]
- Develi, K.; Babadagli, T. Quantification of natural fracture surfaces using fractal geometry. Math. Geol. 1998, 30, 971–998. [Google Scholar] [CrossRef]
- Develi, K.; Babadagli, T. Experimental and visual analysis of single-phase flow through rough fracture replicas. Int. J. Rock Mech. Min. Sci. 2015, 73, 139–155. [Google Scholar] [CrossRef]
- Fardin, N.; Stephansson, O.; Jing, L. The scale dependence of rock joint surface roughness. Int. J. Rock Mech. Min. Sci. 2001, 38, 659–669. [Google Scholar] [CrossRef]
- Jiang, Y.; Li, B.; Tanabashi, Y. Estimating the relation between surface roughness and mechanical properties of rock joints. Int. J. Rock Mech. Min. Sci. 2006, 43, 837–846. [Google Scholar] [CrossRef]
- Develi, K. Computation of direction dependent joint surface parameters through the algorithm of triangular prism surface area method: A theoretical and experimental study. Int. J. Solids Struct. 2020, 202, 895–911. [Google Scholar] [CrossRef]
- Avşar, E. An experimental investigation of shear strength behavior of a welded bimrock by meso-scale direct shear tests. Eng. Geol. 2021, 294, 106321. [Google Scholar] [CrossRef]
- Chiles, J.P. Fractal and geostatistical methods for modeling of a fracture network. Math. Geol. 1988, 20, 631–654. [Google Scholar] [CrossRef]
- Odling, N.E. Network properties of a two-dimensional natural fracture pattern. Pure Appl. Geophys. 1992, 138, 95–114. [Google Scholar] [CrossRef]
- Gillespie, P.A.; Howard, C.B.; Walsh, J.J.; Watterson, J. Measurement and characterisation of spatial distribution of fractures. Tectonophysics 1993, 226, 113–141. [Google Scholar] [CrossRef]
- Walsh, J.J.; Watterson, J. Fractal analysis of fracture pattern using the standard box-counting technique: Valid and invalid methodologies. J. Struct. Geol. 1993, 15, 1509–1512. [Google Scholar] [CrossRef]
- Mandelbrot, B.B. The Fractal Geometry of Nature; Freeman: San Francisco, CA, USA, 1982; p. 468. [Google Scholar]
- Feder, J. Fractals; Plenum Press: New York, NY, USA, 1988; 283p. [Google Scholar]
- Barton, C.C.; La Pointe, P.R. Fractals in the Earth Sciences; Springer Science Business Media: New York, NY, USA, 1995; 265p. [Google Scholar]
- Yaohui, W.; Tingjie, L. The Fractal Characteristics of Micro-cracks in Rock under Uniaxial Compression. In Proceedings of the ISRM International Symposium—2nd Asian Rock Mechanics Symposium, Beijing, China, 11–14 September 2001. [Google Scholar]
- Yılmaz, N.G.; Goktan, R.M.; Kibici, Y. An investigation of the petrographic and physico mechanical properties of true granites influencing diamond tool wear performance, and development of a new wear index. Wear 2011, 271, 960–969. [Google Scholar] [CrossRef]


| Parameter | Diabase | Marble | Ignimbrite |
|---|---|---|---|
| Elastic modulus Y (GPa) | 13 | 12 | 10 |
| Stiffness ratio P (−) | 0.4 | 0.4 | 0.4 |
| Micro tensile strength t (MPa) | 11 | 7 | 9 |
| Micro cohesion c (MPa) | 77 | 56 | 74 |
| Micro internal friction angle φ (°) | 1 | 1 | 1 |
| Coordination number N (−) | 10 | 9 | 9 |
| Rock Type | Method | UCS (MPa) | UTS (MPa) | E (GPa) | ν (−) |
|---|---|---|---|---|---|
| Diabase | LAB | 72.57 ± 9.68 | 9.14 ± 1.15 | 10.88 ± 1.46 | 0.25 |
| DEM | 75.5 | 9.2 | 9.68 | 0.15 | |
| Ignimbrite | LAB | 54.41 ± 7.67 | 6.67 ± 0.78 | 7.23 ± 1.07 | 0.15 |
| DEM | 47 | 6.53 | 6.4 | 0.13 | |
| Marble | LAB | 41.46 ± 7.03 | 4.85 ± 0.43 | 8.32 ± 1.79 | 0.14 |
| DEM | 38.5 | 5.1 | 7.5 | 0.13 |
| Stress Levels (MPa) | Diabase | Marble | Ignimbrite |
|---|---|---|---|
| σci | 38 | 21 | 25 |
| σcd | 55 | 30 | 37 |
| σpeak | 75.5 | 38.5 | 47 |
Disclaimer/Publisher’s Note: The statements, opinions and data contained in all publications are solely those of the individual author(s) and contributor(s) and not of MDPI and/or the editor(s). MDPI and/or the editor(s) disclaim responsibility for any injury to people or property resulting from any ideas, methods, instructions or products referred to in the content. |
© 2023 by the authors. Licensee MDPI, Basel, Switzerland. This article is an open access article distributed under the terms and conditions of the Creative Commons Attribution (CC BY) license (https://creativecommons.org/licenses/by/4.0/).
Share and Cite
Dinç Göğüş, Ö.; Avşar, E.; Develi, K.; Çalık, A. Quantifying the Rock Damage Intensity Controlled by Mineral Compositions: Insights from Fractal Analyses. Fractal Fract. 2023, 7, 383. https://doi.org/10.3390/fractalfract7050383
Dinç Göğüş Ö, Avşar E, Develi K, Çalık A. Quantifying the Rock Damage Intensity Controlled by Mineral Compositions: Insights from Fractal Analyses. Fractal and Fractional. 2023; 7(5):383. https://doi.org/10.3390/fractalfract7050383
Chicago/Turabian StyleDinç Göğüş, Özge, Elif Avşar, Kayhan Develi, and Ayten Çalık. 2023. "Quantifying the Rock Damage Intensity Controlled by Mineral Compositions: Insights from Fractal Analyses" Fractal and Fractional 7, no. 5: 383. https://doi.org/10.3390/fractalfract7050383
APA StyleDinç Göğüş, Ö., Avşar, E., Develi, K., & Çalık, A. (2023). Quantifying the Rock Damage Intensity Controlled by Mineral Compositions: Insights from Fractal Analyses. Fractal and Fractional, 7(5), 383. https://doi.org/10.3390/fractalfract7050383