Article

Parameters Identification and Numerical Simulation for a Fractional Model of Honeybee Population Dynamics †

1
Department of Informational Modeling, Institute of Mathematics and Informatics, Bulgarian Academy of Sciences, 1113 Sofia, Bulgaria
2
Department of Applied Mathematics and Statistics, Faculty of Natural Sciences and Education, University of Ruse, 7004 Ruse, Bulgaria
*
Author to whom correspondence should be addressed.
This is an extended version of our conference paper “Georgiev, S.G.; Vulkov, L.G. Parameter identification approach for a fractional dynamics model of honeybee population. In Lecture Notes in Computer Science; Springer: Cham, Switzerland, 2022; Volume 13127, pp. 40–48”.
Fractal Fract. 2023, 7(4), 311; https://doi.org/10.3390/fractalfract7040311
Submission received: 15 February 2023 / Revised: 21 March 2023 / Accepted: 29 March 2023 / Published: 4 April 2023

Abstract

:
In order to investigate the honeybee population dynamics, many differential equation models were proposed. Fractional derivatives incorporate the history of the honeybee population dynamics. We numerically study the inverse problem of parameter identification in models with Caputo and Caputo–Fabrizio differential operators. We use a gradient method of minimizing a quadratic cost functional. We analyze and compare results for the integer (classic) and fractional models. The present work also contains discussion on the efficiency of the numerical methods used. Computational tests with realistic data were performed and are discussed.

1. Introduction

In recent years, honeybee losses were reported in many countries such as the USA, China, Israel, Turkey, and in European countries, especially, Bulgaria [1]. The disruption of pollination causes serious problems in economics, agriculture and ecology.
The honey bees Apis mellifera are the main contributors to pollination, and the global loss of honeybees leads to disruption of pollination, which, thus, causes serious difficulties in economics, agriculture and ecology [2,3]. The leading factor for the loss of honeybees has not yet been discovered, but it has been found that an ensemble of stressors cause a colony to collapse. Some of the main reasons are infections by viruses, such as Nosema ceranae, Varroa mite [4], the use of pesticides [5], food shortages [6] and severe weather conditions [7].
Colonies of honeybees have been declining for over a decade [8]. Colony losses are due to a combination of stressors [8,9], but the presence of Varroa mites is considered one of the most important factors [10].
Mathematical models have been widely used to examine and predict the dynamics of honeybee population. The paper [11] presents a review of recent progress in mathematical modeling of honeybee colony population dynamics, since the review in [12]. In the latter, models, studying different stress factors which lead to further colony collapse were reviewed. In a recent paper [11], though, the models were divided on the basis of age structure, nutritional effects, pathogens, etc. The common trait between the existing models is that they were derived on the base of the classical (integer) derivative. Their potential to identify different factors causing colony losses are discussed.
On the other hand, fractional-order models have been recognized as a powerful mathematical tool to study anomalous behavior observed in many physical processes with prominent memory and hereditary properties. Thanks to the memory effect, which represents an advantage of the fractional derivative compared to the ordinary derivative, the theory and the application of fractional calculus have been widely used to model dynamic processes in the fields of science, engineering and many others. The last decades, especially, have seen a rapid development, both in theory and applications, of fractional ordinary differential equations, as in, for example,  [13,14,15,16,17], and the application of fractional-order derivatives in biological phenomena [18,19]. However, to our knowledge, literature dedicated to modeling honeybee population dynamics via fractional-order derivatives is quite scarce. For instance, to investigate the causes of colony collapse, the author of [20] proposed a fractional honeybee colony population model. We adopted this model to demonstrate the solution approach to the inverse parameter reconstruction problem.
The rest of this paper is structured as follows. In the next section, the necessary fractional calculus background is mentioned. In Section 3, the direct and inverse problems are formulated and interpreted. The numerical methods used to solve the direct problems are described in Section 4, while the adjoint equation optimization method, for solving the inverse problems, is presented in detail in Section 5, which is the main novelty of the study. The simulation results are discussed in Section 6 and the paper is concluded in Section 7.
This work is an extended version of the LSSC’21 conference paper [21]. There, the Caputo derivative model in the special case was studied when the identified parameters were p = { m , n , α , σ , ω } and they were raised to the power of one at the right hand-side of the system (3). Obviously, the current study extends the latter in two ways. Firstly, the coefficients at the right hand-side of the model system are raised to the poser of the fractional derivation, which is more meaningful, due to the preservation of the physical unit. Secondly, an investigation with the Caputo–Fabrizio fractional derivative is performed.
The main advantages of the application of the Caputo–Fabrizio derivative in the present context are two. To begin with, the smooth, non-singular kernel makes the numerical treatment easier. The mathematical expressions, derived from the Caputo derivative, are often cumbersome and tedious to derive. The Caputo–Fabrizio derivative is suitable for both temporal and spatial variables. The consequent formulae exhibit simplifications, which also make the analytical treatment lighter as well. What is more, the application of the Caputo derivative is more appropriate when the model is related to “plasticity, fatigue, damage and with electromagnetic hysteresis”. Otherwise, it is useful to employ the Caputo–Fabrizio derivative [22].

2. Fractional Calculus Background

In this section some basic definitions and results from fractional calculus are introduced.

2.1. Caputo Derivative

For any function ν AC [ 0 , T ] , i.e., ν is absolutely continuous on [ 0 , T ] , we define the left (forward) Riemann–Liouville integral for p [ 0 , 1 ] [15]:
J 0 + p ν ( t ) : = { ν ( t ) , p = 0 , 1 Γ ( p ) 0 t ν ( s ) ( t s ) 1 p d s , 0 < p 1 , t [ 0 , T ) .
Then, the left (forward) Caputo derivative, as defined above, could be expressed in this way:
D C 0 p ν ( t ) = J 0 + 1 p d ν d t ( t ) = 1 Γ ( 1 p ) 0 t 1 ( t s ) p d ν d t ( s ) d s .
The left (forward) Riemann–Liouville derivative is defined as
D R 0 p ν ( t ) = d d t J 0 + 1 p ν ( t ) = 1 Γ ( 1 p ) d d t 0 t ν ( s ) ( t s ) p d s .
The right (backward) integral is defined as
J T p ν ( t ) : = { ν ( t ) , p = 0 , 1 Γ ( p ) t T ν ( s ) ( s t ) 1 p d s , 0 < p 1 , t ( 0 , T ] ,
and, further, we define the right (backward) Caputo derivative as
D C T p ν ( t ) = J T 1 p d ν d t ( t ) = 1 Γ ( 1 p ) t T 1 ( s t ) p d ν d t ( s ) d s .
D R T p ν ( t ) = d d t J T 1 p ν ( t ) = 1 Γ ( 1 p ) d d t t T 1 ( s t ) p ν ( s ) d s .
There exists a relationship between the Caputo and Riemann–Liouville forward and backward derivatives
D C 0 p f ( t ) = D R 0 p f ( t ) f ( 0 ) Γ ( 1 p ) t p , t ( 0 , T ] ,
D C T p f ( t ) = D R T p f ( t ) f ( T ) Γ ( 1 p ) ( T t ) p , t ( 0 , T ] .
For later use, we recall the following version of integration by parts, see e.g., [15].
Lemma 1. 
Let ν 1 ( t ) , ν 2 ( t ) C 1 [ 0 , T ] . Then
0 T D C 0 p ν 1 ν 2 d t + ν 1 ( 0 ) J T 1 p ν 2 ( 0 ) = 0 T ν 1 D C T p ν 2 d t + J T 1 p ν 1 ( T ) ν 2 ( T ) .
We use the generalized mean value formula (GMF) in the following form [15]. Suppose f ( t ) C [ a , b ] and D 0 p f ( t ) C [ a , b ] for 0 < p 1 , then we have
f ( t ) = f ( 0 ) + 1 Γ ( p ) D 0 p f ( ξ ) t p with 0 ξ t , t [ a , b ] .
It is clear from this formula that if D 0 p f ( t ) 0 t ( a , b ) , then the function f ( t ) is nondecreasing for each t [ a , b ] , and if D 0 p f ( t ) 0 t ( a , b ) , then the function f ( t ) is nonincreasing t [ a , b ] .

2.2. Caputo–Fabrizio Derivative

In recent years, the results of many papers have demonstrated that fractional models describe natural phenomena in an accurate and systematic way, which is better than the classic integer-order counterparts ordinary time derivatives; see, for example, [23,24]. However, in some cases, a satisfactory duration may not be achieved in whole time duration due to the singularity in the traditional (namely, Caputo’s) kernel; see, for example, [22]. This is one of the reasons the Caputo–Fabrizio derivative was used in [20].
Similarly to the Caputo case, if  ν AC [ 0 , T ] , then for p [ 0 , 1 ] we define the left (forward) Caputo–Fabrizio derivative in the Caputo and Riemann senses, respectively, as follows [22]:
D CFC 0 p ν ( t ) = M ( p ) 1 p 0 t exp p 1 p ( t s ) d ν d t ( s ) d s , D CFR 0 p ν ( t ) = M ( p ) 1 p d d t 0 t exp p 1 p ( t s ) ν ( s ) d s ,
where M ( p ) is a normalization function such that M ( 0 ) = M ( 1 ) = 1 .
Analogously, the right (backward) Caputo–Fabrizio derivative is defined as
D CFC T p ν ( t ) = M ( p ) 1 p t T exp p 1 p ( s t ) d ν d t ( s ) d s , D CFR T p ν ( t ) = M ( p ) 1 p d d t t T exp p 1 p ( s t ) ν ( s ) d s .
The relationship between the Caputo and Riemann senses of the Caputo–Fabrizio forward and backward derivatives is
D CFC 0 p f ( t ) = D CFR 0 p f ( t ) M ( p ) 1 p exp p 1 p t , t ( 0 , T ] , D CFC T p ν ( t ) = D CFR T p ν ( t ) M ( p ) 1 p exp p 1 p ( T t ) , t ( 0 , T ] .
In order to derive the integration by parts for the Caputo–Fabrizio derivative, we introduce the Caputo–Fabrizio fractional integrals [25]:
J 0 + p ν CF ( t ) : = 1 p M ( p ) ν ( t ) + p M ( p ) 0 t ν ( s ) d s , J T p ν CF ( t ) : = 1 p M ( p ) ν ( t ) + p M ( p ) t T ν ( s ) d s .
Now, we state the Caputo–Fabrizio integration by parts:
Lemma 2. 
Let ν 1 ( t ) , ν 2 ( t ) C 1 [ 0 , T ] . Then
0 T D CFC 0 p ν 1 ν 2 d t + M ( p ) 1 p ν 1 ( 0 ) 0 T exp p 1 p t ν 2 d t =                            0 T ν 1 D CFC T p ν 2 d t + M ( p ) 1 p ν 2 ( T ) 0 T exp p 1 p ( T t ) ν 1 d t .
The generalized mean value formula (GMF) for the Caputo–Fabrizio fractional derivative is as follows [26]. Suppose f ( t ) C [ a , b ] and D CF 0 p f ( t ) C [ a , b ] for 0 < p 1 , then we have
f ( t ) = f ( 0 ) + 1 M ( p ) D CFC 0 p f ( ξ ) ( 1 α ) + t α with 0 ξ t , t [ a , b ] .
For further detailed studies on the fractional calculus of the derivatives with the nonsingular kernel and its applications, the interested reader could refer to [22,25].

3. Models’ Interpretations

In this section we introduce and discuss the two models with Caputo and Caputo–Fabrizio derivatives, respectively. Then we formulate the corresponding point-observation inverse problems and solve them by minimizing a least-square functional using the adjoint equation optimization approach.

3.1. Direct Problems

3.1.1. Model with Caputo Derivative

In [20] the following two-order fractional derivatives population model is proposed:
D C 0 r H = L r H + F ω r + H + F H α r σ r F H + F n r H h ( H , F ; p ) ,
D C 0 q F = H α r σ r F H + F m q F g ( H , F ; p ) ,
H ( 0 ) = H 0 , F ( 0 ) = F 0 , t > 0 ,
where D 0 p f ( p = r , q ) denotes the fractional derivative of f of order 0 < p 1 . Here, H is the number of hive bees and the ones working outside the hive are the foragers F. The total number of bees in the colony is assumed to be N = H + F , since bees in compartments other than H and F do not contribute to the work in the hive. The workers are recruited to the forager class from the hive bee class and die with rate m. It is assumed that the maximal rate of eclosion is equivalent to the queen’s laying rate L and it approaches the maximum as N increases. The constant parameter ω determines the rate at which E ( H , F ) = L r ( H + F ) / ( ω r + H + F ) approaches L as N becomes large.
In the recruitment function R ( H , F ) = α r σ r F / ( H + F ) , the parameter α represents the maximal rate at which hive bees become foragers when there are no foragers present in the colony, and  σ is the rate of social inhibition. Following [20], the model (3a)–(3c) does not neglect the death rate n of the hive bees.
Theorem 1. 
There exists a unique solution ( H , F ) C 1 [ 0 , T ] to the initial-value problem (3a)–(3c) and it remains positive for t [ 0 , T ] provided that the initial data is positive.
Proof. 
The existence and uniqueness of the solution to the system (3a)–(3c) could be obtained on the base of the theory in [27], and some results in [28]. We need to show the positivity. On the contrary, let us assume that H 0 > 0 , F 0 > 0 and let t 1 be the first time moment in which H ( t 1 ) = 0 , F ( t 1 ) > 0 . Then, from (3a), we have D 0 r H ( t 1 ) = L r F ( t 1 ) ω r + F ( t 1 ) > 0 . However, from GMF the function H ( t ) is non-decreasing for each t [ 0 , t 1 ] which contradicts the assumption.   □

3.1.2. Model with Caputo–Fabrizio Derivative

Again in [20] the fractional population model with Caputo–Fabrizio derivatives follows:
D CFC 0 r H = L r H + F ω r + H + F H α r σ r F H + F n r H h ( H , F ; p ) ,
D CFC 0 q F = H α r σ r F H + F m q F g ( H , F ; p ) ,
H ( 0 ) = H 0 , F ( 0 ) = F 0 , t > 0 ,
The results for the existence and positivity of the solution, similar to Theorem 1, could be analogously proved. For results concerning uniqueness please refer to [20].

3.2. Inverse Problems

The functions H ( t ) , F ( t ) satisfy the direct problem (3a)–(3c) if the coefficients p 1 = m , p 2 = n , p 3 = α , p 4 = σ , p 5 = ω are known. In practice, the parameters m , n , α , σ , ω are not known, in general, and have to be identified. After their “fair” values are obtained, the model could be used for further robust analysis.
The main question is how to find the coefficients p { m , n , α , σ , ω } if we know the population size at certain times:
H ( t k ; p ) = X k , k = 1 , , K H , F ( t k ; p ) = Y k , k = 1 , , K F .
The estimation of the parameter p is referred to as an inverse modeling problem. This means adjusting the parameter values of a mathematical model in such a way as to reproduce measured data.

4. Numerical Solution to the Direct and Inverse Problems

The models (3a)–(3c) and (4), being nonlinear, do not suggest an analytical solution. In this section, we present the numerical schemes for solving the direct and inverse problems.

4.1. Model with Caputo Derivative

Firstly, we briefly recall the Adams–Bashford–Moulton method for forward fractional derivatives. We follow [29].
It is well known that a fractional initial value problem
D C 0 p y ( t ) = f p t , y ( t ) , y ( 0 ) = y 0
for 0 < p 1 is equivalent to the Volterra integral equation
y ( t ) = y 0 + 1 Γ ( p ) 0 t ( t s ) p 1 f p s , y ( s ) d s
for t T .
Introducing a uniform temporal mesh ω ¯ = { t j = j t : j = 0 , 1 , , N } , where t = T / N is the time step and y j y ( t j ) , the approximate solution to (6) is:
{ y i + 1 P = y 0 + 1 Γ ( p ) j = 0 i b j , i + 1 f p ( t j , y j ) , y i + 1 = y 0 + 1 Γ ( p ) j = 0 i a j , i + 1 f p ( t j , y j ) + a i + 1 , i + 1 f p ( t i + 1 , y i + 1 P ) for i = 0 , 1 , , N 1 ,
where
a j , i + 1 = t p p ( p + 1 ) { i p + 1 ( i p ) ( i + 1 ) p , j = 0 , ( i j + 2 ) p + 1 2 ( i j + 1 ) p + 1 + ( i j ) p + 1 , 1 j i , 1 , j = i + 1
and
b j , i + 1 = t p p ( i j + 1 ) p ( i j ) p for j = 0 , 1 , , i .
In order to compute (3a)–(3c), we use (7) with y : = ( H , F ) and f p : = ( h , g ) .
As discussed in detail later, in order to solve the inverse problem, we need to solve the system of adjoint equations, which is backward. Therefore, we introduce the Adams–Bashford–Moulton formulae for backward fractional derivatives. They are derived analogously to the forward counterparts.
The fractional final value problem
D C T p y ( t ) = f p t , y ( t ) , y ( T ) = y T
for 0 < p 1 is equivalent to the Volterra integral equation
y ( t ) = y T + 1 Γ ( p ) t T ( s t ) p 1 f p s , y ( s ) d s
for t T .
Using the mesh ω ¯ , the numerical solution to (8) follows:
{ y i 1 P = y T + 1 Γ ( p ) i j = N b j , i 1 f p ( t j , y j ) , y i 1 = y T + 1 Γ ( p ) i j = N a j , i 1 f p ( t j , y j ) + a i 1 , i 1 f p ( t i 1 , y i 1 P ) for i = N , N 1 , , 1 ,
where
a j , i 1 = t p p ( p + 1 ) { ( N i ) p + 1 ( N i p ) ( N i + 1 ) p , j = N , ( j i + 2 ) p + 1 2 ( j i + 1 ) p + 1 + ( j u ) p + 1 , j N 1 , 1 , j = i 1
and
b j , i 1 = t p p ( j i + 1 ) p ( j i ) p   for   j = 0 , 1 , , i .
Analogously, to solve (15), we use (9) and set y : = ( φ H , φ F ) .

4.2. Model with Caputo–Fabrizio Derivative

Similarly to the Caputo case, numerical approaches are developed for the Caputo–Fabrizio fractional derivative; see, for example, [14]. Here we employ a simple PECE (predict–evaluate–correct–evaluate) Adams-type method.
The fractional initial value problem
D CFC 0 p y ( t ) = f p t , y ( t ) , y ( 0 ) = y 0
for 0 < p 1 is equivalent to the integral equation
y ( t ) = y 0 + ( 1 p ) f p t , y ( t ) + p 0 t f p s , y ( s ) d s
for t T .
Using the same uniform temporal mesh ω ¯ , we write the approximate solution to (10):
y i + 1 P = y 0 + ( 1 p ) f p ( t i , y i ) + p t j = 0 i f p ( t j , y j ) , y i + 1 = y 0 + ( 1 p ) f p ( t i + 1 , y i + 1 P ) + p t 2 f p ( t 0 , y 0 ) + 2 j = 1 i f p ( t j , y j ) + f p ( t i + 1 , y i + 1 P )
for i = 0 , 1 , , N 1 .
Similarly, to compute (4), we apply (11) with y : = ( H , F ) and f p : = ( h , g ) .
The formulae for the backward system are as follows:
y i 1 P = y T + ( 1 p ) f p ( t i , y i ) + p t i j = N f p ( t j , y j ) , y i 1 = y T + ( 1 p ) f p ( t i 1 , y i 1 P ) + p t 2 f p ( t T , y T ) + 2 i j = N 1 f p ( t j , y j ) + f p ( t i 1 , y i 1 P )
for i = N , N 1 , , 1 .
To solve (15), we use (12) and set y : = ( φ H , φ F ) .

5. Adjoint Optimization Method

We solve the point observation problem (3a)–(3c) and (5) via minimization of the appropriate functional [28,30]. We minimize the least-square functional
J ( p ) = J ( m , n , α , σ , ω ) = J H ( p ) + J F ( p ) = k = 1 K H H ( t k ; p ) X k 2 + k = 1 K F F ( t k ; p ) Y k 2 .

5.1. Caputo Fractional Derivative Case

Theorem 2. 
The gradient J p ( J m , J n , J α , J σ , J ω ) of the functional J ( p ) is given by
J m ( p ) = q m q 1 0 T φ F F d t , J n ( p ) = r n r 1 0 T φ H H d t , J α ( p ) = r α r 1 0 T ( φ H φ F ) H d t , J σ ( p ) = r σ r 1 0 T ( φ F φ H ) H F H + F d t , J ω ( p ) = r ω r 1 L r 0 T φ H H + F ( ω + H + F ) 2 d t ,
where the functions { φ H = φ H ( t ) , φ F = φ F ( t ) } are the unique solution to the adjoint final-value problem
D C T r φ H = a 11 ( H , F ) φ H + a 12 ( H , F ) φ F 2 k = 1 K H H ( t ; p ) X ( t ) δ ( t t k ) , D C T q φ F = a 21 ( H , F ) φ H + a 22 ( H , F ) φ F 2 k = 1 K F F ( t ; p ) Y ( t ) δ ( t t k ) , φ H ( T ) = 0 , φ F ( T ) = 0 ,
a 11 ( H , F ; p ) = f H = L r ω r ( ω r + H + F ) 2 + σ r F H + F σ r H F ( H + F ) 2 ( α r + n r ) , a 21 ( H , F ; p ) = f F = L r ω r ( ω r + H + F ) 2 + σ r H 2 ( H + F ) 2 , a 12 ( H , F ; p ) = g H = α r σ r F H + F + σ r H F ( H + F ) 2 , a 22 ( H , F ; p ) = g F = σ r H 2 ( H + F ) 2 m q ,
and X ( t ) , Y ( t ) are interpolants of the discrete functions, taking values X k at t = t k , k = 1 , , K H and Y k at t = t k , k = 1 , , K F , respectively.
Proof. 
We denote δ p = ( δ m , δ n , δ α , δ σ , δ ω ) , δ m = ε h 1 , δ n = ε h 2 , δ α = ε h 3 , δ σ = ε h 4 , δ ω = ε h 5 and δ H ( t ; p ) = H ( t ; p + δ p ) H ( t ; p ) , δ F ( t ; p ) = F ( t ; p + δ p ) F ( t ; p ) . Then, we write the system (3a) and (3b) at p : = p + δ p for the pair { H ( t ; p + δ p ) , F ( t ; p + δ p ) } with initial { H 0 , F 0 } . Next, we perform the differences between the corresponding equations to obtain a system for the pair { δ H ( t ; p ) , δ F ( t ; p ) } with zero initial conditions. After a little algebraic manipulation, we obtain:
D C 0 r δ H = a 11 δ H + a 21 δ F + O ( δ H ) + O ( δ F ) r α r 1 H δ α + r σ r 1 H F H + F δ σ
D C 0 r δ H = r ω r 1 L r H + F ( ω r + H + F ) 2 δ ω q n q 1 H δ n + O ( δ p ) , δ H ( 0 ) = 0 ,
D C 0 q δ F = a 12 δ H + a 22 δ F + O ( δ H ) + O ( δ F )
D C 0 q δ F = q n q 1 F δ m + r α r 1 H δ α r σ r 1 H F H + F δ σ + O ( δ p ) , δ F ( 0 ) = 0 .
For the increment of the functional J ( p ) we find:
J ( p + δ p ) J ( p ) = k = 1 K H ( δ H ( t k ; p ) + H ( t k ; p ) X k ) 2 k = 1 K H ( H ( t k ; p ) X k ) 2 + k = 1 K F ( δ F ( t k ; p ) + F ( t k ; p ) Y k ) 2 k = 1 K F ( F ( t k ; p ) Y k ) 2 = 2 k = 1 K H 0 T δ H ( t ; p ) H ( t ; p ) X ( t ) δ ( t t k ) d t + 2 k = 1 K F 0 T δ F ( t ; p ) F ( t ; p ) Y ( t ) δ ( t t k ) d t + O ( ε ) .
Following the main idea of the adjoint equation method [28], we multiply Equation (16a) by a smooth function φ H ( t ) , such that φ H ( T ) = 0 , and Equation (16b) by a function φ F ( t ) , such that φ F ( T ) = 0 (later these functions are completely reconstructed). We integrate both sides of the results from 0 to T and add them together:
0 T ( φ H D C 0 r δ H + φ F D C 0 q δ F ) d t = 0 T φ H ( a 11 δ H + a 21 δ F ) d t + 0 T φ F ( a 12 δ H + a 22 δ F ) d t r α r 1 δ α 0 T φ H H d t + r σ r 1 δ σ 0 T φ H H F H + F d t r ω r 1 L r δ ω 0 T φ H H + F ( ω r + H + F ) 2 d t r n r 1 δ n 0 T φ H H d t r m r 1 δ m 0 T φ F F d t + r α r 1 δ α 0 T φ F H d t r σ r 1 δ σ 0 T φ F H F H + F d t + O ( ε ) .
Integrating, by parts, the left-hand side using formula (1) and using the facts that φ H ( T ) = 0 , δ H ( 0 ) = 0 and φ F ( T ) = 0 , δ F ( 0 ) = 0 , we obtain
0 T ( φ H D C 0 r δ H + φ F D C 0 q δ F ) d t = 0 T δ H D C T r φ H d t + 0 T δ F D C T q φ F d t .
Then, placing the expressions for D C T r φ H and D C T q φ F from (15) in (19) and using (17) and (18), after some lengthy manipulations we find
J ( p + δ p ) J ( p ) J ( m + ε h 1 , n + ε h 2 , α + ε h 3 , σ + ε h 4 , ω + ε h 5 ) J ( m , n , α , σ , ω ) = q m q 1 δ m 0 T φ F F d t + r n r 1 δ n 0 T φ H H d t + r α r 1 δ α 0 T ( φ H φ F ) H d t + r σ r 1 δ σ 0 T ( φ F φ H ) H F H + F d t + r ω r 1 L r δ ω 0 T φ H H + F ( ω r + H + F ) 2 d t .
Now, taking ε 2 = ε 3 = ε 4 = ε 5 = 0 , dividing the both sides of (20) by ε h 1 and passing to the limit ε 0 , we obtain the formula for J m in (14). In the same manner one can check the validity of the other formulae in (14).   □

5.2. Caputo–Fabrizio Fractional Derivative Case

To solve the point observation problem (4) and (5), we minimize the same cost functional J ( p ) (13):
Theorem 3. 
The gradient J p ( J m , J n , J α , J σ , J ω ) of the functional J ( p ) is given by (14), where the functions { φ H = φ H ( t ) , φ F = φ F ( t ) } are the unique solution to the adjoint final-value problem
D CFC T r φ H = a 11 ( H , F ) φ H + a 12 ( H , F ) φ F 2 k = 1 K H H ( t ; p ) X ( t ) δ ( t t k ) , D CFC T q φ F = a 21 ( H , F ) φ H + a 22 ( H , F ) φ F 2 k = 1 K F F ( t ; p ) Y ( t ) δ ( t t k ) , φ H ( T ) = 0 , φ F ( T ) = 0 ,
and X ( t ) , Y ( t ) are, again, interpolants of the discrete functions, taking values X k at t = t k , k = 1 , , K H and Y k at t = t k , k = 1 , , K F , respectively.
The proof of Theorem 3 is analogous to that of Theorem 2.

6. Numerical Algorithm

Since the focus was to provide an adequate parameter identification study and simulation of the fractional-order model, we simply adopted the Volterra integral representation of the solution to obtain the numerical results.
In this section, we briefly comment on the numerical solution to the direct problem (3a)–(3c) and inverse problem (14) and (15). In general, such complex models do not posses a closed-form or an analytic solution at all, so one has to stick to a numerical approach. What is more, in our quasi-real framework, a solution to the direct problem is required in order to take measurements to test the algorithmic performance in solving the inverse problem.
Let us introduce the following piecewise–uniform mesh:
ω ¯ τ = t 0 , t i = t i 1 + τ i J i , t K = T for i = 1 , , K 1 ,
for K K N and K K F , and the respective subinterval division t i j = t i 1 + j τ i , j = 1 , , J i , where i = 1 , , K 1 , t i are the time instances at which observations are taken; t i j , j = 1 , , J i and τ i are the time nodes and the time steps corresponding to ( t i 1 , t i ] .
In the case of an integer–order model, there are many ways to solve it, and the issue has been extensively studied; see, for example, [31]. We followed the method described in [20], where the Volterra integral representation of (3a) and (3b) are discretized over the mesh (21) and approximated via the trapezoidal rule to obtain the respective numerical schemes. In an analogous manner, the backward system (15) is solved. In turn, the solution to the inverse problem (3a)–(3c) and (5) is sketched with the aid of Algorithm 1.
Algorithm 1 Adjoint Equation Optimization Method
Initialize p 0 S adm and l = 1 .
repeat
     l : = l + 1
    Solve the direct problem (3a)–(3c) at the current value p l . Then, define
H ( t k ; p l ) = X k , k = 1 , , K H ; F ( t k ; p l ) = Y k , k = 1 , , K F
    Solve the adjoint problem (15) via the method described in Section 5.1 (or Section 5.2)
    Compute J ( p l ) by means of the formulae (14)
    Define the optimization parameter r > 0 and compute the new parameter value p l + 1 by
p l + 1 = p l r J ( p l ) , r > 0 , r R 5 +
until p l : = p l + 1 p l < ε p
Set p ˇ : = p l + 1
The numerical approximation of the sought parameter p is p ˇ . In case there is no convergence, one should choose another p 0 and start the iterations again. The user-prescribed tolerance ε p is chosen according to the practical needs, and the value of the descent parameter r (22) is chosen empirically, as can be seen in the following aection.

7. Model Simulations

In this section, computational results are presented, which confirm the efficiency and robustness of the proposed approach. In our quasi-real test framework, we first solve the direct problem to demonstrate the model. Then, we use the result for measurements to solve the inverse problem.

7.1. Direct Problem

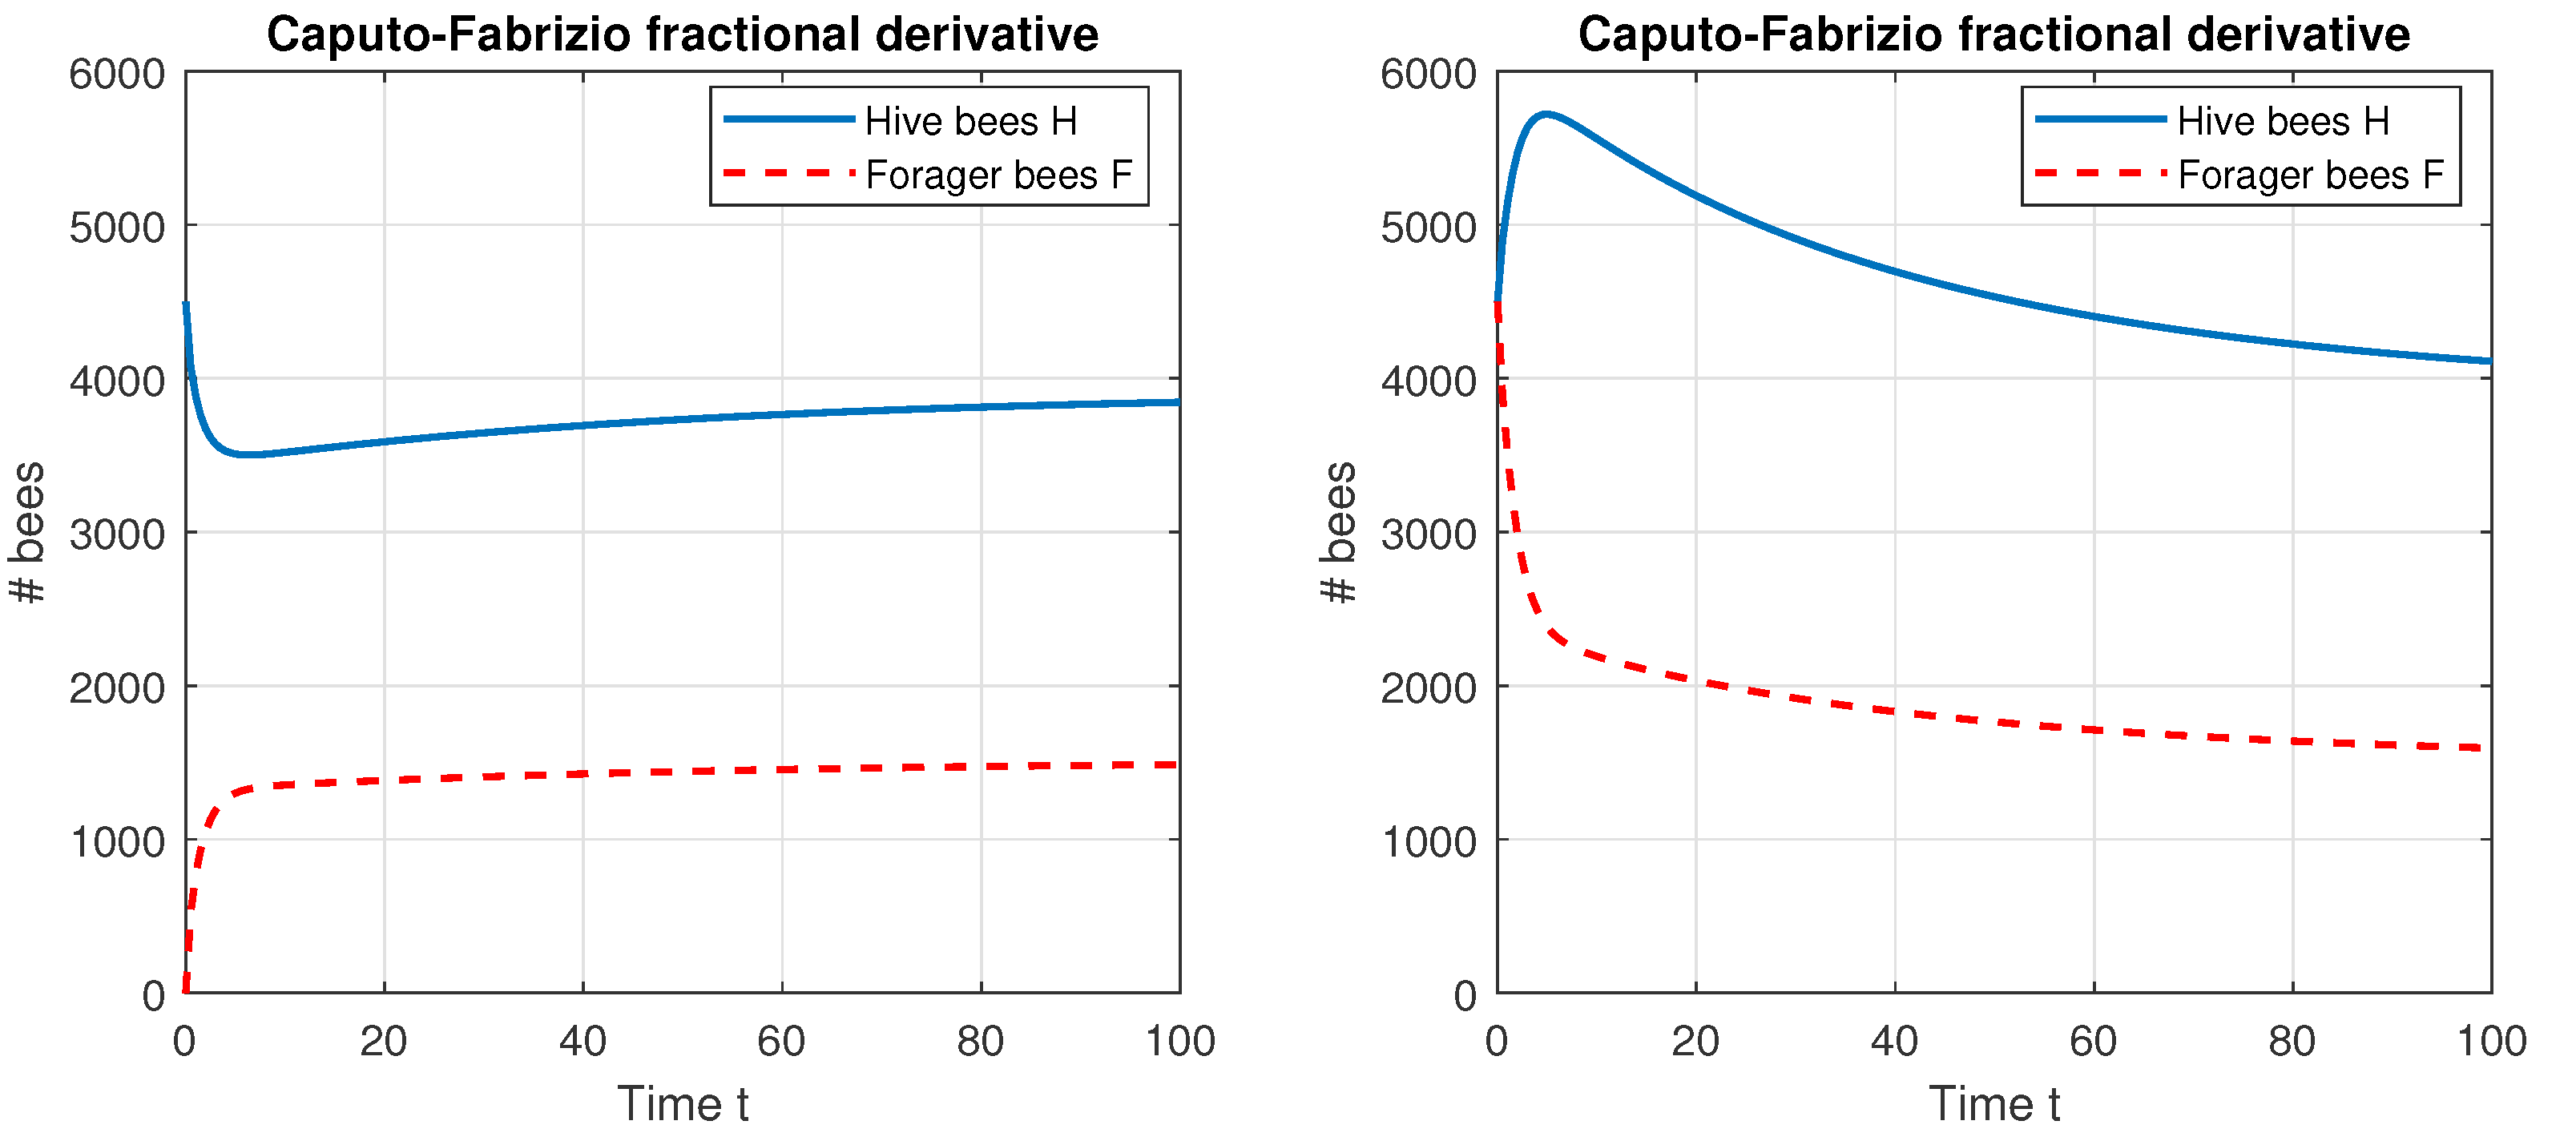
Let us solve the direct problem (3a)–(3c) with data from [20]. We set the number of eggs laid by the queen per day L = 2000 and the half-saturation constant ω = 27,000. What is more, the maximal recruitment rate is α = 0.25 and the social inhibition coefficient is σ = 0.75 . We assume relatively low forager mortality rate m = 0.154 and the hive mortality rate is n = m / 18 . We conduct experiments with two types of colonies, where the number of foragers is F 0 = 0 or F 0 = 4500 , while, in both cases, H 0 = 4500 . The considered time interval is the maximal foraging season from the end of the winter to the end of the summer, which equals T = 250 days. Finally, we use high values r = q = 0.9 . The results are shown in Figure 1.
The colony survives well and is approaching a disease-free equilibrium state.
Now, we use the same setting, but we solve the problem (4). The results are plotted in Figure 2.
They do not differ significantly from the results, obtained from the Caputo fractional derivative model.
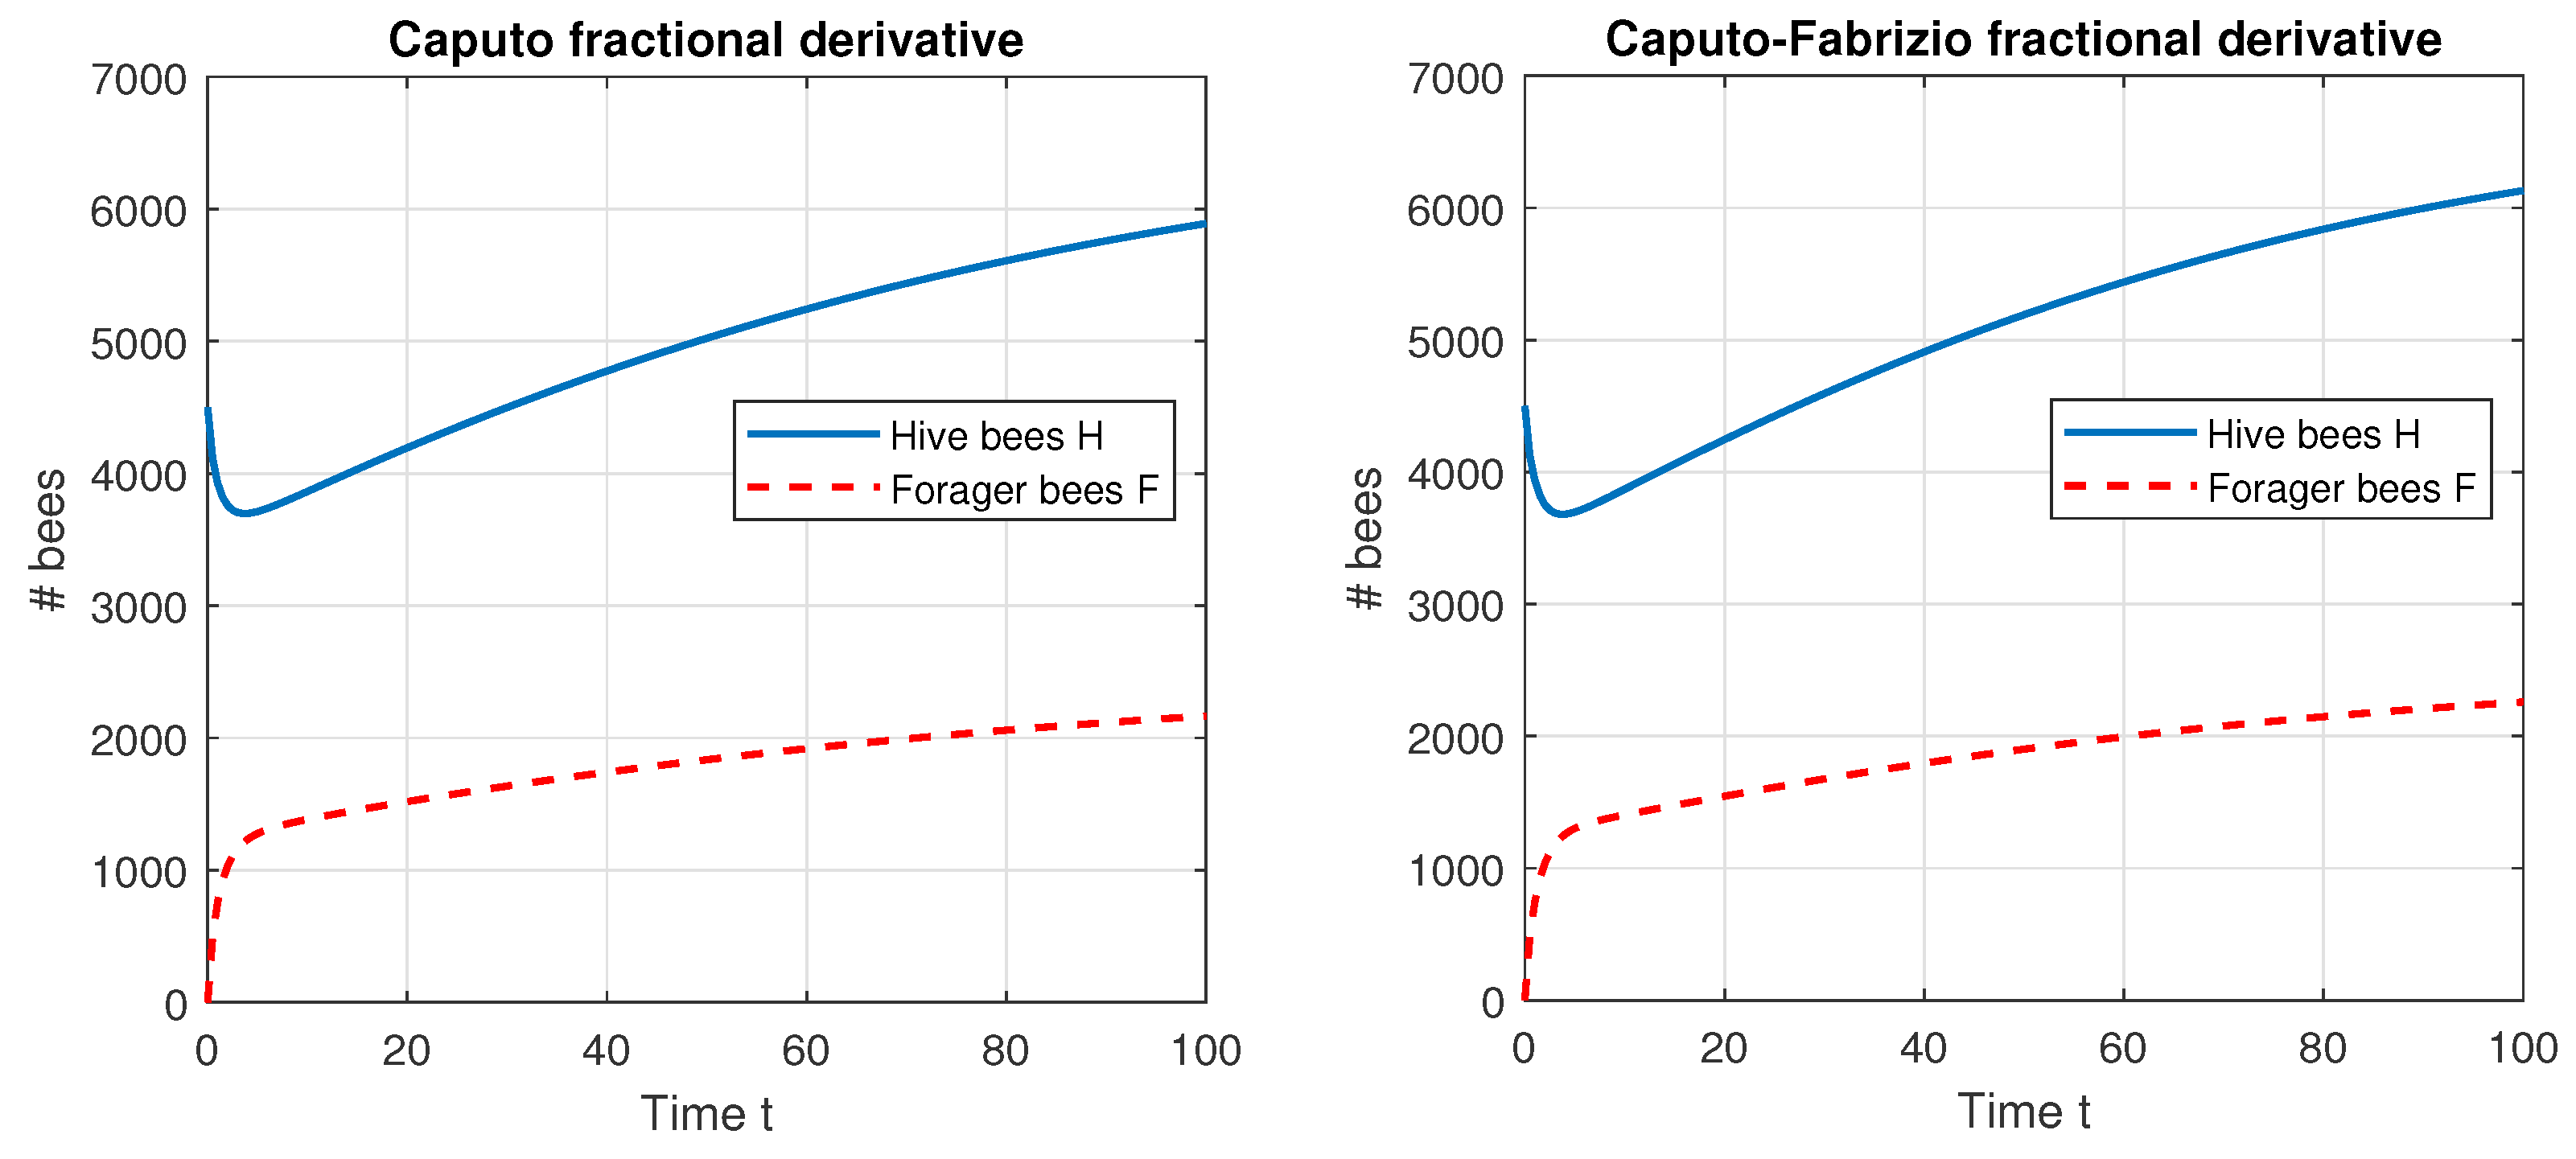
To conclude the experiments, regarding the direct problem, we simulate the population dynamics with both models, when r = q = 0.95 , as can be seen in Figure 3.
The difference between the two models is now more pronounced.

7.2. Inverse Problem

Now, we solve the inverse problem. We follow the direct problem setting with H 0 = 4500 and F 0 = 0 and r = q = 0.9 . We seek the unknown parameter p , while provided with observations of type (5). Let us set K N = K F = 11 , while the observation times are equidistantly distributed in the interval [ t 0 , T ] . The true values of the unknown parameters are p = ( m , n , α , σ , ω ) = ( 0.154 , 0.0086 , 0.25 , 0.75 , 27 , 000 ) . We test Algorithm 1 with initial approximation p 0 = ( 0.2 , 0.01 , 0.3 , 0.7 , 30 , 000 ) . The results are given in Table 1.
The values of p were accurately recovered. The relative errors were of magnitude 1 × 10⁻⁴, which is acceptable. The gradient method required 52 iterations to converge. The differences (13) between the observed values { X k , Y k } and the implied ones { H obs ( t k ; p ˇ ) , F obs ( t k ; p ˇ ) } are as follows: J H ( p ˇ ) = 16.7854 , J F ( p ˇ ) = 42.5513 . The root mean squared errors were, respectively, RMSE H ( p ˇ ) = 1.2353 and RMSE F ( p ˇ ) = 1.9668 , which again imply the accuracy of the results.
The convergence of the implied parameters p can be viewed of Figure 4. The last graph shows the implied population dynamics, i.e., simulation with the implied parameters. The difference is unnoticeable, as expected from the smallness of J ( p ˇ ) .
Now, we test Algorithm 1 on the model (4), with other settings staying the same. The results are presented in Table 2.
In this case, 39 iterations were performed to reach convergence. The relative errors of the recovered parameters were a bit higher that those of the Caputo model, but the residuals J H ( p ˇ ) = 16.1655 , J F ( p ˇ ) = 32.9409 were a bit smaller, as were the root mean squared errors RMSE H ( p ˇ ) = 1.2123 and RMSE F ( p ˇ ) = 1.7305 , respectively. The two calibrations demonstrated similar results, which indicated that both the Caputo and the Caputo–Fabrizio derivatives are adequate for modeling the honeybee fractional population dynamics.
Now, we perform a computational experiment with different values of p = 0.9 and q = 0.95 [20]. The first to be tested was the Caputo model (3a)–(3c). The results are given in Table 3.
In total, 41 iterations were required for the algorithm to converge. The residuals were J H ( p ˇ ) = 262.2052 , J F ( p ˇ ) = 2.4509 , and the respective root mean squared errors were RMSE H ( p ˇ ) = 4.8823 and RMSE F ( p ˇ ) = 0.4720 . The parameters were recovered in a precise manner.
Then, a test with the Caputo–Fabrizio model (4) is performed. The results are summarized in Table 4.
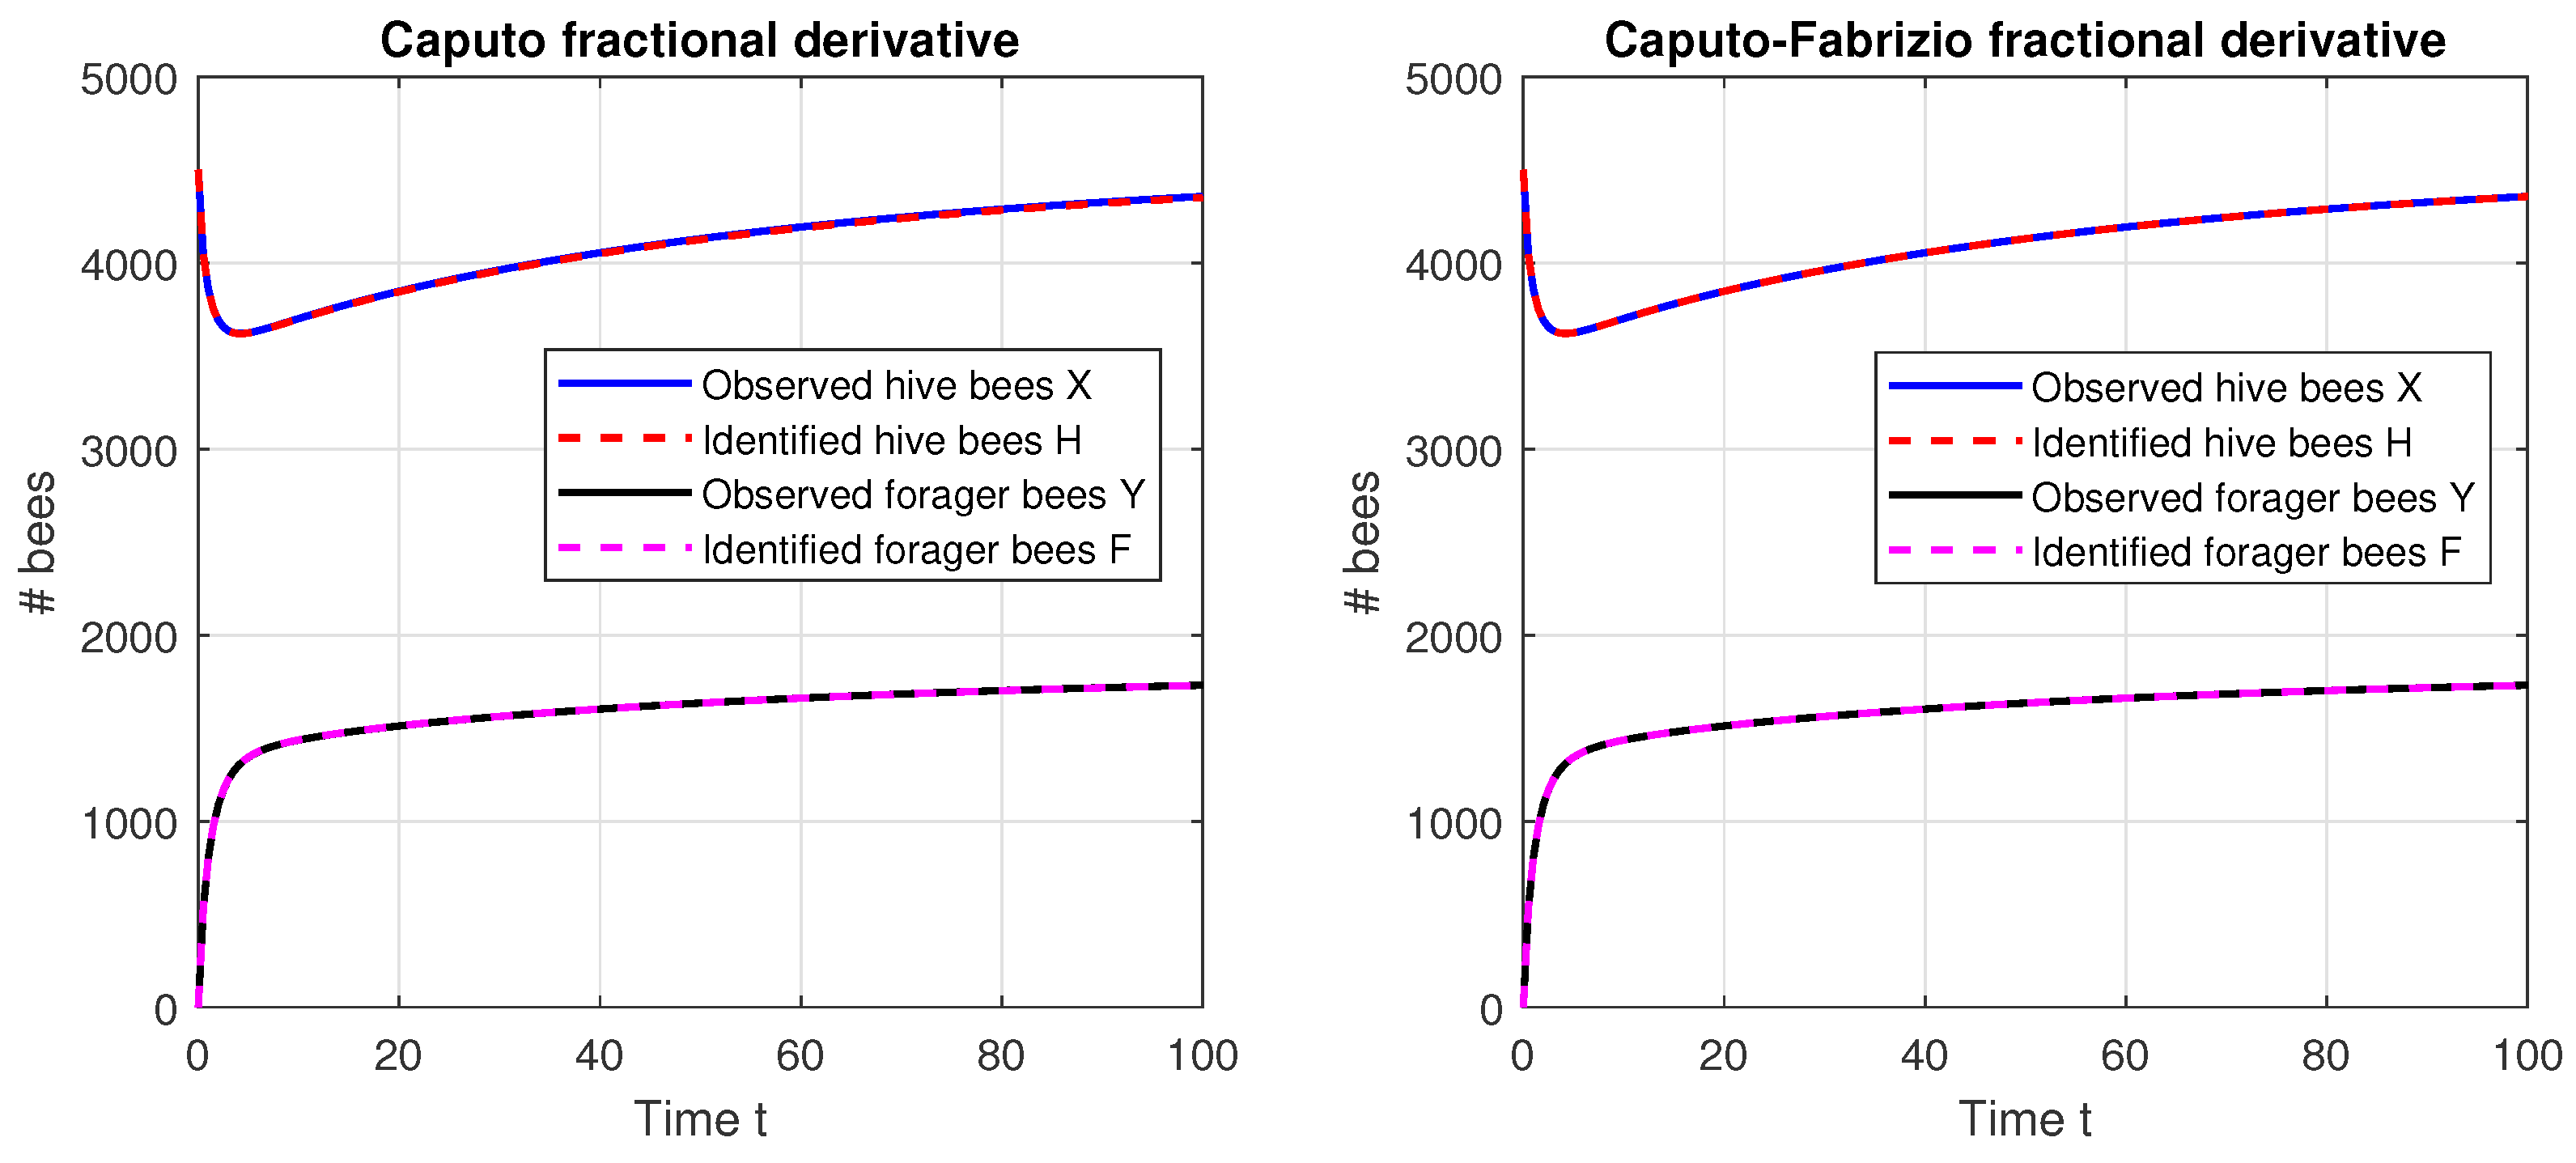
Now, 34 iterations were needed for convergence, and the residuals, J H ( p ˇ ) = 1.7525 , J F ( p ˇ ) = 0.0625 , and the root mean squared errors, RMSE H ( p ˇ ) = 0.3991 , RMSE F ( p ˇ ) = 0.0754 , were very low. The parameters were accurately reconstructed as well. Simulations with the implied dynamics are plotted on Figure 5.
At first glance, it might appear that there was no pronounced difference between the Caputo and Caputo–Fabrizio operators. Sometimes, this was, indeed, the case, as can be seen Figure 1 and Figure 2 in [22], but, in other cases, there was a significant deviation, as can be seen in Figure 3 and Figure 4, again in [22]. It was found that when the fractional order was closer to 1, the difference vanished. We visualized the Caputo–Fabrizio derivative against the Caputo one in the case of r = q = 0.95 , compare Figure 6 (left) with Figure 3, and, in the case of r = 0.9 , q = 0.95 , compare Figure 6 (right), with Figure 5. In the first case, the difference was more pronounced, in contrast to the second case, where the difference was insignificant. These results do not act as a recommendation for or against the Caputo–Fabrizio derivative. They only show how the Caputo–Fabrizio derivative differs from the Caputo model in the particular cases. The Caputo–Fabrizio model is advantageous in view of prototyping and computational effort, since the Caputo–Fabrizio fractional integral is easier to implement and easier to perform numerical simulations with.
In particular, when solving the direct problem with r = q = 0.95 , the Caputo model required 0.53 s to finish, while the Caputo–Fabrizio needed 0.42 s, which yielded approximately 20% computational gain. When solving the inverse problem with r = 0.9 and q = 0.95 , the algorithm for the Caputo model required 41 iterations to converge, while the Caputo–Fabrizio model required only 34 iterations, which again implies the computational efficiency of the latter.
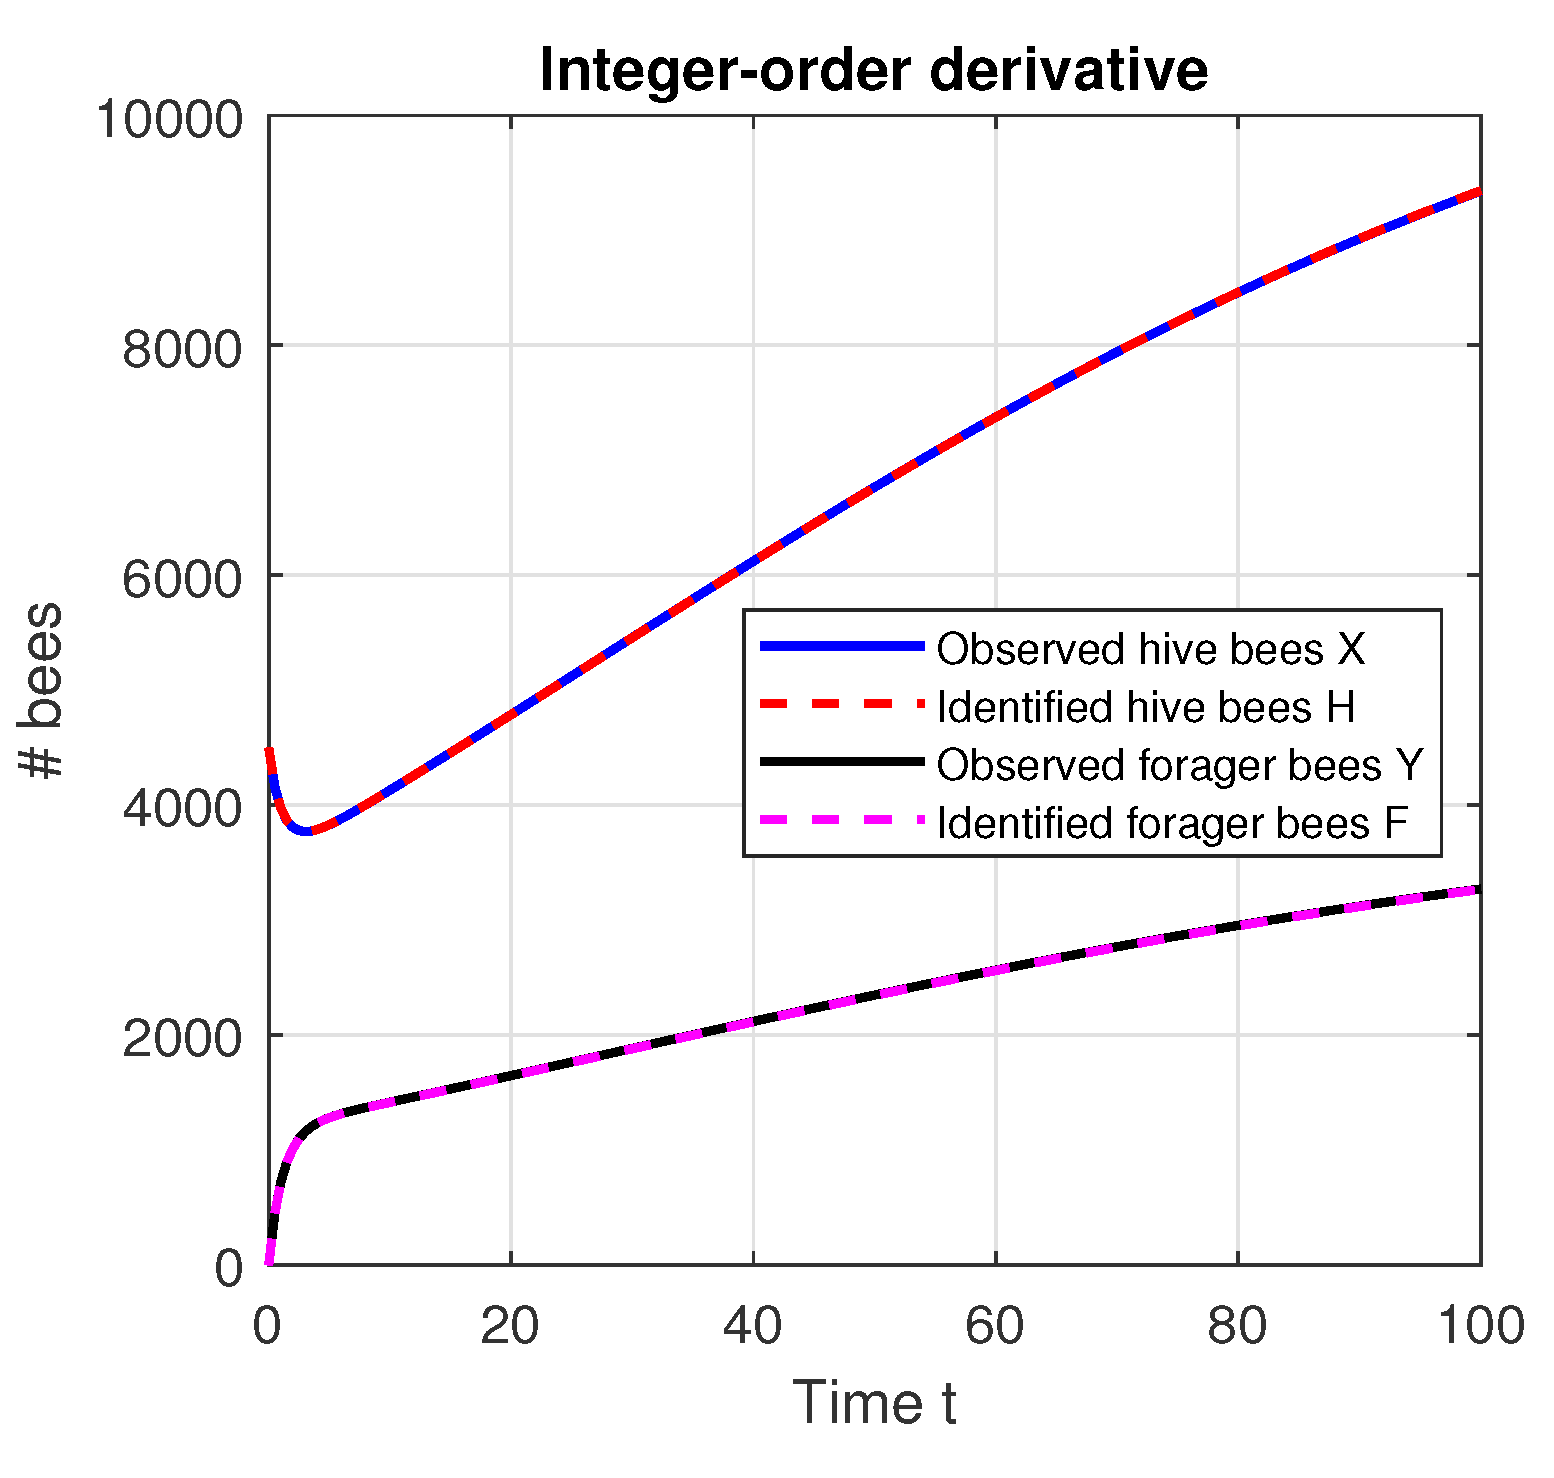
For the sake of completeness, we conducted a test with an integer-order derivative model, meaning that r = q = 1 and the fractional derivatives in (3a)–(3c) and (4) are effectively substituted by a regular derivative with respect to time. The results are given in Table 5 and Figure 7. The residuals, J H ( p ˇ ) = 21.1709 , J F ( p ˇ ) = 133.9541 , and the root mean squared errors, RMSE H ( p ˇ ) = 1.3873 , RMSE F ( p ˇ ) = 3.4896 , were low, although higher than the simulations with fractional derivatives. This empirically confirmed the benefit of the fractional-order modeling.
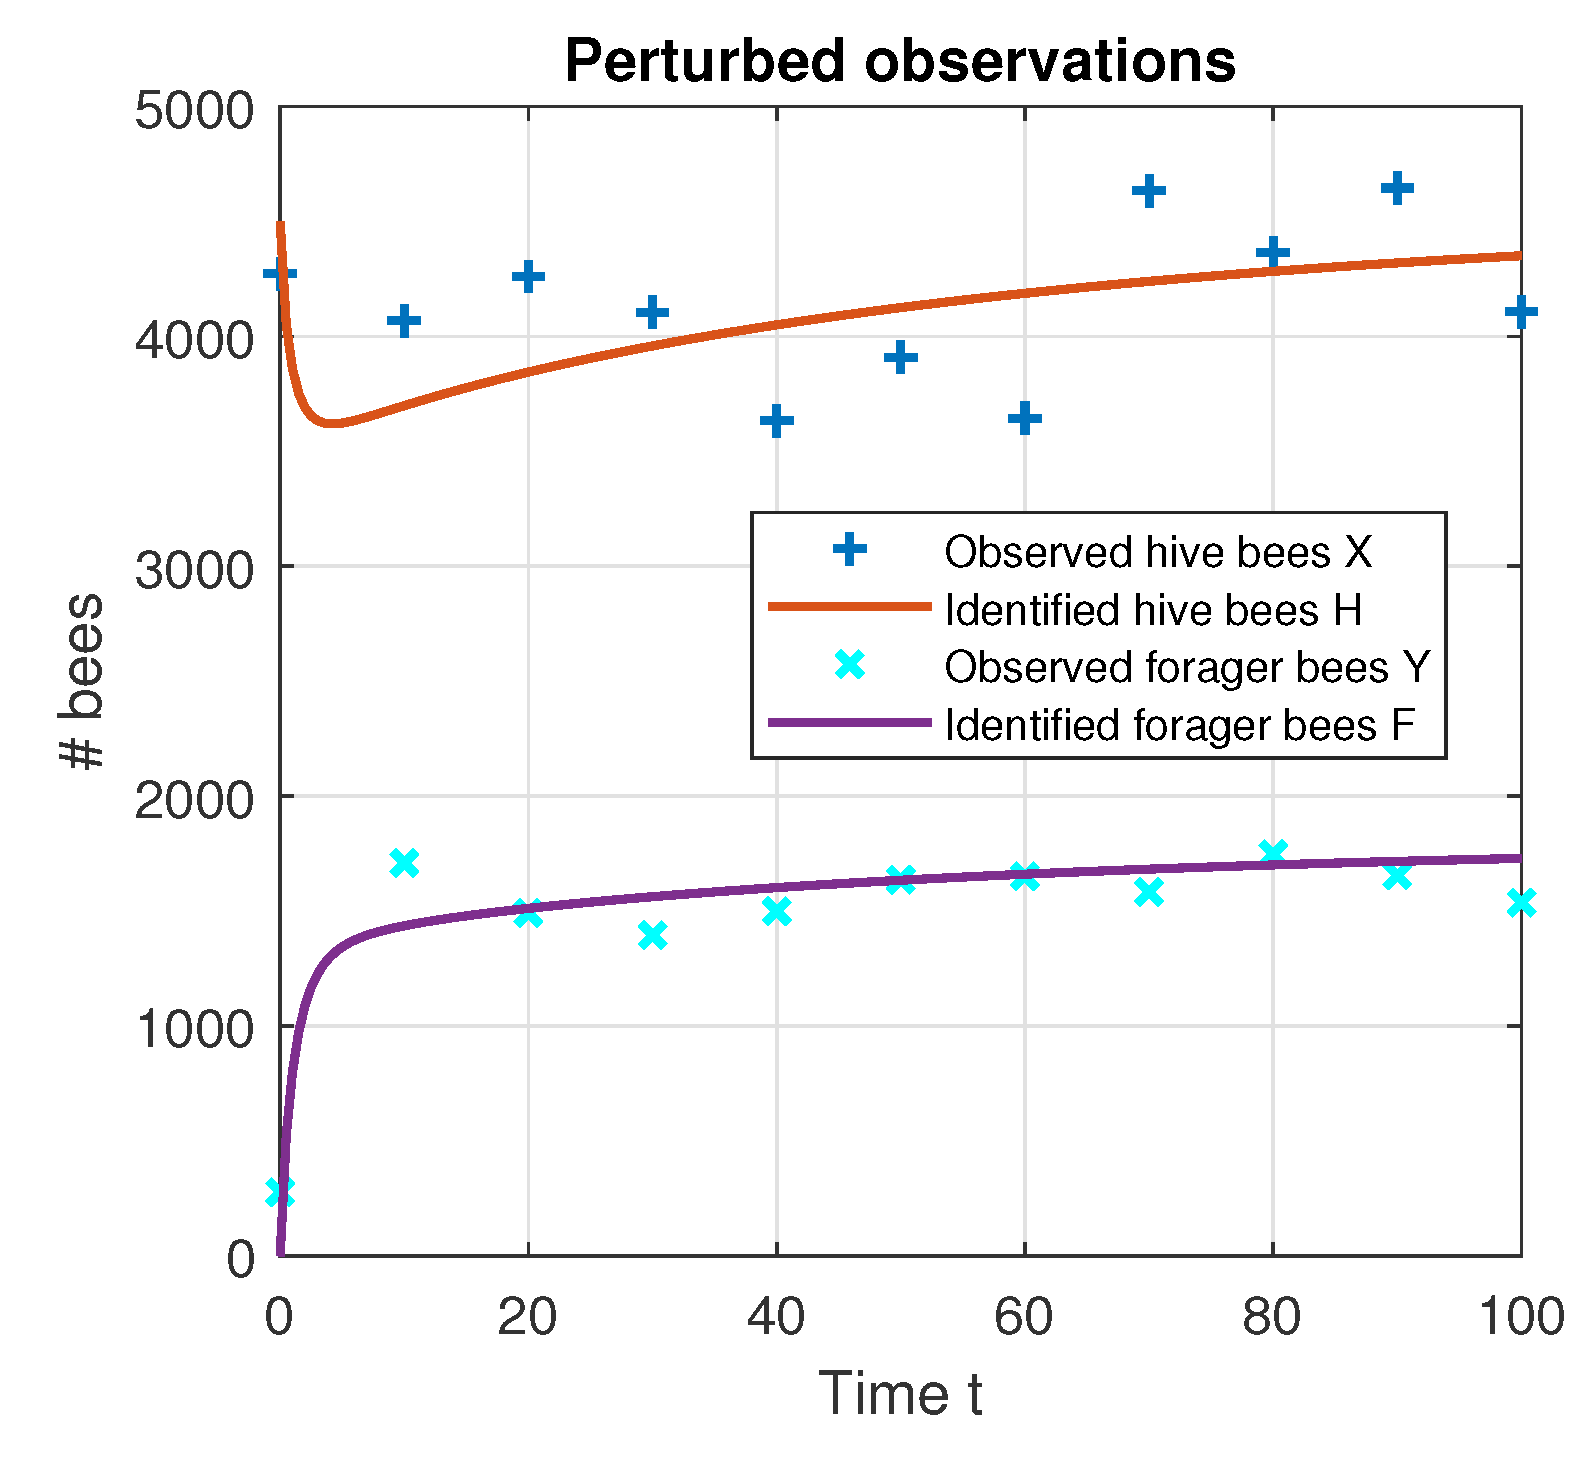
We concluded the experiments with a test of perturbed observations. In practice, each electronic device has a certain instrumental error, and sometimes this has a tremendous impact on the identifiability of the unknown parameters. To simulate this, we added Gaussian noise to the observations (5). It meant that, with 95% confidence, the bias in a single measurement did not go beyond 20%. We tested with such a high level of noise to validate the robustness of the algorithm. The results are shown on Table 6 and Figure 8.
The number of iterations to convergence was 50 and, as expected, the residuals, J H ( p ˇ ) = 11.9358 , J F ( p ˇ ) = 97.0402 , were higher and so were the root mean squared errors RMSE H ( p ˇ ) = 1.0417 and RMSE F ( p ˇ ) = 2.9702 . The relative parametric errors were of the order 1 × 10⁻³, but they were not much larger than their counterparts from the exact observations cases. All of these facts imply that the approach is capable of working with real noisy data.

8. Conclusions

We employed a fractional-order model for honeybee population dynamics that balances simplicity and reality. The proposed adjoint state optimization approach allows one to find the unknown parameters in an accurate and robust way. This is achieved via solving a linear system of adjoint equations and minimizing a cost functional. The numerical simulations proved the sound foundations of the approach.
The implemented algorithm has several advantages. One is that it can work with scarce data, i.e., observations are not taken often and/or equidistantly. Another beneficial feature is the ability to cope with very noisy measurements. A limitation of the algorithm is that the optimization parameters r need to be adjusted. Some, though, may be given to develop a procedure for automatically tuning these parameters.
A possible continuation of the current work is to employ different fractional operators or more sophisticated models; as in, for example, [32,33]. Another interesting problem is obtaining reasonable values of the fractional orders. A way to achieve this is to use an approach similar to the bisection method [34]. Nevertheless, it is an open field to discover and might be a matter of further research. We believe the current and future algorithms give insight into managing honeybee colonies and help solve contemporary ecological and environmental issues.

Author Contributions

Conceptualization, L.V.; methodology, S.G. and L.V.; software, S.G.; validation, S.G.; formal analysis, L.V.; investigation, S.G. and L.V.; resources, S.G.; data curation, S.G.; writing—original draft preparation, S.G.; writing—review and editing, S.G. and L.V.; visualization, S.G.; supervision, L.V.; project administration, L.V.; funding acquisition, L.V. All authors have read and agreed to the published version of the manuscript.

Funding

This research was funded by the Bulgarian National Science Fund under Project KP-06-PN 46-7 “Design and research of fundamental technologies and methods for precision apiculture”.

Data Availability Statement

Not applicable.

Acknowledgments

The authors are grateful to the anonymous referees for the useful suggestions and comments.

Conflicts of Interest

The authors declare no conflict of interest. The funders had no role in the design of the study; in the collection, analyses, or interpretation of data; in the writing of the manuscript; or in the decision to publish the results.

References

  1. Atanasov, A.Z.; Georgiev, I.R. A multicriteria model for optimal location of honey bee colonies in regions without overpopulation. AIP Conf. Proc. 2021, 2333, 090008. [Google Scholar]
  2. Booton, R.D.; Iwasa, Y.; Marshall, J.A.R.; Childs, D.Z. Stress-mediated Alle effects can cause the sudden collapse of honey bee colonies. J. Theor. Biol. 2017, 420, 213–219. [Google Scholar] [CrossRef] [PubMed] [Green Version]
  3. Russel, S.; Barron, A.B.; Harris, D. Dynamics modelling of honeybee (Apis mellifera) colony growth and failure. Ecol. Model. 2013, 265, 138–169. [Google Scholar]
  4. Harbo, J.R. Effect of brood rearing on honey consumption and the survival of worker honey bees. J. Apic. Res. 1993, 32, 11–17. [Google Scholar] [CrossRef]
  5. Khoury, D.S.; Myerscough, M.R.; Barron, A.B. A quantitative model of honey bee colony population dynamics. PLoS ONE 2011, 6, e18491. [Google Scholar] [CrossRef] [Green Version]
  6. Khoury, D.S.; Barron, A.B.; Meyerscough, M.R. Modelling food and population dynamics honey bee colonies. PLoS ONE 2013, 8, e0059084. [Google Scholar] [CrossRef] [Green Version]
  7. Switanek, M.; Crailsheim, K.; Truhetz, H.; Brodschneider, R. Modelling seasonal effects of temperature and precipitation on honey bee winter mortality in a temperate climate. Sci. Total Environ. 2017, 579, 1581–1587. [Google Scholar] [CrossRef]
  8. Le Conte, Y.; Ellis, M.; Ritter, W. Varroa mites and honey bee health: Can varroa explain part of the colony losses? Apidologie 2010, 41, 353–363. [Google Scholar] [CrossRef] [Green Version]
  9. Hayes, J., Jr.; Underwood, R.M.; Pettis, J.; van Engelsdorp, D. A survey of honey bee colony losses in the US, fall 2007 to spring 2008. PLoS ONE 2008, 3, e4071. [Google Scholar]
  10. Atanasov, A.Z.; Georgiev, S.G.; Vulkov, L.G. PParameters reconstruction in modeling of honeybee colonies infested with Varroa destructor. AIP Conf. Proc. 2022, 2522, 110005. [Google Scholar]
  11. Chen, J.; DeGrandi-Hoffman, G.; Ratti, V.; Kang, Y. Review on mathematical modeling of honeybee population dynamics. Math. Biosci. Eng. 2021, 18, 9606–9650. [Google Scholar] [CrossRef]
  12. Becher, M.A.; Osborne, J.L.; Thorbek, P.; Kennedy, P.J.; Grimm, V. Towards a systems approach for understanding honeybee decline: A stocktaking and synthesis of existing models. J. Appl. Ecol. 2013, 50, 868–880. [Google Scholar] [CrossRef] [PubMed] [Green Version]
  13. Li, C.-P.; Tao, C.-X. On the fractional Adams method. Comput. Math. Appl. 2009, 58, 1573–1588. [Google Scholar] [CrossRef] [Green Version]
  14. Akman, T.; Yıldız, B.; Baleanu, D. New discretization of Caputo–Fabrizio derivative. Comput. Appl. Math. 2018, 37, 3307–3333. [Google Scholar] [CrossRef]
  15. Baleanu, D.; Diethelm, K.; Scalas, E.; Trujillo, J.J. Fractional Calculus. In Models and Numerical Methods; World Scientific: Singapore, 2017. [Google Scholar]
  16. Li, C.-P.; Zeng, F.-H. The finite difference methods for fractional ordinary differential equations. Numer. Funct. Anal. Optim. 2013, 34, 149–179. [Google Scholar] [CrossRef]
  17. Mahatekar, Y.; Scindia, P.S.; Kumar, P. A new numerical method to solve fractional differential equations in terms of Caputo-Fabrizio derivatives. Phys. Scr. 2023, 98, 024001. [Google Scholar] [CrossRef]
  18. Ionescu, C.; Lopes, A.M.; Copot, D.; Machado, J.A.T.; Bates, J.H.T. The role of fractional calculus in modelling biological phenomena: A review. Commun. Nonlinear Sci. Numer. Simul. 2017, 51, 141–159. [Google Scholar] [CrossRef]
  19. Magin, R.L. Fractional calculus in bioengineering, part 3. Crit. Rev. Biomed. Eng. 2004, 32, 195–377. [Google Scholar] [CrossRef]
  20. Yıldız, T.A. A fractional dynamical model for honeybee colony population. Int. J. Biomath. 2018, 11, 1850063. [Google Scholar]
  21. Georgiev, S.G.; Vulkov, L.G. Parameter identification approach for a fractional dynamics model of honeybee population. In Lecture Notes in Computer Science; Springer: Cham, Switzerland, 2022; Volume 13127, pp. 40–48. [Google Scholar]
  22. Caputo, M.; Fabrizio, M. A new definition of fractional derivative without singular kernel. Progr. Fract. Differ. Appl. 2015, 1, 73–85. [Google Scholar]
  23. Baleanu, D.; Jajarmi, A.; Mohammadi, H.; Rezapour, S. A new study on the mathematical modelling of human liver with Caputo–Fabrizio fractional derivative. Chaos Solitons Fractals 2020, 134, 109705. [Google Scholar] [CrossRef]
  24. Kilbas, A.-A.; Srivastava, H.M.; Trujillo, J.J. Theory and Applications of Fractional Differential Equations; Elsevier B. V.: Amsterdam, The Netherlands, 2006. [Google Scholar]
  25. Losada, J.; Nieto, J.J. Properties of a new fractional derivative without singular kernel. Progr. Fract. Differ. Appl. 2015, 1, 87–92. [Google Scholar]
  26. Zine, H.; Lotfi, E.M.; Torres, D.F.M.; Yousfi, N. Taylor’s formula for generalized weighted fractional derivatives with nonsingular kernels. Axioms 2022, 11, 231. [Google Scholar] [CrossRef]
  27. Lin, W. Global existence theory and chaos control of fractional differential equations. J. Math. Anal. Appl. 2007, 332, 709–726. [Google Scholar] [CrossRef] [Green Version]
  28. Marchuk, G.I.; Agoshkov, V.I.; Shutyaev, V.P. Adjoint Equations and Perturbation Algorithms in Nonlinear Problems; CRC Press: Boca Raton, FL, USA, 1996. [Google Scholar]
  29. Diethelm, K.; Ford, N.J.; Freed, A.D. Detailed error analysis for a fractional Adams method. Numer. Algor. 2004, 36, 31–52. [Google Scholar] [CrossRef] [Green Version]
  30. Kabanikhin, S.I. Inverse and Ill-Posed Problems; De Gruyter: Leipzig, Germany, 2012. [Google Scholar]
  31. Atanasov, A.Z.; Georgiev, S.G. A numerical parameter estimation approach of the honeybee population. In Modelling and Development of Intelligent Systems; Springer: Cham, Switzerland, 2021; Volume 1341, pp. 349–362. [Google Scholar]
  32. Atanasov, A.Z.; Georgiev, S.G.; Vulkov, L.G. Parameter identification of colony collapse disorder in honeybees as a contagion. In Communications in Computer and Information Science; Springer: Cham, Switzerland, 2021; Volume 1341, pp. 363–377. [Google Scholar]
  33. Atanasov, A.Z.; Georgiev, S.G.; Vulkov, L.G. Reconstruction analysis of honeybee colony collapse disorder modeling. Optim. Eng. 2021, 22, 2481–2503. [Google Scholar] [CrossRef]
  34. Georgiev, S.; Vulkov, L. Numerical coefficient reconstruction of time-depending integer- and fractional-order SIR models for economic analysis of COVID-19. Mathematics 2022, 10, 4247. [Google Scholar] [CrossRef]
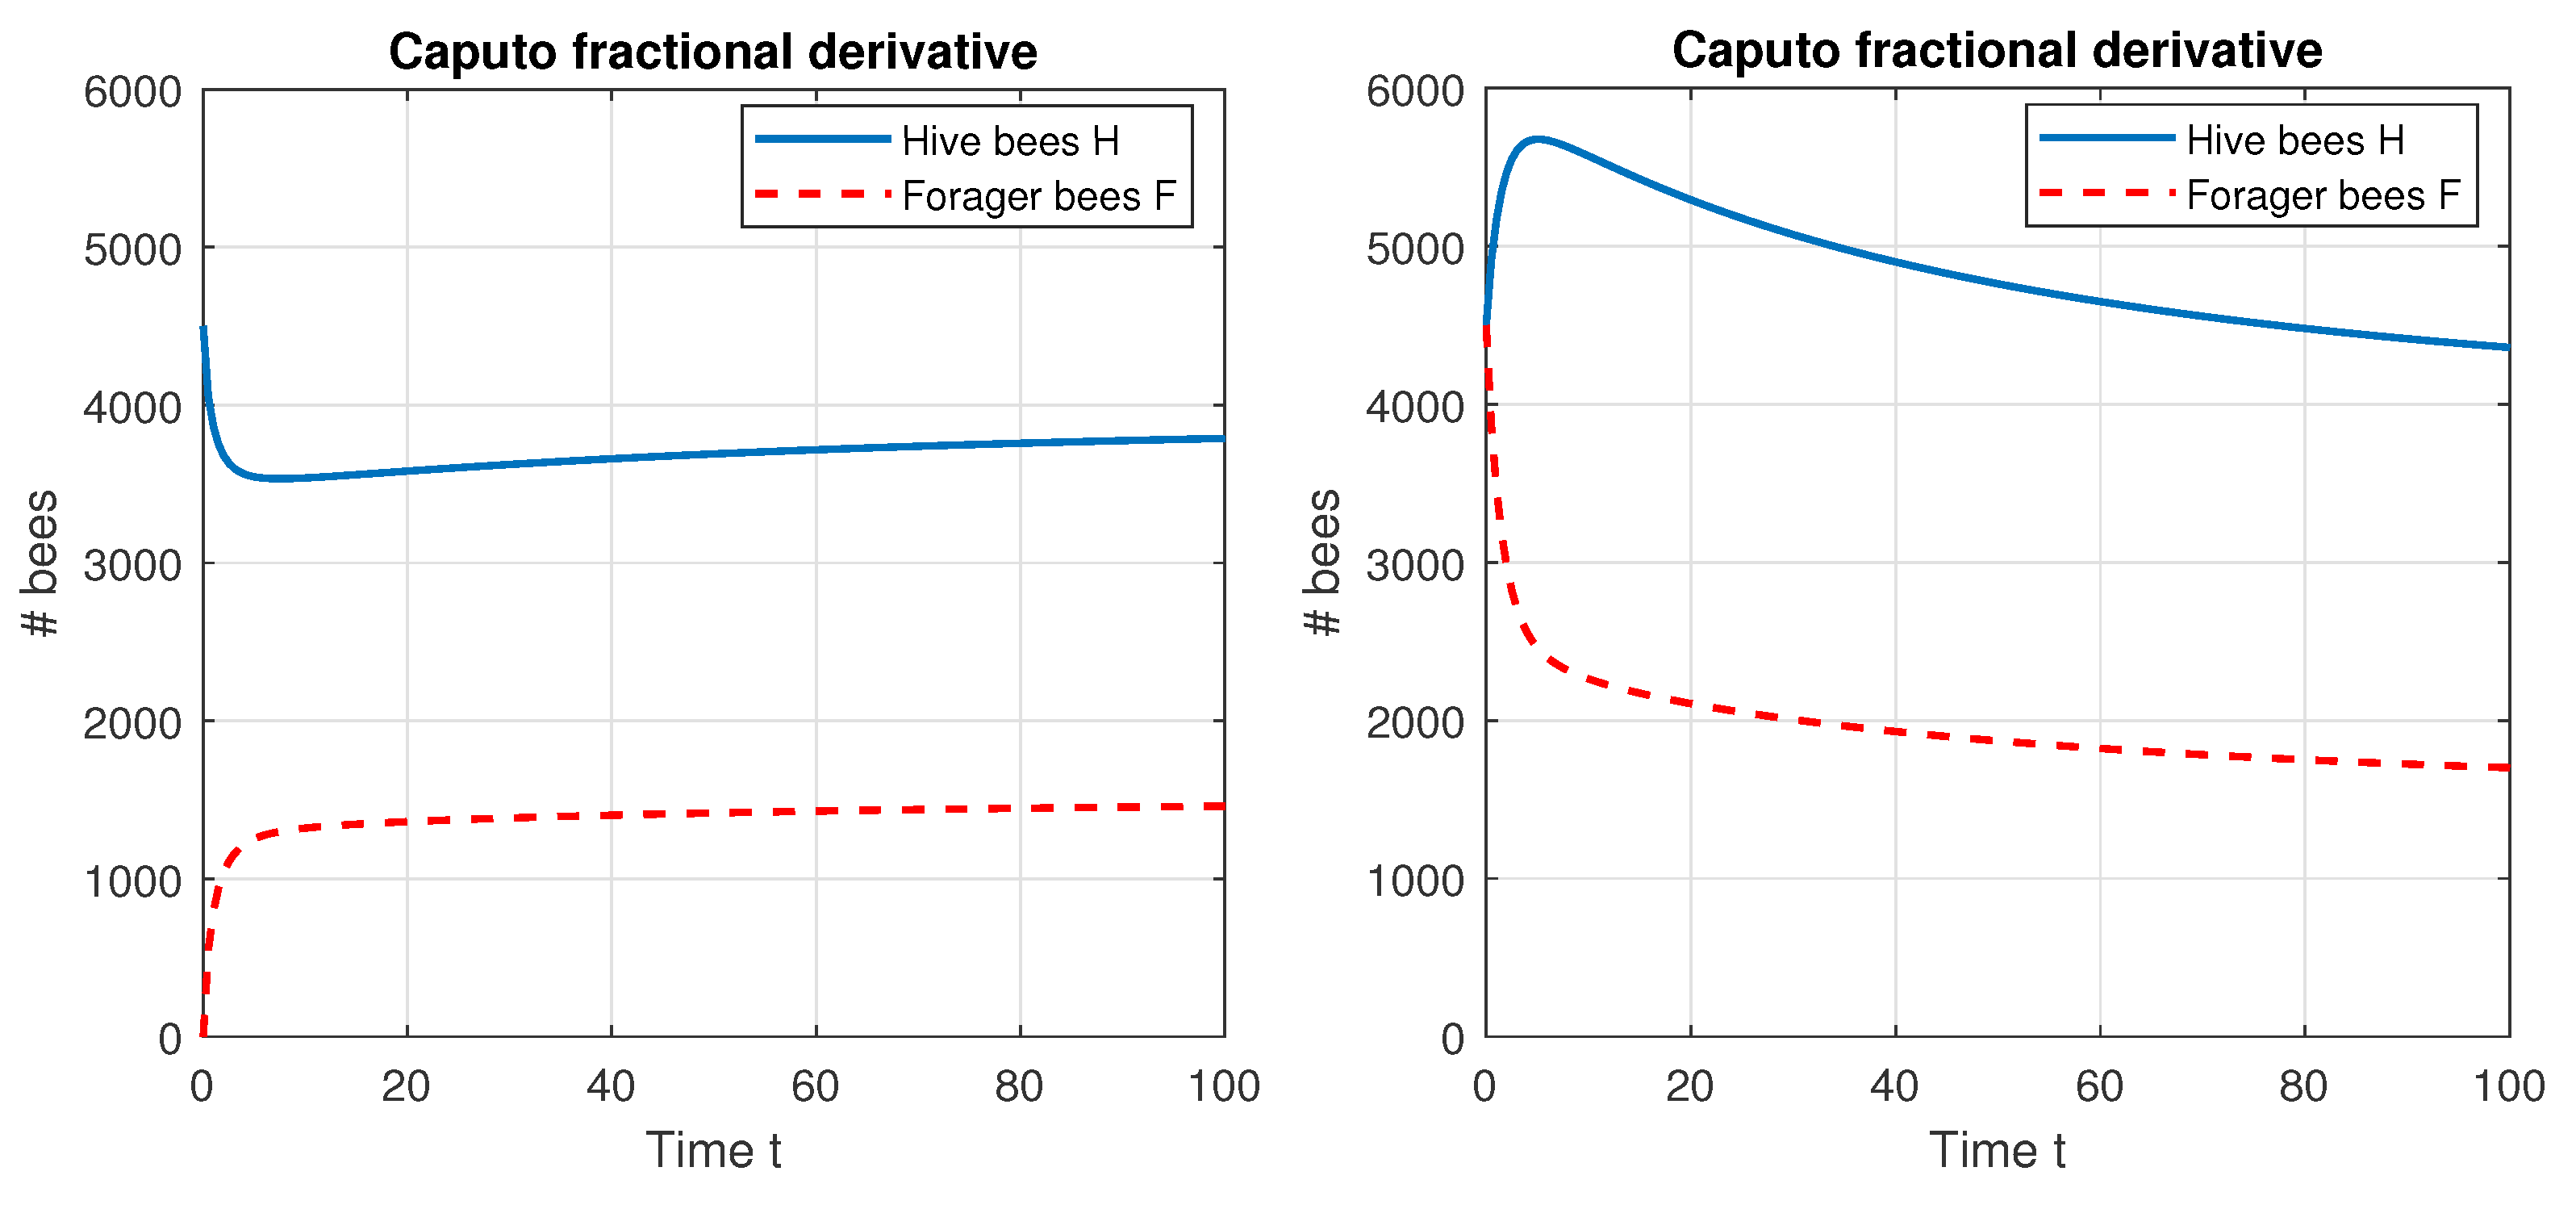
Figure 1. The colony population size for H 0 = 4500 : F 0 = 0 (left), F 0 = 4500 (right), modeled by the Caputo derivative (3a)–(3c).
Fractalfract 07 00311 g001
Figure 2. The colony population size for H 0 = 4500 : F 0 = 0 (left), F 0 = 4500 (right), modeled by the Caputo–Fabrizio derivative (4).
Fractalfract 07 00311 g002
Figure 3. The colony population size for H 0 = 4500 , F 0 = 0 and r = q = 0.95 , modeled by the Caputo (3a)–(3c) (left) and Caputo–Fabrizio derivatives (4) (right).
Fractalfract 07 00311 g003
Figure 4. The convergence of p = ( m , n , α , σ , ω ) and the implied population dynamics (bottom right).
Fractalfract 07 00311 g004
Figure 5. The implied population dynamics with r = 0.9 and q = 0.95 , modeled by the Caputo (3a)–(3c) (left) and Caputo–Fabrizio derivatives (4) (right).
Fractalfract 07 00311 g005
Figure 6. Differences between Caputo and Caputo–Fabrizio models with r = q = 0.95 (left) r = 0.9 and q = 0.95 (right).
Fractalfract 07 00311 g006
Figure 7. The implied population dynamics with the integer-order derivative model ( r = q = 1 ).
Fractalfract 07 00311 g007
Figure 8. The implied population dynamics with model (3a)–(3c) and perturbed observations with 20% noise.
Fractalfract 07 00311 g008
Table 1. Test with Caputo model (3a)–(3c).
Parameter p 0 i p i p ˇ i | p i p ˇ i | | p i p ˇ i | p i r i
m0.200.15400.15382.2148 × 10−40.00143.40 × 10−13
n0.010.00860.00861.0541 × 10−50.00123.25 × 10−15
α 0.300.25000.25011.1786 × 10−44.7145 × 10−44.50 × 10−13
σ 0.700.75000.74995.5183 × 10−57.3578 × 10−51.55 × 10−12
ω 30,00027,00026,9955.16381.9125 × 10−42.55 × 10⁻³
Table 2. Test with Caputo–Fabrizio model (4).
Parameter p 0 i p i p ˇ i | p i p ˇ i | | p i p ˇ i | p i r i
m0.200.15400.15363.5212 × 10−40.00233.40 × 10−13
n0.010.00860.00861.4920 × 10−50.00173.25 × 10−15
α 0.300.25000.25022.4980 × 10−49.9920 × 10−44.60 × 10−13
σ 0.700.75000.75033.0453 × 10−44.0604 × 10−41.60 × 10−12
ω 30,00027,00027,02322.93628.4949 × 10−42.54 × 10⁻³
Table 3. Test with Caputo model (3a)–(3c) with different values of r and q.
Parameter p 0 i p i p ˇ i | p i p ˇ i | | p i p ˇ i | p i r i
m0.200.15400.15397.3542 × 10−54.7754 × 10−43.36 × 10−13
n0.010.00860.00866.0311 × 10−67.0493 × 10−43.34 × 10−15
α 0.300.25000.25011.1972 × 10−44.7887 × 10−44.57 × 10−13
σ 0.700.75000.74999.9080 × 10−51.3211 × 10−41.53 × 10−12
ω 30,00027,00027,01616.08895.9589 × 10−42.63 × 10⁻³
Table 4. Test with Caputo–Fabrizio model (4) with different values of r and q.
Parameter p 0 i p i p ˇ i | p i p ˇ i | | p i p ˇ i | p i r i
m0.200.15400.15417.8712 × 10−55.1112 × 10−43.30 × 10−13
n0.010.00860.00856.7634 × 10−67.9053 × 10−43.34 × 10−15
α 0.300.25000.25011.0681 × 10−44.2724 × 10−44.61 × 10−13
σ 0.700.75000.75044.1135 × 10−45.4847 × 10−41.56 × 10−12
ω 30,00027,00026,69010.01593.7096 × 10−42.63 × 10⁻³
Table 5. Test with the integer-order derivative model ( r = q = 1 ).
Parameter p 0 i p i p ˇ i | p i p ˇ i | | p i p ˇ i | p i r i
m0.200.15400.15391.4229 × 10−49.2398 × 10−43.40 × 10−13
n0.010.00860.00861.4492 × 10−71.6939 × 10−53.15 × 10−15
α 0.300.25000.24963.7857 × 10−41.5143 × 10−34.54 × 10−13
σ 0.700.75000.75003.9556 × 10−65.2741 × 10−61.60 × 10−12
ω 30,00027,00027,05554.88912.0329 × 10−32.66 × 10⁻³
Table 6. Test with Caputo model (3a)–(3c) and perturbed observations with 20% noise.
Parameter p 0 i p i p ˇ i | p i p ˇ i | | p i p ˇ i | p i r i
m0.200.15400.15432.5642 × 10−40.00173.40 × 10−13
n0.010.00860.00861.5084 × 10−50.00183.25 × 10−15
α 0.300.25000.24973.0945 × 10−40.00124.50 × 10−13
σ 0.700.75000.75043.6251 × 10−44.8335 × 10−41.55 × 10−12
ω 30,00027,00027,0077.25132.6857 × 10−42.55 × 10⁻³
Disclaimer/Publisher’s Note: The statements, opinions and data contained in all publications are solely those of the individual author(s) and contributor(s) and not of MDPI and/or the editor(s). MDPI and/or the editor(s) disclaim responsibility for any injury to people or property resulting from any ideas, methods, instructions or products referred to in the content.