Article

Fractal-Based Approaches to Pore Structure Investigation and Water Saturation Prediction from NMR Measurements: A Case Study of the Gas-Bearing Tight Sandstone Reservoir in Nanpu Sag

1
School of Petroleum, China University of Petroleum (Beijing) at Karamay, 355 Anding Road, Karamay 834000, China
2
State Key Laboratory of Petroleum Resources and Prospecting, China University of Petroleum (Beijing), Beijing 102249, China
3
China Petroleum Logging Co., Ltd., Xi’an 710000, China
4
College of Geosciences, China University of Petroleum (Beijing), Beijing 102249, China
*
Authors to whom correspondence should be addressed.
Fractal Fract. 2023, 7(3), 273; https://doi.org/10.3390/fractalfract7030273
Submission received: 9 January 2023 / Revised: 22 February 2023 / Accepted: 17 March 2023 / Published: 21 March 2023
(This article belongs to the Topic Petroleum and Gas Engineering)

Abstract

:
Pore space of tight sandstone samples exhibits fractal characteristics. Nuclear magnetic resonance is an effective method for pore size characterization. This paper focuses on fractal characteristics of pore size from nuclear magnetic resonance (NMR) of tight sandstone samples. The relationship between the fractal dimension from NMR with pore structure and water saturation is parameterized by analyzing experimental data. Based on it, a pore structure characterization and classification method for water-saturated tight sandstone and a water saturation prediction method in a gas-bearing sandstone reservoir have been proposed. To verify the models, the fractal dimension from NMR of 19 tight sandstone samples selected from the gas-bearing tight sandstone reservoir of Shahejie Formation in Nanpu Sag and that of 16 of them under different water saturation states are analyzed. The application result of new methods in the gas-bearing tight sandstone reservoir of Shahejie Formation in Nanpu Sag shows consistency with experimental data. This paper has facilitated the development of the NMR application by providing a non-electrical logging idea in reservoir quality evaluation and water saturation prediction. It provides a valuable scientific resource for reservoir engineering and petrophysics of unconventional reservoir types, such as tight sandstone, low porosity, and low permeability sandstone, shale, and carbonate rock reservoirs.

1. Introduction

Gas-bearing tight sandstone reservoir is a hot field of energy exploration and development [1]. It is an important part of unconventional oil and gas reservoirs and has attracted substantial attention from experts and scholars of reservoir, geology, petrophysical, and other fields [2,3]. Strong pore structure heterogeneity leads to difficulties in reservoir evaluation of flow capacity, seepage characteristics, and gas production prediction [4,5,6].
Since the fractal theory was introduced by Mandelbrot [7], it has been widely applied in pore structure characterization and pore fluid flow investigation associated with porous media [8,9,10]. Li K. et al. described pore structure heterogeneity by means of fractal theory [11,12]. Wang Q. et al. derived a fractal-based permeability model for shale and sandstone and compared its accuracy with common permeability models [13,14]. Song Z. et al. presented evidence that the pore space of tight sandstone is fractal, and the fractal dimension is a function of pore size [15,16]. Rembert et al. studied the electrical characteristics of rock by means of fractal theory and determined the relationship between fractal dimension and Archie model coefficients [17,18]. Shi Y. et al. established a model for rock resistivity with relative permeability from fractal dimension [19]. Karimpouli et al. simulated petro physically digital cores through fractal theory, and the result can meet the expected requirements [20,21].
As the pore space of sandstone samples has been proven to exhibit fractal properties, a growing interest is raised in applying fractal characteristics of pore space to reservoir evaluation. Especially, fractal dimensions of pore space have been studied extensively [22] and mainly applied in the analysis of pore structure [23]. Nuclear magnetic resonance (NMR) T2 spectra provide measurements of pore space distribution [24,25,26]. However, reports about applying fractal dimensions from NMR in pore structure characterization and water saturation prediction of tight sandstone are rare.
This paper studies the relationship of fractal dimensions from NMR with pore structure parameters and water saturation of gas-bearing tight sandstone. According to double fractal theory and T2cut value, the fractal dimension from NMR, including the fractal dimension of the macro-pore system D v a and that of the micro-pore system D v b , is derived. 19 tight sandstone samples selected from the gas-bearing tight sandstone reservoir of Shahejie Formation in Nanpu Sag have proved that for rock samples with similar pore structure (showing similar T2 spectra monography), their D v a and D v b values are centralized within specific ranges and are independent of porosity. Additionally, D v a is in direct ratio to T2lm and Swir, but D v b has no obvious correlation with these two parameters. In addition, 16 of the samples under different water saturation have revealed decreasing S w versus increasing D v a , but D v b has little variation, and Δ D v a (the increment of D v a ) is directly related to the water saturation. Based on the above, a pore structure characterization and classification method for water-saturated tight sandstone and a water saturation prediction method in a gas-bearing tight sandstone reservoir have been proposed. The application result of new methods in the gas-bearing tight sandstone reservoir of Shahejie Formation in Nanpu Sag shows consistency with experimental data. Thus, the fractal dimension from NMR can be used in pore structure characterization, classification, and water saturation prediction, providing a non-electrical idea for the qualitative identification and evaluation of gas-bearing tight sandstone reservoirs. It has a reference and guiding significance for the gas-bearing recognition of other types of reservoirs.

2. Methodology

2.1. Pore Structure Investigation of Water-Saturated Tight Sandstone Based on Fractal Analysis from NMR Spectra

As claimed by some researchers, pore space in clastic rock has exhibited a certain degree of self-similarity [16], indicating that the fractal theory can be used to predict the distribution property of pore size. By means of fractal geometry, the following model for pore space distribution in clastic rock has been proposed [27]:
S = r r m a x 3 D r
where r (μm) is the pore radius; r max (μm) is the maximum radius of pores; S (%) is the volume ratio of pores whose pore radius is within the range from 0 to r ; D r (none) is the fractal dimension of pore size, generally 0 < D r < 3 . In Equation (1), S is related to measured scale r through fractal dimension D r .
According to NMR relaxation principle, pore fluids in sandstone involve three relaxation mechanisms: surface relaxation; bulk relaxation; and diffusion relaxation. As bulk relaxation time and diffusion relaxation time of water-saturated rock samples can be ignored, the relationship between surface relaxation and pore size in water-saturated rock is
1 T 2 = ρ S V = F s ρ r
where T 2 (ms) is the surface relaxation time; ρ (μm/ms) is the surface relaxivity (i.e., T2 relaxing strength of the grain surfaces); F s (none) is the pore geometry factor; S (μm2) is the pore surface area; and V (μm3) is the pore volume. Moreover, (S/V), the ratio of pore surface to fluid volume, is a measure of pore size.
Bringing Equation (2) into Equation (1) obtains
S v = T 2 m a x T 2 D v 3
where S v (%) is the volume ratio of pores whose surface relaxation are within the range from 0 to T 2 ; T 2 m a x (ms) is the maximum surface relaxation time of pores; D v (none) is the fractal dimension of pore size determined by NMR T2 spectra curve.
A lot of works have reported that the pore space of the rock has multi-dimensional fractal features [16]. For the mobility of reservoir fluids being primarily controlled by pore space, pore water in tight sandstone can be grouped into movable water and immovable water according to flow capacity. T2 value relates directly to pore size in water-saturated rock. Assuming movable water is mainly held in a macro-pore system, which has responses of big T 2 value, and immovable water resides in a micro-pore system, corresponding to small T 2 value, NMR T2cut value can be used as an inflection point to divide the NMR T2 spectral curve into two segments. By means of a double fractal method [28], the D v is given by
D v = D v a , T 2 T 2 c u t , T 2 m a x D v b ,   T 2 T 2 m i n ,   T 2 c u t
where T 2 c u t (ms) is a fixed T2 value separating movable fluids occupied macro-pores and immovable fluids occupied micro-pores; T 2 m i n (ms) is the minimum transverse relaxation time of pores; D v a and D v b are fractal dimensions of the macro-pore system and micro-pore system from NMR, respectively.
Then, Equation (3) is rewritten as
L o g 10 S v = D v a 3 L o g 10 T 2 m a x L o g 10 T 2 ,   T 2 T 2 c u t , T 2 m a x D v b 3 L o g 10 T 2 m a x L o g 10 T 2 ,   T 2 T 2 m i n ,     T 2 c u t
Equation (5) is the fractal model for pore size distribution in water saturated tight sandstone reservoirs studied from NMR measurements. It has shown a piecewise linear relationship between L o g 10 S v and L o g 10 T 2 , and line slopes of macro-pore and micro-pore systems are directly related to their fractal dimensions from NMR, respectively indicating that fractal dimensions from NMR are corresponding to pore space heterogeneity and can be used to characterize pore structure.

2.2. Water Saturation Prediction Method of Gas-Bearing Tight Sandstone Based on Fractal Analysis from NMR Spectra

Based on Equation (3), the NMR-based fractal model of water-saturated rock is
S v , 0 = T 2 m a x , 0 T 2 D v , 0 3
where, S v , 0 (%) is the volume ratio of pores, whose surface relaxation is within the range from 0 to T 2 ; T 2 m a x , 0 (ms) is the maximum surface relaxation time of pores; D v , 0 (none) is the fractal dimension of pore size from NMR. NMR-measured porosity of water saturated rock is ϕ 0 , it is approximately equal to total porosity of the rock sample. T 2 m a x , 0 is the NMR response of the maximum pore.
In gas-bearing sandstone reservoirs, NMR measurements mainly respond to the presence of hydrogen protons in water because the gas signal is difficult to be captured due to its rapid diffusion. As a result, the signal of pores filling with gas is lost by NMR measurements. In Figure 1, pores of different sizes are simplified as circles with different diameters, water is shown in blue, and gas is colored yellow. The pore size distribution of the water-saturated rock sample (as shown in Figure 1A) satisfies Equation (6). When the maximum pore is filling with gas (as shown in Figure 1B), the NMR response of gas-filling pores is ignorable, the pore size distribution of the equivalent rock (as shown in Figure 1E) satisfies
S v , 1 = T 2 m a x , 1 T 2 D v , 1 3
In Equation (7), S v , 1 (%) is the volume ratio of pores, whose surface relaxation is within the range from 0 to T 2 . T 2 m a x , 1 (ms) is the maximum surface relaxation time of pores of the equivalent rock shown in Figure 1E. ϕ 1 is approximately equal to total porosity minus the porosity of the gas-filled pore. D v , 1 is the fractal dimension from NMR.
Gas, as a non-wetting phase, preferentially enters into macro-pores, it continuously enters into the pore space from macro- to micro-pores with the increase in pressure. In this way, pores filling with gas are unable to be detected by NMR when the i-th largest pore is filling with gas, as shown in Figure 1C, its pore structure model from NMR is shown in Figure 1F. NMR measured porosity is ϕ i and the maximum surface relaxation time of pores is T 2 m a x , i . The pore size distribution of the equivalent rock satisfies the following two equations:
S v , i = T 2 m a x , i T 2 D v , i 3
L o g 10 S v , i = D v , i 3 L o g 10 T 2 m a x , i L o g 10 T 2
In Equation (9), it can be seen that the fractal dimension from NMR D v , i is a function of both water saturation (it can be calculated by ϕ i / ϕ 0 as the sum of gas filling porosity and water occupied porosity is 1 in as-bearing sandstone reservoirs) and pore size distribution.
Further, using function f to express the relationship between water saturation and fractal dimension variation Δ D v   ( = D v , i D v , 0 ),
Δ D v = D v , i D v , 0 = f S w
Then, Equation (8) is given as
S v , i = T 2 m a x , i T 2 f S w + D v , 0 3
Equation (11) shows the relationship between the fractal dimension from NMR and water saturation in gas-bearing tight sandstone reservoirs. It is the fractal-based method of water saturation prediction in gas-bearing sandstone reservoirs from NMR data.

3. Model Validation

In this research, a total of 19 tight sandstone samples collected from five boreholes are selected from the gas-bearing tight sandstone reservoir of Shahejie Formation in Nanpu Sag. The sandstone has undergone strong compaction and cementation; it is featured with low porosity, low permeability, and strong pore structure heterogeneity. Its location near Shahejie source rock in Nanpu depression makes it one of the most important gas potential areas in east China. More details of geological settings are available in previous studies [29,30,31]. Testing includes two procedures. Firstly, all samples are tested and analyzed for physical properties. Secondly, NMR experiments of samples under different water saturations are performed. All samples are shaped into cylinders with a diameter of 2.5 cm and a length of 4.9 (±0.2) cm, washed with dichloromethane and distilled water, and then dried. Porosity is determined by the Porerm-200 instrument (Core Lab Corporation, Houston, TX, USA) through helium injection, and permeability is measured by the STY-2 gas permeability tester by using helium as the carrier gas. Irreducible water saturation Swir is determined using a centrifuge of 150 psi pressure. T2 spectra under different water saturation states (the samples are firstly water-saturated and then centrifuged with different speeds) are measured by MARAN-II equipment operated at 35 °C; the resonance frequency is 2 MHz, the waiting time is 6000 ms, and echo spacing is 0.2 ms; the number of scans is 128. T2cut is determined by comparing T2 spectra obtained on fully and partially water-saturated core samples. T2lm is the geometrical mean of the relaxation spectra.
Table 1 shows the specific parameters of all 19 samples. Ranges of the measured porosity and permeability are (5.7, 15.3) % and (0.151, 31.125) md, respectively; the average value is 11.21% and 5.62 md. However, as the burial depth is more than 4300 m, the overburden pressure has an obvious influence on reservoir porosity and permeability. According to previous studies [29,30,31], porosity and permeability under reservoir conditions generally decrease about 20–10% compared with the measured permeability under normal pressure. Thus, these samples belong to tight sandstone.

3.1. Pore Structure Characterization Method Based on Fractal Analysis from NMR Spectra

19 samples can be classified into five groups according to NMR T2 curves morphology, including Type A (no. 1–7, shown in Figure 2A), Type B (no. 8–9, shown in Figure 2B), Type C (no. 10–15, shown in Figure 2C), Type D (no. 16–17, shown in Figure 2D), and Type E (no. 18–19, shown in Figure 2E). Type A is dominant of the right unimodal pattern with a T2 peak (corresponding T2 value of the curve peak) of 200 ms, representing a higher proportion of macro-pores; Type B is featured with a balanced bimodal pattern with two T2 peaks of 100 ms and 3 ms, indicating similar proportions of macro-pores and micro-pores; Type C is characterized by the right unimodal pattern with a T2 peak of 30 ms; Type D is mainly of unimodal pattern with a T2 peak of 10 ms, and Type E is left bimodal pattern with a T2 peak of 1 ms, showing that Type D and Type E are dominantly made of micro-pores. In Table 1, for Type A, B, C, D, and E, the average Swir is 21.58%, 47.73%, 48.83%, 60.7%, and 56.66%, and the average permeability is 13.7 md, 1.79 md, 1.07 md, 0.27 md, and 0.18 md, respectively. It indicates that as the T2 curve transforms from Type A to Type E, the T2 peak moves from right to left and corresponds to an increasing micro-pores proportion, increasing Swir and decreasing permeability, indicating that the pore structure becomes more complex.
Figure 3 shows D v a and D v b distribution ranges of Types A–E. D v a and D v b are derived from Log 10 S v Log 10 T 2 line slopes of the macro-pore system and micro-pore system according to Equation (5). The calculated D v a and D v b are listed in Table 1. In Figure 3, D v a and D v b distributions are marked in grey and red, respectively. The calculated D v a and D v b ranges are [2.48, 2.59] and [1.21, 1.46] for Type A, [2.78, 2.80] and [1.15, 1.19] for Type B, [2.70, 2.78] and [1.18, 1.54] for Type C, [2.80, 2.85] and [1.69, 1.70] for Type D, and [2.80, 2.85] and [1.69, 1.70] for Type E. The result shows that the D v a and D v b value of the same rock type, which has similar T2 curve morphology, although with different porosity, is centrally distributed, indicating that rock samples having similar pore structures have similar fractal dimensions.
Based on the analysis above, a pore structure classification scheme according to D v a and D v b is made. In Figure 4, 5 types of pore structure, including Types I, II, III, IV, and V, are grouped on D v a D v b cross plot; they are colored in grey, red, green, purple, and blue, respectively. Type I is within the range of 2.63 D v a > 0 and 3 > D v b 1.2 ; it is characterized by the most favorable petrophysical properties, the permeability higher than 4 md, T2 curve of right unimodal pattern with a peak of more than 100 ms and low immovable water content. Type II is dominantly distributed within 2.77 D v a > 0 and 1.2 D v b > 0.9 and 2.85 D v a > 2.77 and 1.5 D v b 1.2 . It usually has good petrophysical properties and is featured by the permeability of between 0.4 md and 4 md, T2 curve of balanced bimodal pattern, and relatively low immovable water content. Type III mainly occupies the area 2.77 D v a > 2.63 and 3 > D v b 1.2 ; it has relatively good petro physical properties; the permeability is within 0.4–4 md; it is characterized by the T2 curve of right unimodal pattern with a peak of less than 100 ms and relatively low immovable water content. Type IV is distributed within 2.85 D v a > 2.77 and 3 > D v b > 1.5 ; it has poor petro physical properties; its permeability is less than 0.4 md, and it has T2 curve of unimodal pattern and relatively high immovable water content. Type V is mainly distributed within 3 > D v a > 2.85 and 0.9 D v b > 0 ; it has the poorest petrophysical properties; it has a permeability of less than 0.4 md, T2 curve of left bimodal pattern and high immovable water content. Further, from 19 rock samples in Figure 4, it can be seen that samples 1–7, marked by black squares, fall into Type I; samples 8–9, marked by red dots, land within Type II; samples 10–15, marked by green triangles, scatter across Type III; rock samples 16–17, marked by purple inverted triangles, belong to Type IV, and samples 18–19, marked by blue diamonds, are classified into Type V. The result indicates that pore structure classification can be achieved based on fractal analysis from NMR spectra.

3.2. Water Saturation Prediction Method Based on Fractal Analysis from NMR Spectra

Among 19 rock samples listed in Table 1, T2 spectra of 16 samples under different water saturation states are obtained, and their specific parameters are listed in Table 2. Figure 5 shows T2 spectra, cumulative curves, and corresponding fitting models under different water saturation states of a representative rock sample of each pore structure type. In this section, the pore size is divided into macro-pores and micro-pores according to T2cut.
Views from left to right include T2 spectra of different water saturation states of a representative rock sample of each pore structure type discussed in Section 3.1 (X: T2/ms, Y: porosity S (T2)/%), corresponding cumulative curves under different water saturation states and fitting models of micro-pores, enlarged view of cumulative curves of macro-pores (circled by the orange dotted square in middle view), and corresponding fitting models. T2cut is plotted by the solid orange line. Figure 5A shows T2 spectra, cumulative curves, and corresponding fitting models of both macro-pores (right view) and micro-pores (middle view) of No. 4 from Type A under different water saturation: 100% (black line); 6.61% (red line); 28.11% (blue line); 18.32% (pink line); 16.72% (green line). Figure 5B shows T2 spectra, cumulative curves, and corresponding fitting models of both macro-pores (right view) and micro-pores (middle view) of No. 9 from Type B under different water saturation: 100% (black line); 82.37% (red line); 64.92% (blue line); 49.35% (green line). Figure 5C shows T2 spectra, cumulative curves, and corresponding fitting models of both macro-pores (right view) and micro-pores (middle view) of No. 15 from Type C under different water saturation: 100% (black line); 93.39% (red line); 71.08% (blue line); 53.6% (pink line); 48.98% (green line). Figure 5D shows T2 spectra, cumulative curves, and corresponding fitting models of both macro-pores (right view) and micro-pores (middle view) of No. 17 from Type D under different water saturation: 100% (black line); 89.7% (red line); 84.79% (blue line); 64.74% (pink line); 58.64% (green line). Figure 5E shows T2 spectra, cumulative curves, and corresponding fitting models of both macro-pores (right view) and micro-pores (middle view) of No. 19 from Type E under different water saturation: 100% (black line); 95.26% (red line); 87.57% (blue line); 56.65% (pink line); 54.6% (green line).
The result shows that as S w decreases, D v a increases, but D v b has little variation. When S w decreases to S w i r , D v a approximately equals 3. It also can be seen that as pore structure transferred from Type A to Type E, the maximum value of Δ D v a (the difference between D v a under S w i r state and that under 100% S w state) becomes smaller.
The following two reasons have been explained: firstly, when large pores fill with gas, the residual water-saturated pores are still satisfied with the fractal theory, and variance of water saturation leads to the change of fractal dimension from NMR according to Equation (11). As water saturation variation is commonly caused by the volume change of movable water, while the immovable water seldom has changed; thus, water saturation variation results in the D v a change. Secondly, from Type A to Type E, as pore structure gets worse, immovable water content increases gradually, and movable water content decreases, the influence of water saturation on D v a decreases, responding to the decrease in Δ D v a .
Figure 6 shows the relationship between Δ D v a and S w , and the relationship model is
Δ D v a = D v a , i D v a , 0 = 1.0101 S w + 0.40813 S w 2 + 0.60141
The goodness of fit is 0.97469. As S w is within the range of [0, 1], Δ D v a is a monotonic increasing function of water saturation in Equation (12). Thus, the following water saturation prediction model is obtained:
S w = 2.7955 Δ D v a 2 + 3.0032 Δ D v a + 0.9791

4. Application

New methods are applied in the interval of 4385–4425 m in Well ×5 in the Jidong field, belonging to the gas-bearing tight sandstone reservoir of the Shahejie formation [32,33]. In the study area, T2 spectra are measured by CMR, and T2cut value adopts 15 ms. According to T2 spectra and T2cut, parameters of successive depth, including the fractal dimension D v a and D v b , irreducible porosity is obtained. As discussed above, gas bearing mainly has affection on macro-pores and leads to the variance of D v a . Thus, Δ D v a is the point to calculate water saturation S w . To solve it, we have found that D v a , 0 ( D v a under 100% S w state) has a positive relationship with Swir, as discussed in Section 5.2. Then, Δ D v a = D v a D v a , 0 can be calculated by Equation (14). Swir is the ratio of NMR-derived irreducible porosity, and the density-derived total porosity, S w , is calculated by Equation (13). Pore structure can be typed according to the projection of ( D v a , 0 , D v b ) in Figure 4. The evaluation result is shown in Figure 7, and specific parameters of layers 1–9 are listed in Table 3.
D v a , 0 = 0.00781 S w i r + 3.61315
Tracks from left to right include Tracks 1–5: natural gamma-ray logging (GR: GAPI); depth (meters); geo-logging lithology; apparent resistivity logs (RLLD/RLLS: OHMM); acoustic-wave slowness logs (AC:us/m)/bulk density (DEN: g/cm3)/neutron porosity (CNL: %). Track 6: CMR T2 spectra Track 7: T2 calculated permeability (PERM: md). Track 8: the fractal dimension from NMR (DVA/DVB: none); DVA under 100% Sw state (DVA0:none). Track 9: irreducible water saturation (SWIR: v/v) calculated according to T2cut/experimental data (dotted SWIR: v/v). Track 10: water saturation computed by the Archie model (SW: V/V)/experimental irreducible water saturation of rock samples (SWIR:V/V). Track 11: water saturation computed by the new method (SWT2: V/V)/experimental irreducible water saturation of rock samples (SWIR: V/V). Track 12: new method derived pore structure type (PORE_TPYE). Track 13: layer number.
In Figure 7, it can be seen that the pore structure classification result is consistent with geo-logging lithology and permeability calculated from T2 spectra. The pore structure of shale recorded by geo-logging is classified into Type V by the new method. Furthermore, the permeability of the reservoir with pore structures of Types I and II (Layers 3–6) is higher than that with pore structures dominantly composed of Types IV and V (Layers 2,7–9). The result indicates that pore structure characterization and classification methods based on fractal analysis from NMR spectra can be used in quality reservoir prediction of tight sandstone.
It also can be seen that the calculated water saturation is in good agreement with experimental data, and its accuracy is improved than when calculated by the Archie model. For Layer 5–6, the calculated water saturation (SWT2) basically equals irreducible water saturation (SWIR); its production result is 1 × 10⁴ m3 gas without water, which indicates that the water saturation prediction method based on fractal analysis from NMR spectra can be used in reservoir evaluation of tight sandstone.

5. Discussion and Future Work

5.1. Relationship of the Fractal Dimension from NMR with the Pore Size from the T2 Spectrum

To analyze the relationship between the fractal dimension ( D v a and D v b ) from NMR and the pore size from the T2 spectrum, according to positions and ranges of the T2 peak value of rock samples, the T2 value is subdivided into five parts, corresponding to five ranges of pore size. Figure 8 shows the corresponding relationship between the T2 spectrum and pore size. In Figure 8, f 1 (T2 range of 70–900 ms), f 2 (T2 range of 20–70 ms), f 3 (T2 range of 5–20 ms), f 4 (T2 range of 2–5 ms), and f 5 (T2 range of 0.1–2 ms) are marked in grey, green, purple, orange, and blue, respectively. For 19 rock samples, the volume fraction of each pore size type is calculated and listed in Table 1.
As discussed above, movable water dominantly resides in macro-pores, and immovable water mainly occupies micro-pores. According to the T2cut range of 19 rock samples in Table 1, D v a has a relationship with f 1 and f 2 , and D v b is the function of f 3 , f 4 , and f 5 . Relationships between the fractal dimension from NMR and volume fraction are shown in Equations (15) and (16):
D v a = 3.12844 0.7203 f 1 0.7524 f 2 ,   R = 0.92278
D v b = 1.14533 + 2.7365 f 3 1.3372 f 4 1.6889 f 5 ,   R = 0.78624
The result shows that the fractal dimension D v a is inversely proportional to f 1 and f 2 ; it indicates that increasing f 1 and f 2 , which are occupied by movable water leads to decreasing bound water content and fractal dimension D v a . Additionally, the fractal dimension D v b is in inverse ratio to f 4 and f 5 , while it is in direct ratio to f 3 . In other words, increasing f 4 and f 5 results in decreasing fractal dimension D v b , but increasing f 3 leads to increasing fractal dimension D v b . Figure 9 shows the comparison between the fractal dimension derived from Log 10 S v Log 10 T 2 line slopes and the calculated fractal dimension by Equations (15) and (16). D v a and D v b are marked in red and black, respectively. It can be seen that the goodness of fit is 0.92278 and 0.78624 for D v a and D v b , indicating that pore structure characterization can be achieved based on fractal analysis of the NMR spectra.

5.2. Relationship of the Fractal Dimension from NMR with Swir and T2lm

Figure 10 and Figure 11 show the relationship of the fractal dimension from NMR D v ( D v a colors red and D v b colors black) of 19 water-saturated rock samples with irreducible water saturation Swir and geometrical mean of the relaxation spectra T2lm, respectively. Specific parameters are listed in Table 1. The result shows that D v a has a positive relationship with Swir and T2lm, while D v b is unrelated to Swir or T2lm. Relationship models are
D v a = 0.00781 S w i r + 3.61315
D v a = 2.99586 + 0.5815 T 2 l m 0.49308
The goodness of fit of Equations (17) and (18) are 0.91249 and 0.92794, respectively.
The following reasons can explain it: T2lm and Swir are important reflection parameters of pore structure. In sandstone reservoirs, greater T2lm and lower Swir commonly represent a higher proportion of macro-pores, which indicate higher fluid flow capacity and more favorable pore structure. According to Equation (17), the fractal dimension D v a , mainly reflecting the characteristics of macro-pores, directly affects pore structure and fluid flow capacity. Thus, D v a is in direct ratio to T2lm and Swir. However, D v b is a characteristic parameter of micro-pores, which are dominantly occupied by immovable water and have little contribution to pore structure or fluid flow capacity; thus, it has no obvious correlation with T2lm and Swir.

5.3. Fractal-Based Water Saturation Prediction Model from NMR

As discussed in Section 2.2, in the water-saturated rock, when macro-pores fill with gas, the residual water-saturated pores are still satisfied with fractal theory, and its fractal dimension from NMR decreases. Figure 6 and Equation (12) have illustrated the relationship between S w and Δ D v a of 16 rock samples; the result indicates that for gas-bearing tight sandstone with different pore structures, S w - Δ D v a relationship models are similar. The error in Figure 6 and Equation (12) mainly results from experimental data and T2 spectrum inversion. In Figure 7, the water saturation calculated by Equation (13) is consistent with experimental water saturation. The error mainly results from the NMR signal-to-noise ratio, error of Equation (13), and error of irreducible water saturation calculated with a fixed T2cut value.

5.4. Future Work

Further research directions and subjects concerning pore structure investigation and water saturation prediction methods for gas-bearing tight sandstone based on fractal analysis from NMR may be anticipated in the following:
  • The fractal dimension of tight sandstone is closely related to its pore structure [34]. The pore structures in the different study areas have their specific fractal features and may be characterized by double [35], triple, or multi-fractals. Launching research to figure out fractal characteristics in a specific study area is necessary;
  • The double fractal theory is the basis of the water saturation prediction method based on the fractal dimension from NMR proposed in this paper. In order to improve the accuracy, multi-fractal theory can be introduced to establish the water saturation prediction model;
  • At present, 2D NMR logging is widely used in reservoir evaluation, and the research on fractal characteristics of 2D NMR is a new hot spot;
  • For T2, the relaxation characteristics of oil-bearing sandstone differ greatly from that of gas-bearing sandstone [36]. The water saturation prediction model for gas-bearing sandstone proposed in this paper cannot be applied in oil-bearing sandstone reservoirs, but it still has reference and guiding significance for deriving a water saturation prediction model for oil-bearing sandstone;
  • The multi-fractal theory has been widely applied in porous sandstone, describing fractal characteristics of pore space [37,38]. It can be further applied to carbonate and volcanic reservoirs;
  • The T2cut and T2lm are very important parameters for our research results, and lots of factors have significant affection on their values, such as pore size, clay content, pressure, and others. Previous studies have proved that factors leading to the decrease in the T2cut and T2lm include the compressed rock matrix, the growth of clay content, and hydrocarbon limiting in micro-pores. In the extending application of the new method in various types of hydrocarbon-bearing reservoirs, it is necessary to conduct experiments and analysis on the influence factors on the T2cut and T2lm.

6. Conclusions

In this paper, we focus on the fractal characteristics of the pore size of tight sandstone from NMR. According to the double fractal theory and T2cut value, the fractal dimension from NMR of both macro-pore system D v a and of micro-pore system D v b are derived. In addition, the relationship of the fractal dimension from NMR with pore structure and water saturation is analyzed. Based on it, a pore structure characterization and classification method for water-saturated tight sandstone and a water saturation prediction method in a gas-bearing tight sandstone reservoir are proposed. The main conclusions are as follows:
(1)
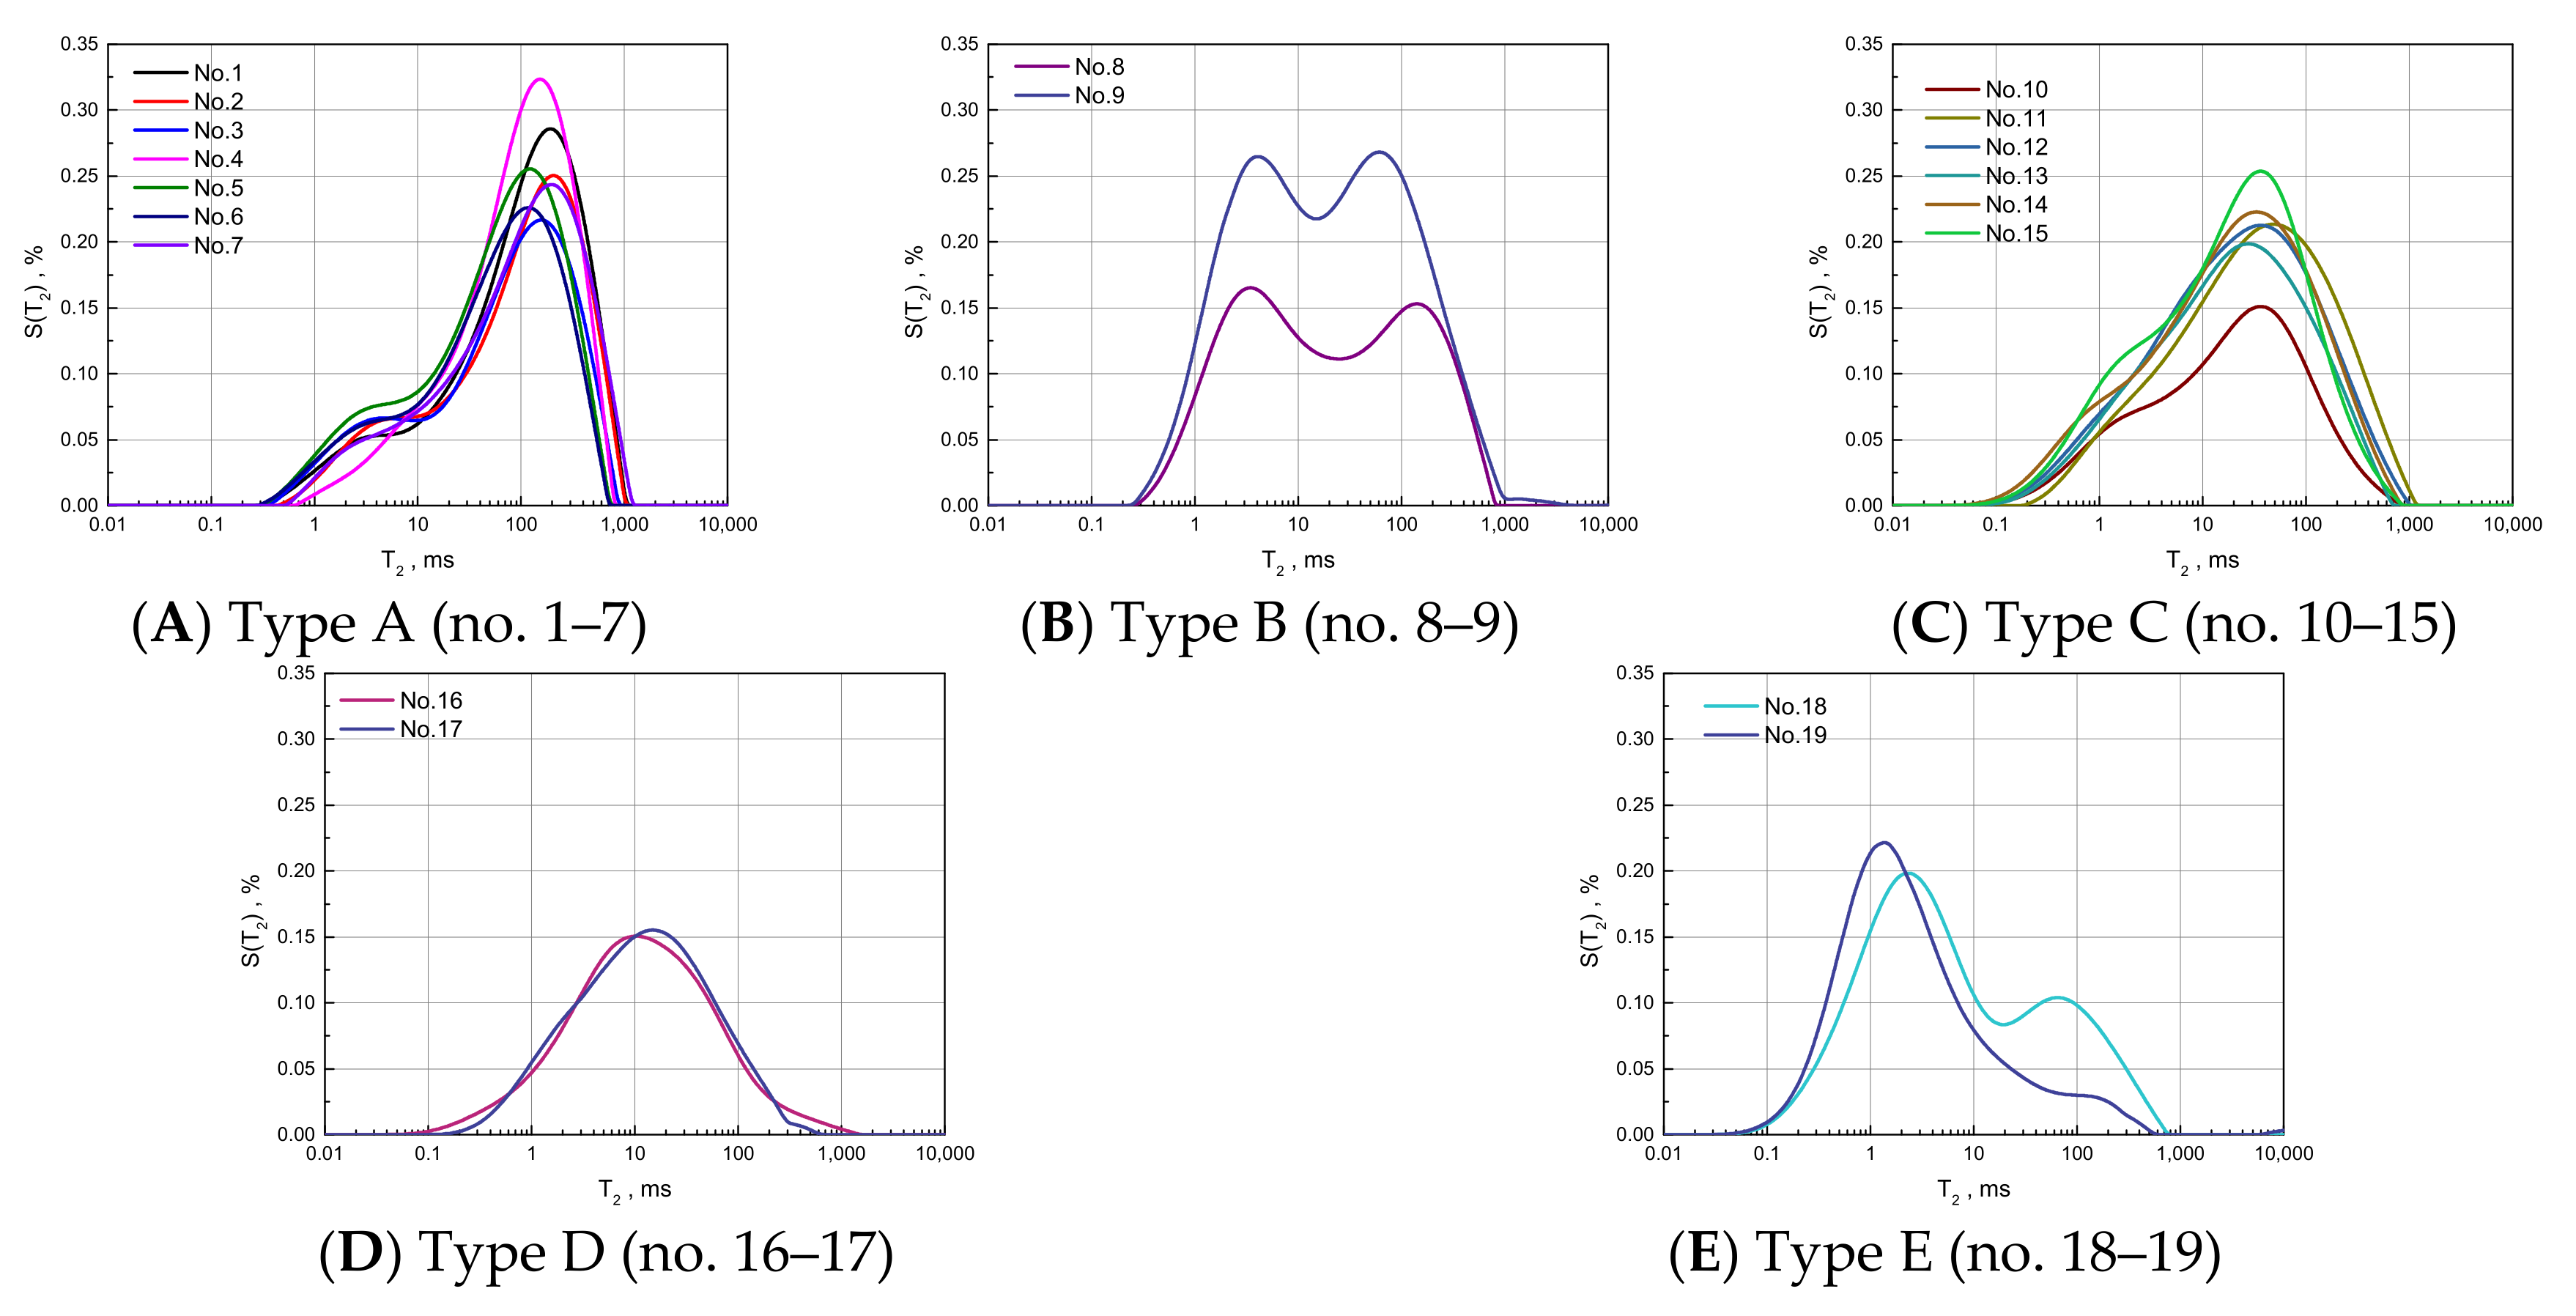
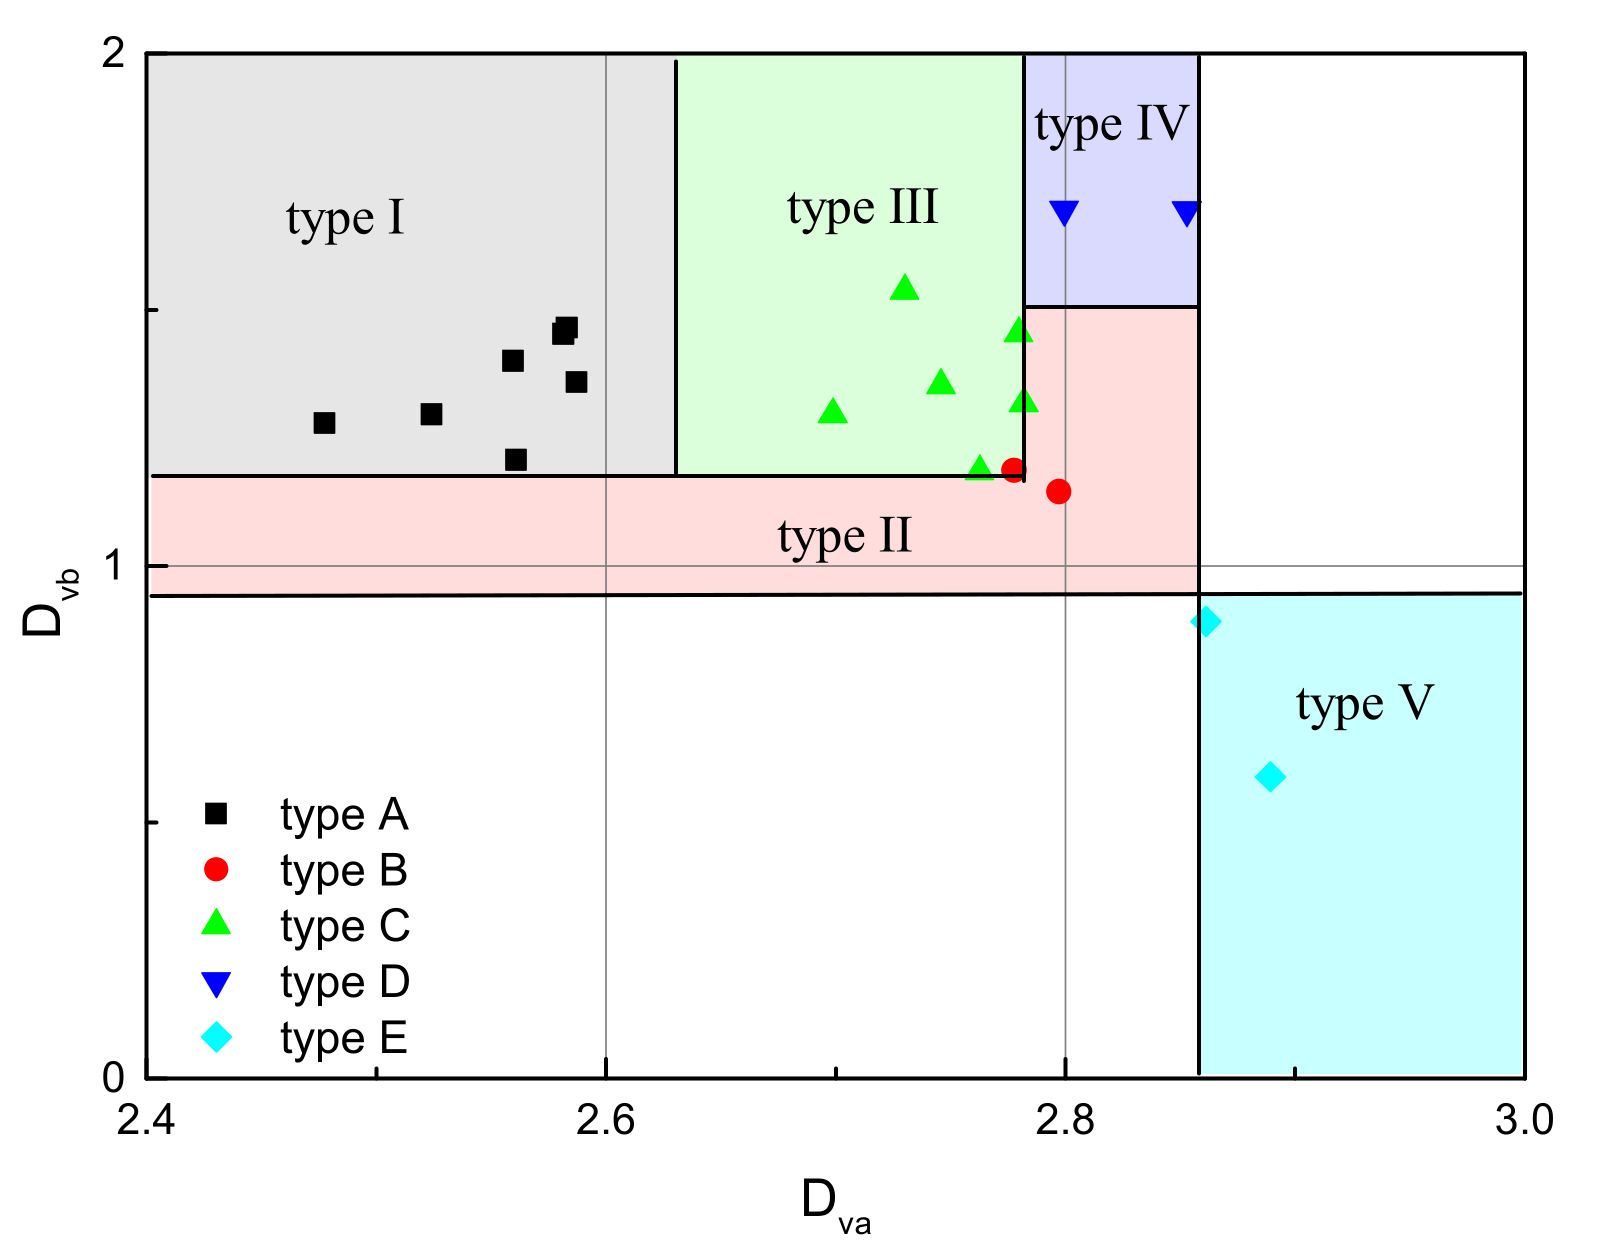
Rock samples having similar pore structures have similar fractal features. The experimental data show that samples have a similar T2 curve monography, although the porosity differs, and D v a and D v b values are centrally distributed. This is the basis for pore structure characterization and classification method based on the fractal dimension from NMR. In addition, D v a is in direct ratio to T2lm and Swir, but D v b has no obvious correlation with these two parameters;
(2)
To analyze the relationship between pore size and the fractal dimension from NMR, pore size is divided into five types according to T2 spectra ranges, including f 1 (T2 range of 70–900 ms), f 2 (T2 range of 20–70 ms), f 3 (T2 range of 5–20 ms), f 4 (T2 range of 2–5 ms), and f 5 (T2 range of 0.1–2 ms). The fractal dimension D v a is inversely proportional to f 1 and f 2 , increasing f 1 and f 2 , which are occupied by the movable water, leading to decreasing bound water content and fractal dimension D v a . The fractal dimension D v b is in inverse ratio to f 4 and f 5 , while it is in direct ratio to f 3 , increasing f 4 and f 5 results in decreasing fractal dimension D v b , but increasing f 3 leads to increasing fractal dimension D v b ;
(3)
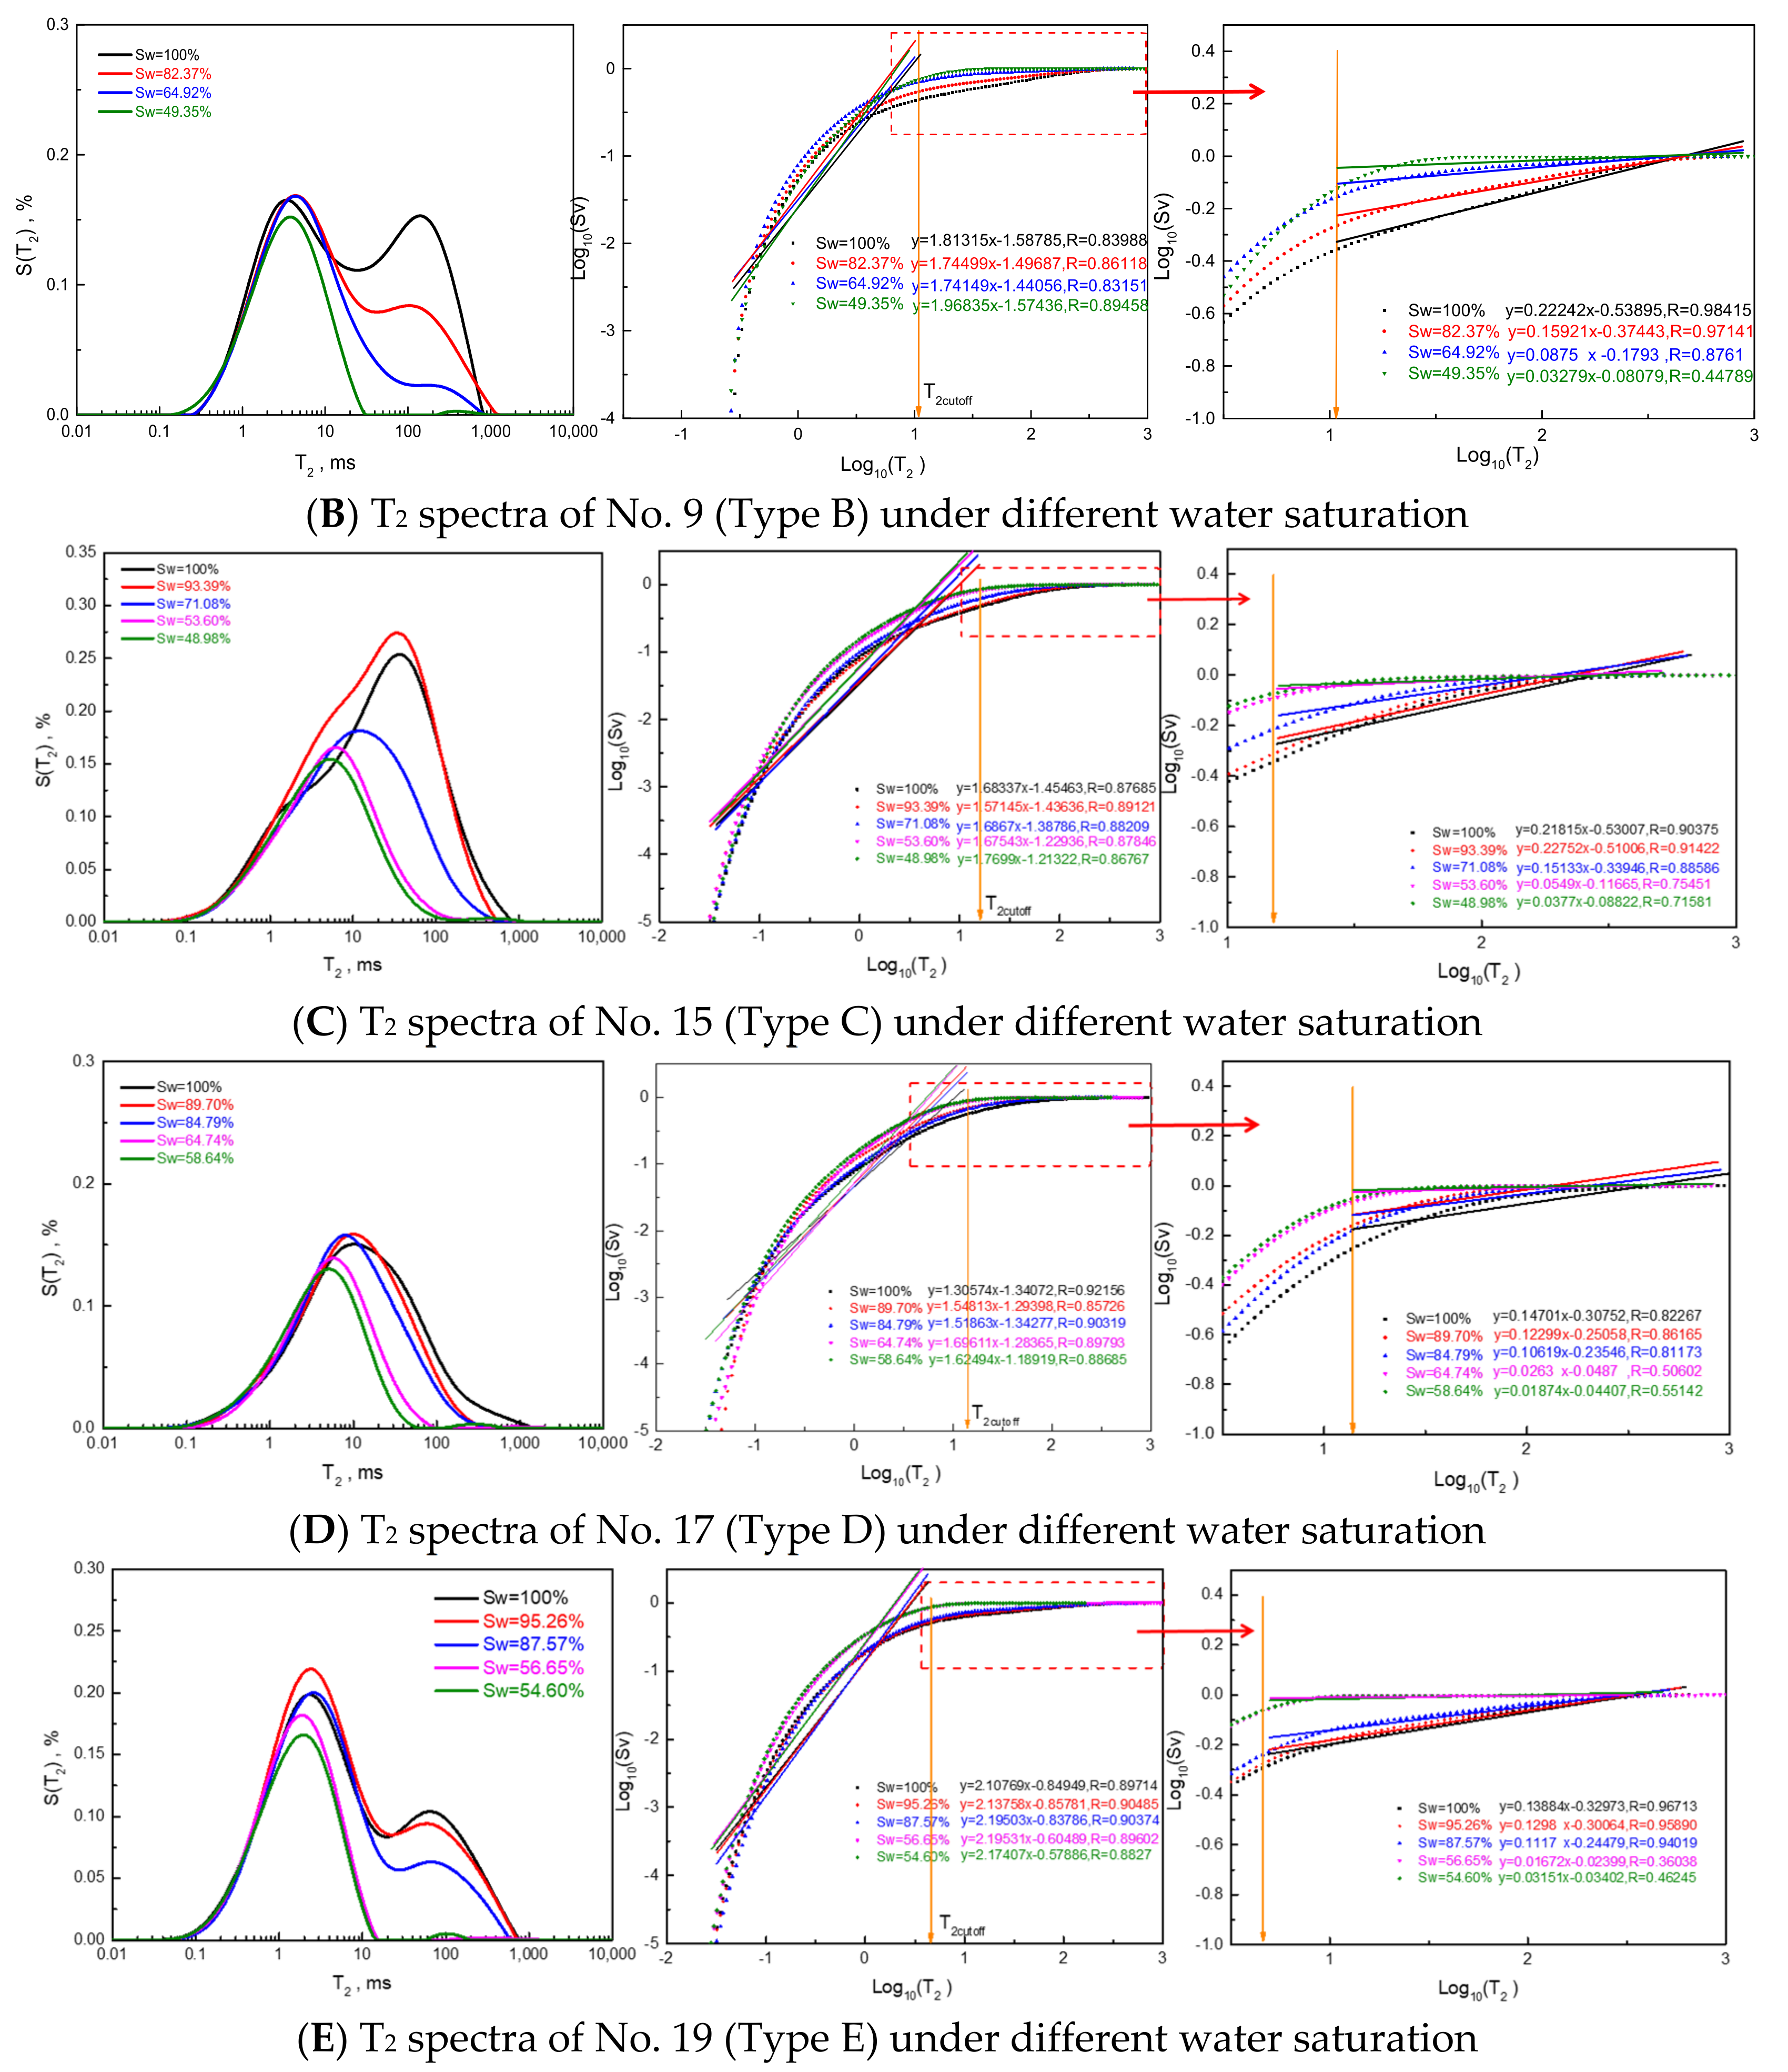
In water-saturated rock, when macro-pores fill with gas, residual water-saturated pores are still satisfied with the fractal theory. As the NMR signal of the gas-filling pores is too small to be measured, the fractal dimension from NMR changes. As S w decreases, D v a increases, but D v b has little variation, and Δ D v a (the increment of D v a ) is directly related to the water saturation of gas-bearing tight sandstone. When S w decreases to S w i r , D v a approximately equals 3. As the pore structure transferred from Type A to Type E, the maximum value of Δ D v a (the difference between D v a under S w i r state and that under 100% S w state) becomes smaller;
(4)
Experimental data and application result show that firstly, pore structure evaluation and classification can be achieved based on fractal analysis from NMR spectra; the method can be further applied in reservoir quality evaluation and favorable reservoir prediction. Secondly, the accuracy of calculated water saturation by the new method is higher than that calculated by the Archie model, and the fractal-based water saturation prediction method from NMR extends the application area of NMR logging and also provides a non-electrical idea for the qualitative identification and evaluation of gas-bearing tight sandstone reservoir, it has a reference for the gas-bearing recognition of tight sandstone and carbonate reservoirs.

Author Contributions

Conceptualization and methodology, W.X. and Q.Y.; software, W.X.; validation, J.Z.; investigation, P.Z.; data curation, C.F.; writing—original draft preparation, W.X. and Q.Y.; writing—review and editing, G.W. All authors have read and agreed to the published version of the manuscript.

Funding

This article was supported by the National Natural Science Foundation of China (No. 41872133), the Research Foundation of China University of Petroleum-Beijing at Karamay (No. XQZX20230012) and the “Tianchi Talent” Introduction Plan Foundation of Xinjiang, China.

Data Availability Statement

Most of the data has been disclosed in the manuscript data table; other data cannot be disclosed due to confidentiality and can be obtained from the author ([email protected]).

Conflicts of Interest

The authors declared that they have no conflict of interest in this work. We declare that we do not have any commercial or associative interest that represents a conflict of interest in connection with the work submitted.

References

  1. Yan, S.O.N.G.; Zhuo, L.I.; Jiang, Z.; Qun, L.; Dongdong, L.; Zhiye, G. Progress and development trend of unconventional oil and gas geological research. Pet. Explor. Dev. 2017, 44, 675–685. [Google Scholar]
  2. Ren, J.; Zhang, L.; Ezekiel, J.; Ren, S.; Meng, S. Reservoir characteristics and productivity analysis of tight sand gas in Upper Paleozoic Ordos Basin China. J. Nat. Gas Sci. Eng. 2014, 19, 244–250. [Google Scholar] [CrossRef]
  3. Muther, T.; Nizamani, A.A.; Ismail, A.R. Analysis on the effect of different fracture geometries on the productivity of tight gas reservoirs Malays. J. Fundam. Appl. Sci. 2020, 16, 201–211. [Google Scholar] [CrossRef]
  4. Lai, J.; Wang, G.; Wang, Z.; Chen, J.; Pang, X.; Wang, S.; Zhou, Z.; He, Z.; Qin, Z.; Fan, X. A review on pore structure characterization in tight sandstones. Earth-Sci. Rev. 2018, 177, 436–457. [Google Scholar] [CrossRef]
  5. Xiao, D.; Lu, S.; Lu, Z.; Huang, W.; Gu, M. Combining nuclear magnetic resonance and rate-controlled porosimetry to probe the pore-throat structure of tight sandstones. Pet. Explor. Dev. 2016, 43, 1049–1059. [Google Scholar] [CrossRef]
  6. Wang, R.; Shi, W.; Xie, X.; Zhang, W.; Qin, S.; Liu, K.; Busbey, A.B. Clay mineral content, type, and their effects on pore throat structure and reservoir properties: Insight from the Permian tight sandstones in the Hangjinqi area, north Ordos Basin, China. Mar. Pet. Geol. 2020, 115, 104281. [Google Scholar] [CrossRef]
  7. Mandelbrot, B.B. The Fractal Geometry of Nature; Freeman: San Francisco, CA, USA, 1982. [Google Scholar]
  8. Wang, F.; Yang, K.; Cai, J. Fractal characterization of tight oil reservoir pore structure using nuclear magnetic resonance and mercury intrusion porosimetry. Fractals 2018, 26, 1840017. [Google Scholar] [CrossRef] [Green Version]
  9. Miao, T.; Yu, B.; Duan, Y.; Fang, Q. A fractal analysis of permeability for fractured rocks. Int. J. Heat Mass Transf. 2015, 81, 75–80. [Google Scholar] [CrossRef]
  10. Jafari, A.; Babadagli, T. Estimation of equivalent fracture network permeability using fractal statistical network properties. J. Pet. Sci. Eng. 2012, 92, 110–123. [Google Scholar] [CrossRef]
  11. Li, K. Analytical derivation of Brooks–Corey type capillary pressure models using fractal geometry and evaluation of rock heterogeneity. J. Pet. Sci. Eng. 2010, 73, 20–26. [Google Scholar] [CrossRef]
  12. Li, X.; Chen, S.; Wang, X.; Zhu, Y.; Chang, M.; Uwamahoro, C. Pore structure heterogeneity of the Xiamaling Formation shale gas reservoir in the Yanshan area of China: Evaluation of geological controlling factors. Acta Geol. Sin.-Engl. Ed. 2019, 93, 588–603. [Google Scholar] [CrossRef]
  13. Wang, Q.; Hu, Y.; Zhao, J.; Ren, L.; Zhao, C.; Zhao, J. Multiscale apparent permeability model of shale nanopores based on fractal theory. Energies 2019, 12, 3381. [Google Scholar] [CrossRef] [Green Version]
  14. Li, B.; Liu, R.; Jiang, Y. A multiple fractal model for estimating permeability of dual-porosity media. J. Hydrol. 2016, 540, 659–669. [Google Scholar] [CrossRef]
  15. Song, Z.; Liu, G.; Yang, W.; Zou, H.; Sun, M.; Wang, X. Multi-fractal distribution analysis for pore structure characterization of tight sandstone—A case study of the Upper Paleozoic tight formations in the Longdong District, Ordos Basin. Mar. Pet. Geol. 2018, 92, 842–854. [Google Scholar] [CrossRef]
  16. Guo, X.; Huang, Z.; Zhao, L.; Han, W.; Ding, C.; Sun, X.; Yan, R.; Zhang, T.; Yang, X.; Wang, R. Pore structure and multi-fractal analysis of tight sandstone using MIP, NMR and NMRC methods: A case study from the Kuqa depression, China. J. Pet. Sci. Eng. 2019, 178, 544–558. [Google Scholar] [CrossRef]
  17. Rembert, F.; Jougnot, D.; Guarracino, L. A fractal model for the electrical conductivity of water-saturated porous media during mineral precipitation-dissolution processes. Adv. Water Resour. 2020, 145, 103742. [Google Scholar] [CrossRef]
  18. Feng, C.; Han, C.; Duan, W.; Wang, W.; Zhong, Y.; Feng, Z.; Zhang, N. Estimation of the Resistivity Index via Nuclear Magnetic Resonance Log Data Based on Fractal Theory. Geofluids 2020, 2020, 8871096. [Google Scholar] [CrossRef]
  19. Shi, Y.; Meng, H.; Liu, T.; Zhang, H.; Wang, C. Evaluation of Relative Permeability From Resistivity Data for Fractal Porous Media. Petrophys.-SPWLA J. Form. Eval. Reserv. Descr. 2020, 61, 303–317. [Google Scholar] [CrossRef]
  20. Karimpouli, S.; Tahmasebi, P. 3D multi-fractal analysis of porous media using 3D digital images: Considerations for heterogeneity evaluation. Geophys. Prospect. 2019, 67, 1082–1093. [Google Scholar] [CrossRef]
  21. Zhao, P.; Luo, M.; Li, D.; Wu, Y.; Mao, Z.; Ostadhassan, M. Fractal Characterization and Petrophysical Analysis of 3D Dynamic Digital Rocks of Sandstone. Petrophys.-SPWLA J. Form. Eval. Reserv. Descr. 2021, 62, 500–515. [Google Scholar] [CrossRef]
  22. Zhou, S.; Liu, D.; Cai, Y.; Yao, Y. Fractal characterization of pore–fracture in low-rank coals using a low-field NMR relaxation method. Fuel 2016, 181, 218–226. [Google Scholar] [CrossRef]
  23. Liu, X.; Jin, Z.; Lai, J.; Fan, X.; Guan, M.; Shu, H.; Wang, G.; Liu, M.; Luo, Y. Fractal behaviors of NMR saturated and centrifugal T2 spectra in oil shale reservoirs: The Paleogene Funing formation in Subei basin, China. Mar. Pet. Geol. 2021, 129, 105069. [Google Scholar] [CrossRef]
  24. Zhao, X.; Yang, Z.; Lin, W.; Xiong, S.; Luo, Y.; Liu, X.; Xia, D. Fractal study on pore structure of tight sandstone based on full-scale map. Int. J. Oil Gas Coal Technol. 2019, 22, 123–139. [Google Scholar] [CrossRef]
  25. Wang, J.; Jiang, F.; Zhang, C.; Song, Z.; Mo, W. Study on the Pore Structure and Fractal Dimension of Tight Sandstone in Coal Measures. Energy Fuels 2021, 35, 3887–3898. [Google Scholar] [CrossRef]
  26. Xie, W.; Yin, Q.; Wang, G.; Yu, Z. Variable dimension fractal-based conversion method between the nuclear magnetic resonance T2 spectrum and capillary pressure curve. Energy Fuels 2020, 35, 351–357. [Google Scholar] [CrossRef]
  27. Wei, W.; Cai, J.; Hu, X.; Han, Q. An electrical conductivity model for fractal porous media. Geophys. Res. Lett. 2015, 42, 4833–4840. [Google Scholar] [CrossRef]
  28. Wang, F.; Cai, J. Characterization of petrophysical properties in tight sandstone reservoirs. In Petrophysical Characterization and Fluids Transport in Unconventional Reservoirs; Elsevier: Amsterdam, The Netherlands, 2019; pp. 37–59. [Google Scholar]
  29. Kashif, M.; Cao, Y.; Yuan, G.; Asif, M.; Javed, K.; Mendez, J.N.; Khan, D.; Miruo, L. Pore size distribution, their geometry and connectivity in deeply buried Paleogene Es1 sandstone reservoir, Nanpu Sag, East China. Pet. Sci. 2019, 16, 981–1000. [Google Scholar] [CrossRef] [Green Version]
  30. Zheng, H.J.; Dong, Y.X.; Zhu, G.Y.; Wang, X.D.; Xiong, Y. High-quality source rocks in Nanpu Sag. Pet. Explor. Dev. 2007, 34, 385. [Google Scholar]
  31. Guo, Y.; Pang, X.; Dong, Y.; Jiang, Z.; Chen, D.; Jiang, F. Hydrocarbon generation and migration in the Nanpu Sag, Bohai Bay Basin, eastern China: Insight from basin and petroleum system modeling. J. Asian Earth Sci. 2013, 77, 140–150. [Google Scholar] [CrossRef]
  32. Wang, E.; Liu, G.; Pang, X.; Wu, Z.; Li, C.; Bai, H.; Zhang, Z. Sedimentology, diagenetic evolution, and sweet spot prediction of tight sandstone reservoirs: A case study of the third member of the Upper Paleogene Shahejie Formation, Nanpu Sag, Bohai Bay Basin, China. J. Pet. Sci. Eng. 2020, 186, 106718. [Google Scholar] [CrossRef]
  33. Xie, W.; Yin, Q.; Wang, G.; Guan, W.; Yu, Z. Modeling of gas saturation based on acoustic wave and pore structure classification and application in the low-porosity and low-permeability reservoir. Arab. J. Geosci. 2021, 14, 917. [Google Scholar] [CrossRef]
  34. Wu, B.; Xie, R.; Wang, X.; Wang, T.; Yue, W. Characterization of pore structure of tight sandstone reservoirs based on fractal analysis of NMR echo data. J. Nat. Gas Sci. Eng. 2020, 81, 103483. [Google Scholar] [CrossRef]
  35. Sun, W.; Liu, C.; Wang, Y.; Bai, L.; Li, W.; Li, S. A practical method to construct capillary pressure curves of reservoir using nmr logging date. Int. J. Oil Gas Coal Technol. 2019, 22, 433–446. [Google Scholar] [CrossRef]
  36. Winkler, M.; Freeman, J.J.; Appel, M. The limits of fluid property correlations used in NMR well logging: An experimental study of reservoir fluids at reservoir conditions. Petrophys.-SPWLA J. Form. Eval. Reserv. Descr. 2005, 46. [Google Scholar]
  37. Nie, R.S.; Zhou, J.; Chen, Z.; Liu, J.; Pan, Y. Pore structure characterization of tight sandstones via a novel integrated method: A case study of the Sulige gas field, Ordos Basin (Northern China). J. Asian Earth Sci. 2021, 213, 104739. [Google Scholar] [CrossRef]
  38. Ge, X.; Fan, Y.; Zhu, X.; Chen, Y.; Li, R. Determination of nuclear magnetic resonance t2 cutoff value based on multifractal theory—An application in sandstone with complex pore structure. Geophysics 2015, 80, D11–D21. [Google Scholar] [CrossRef]
Figure 1. Influence of gas filling on pore structure from NMR. (A) Water-saturated rock; (D) Equivalent pore structure model of (A) from NMR; (B) The maximum pore in (A) is filling with gas; (E) Equivalent pore structure model of (B) from NMR; (C) Gas filling in the pores bigger than the (i − 1)-th largest pore; (F) Equivalent pore structure model of (C) from NMR.
Fractalfract 07 00273 g001
Figure 2. T2 curves of 19 rock samples and pore structure classification.
Fractalfract 07 00273 g002
Figure 3. D v a and D v b distribution of Type A–E.
Fractalfract 07 00273 g003
Figure 4. Pore structure classification based on D v a D v b cross plot.
Fractalfract 07 00273 g004
Figure 5. T2 spectra under different water saturation states of a representative rock sample of each pore structure type.
Fractalfract 07 00273 g005aFractalfract 07 00273 g005b
Figure 6. Relationship between Δ D v a and S w .
Fractalfract 07 00273 g006
Figure 7. Evaluation result of new methods in Well ×5.
Fractalfract 07 00273 g007
Figure 8. Corresponding relationship between T2 spectra and pore space.
Fractalfract 07 00273 g008
Figure 9. Comparison between the T2 curve derived fractal dimension and the calculated fractal dimension by Equations (15) and (16).
Fractalfract 07 00273 g009
Figure 10. D v —Swir relationship ( D v a , Swir) and ( D v b , Swir) are marked by red spot and black square, respectively.
Fractalfract 07 00273 g010
Figure 11. D v —T2lm relationship ( D v a , T2lm) and ( D v b , T2lm) are marked by red spot and black square, respectively.
Fractalfract 07 00273 g011
Table 1. Specific parameters of 19 rock samples.
No.T2 Curves MorphologyPorosity
v/v
Permeability
md
Swir
v/v
T2cut
ms
T2lm
ms
DvaDvbf1
v/v
f2
v/v
f3
v/v
f4
v/v
f5
v/v
1right unimodal pattern
(T2 value of peak: 200 ms)
12.5123.2116.0014.7074.672.521.300.610.190.100.050.05
211.308.7420.7822.5970.642.561.210.600.180.120.060.04
310.904.4925.4914.8552.222.581.450.550.200.120.070.06
413.9031.1316.7219.7177.622.481.280.640.210.110.030.01
511.207.0326.2113.6644.082.591.360.430.270.150.080.07
611.306.8126.3717.4343.632.581.460.490.240.140.070.06
712.0014.4919.5116.3773.552.561.400.610.190.120.050.04
   Range  
average value
10.9–13.9
11.76
4.49–31.13
13.7
16–26.37
21.58
13.66–22.59
17.04
43.63–77.62
62.35
2.48–2.59
2.55
1.21–1.46
1.35
0.43–0.64
0.56
0.18–0.27
0.21
0.1–0.15
0.12
0.03–0.08
0.06
0.01–0.07
0.05
8balanced bimodal pattern13.231.6146.1113.3917.962.801.150.330.150.230.150.14
912.201.9849.3510.9018.572.781.190.330.160.200.160.15
   Range  
average value
12.2–13.23
12.72
1.61–1.98
1.79
46.11–49.35
47.73
10.9–13.39
12.15
17.96–18.57
18.27
2.78–2.80
2.79
1.15–1.19
1.17
0.33–0.33
0.33
0.15–0.16
0.155
0.2–0.23
0.215
0.15–0.16
0.155
0.14–0.15
0.145
10right unimodal pattern
(T2 value of peak: 30 ms)
8.060.4950.5217.4815.402.701.300.150.310.260.120.17
1114.102.4944.1723.9827.892.731.540.360.250.210.090.09
1214.701.0048.3619.5718.852.751.350.310.240.230.100.12
1313.100.6945.9214.3116.972.761.180.280.250.240.110.13
1414.800.6655.0121.2716.662.781.450.280.250.230.090.15
1515.301.0948.9816.2215.402.781.320.250.270.230.100.15
   Range  
average value
8.6–15.3
13.34
0.49–2.49
1.07
44.17–55.01
48.83
14.31–23.98
18.81
15.4–27.89
18.52
2.70–2.78
2.75
1.18–1.54
1.36
0.15–0.36
0.27
0.24–0.31
0.26
0.21–0.26
0.23
0.09–0.12
0.1
0.09–0.17
0.13
16balanced unimodal pattern
(T2 value of peak: 10 ms)
5.700.3162.7518.1911.672.801.700.170.190.340.150.15
178.900.2258.6415.8111.202.851.690.170.220.310.150.15
   Range  
average value
5.7–8.9
7.3
0.22–0.31
0.27
58.64–62.75
60.7
15.81–18.19
17
11.2–11.67
11.43
2.80–2.85
2.83
1.69–1.70
1.69
0.17–0.17
0.17
0.19–0.22
0.21
0.31–0.34
0.325
0.15–0.15
0.15
0.15–0.15
0.15
18left bimodal pattern8.750.1558.722.582.692.890.590.280.050.120.150.41
1912.500.2054.604.526.552.860.890.200.130.170.180.32
   Range  
average value
8.75–12.5
10.63
0.15–0.20
0.18
54.6–58.72
56.66
2.58–4.52
3.55
2.69–6.55
4.62
2.86–2.89
2.88
0.59–0.89
0.74
0.2–0.28
0.24
0.05–0.13
0.09
0.12–0.17
0.14
0.15–0.18
0.16
0.41–0.32
0.36
Table 2. Fractal dimensions of 16 rock samples under different water saturation states.
NoSwT2lmDvaDvbΔDvaNoSwT2lmDvaDvbΔDva
1100.0074.672.521.300.0010100.0015.402.701.300.00
48.7525.882.731.380.2193.4913.862.701.390.00
29.6710.082.811.300.2977.489.182.751.240.05
18.564.902.941.380.4254.704.902.901.280.20
16.003.602.971.230.4450.524.252.931.210.23
2100.0070.642.561.210.0011100.0027.892.731.540.00
58.0831.572.731.380.1789.0422.112.751.490.02
34.319.822.871.360.3159.559.392.861.420.13
22.106.082.941.280.3844.174.942.921.380.19
20.784.742.961.150.4012100.0018.852.751.350.00
3100.0052.222.581.450.0093.4617.332.771.460.02
69.0038.752.681.590.1071.528.602.831.270.09
40.6610.132.791.280.2155.145.862.961.500.21
26.555.582.951.180.3748.364.122.961.620.22
25.494.482.951.140.3713100.0016.972.761.180.00
4100.0077.622.481.280.0094.6615.282.781.520.02
46.6128.152.741.220.2773.959.952.851.110.09
28.1112.882.831.170.3551.644.722.961.440.20
18.327.522.961.050.4845.923.412.971.100.21
16.726.342.981.340.5014100.0016.662.811.450.00
5100.0044.082.591.360.0094.6716.122.811.620.00
68.4126.512.701.220.1179.1110.572.891.560.08
40.909.602.831.290.2461.145.352.971.430.16
29.716.542.941.330.3555.014.322.981.490.18
26.215.322.951.400.3615100.0015.402.781.320.00
6100.0043.632.581.460.0093.3913.862.781.430.00
69.9122.942.721.310.1471.089.182.851.310.07
41.159.462.881.410.3053.604.902.951.320.16
30.445.622.951.400.3648.984.252.961.230.18
26.374.852.961.520.3817100.0011.202.851.690.00
7100.0073.552.561.400.0089.708.792.881.450.02
60.0134.412.691.310.1384.807.822.891.480.04
22.446.672.901.100.3464.744.882.971.300.12
19.515.322.951.340.4058.643.792.981.390.13
9100.0018.572.781.190.0019100.006.552.860.890.00
82.3712.662.841.260.0695.265.952.870.860.01
64.926.622.911.260.1387.574.742.890.800.03
51.243.732.971.130.1956.651.602.980.800.12
49.353.362.971.030.1954.601.552.970.830.11
Table 3. Reservoir parameters of Layers 1–9.
LayerRT
(ohm.m)
POR
(%)
PERM
(md)
Sw_Archie
(v/v)
Swir_nmr
(v/v)
SW_T2
(v/v)
Dva0DvbDvaTypeProduction
13810.10.340.650.640.892.6491.2542.663II--
2164.30.0310.760.912.8042.0692.846III/IV--
33111.20.870.690.550.582.5940.8752.733I/III--
43013.21.60.60.370.482.4290.9542.638I/II
54110.70.450.650.410.512.5581.1042.699I/II/IVGas 1.1 × 10⁴ m3, no water
63110.20.220.640.50.532.6462.2882.702I/II
7367.70.080.710.910.972.8631.7632.966IV/V--
8316.50.0110.80.832.751.0852.797IV/V--
9107.30.0510.90.822.860.292.89V--
Disclaimer/Publisher’s Note: The statements, opinions and data contained in all publications are solely those of the individual author(s) and contributor(s) and not of MDPI and/or the editor(s). MDPI and/or the editor(s) disclaim responsibility for any injury to people or property resulting from any ideas, methods, instructions or products referred to in the content.

