Abstract
This paper focuses on the equilibrium problem of an urban public transportation system with time delay. Time delay, multi-weights, and stochastic disturbances are considered in the urban public transportation system. Hence, one can regard the urban public transportation system as a stochastic multi-weighted delayed complex network. By combining graph theory and the Lyapunov method, the global Lyapunov function is constructed indirectly. Moreover, the response system can realize synchronization with the drive system under the adaptive controller. In other words, the urban public transportation system is balanced in the actual running traffic network. Finally, numerical examples about the Chua system and small-world network are presented to confirm the accuracy and validity of the theoretical results.
1. Introduction
Recently, the study of complex networks has aroused widespread attention [1,2,3]. Especially in the field of traffic, fruitful results have been obtained [4,5,6,7], but most of the research focuses on the traffic networks with a single weight. In most traffic networks, there are often multiple weights between different network nodes. If the place of travel is regarded as a network node, the alternative transportation modes between two places include the subway, bus, a bicycle and so on, and the travel time required for each mode is different. By viewing a mode of transportation as a kind of weight, a traffic network constitutes a multi-weighted complex network, which is more meaningful than a single-weighted complex network [8,9,10].
As one of the important dynamic features of complex networks, synchronization is also widely used in the transportation field [11,12,13,14]. The synchronization of the traffic network actually refers to the equilibrium of the urban public transportation system, which is the dynamical balance between running buses and passengers. When the urban public transportation system reaches equilibrium, the buses run with the shortest delay while passengers have the shortest waiting time at the bus stops. So far, there are few studies on the equilibrium of a multi-weighted urban public transportation system (MUPTS). Thus, it is of practical materiality to study the equilibrium problem of MUPTS in this paper.
In the traffic network, stochastic disturbances such as weather, road conditions, and traffic control are always present. These can have an impact on the transportation system, so that the operation of a bus stop often does not reach the ideal situation. Hence, the bus running time becomes longer and the passenger waiting time becomes correspondingly longer, which leads to traffic congestion and an unbalanced traffic network. At the same time, an emergency requires a driver to make a corresponding response in the driving process, but the driver needs a reaction time, which leads to the existence of time delay. Therefore, taking the effect of time delay and stochastic disturbances on the MUPTS into account is of great practical significance.
Until now, most papers study the synchronization problem by utilizing the Lyapunov method, in which the global Lyapunov function is always directly constructed. Nonetheless, it is very difficult to directly construct the global Lyapunov function of the MUPTS including multiple weights, stochastic disturbances, and time delay. According to the graph-theoretic method [15], the global Lyapunov function is indirectly constructed by the weighted summation of the Lyapunov function of the vertex system. Scholars have obtained many results with the help of this method [16,17,18,19]. However, there are few works on urban public transportation systems based on this method [20]. So this paper attempts to investigate the equilibrium problem of MUPTS by using the graph-theoretic method.
The main novelties of this study are outlined as follows:
- The model of MUPTS takes multiple weights, stochastic disturbances, and time delay into consideration, which makes the model more general and can depict the actual traffic network better.
- The graph-theoretic method is first applied to study the equilibrium problem of MUPTS.
- Based on the appropriate adaptive controller and updating laws, MUPTS can restore a balanced operation.
Other parts of the paper are arranged as follows. The preliminaries regarding notations and model formulation are given in Section 2. Section 3 introduces the main results about the equilibrium problem of MUPTS. Section 4 details the numerical examples that show the effectiveness of the theoretical results. Ultimately, the conclusion is given in Section 5.
2. Preliminaries
2.1. Notations
Unless otherwise stated in this article, let be a complete probability space with a filtration satisfying the usual conditions (i.e., it is right continuous and contains all -null sets). displays a digraph including a set of nodes and a set of arcs leading from initial node r to terminal node s. Denote the weight matrix as , where is the weight of arc . is positive if there is an arc from node s to node r in , and 0 otherwise. and are the product of the weights on the arcs of and the directed cycle of , respectively. Denote the digraph with weighted matrix U as . The Laplacian matrix V of is represented as , , . is the family of all -measurable bounded -valued random variables. Denote as the set of continuous functions with norm . stands for the space formed by the nonnegative functions on which are continuously twice differentiable in and once in t.
2.2. Model Formulation
In this paper, the P-space method is adopted, with bus stops as network nodes and bus routes as edges. If there is a direct route between two stops, a directed edge is connected between the two stops. Based on the concept of drive–response systems, considering that there are q weights on the connected edges between the
station and j-th station. The weights include passenger flow, departure frequency, congestion level, route length coefficient, and so on. The operating state of a bus stop under ideal conditions is regarded as the drive system, whose expression is
in which expresses the state vector of the bus stops, . represents the dynamics of the bus stops, denotes the m-th weight of the direct route between the bus stop and the j-th bus stop. is the inner coupling matrix of bus stops with respect to the m-th weight, represents the time delay of bus operation, ,
Consider the influences of weather, road conditions, traffic control, and other stochastic disturbances on the dynamics of the drive system. By adding an adaptive controller, the actual operating state of the bus stop is constructed as the corresponding response system
where represents the response vector of the bus stop, . is an appropriate controller for the bus stop designed. denotes the intensity function of the m-th environmental influence factor for the bus stop, and is one-dimensional Brownian motion.
Assume that the coefficients of the drive system (1) and the response system (2) satisfy the local Lipschitz condition and the linear growth condition. According to the existence and uniqueness theorem [21], for any given initial value , the drive system (1) and the response system (2) have a unique solution, which can be expressed as and , respectively. Define , The error system is characterized by the following:
Therein, . Therefore, the synchronization of the drive–response system (1) and (2) is equivalent to the stability of the zero solution of the error system (3).
Define a differential operator acting on associated with Equation (3) by
where , .
Lemma 1
([22]). Assume that there exist functions , ( is the family of all functions such that ) and continuous functions , such that
Then, for every initial value
3. Main Results
This section mainly designs appropriate adaptive controller and updating laws, so that the drive–response systems can realize synchronization. To interpret it in another way, the actual running state of the bus stop is synchronized with the ideal running state to achieve the equilibrium of the urban public transportation system.
First of all, introduce the following definition and hypotheses.
Definition 1
Hypothesis 1
([22]). Assume that is continuous and there exist nonnegative constants and for each , such that
Hypothesis 2
([22]). There exist nonnegative constants and , such that
for each
Consider the following adaptive controller and updating laws
in which is an arbitrary constant.
Denote as , .
Theorem 1.
Proof.
First, define the vertex Lyapunov function
in which is a large enough positive constant.
Based on Hypotheses 1 and 2 and inequality , one can obtain
in which , , .
Define the global Lyapunov function
where is the cofactor of the diagonal element of the Laplacian matrix of .
It can be calculated as
where , ,
According to Kirchhoff’s matrix-tree theorem in reference [15],
Then, it obtains
One can choose large enough to satisfy that
So for any , it holds that
In addition, one can obtain
Applying Lemma 1, it yields
Remark 1.
The existence of time delay and stochastic disturbances has caused great resistance in the operation of the urban public transportation system, which often leads to traffic congestion. The traffic scheduling can be adjusted according to the real-time situation of the bus station to ensure the balanced operation of the urban public transportation system. When the passenger flow of the bus station is too large or too small, the bus routes passing the bus station, the frequency of bus departure, and the bus station of some bus routes can be adjusted to achieve a balance of the bus station. Thus, the urban public transport system can achieve balance. In this case, the bus runs with the shortest delay and the passengers complete the trip with the shortest waiting time. This can effectively alleviate traffic congestion and save the travel time of residents, and further ensure the orderly operation of urban traffic.
Remark 2.
In the literature, references [9,10,11,12, 13] investigate the synchronization of complex networks and apply it to a traffic network. It is worth noting that there are some differences between this paper and the literature. On the one hand, the network models in references [11,12,13] are with single weight. In references [9,10], the network model does not consider the impacts of time delay and stochastic disturbances. In this paper, the network model contains not only multiple weights, but also time delay and stochastic disturbances, which is more general than references [9,10,11,12,13]. On the other hand, the synchronization criteria in references [9,10,11,12,13] have been obtained using the Lyapunov method. Different from these articles, the synchronization criterion in this paper is derived by means of the graph-theoretic method.
Remark 3.
The most obvious feature of the Lyapunov method is that it needs to construct a global Lyapunov function. In this paper, the global Lyapunov function is constructed indirectly using the graph-theoretic method. The novelty of this method is to indirectly construct the global Lyapunov function by combining the Lyapunov functions of vertex systems and Kirchhoff’s matrix-tree theorem. That is , where is the cofactor of the -th diagonal element of the Laplacian matrix of . Hence, it avoids the difficulty of directly constructing the global Lyapunov function. This method is a systematic way of constructing the global Lyapunov function, which has a wider range of applications.
Remark 4.
The adaptive controller (5) is continuous and can be changed to a periodically intermittent controller to reduce control costs. Moreover, the strong connectedness of is needed in Theorem 1. This condition ensures that weights in equality are positive. In fact, this condition is not necessary. If is not strongly connected, one can collapse each strongly connected component into a vertex, then the corresponding condensed digraph can be constructed. The synchronization for the networks with periodically intermittent control and without strong connectedness can be investigated.
Particularly when the effect of stochastic disturbances in the actual traffic networks is not considered, the response system is as follows:
Using a similar argument, one can prove the following corollary.
Corollary 1.
Remark 5.
It is worth mentioning that Corollary 1 is about the synchronization of a multi-weighted urban public transportation system with time delay. References [9,10] study the synchronization of a multi-weighted urban public transportation system. In the absence of time delay, references [9,10] can be seen as a special case of the result of Corollary 1. Compared with references [9,10], the results in this paper are more general.
In model (1), the vertex function is nonlinear, so it can also be applied to some higher-order networks. In the high-order case, Hypothesis 1 is not satisfied. In order to enhance the control performance of the higher order terms, we can design another different adaptive controller, which is provided in the following corollary.
Corollary 2.
This proof is similar to the proof of Theorem 1, thus the detailed proof is omitted for brevity. With this novel designed closed-loop controller, it is possible to obtain the synchronization results for higher-order complex networks.
4. Numerical Examples
In this section, several numerical examples are presented to demonstrate the validity of the theoretical results. Consider a stochastic multi-weighted urban public transportation system with the form of system (1), which consists of 20 vertices and three weights between vertices (i.e., passenger flow, departure frequency, and congestion degree). Therein, bus stops and bus routes are selected as vertices and edges of the system, respectively. Section 4.1 displays the equilibrium problem for a stochastic multi-weighted urban public transportation system with time delay. The effects of time delay, multiple weights, stochastic disturbances, and adaptive controller on the synchronization of the considered system are presented in Section 4.2, Section 4.3, Section 4.4 and Section 4.5.
4.1. Equilibrium Problem for the Stochastic MUPTS
When the model of MUPTS consists of multiple weights, stochastic disturbances, and time delay, the drive system is expressed as
the response system is
Taking the following controller and updating laws
and are three-dimensional state vectors, respectively, representing the ideal running state and the actual running state of the bus stop. , , , . , . , where , , , , , , , , , , . is the weighted matrix. Since the Chua system is a typical chaotic system with time delay, this section takes the Chua system as a vertex system. The Chua system has a bounded attractor, thus Hypothesis 1 is satisfied.
Since only qualitative analysis is done in this paper, may be set as the hourly passenger flow between the bus stop and the j-th bus stop. When the passenger flow exceeds 200 people per hour, the directed edge is connected between the two bus stops, and the value of is 1, otherwise it is 0. represents whether there is congestion between the bus stop and the j-th bus stop. In the case of congestion, the directed edge is connected between the two bus stops, and the value of is 1, otherwise it is 0. denotes the departure frequency between the bus stop and the j-th bus stop. When the departure frequency is less than every 10 minutes, the directed edge is connected between the two bus stops, and the value of is 1, otherwise it is 0.
By means of analyzing the urban public transportation system, one can know that the urban public transportation system conforms to the characteristics of an NW small-world network [24]. The parameters for are given by and , and for , and for . That is to say, every node is connected to H neighboring nodes and adds every edge with probability j. , , , so Hypothesis 2 is satisfied. The values of the internal coupling matrices , , of the bus stop are
To sum up, all the assumptions in Theorem 1 are satisfied. Thus, the drive-response systems (9) and (10) realize synchronization via the controller (11) and updating laws (12).
In Figure 1, the subgraph displays the topological structures of the MUPTS with 20 bus stops and three weights are selected. Subgraph , and represent the topological structures of three subsystems, i.e., , , and . Here, , , and describe passenger flow, congestion degree, and the departure frequency, respectively.
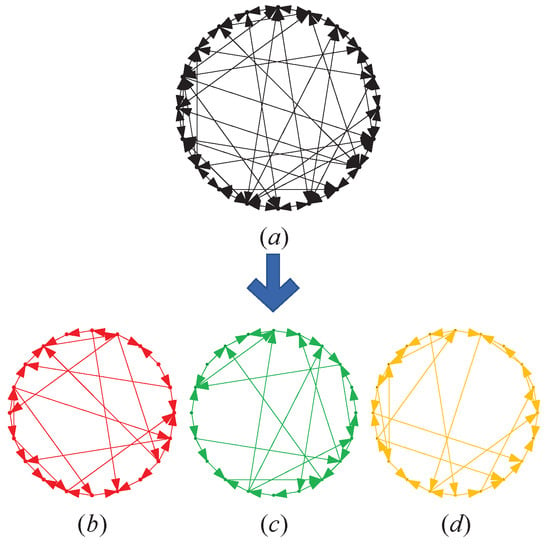
Figure 1.
Topological structures of the urban public transportation system (a) and its subsystems (b), (c), (d).
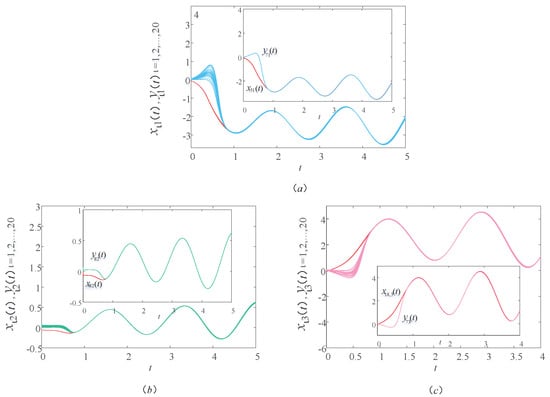
Figure 2 shows a sample path of the drive–response systems (9) and (10) with time delay . In order to see the trend of the image more clearly, a group of corresponding components are selected from each graph. In Figure 2a, the red and blue lines are the first components of the drive and response systems, respectively. In Figure 2b, the red and green lines are the second components of the drive and response systems, respectively. In Figure 2c, the red and pink lines are the third components of the drive and response systems, respectively. Unless otherwise stated in this article, the lines in the other figures represent the same meaning. In Figure 2, we observe that the image of the response system is consistent with the image of the drive system within a certain period of time. It indicates that the drive–response systems realize synchronization within a certain time under the action of the controller and updating laws. That is to say, in the actual bus system, through the bus scheduling, the actual operation of the bus stop can reach the ideal running state to achieve balance in a certain period of time. In this case, the time delay of bus operation and the waiting time of passengers can be minimized, thus ensuring the normal travel of residents and the balanced operation of the urban public transportation system.
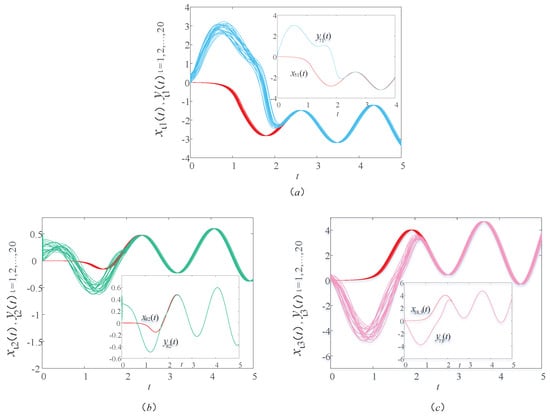
Figure 3 provides the synchronization errors of the drive–response systems (9) and (10). It can be clearly seen from Figure 3 that the sample path of the synchronization errors , , and finally approach 0, which further proves that the actual operation of the bus stop finally reaches the ideal operation state.
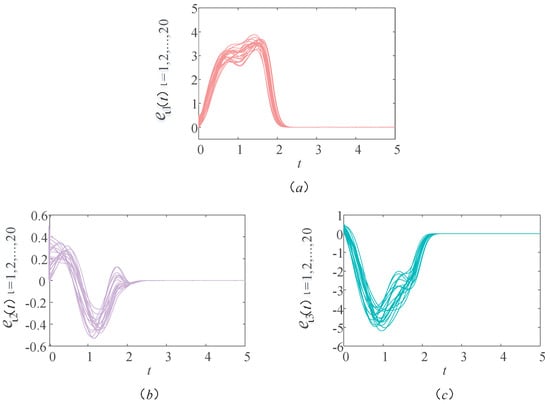
Figure 3.
Sample path ofthe first component in subfigure (a), second component in subfigure (b) and third component in subfigure (c) for the error system .
4.2. The Effect of Time Delay for the MUPTS
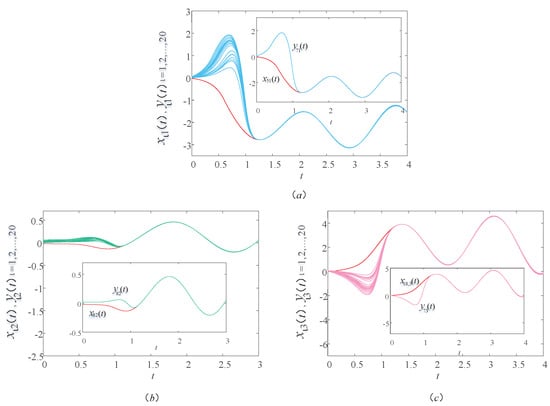
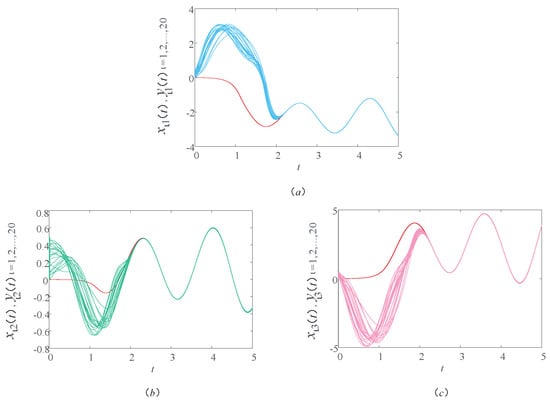
In this subsection, the model of MUPTS considers two different time delays ( and ) to explore the effect of time delay on synchronization. Figure 4 and Figure 5 display the sample path of the drive–response systems (9) and (10) with time delay and , respectively. Comparing Figure 2 with Figure 4 and Figure 5, the synchronization time in Figure 2 is greater than , the synchronization time in Figure 4 is between and , and the synchronization time in Figure 5 is less than . That is to say, the time delay can affect the synchronization performance.
4.3. The Effect of Multiple Weights for the MUPTS
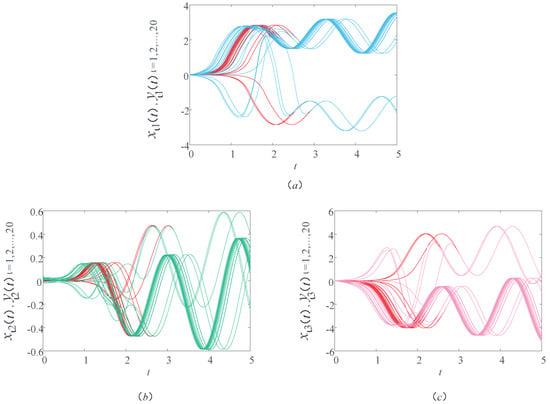
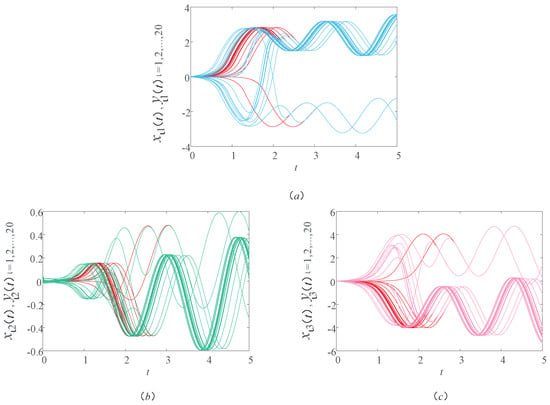
In this subsection, in order to show the effect of multiple weights on synchronization, the synchronization of three models with single weights are considered. Therein, the single weight is, respectively, , and . Figure 6, Figure 7 and Figure 8 show the sample path of the drive–response systems (9) and (10) with three different single weights. As shown in Figure 6, Figure 7 and Figure 8, the drive–response systems (9) and (10) with the first weight can realize synchronization, while the drive–response systems (9) and (10) with the second and third weights cannot. However, when the model considers the three weights at the same time, the drive-response systems (9) and (10) can realize synchronization, which can be clearly seen from Figure 2. It indicates that the consideration of multiple weights can lead to the synchronization of the asynchronous model, so it makes sense to consider multiple weights in the model.
4.4. The Effect of Stochastic Disturbances for the MUPTS
In this subsection, the model of MUPTS does not consider the effect of stochastic disturbances so as to verify the Corollary 1. We still view network (9) as the drive system, and the response system is described as follows:
Without a loss of generality, the initial values, functions, and parameters are the same as Section 4.1. Hence, it can be concluded from Corollary 1 that drive–response systems (9) and (13) realize synchronization. Figure 9 shows the sample path of the drive–response systems (9) and (13). By simple observing Figure 9, it can be obtained that the drive–response systems (9) and (13) realize synchronization, which proves the correctness of Corollary 1. Therefore, the MUPTS restores a balanced operation.
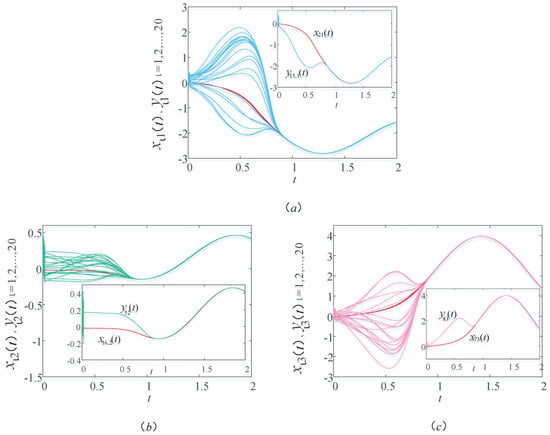
Compare Figure 2 and Figure 9, the synchronization time in Section 4.1 is longer than Section 4.4. In detail, the synchronization time in Figure 2 is greater than t = 2 and the synchronization time in Figure 9 is less than t = 1. It indicates that stochastic disturbances can impede the operation of MUPTS, which adversely affect it and extend the restoration of the balanced operation of the actual transportation system.
4.5. The Effect of Adaptive Controller for MUPTS
Note that we still view network (9) as the drive system in this part; the response system without a controller is denoted by
Likewise, the initial values, functions, and parameters are the same as Section 4.1. Figure 10 shows the sample path of the drive–response systems (9) and (14).
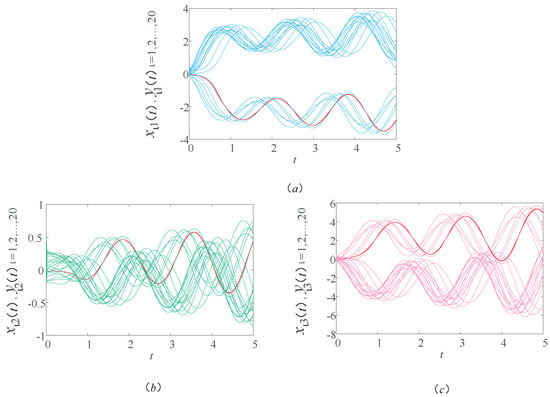
As shown in Figure 10, the image of the response system is not consistent with the image of the drive system. In other words, without a controller, the drive–response systems (9) and (14) cannot realize synchronization. This means that MUPTS needs bus scheduling to restore a balanced operation. From the numerical simulation, the effect of bus scheduling on MUPTS can be clearly seen.
5. Conclusions
This paper studies the equilibrium problem of a stochastic multi-weighted urban public transportation system with time delay. A mathematical model of the ideal and actual states of bus stop operation is constructed with bus stops as vertices and bus routes as edges. The model considers multiple weights, stochastic disturbances, and time delay at the same time, which is more consistent with the actual situation of an urban traffic network. In addition, the method adopted in this paper is the graph-theoretic method. So both the model and method in this paper are novel. Combined with the graph-theoretic method, the drive–response systems realize synchronization under appropriate controller and updating laws. In other words, the bus stop can still operate in the ideal situation when considering the effects of time delay and stochastic disturbances such as weather and road conditions. As a result, the time delay of the bus operation and the waiting time of passengers at bus stops are minimized, thereby bus stops run in a balanced manner. Thus, the transportation system of the whole city is balanced. Finally, numerical examples are used to verify the accuracy and validity of the theoretical results. Therein, the effects of time delay, multiple weights, stochastic disturbances, and an adaptive controller of the synchronization of the considered system are clearly presented. The controller used in this paper is continuous. In order to reduce the cost of control, we will utilize an intermittent controller to study the equilibrium problem of the urban public transportation system in the future.
Author Contributions
Conceptualization, H.Y. and C.Z.; Methodology, H.Y. and C.Z.; Validation, R.L. and H.C.; Formal analysis, H.C.; Investigation, R.L.; Writing—original draft, H.Y. and C.Z.; Writing—review & editing, C.Z., R.L. and H.C. All authors have read and agreed to the published version of the manuscript.
Funding
This work was supported by the Natural Science Foundation of Sichuan Province (No. 2022NSFSC1794) and the Fundamental Research Funds for the Central Universities (No. 2682023ZTPY018).
Data Availability Statement
The data presented in this study are available in the article.
Conflicts of Interest
The authors declare no conflict of interest.
References
- Wu, K.; Hao, X.; Liu, J.; Liu, P.; Shen, F. Online reconstruction of complex networks from streaming data. IEEE Trans. Cybern. 2022, 52, 5136–5147. [Google Scholar] [CrossRef] [PubMed]
- Vadivel, R.; Hammachukiattikul, P.; Vinoth, S.; Chaisena, K.; Gunasekaran, N. An extended dissipative analysis of fractional-order fuzzy networked control systems. Fractal Fract. 2022, 6, 591. [Google Scholar] [CrossRef]
- Wang, J.; Wang, L.; Wu, H. Synchronization for complex networks with multiple state or delayed state couplings under recoverable attacks. IEEE Trans. Syst. Man Cybern. Syst. 2023, 53, 38–48. [Google Scholar] [CrossRef]
- Zhang, L.; Wen, H.; Lu, J.; Lei, D.; Li, S. Comparing the time-varying topology-based dynamics between large-scale bus transit and urban rail transit networks from a mesoscopic perspective. Nonlinear Dyn. 2021, 106, 657–680. [Google Scholar] [CrossRef]
- Pu, H.; Li, Y.; Ma, C. Topology analysis of Lanzhou public transport network based on double-layer complex network theory. Phys. A 2022, 592, 126694. [Google Scholar] [CrossRef]
- Meng, Y.; Tian, X.; Li, Z.; Zhou, W.; Zhou, Z.; Zhong, M. Comparison analysis on complex topological network models of urban rail transit: A case study of Shenzhen metro in China. Phys. A 2020, 559, 125031. [Google Scholar] [CrossRef]
- Yan, L.; Hu, W.; Hu, S. SALA: A self-adaptive learning algorithm-towards efficient dynamic route guidance in urban traffic networks. Neural Process. Lett. 2019, 50, 77–101. [Google Scholar] [CrossRef]
- Shin, Y.; Yoon, Y. Incorporating dynamicity of transportation network with multi-weight traffic graph convolutional network for traffic forecasting. IEEE Trans. Intell. Transp. Syst. 2022, 23, 2082–2092. [Google Scholar] [CrossRef]
- An, X.; Zhang, L.; Li, Y.; Zhang, J. Synchronization analysis of complex networks with multi-weights and its application in public traffic network. Phys. A 2014, 412, 149–156. [Google Scholar] [CrossRef]
- Du, W.; Li, Y.; Zhang, J.; Yu, J. Synchronisation between two different networks with multi-weights and its application in public traffic network. Int. J. Syst. Sci. 2019, 50, 534–545. [Google Scholar] [CrossRef]
- Pang, M.; Yang, M. Coordinated control of urban expressway integrating adjacent signalized intersections based on pinning synchronization of complex networks. Transp. Res. Pt. C Emerg. Technol. 2020, 116, 102645. [Google Scholar] [CrossRef]
- Du, W.; Zhang, J.; An, X.; Qin, S.; Yu, J. Outer synchronization between two coupled complex networks and its application in public traffic supernetwork. Discrete Dyn. Nat. Soc. 2016, 2016 Pt 2, 8920764. [Google Scholar] [CrossRef]
- Wang, D.; Che, W.; Yu, H.; Li, J. Adaptive pinning synchronization of complex networks with negative weights and its application in traffic road network. Int. J. Control Autom. Syst. 2018, 16, 782–790. [Google Scholar] [CrossRef]
- Luo, C.; Huang, C.; Cao, J.; Lu, J.; Huang, W.; Guo, J. Short-term traffic flow prediction based on least square support vector machine with hybrid optimization algorithm. Neural Process. Lett. 2019, 50, 2305–2322. [Google Scholar] [CrossRef]
- Li, M.Y.; Shuai, Z. Global-stability problem for coupled systems of differential equations on networks. J. Differ. Equ. 2010, 248, 1–20. [Google Scholar] [CrossRef]
- Yao, X.; Xia, D.; Zhang, C. Topology identification of multi-weighted complex networks based on adaptive synchronization: A graph-theoretic approach. Math. Meth. Appl. Sci. 2021, 44, 1570–1584. [Google Scholar] [CrossRef]
- Chen, H.; Zhang, C.; Xu, Q.; Feng, Y. Graph-theoretic method on topology identification of stochastic multi-weighted complex networks with time-varying delayed coupling based on adaptive synchronization. Neural Process. Lett. 2022, 54, 181–205. [Google Scholar] [CrossRef]
- Rostami, M.; Forouzandeh, S.; Berahmand, K.; Soltani, M.; Shahsavari, M.; Oussalah, M. Gene selection for microarray data classification via multi-objective graph theoretic-based method. Artif. Intell. Med. 2022, 123, 102228. [Google Scholar] [CrossRef]
- Wu, Y.; Shen, B.; Ahn, C.; Li, W. Intermittent dynamic event-triggered control for synchronization of stochastic complex networks. IEEE Trans. Circuits Syst. I Regul. Pap. 2021, 68, 2639–2650. [Google Scholar] [CrossRef]
- Singh, D.; Nigam, S.P.; Agrawal, V.P.; Kumar, M. Modelling and analysis of urban traffic noise system using algebraic graph theoretic approach. Acoust. Aust. 2016, 44, 249–261. [Google Scholar] [CrossRef]
- Mao, X. Stochastic Differential Equations with Markovian Switching; Imperial College Press: London, UK, 2006. [Google Scholar]
- Mao, X. A note on the LaSalle-type theorems for stochastic differential delay equations. Automatica 2002, 268, 125–142. [Google Scholar] [CrossRef]
- Wang, J.; Wu, H. Synchronization criteria for impulsive complex dynamical networks with time-varying delay. Nonlinear Dyn. 2012, 70, 13–24. [Google Scholar] [CrossRef]
- Xu, Z.; Sui, D. Small-world characteristics on transportation networks: A perspective from network autocorrelation. J. Geogr. Syst. 2007, 9, 189–205. [Google Scholar] [CrossRef]
Disclaimer/Publisher’s Note: The statements, opinions and data contained in all publications are solely those of the individual author(s) and contributor(s) and not of MDPI and/or the editor(s). MDPI and/or the editor(s) disclaim responsibility for any injury to people or property resulting from any ideas, methods, instructions or products referred to in the content. |
© 2023 by the authors. Licensee MDPI, Basel, Switzerland. This article is an open access article distributed under the terms and conditions of the Creative Commons Attribution (CC BY) license (https://creativecommons.org/licenses/by/4.0/).
