Article

A Fractional (q,q) Non-Extensive Information Dimension for Complex Networks

by
Aldo Ramirez-Arellano
1,*,
Jazmin-Susana De-la-Cruz-Garcia
1 and
Juan Bory-Reyes
2
1
Sección de Estudios de Posgrado e Investigación, Unidad Profesional Interdisciplinaria de Ingeniería y Ciencias Sociales y Administrativas, Instituto Politécnico Nacional, Mexico City 08400, Mexico
2
Sección de Estudios de Posgrado e Investigación, Escuela Superior de Ingeniería Mecánica y Eléctrica (Zacatenco), Instituto Politécnico Nacional, Mexico City 07338, Mexico
*
Author to whom correspondence should be addressed.
Fractal Fract. 2023, 7(10), 702; https://doi.org/10.3390/fractalfract7100702
Submission received: 31 August 2023 / Revised: 19 September 2023 / Accepted: 22 September 2023 / Published: 24 September 2023

Abstract

:

Simple Summary

The fractional ( q , q )-information dimension for complex networks is introduce, and a dual version of the ( q , q )-entropy, called ( q , q )-extropy, is proposed. Experiments reveal that the fractional ( q , q )-information dimension is less than the classical one (based on Shannon entropy) for both real-world and synthetic networks.

Abstract

This article introduces a new fractional approach to the concept of information dimensions in complex networks based on the ( q , q )-entropy proposed in the literature. The q parameter measures how far the number of sub-systems (for a given size ε ) is from the mean number of overall sizes, whereas q (the interaction index) measures when the interactions between sub-systems are greater ( q > 1 ), lesser ( q < 1 ), or equal to the interactions into these sub-systems. Computation of the proposed information dimension is carried out on several real-world and synthetic complex networks. The results for the proposed information dimension are compared with those from the classic information dimension based on Shannon entropy. The obtained results support the conjecture that the fractional ( q , q )-information dimension captures the complexity of the topology of the network better than the information dimension.

1. Introduction

Entropy—introduced by Clausius [1] in the context of thermodynamics—is a crucial measure of the uncertainty of the state in a physical system, allowing for specification of the state of disorder, randomness, or uncertainty in the micro-structure of the system. Due to this fact, researchers in many scientific fields have continually extended, interpreted, and applied the notion of entropy.
Several generalizations of the celebrated Shannon entropy, originally related to information processes [2], have been introduced in the literature. For a deeper review of entropy measures, the reader is referred to [3,4,5,6,7,8].
Given a probability distribution P = { p 1 , p 2 , , p N } under a probability space X = { x 1 , x 2 , , x N } , the Shannon entropy under P (see [9]) is generated as:
I = lim t 1 d d t i = 1 N p i t = i = 1 N p i ln p i ,
where N is the total number of (microscopic) probabilities p i and i = 1 N p i = 1 .
Similarly, the Tsallis entropy (also called q-entropy) [10,11,12] is generated by the same procedure but using Jackson’s q-derivative operator D q t f ( t ) = f ( q t ) f ( t ) ( q 1 ) t , t 0 , [13] (see also [9,14,15]), given by
I T = lim t 1 D q t i = 1 N p i t = i = 1 N p i l n q p i ,
where the q logarithm is defined by
l n q ( p i ) = p i 1 q 1 1 q ,
( p i > 0 , q R , q 1 , l n 1 p i = l n p i ).
The Tsallis entropy is connected to the Shannon entropy through the limit
lim q 1 I T = I ,
which is why it is considered a parameter extension of Shannon entropy.
Several entropy measures have been revealed following the same procedure above, using appropriate fractional-order differentiation operators on the generative function i = 1 N p i t with respect to the variable t and then letting t 1 (see, e.g., [16,17,18,19,20,21,22,23]).
A new measure of information, called extropy, has been introduced by Lad, Sanfilippo, and Agrò [24] as the dual version of Shannon entropy. In the literature, this measure of uncertainty has received considerable attention in recent years [25,26,27]. The entropy and extropy of a binary distribution ( N = 2 ) are identical.
In recent years, complex networks and systems have been extensively studied, as they are helpful tools for modelling complex systems in various interdisciplinary fields, such as mathematics, statistical physics, computer science, sociology, economics, biology, and so on (see [28,29,30,31,32,33,34,35,36], to name just a few).
The dimension of a network is a crucial concept for understanding the underlying architecture, complex topology, and dynamic processes of the network, which are difficult to understand. The dependence of model behaviour on the dimension of the system leads to the occurrence of critical phenomena.
For an updated survey on the fractal dimensions of networks and other related theoretical topics, we refer the reader to [37,38,39,40,41,42,43,44].
In the study of the structure of complex networks, the fractional-order information dimension has been developed by combining the fractional order entropy and information dimensio (see, for instance, Refs. [45,46] and the references given therein).
This article proposes a fractional ( q , q )-information dimension for complex networks derived by applying the fractional order entropy introduced in [47]. This new information dimension is computed on several networks, both those gathered from real-world fields and synthetic complex networks. The results provide evidence that the fractional two-parameter non-extensive information dimension describes the complexity of the topology of the network better than the information dimension. This is corroborated by statistical analysis and data mining techniques.
The remainder of this paper is structured as follows. Section 2 introduces a fractional entropy measure and the information dimension of complex networks. Then, the proposed fractional information dimension measure is introduced in Section 3. Section 4 focuses on applying this new measure to various complex networks. Finally, the findings of this study and our conclusions are given in Section 4.

2. Preliminaries

2.1. Fractional ( q , q ) Entropy

Following the same procedure used to obtain the Shannon and Tsallis entropies, a generalized non-extensive two-parameter entropy, named fractional ( q , q ) entropy, was developed in [47], obtained by the action of a derivative operator previously proposed by Chakrabarti and Jagannathan [48]:
I q , q : = lim t 1 D q , q t i = 1 N p i t = i = 1 N p i q p i q q q ,
where D q , q t of a function f is given by D q , q t f ( t ) = f ( q t ) f ( q t ) ( q q ) t .
Following the general idea that extropy is the complementary dual version of entropy, we present the ( q , q ) extropy for a discrete random variable X as
J q , q = i = 1 N ( 1 p i ) q ( 1 p i ) q q q .
An easy computation shows that Equation (5) can be expressed in terms of the Tsallis entropy:
I q , q = ( 1 q ) I T ( 1 q ) I T q q .
Note that I q , q 0 q , q and I q , q = W 1 q W 1 q q q for p i = 1 / W i . Consider a system composed of two independent sub-systems A and B with factorized probabilities p i , A and p i , B ; then,
I q , q = I q , q A + I q , q B + ( 1 q ) I q , q A I q , 1 B + ( 1 q ) I q , q B I q , 1 A ,
where the I ( q , 1 ) entropy resembles the Tsallis entropy in Equation (2) and I ( 1 , 1 ) is the Shannon entropy in Equation (1). Thus, I ( q , q ) is non-additive for q , q 1 .

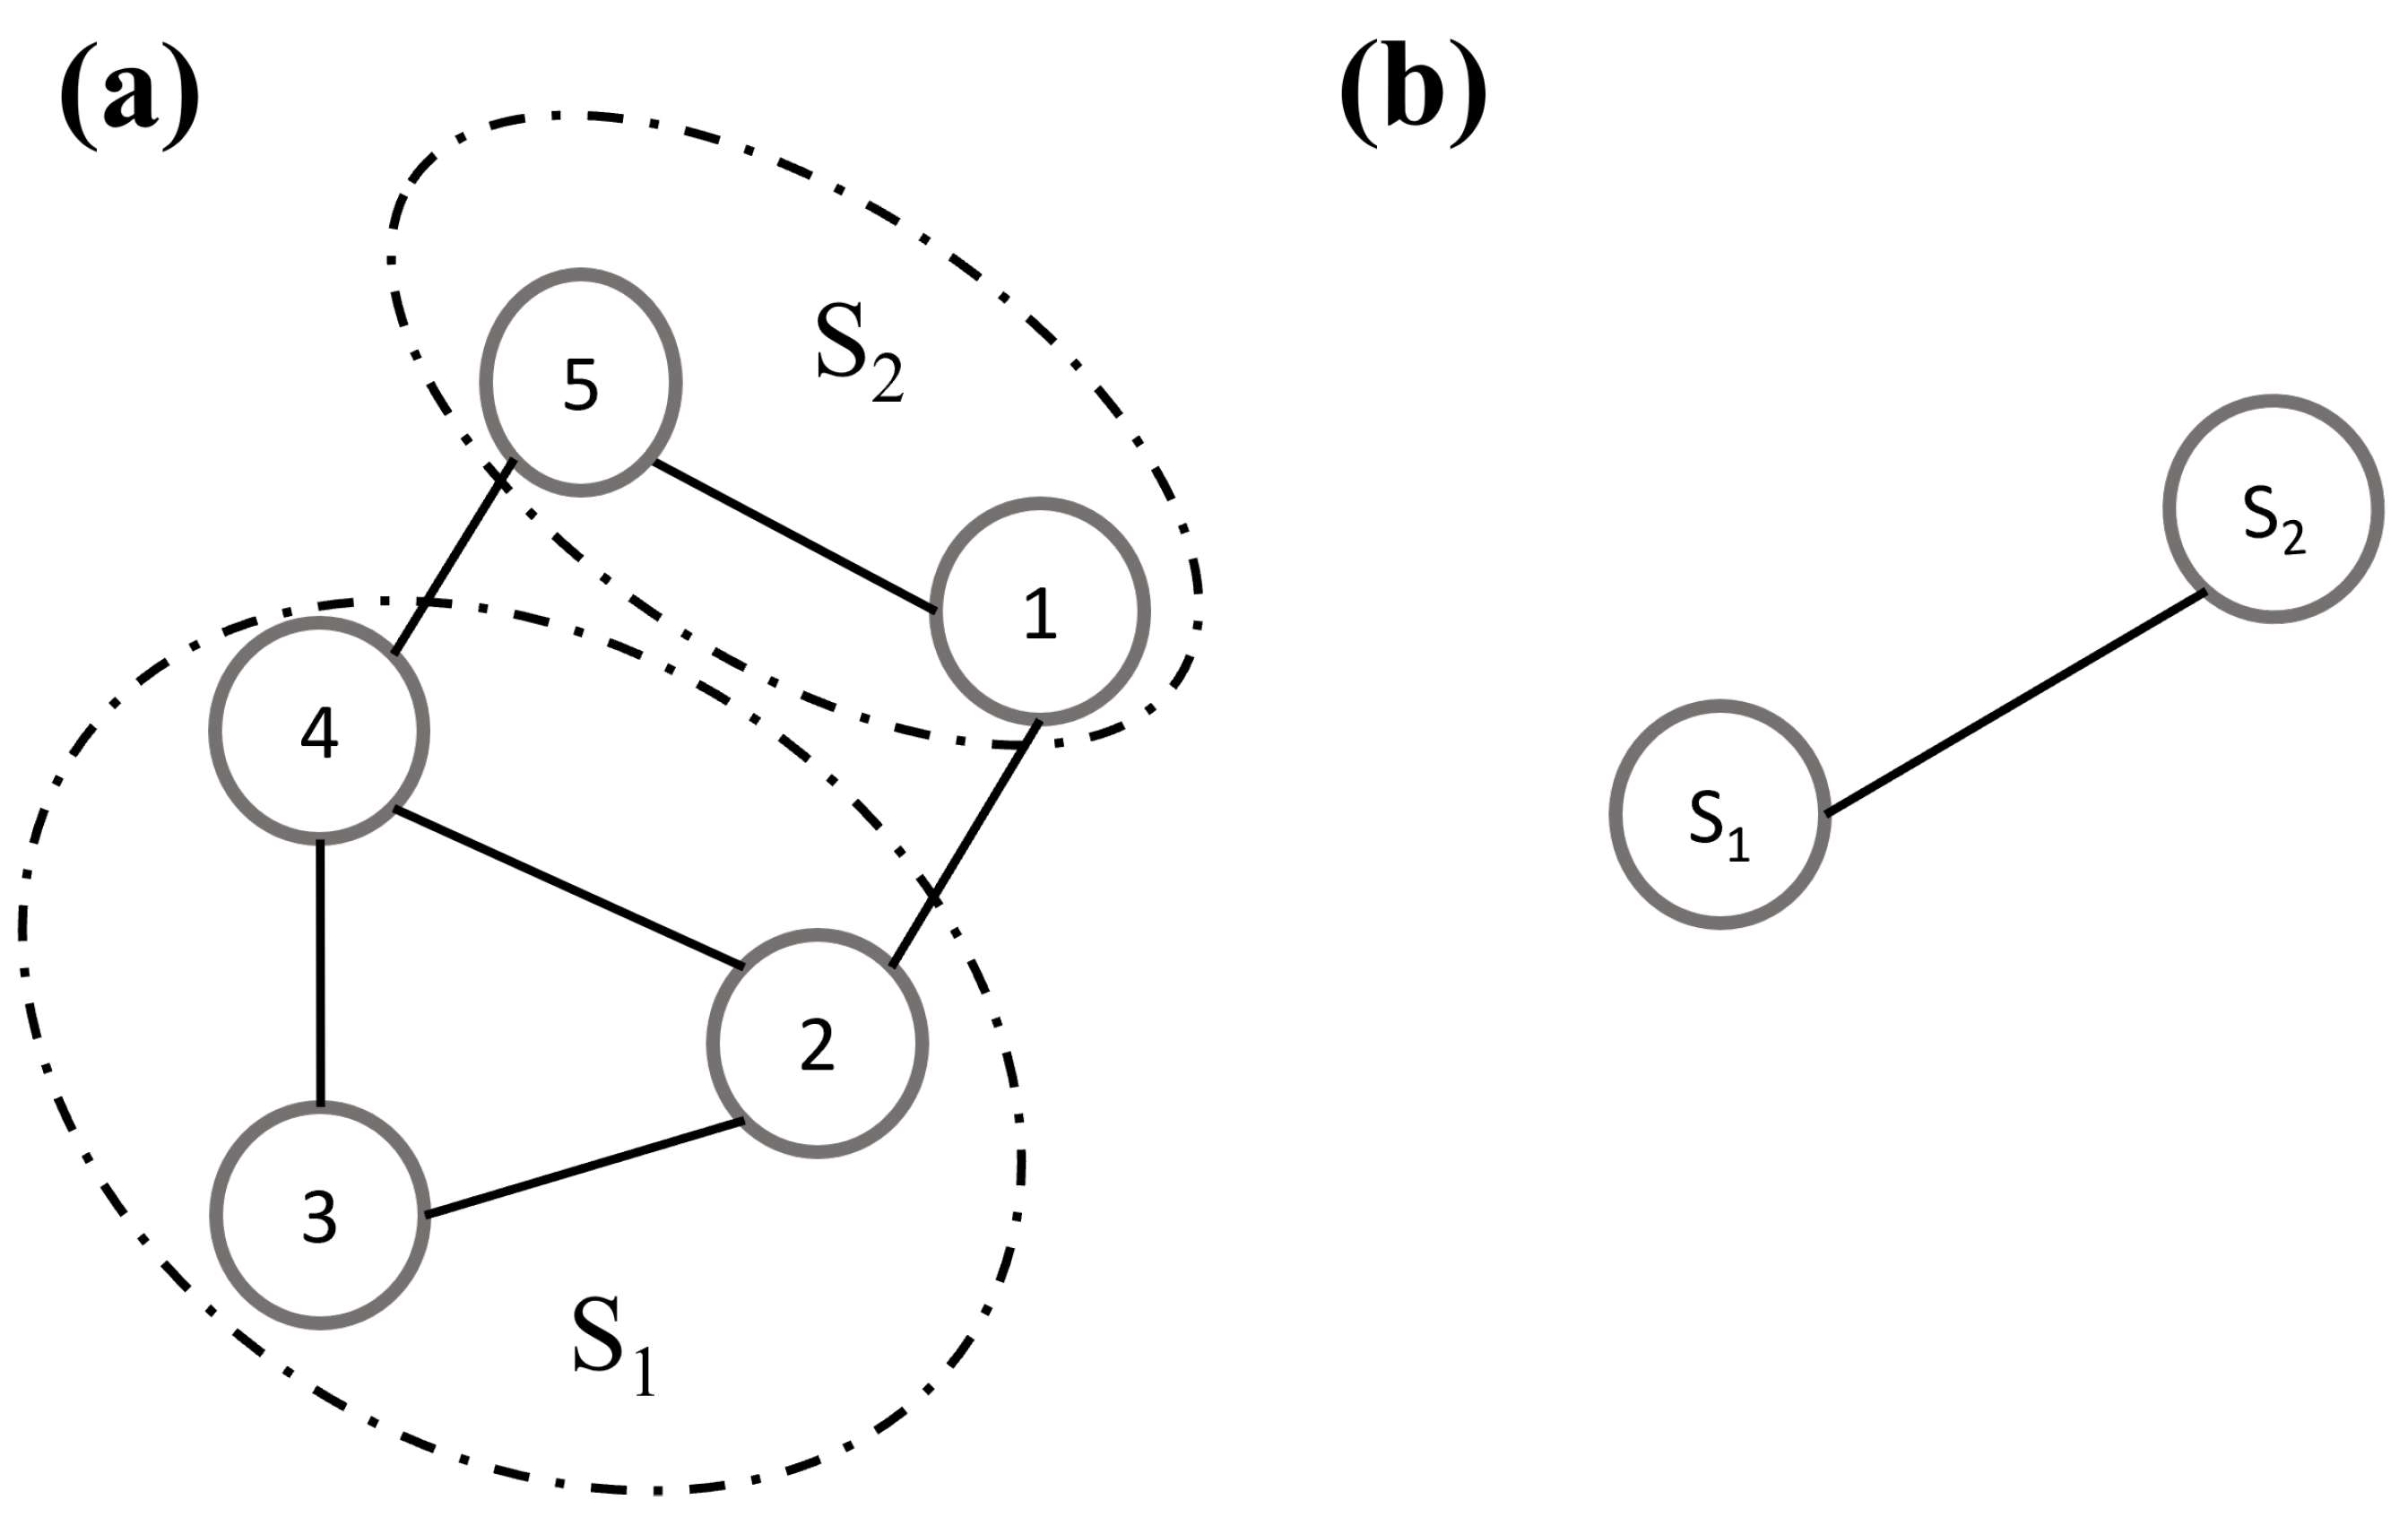
2.2. Information Dimension of Networks

The information dimension measuring the topological complexity of a given network is sketched briefly in the following.
The definition of the information dimension was introduced in [49], considering the Shannon entropy in Equation (1), as follows:
d I = lim ε 0 I ( ε ) ln ε = lim ε 0 i = 1 N b p i ( ε ) ln p i ( ε ) ln ε ,
where p i ( ε ) = n i ( ε ) n , n i ( ε ) are the nodes into the i th box of size ε , n is the total number of nodes in the network, and N b is the number of boxes required to cover the network. The reader may consult [50,51] for in-depth details on obtaining N b .
Applying Equation (9), we can assert that
I ( ε ) d I ln ε + β ,
for some constant β , where ε is the diameter of the boxes covering the network.

3. Fractional ( q , q ) Information Dimension of Complex

Now, we proceed to the primary goal of this article, which is to introduce the fractional ( q , q ) information dimension of complex network, which is denoted by d q , q and given by:
d q q = lim ε 0 I q , q ( ε ) ln ε = lim ε 0 i = 1 N b p i q ( ε ) p i q ( ε ) q q ln ε ,
where p i ( ε ) = n i ( ε ) n , n i ( ε ) are the nodes in the ith box of size ε , n is the total number of nodes in the network, and N b is the number of boxes required to cover the network. The parameters q and q depend on the minimal covering of the network; thus, the maximal entropy minimal covering principle was adopted, as in the previous research on complex networks [45,46,52,53,54], for the computation of ε = [ 2 , Δ ] , where Δ denotes the diameter of the network.
For some constant β , Equation (12) can be deduced from Equation (11):
I q , q ( ε ) d q , q ln ε + β .

Computation of q , q

The computation of q relies on the idea that a network can be considered as a system that can be divided into several sub-systems. This division is based on the formation of minimum boxes by the box-covering heuristic. Hence, the number of sub-systems is equal to the number of boxes N b for a given size ε .
For a given box size ε , the value of q is determined as the average of q ε , denoted by q ¯ ε , where
q ε : = ( Δ 1 ) N b ( ε ) ε = 2 Δ N b ( ε ) .
Note that q ε = ( q 2 , q 3 , , q Δ ) .
This approximation measures how far the number of sub-systems (for a given size ε ) is from the mean number of overall sizes, which is the baseline.
Now, to quantify the interactions among the elements that form the sub-systems (nodes) and among these sub-systems (boxes), the parameters α and β were introduced in [46]:
α ε , i = 1 | S i | i n d e g ( S i ) n i = 1 N b i n d e g ( S i ) ,
β ε , i = 1 o u t d e g ( S i ) ε Δ i = 1 N b o u t d e g ( S i ) ,
where | S i | is the number of nodes in S i , n is the number of nodes of the network, i n d e g ( G i ) are the edges among the nodes that are in S i , o u t d e g ( S i ) are the edges among the sub-networks S i , ε is the diameter of the box that covers the sub-network S i , and Δ is the diameter of the network.
Finally, q is defined by
q = β ¯ ε , i α ¯ ε , i ,
where β ¯ ε , i , α ¯ ε , i are the mean of β ε , i and α ε , i , respectively, as they are vectors of type ( a ε , 1 , a ε , 2 , , a ε , N b ) . Equation (16) defines the interaction index [46], which indicates whether β is equal to ( q = 1 ), greater than ( q > 1 ) or less than ( q < 1 ) α . Hence, it reflects which type of interaction is stronger, that is, either inner sub-system interactions ( α ) or outer interactions ( β ) are stronger, or both are balanced.
Figure 1 shows examples of how α and β are computed. Once a box covering is obtained (using the approach in [51]) for ε = 2 , see Figure 1a, the re-normalization agglomerates the nodes in the boxes into super-nodes (sub-systems) S 1 and S 2 , as shown in Figure 1b. As Δ = 2 , in the example, q = q ¯ ε = q 2 = 1 . Furthermore, i n d e g ( S 1 ) = 3 , i n d e g ( S 2 ) = 1 , o u t d e g ( S 1 ) = 1 , and o u t d e g ( S 2 ) = 1 , which reflect the degrees of the nodes of the re-normalized network in Figure 1b.
As n = 5 , the results for Equation (14) are α 2 , S 1 = 0.55 0 and α 2 , S 2 = 0.900 , whereas those from Equation (15) are β 2 , S 1 = 0.50 , and β 2 , S 2 = 0.500 ; thus, q = 0.689 . The included networks have a diameter greater than the example shown above and, so, the steps to estimate q ε and q ε are repeated for each box size ε , resulting in two vectors that are averaged to obtain q and q . Once q and q have been obtained, then d q , q can be computed by approximating Equation (12) to ε vs. I q , q ( ε ) through non-linear regression [55].

4. Results

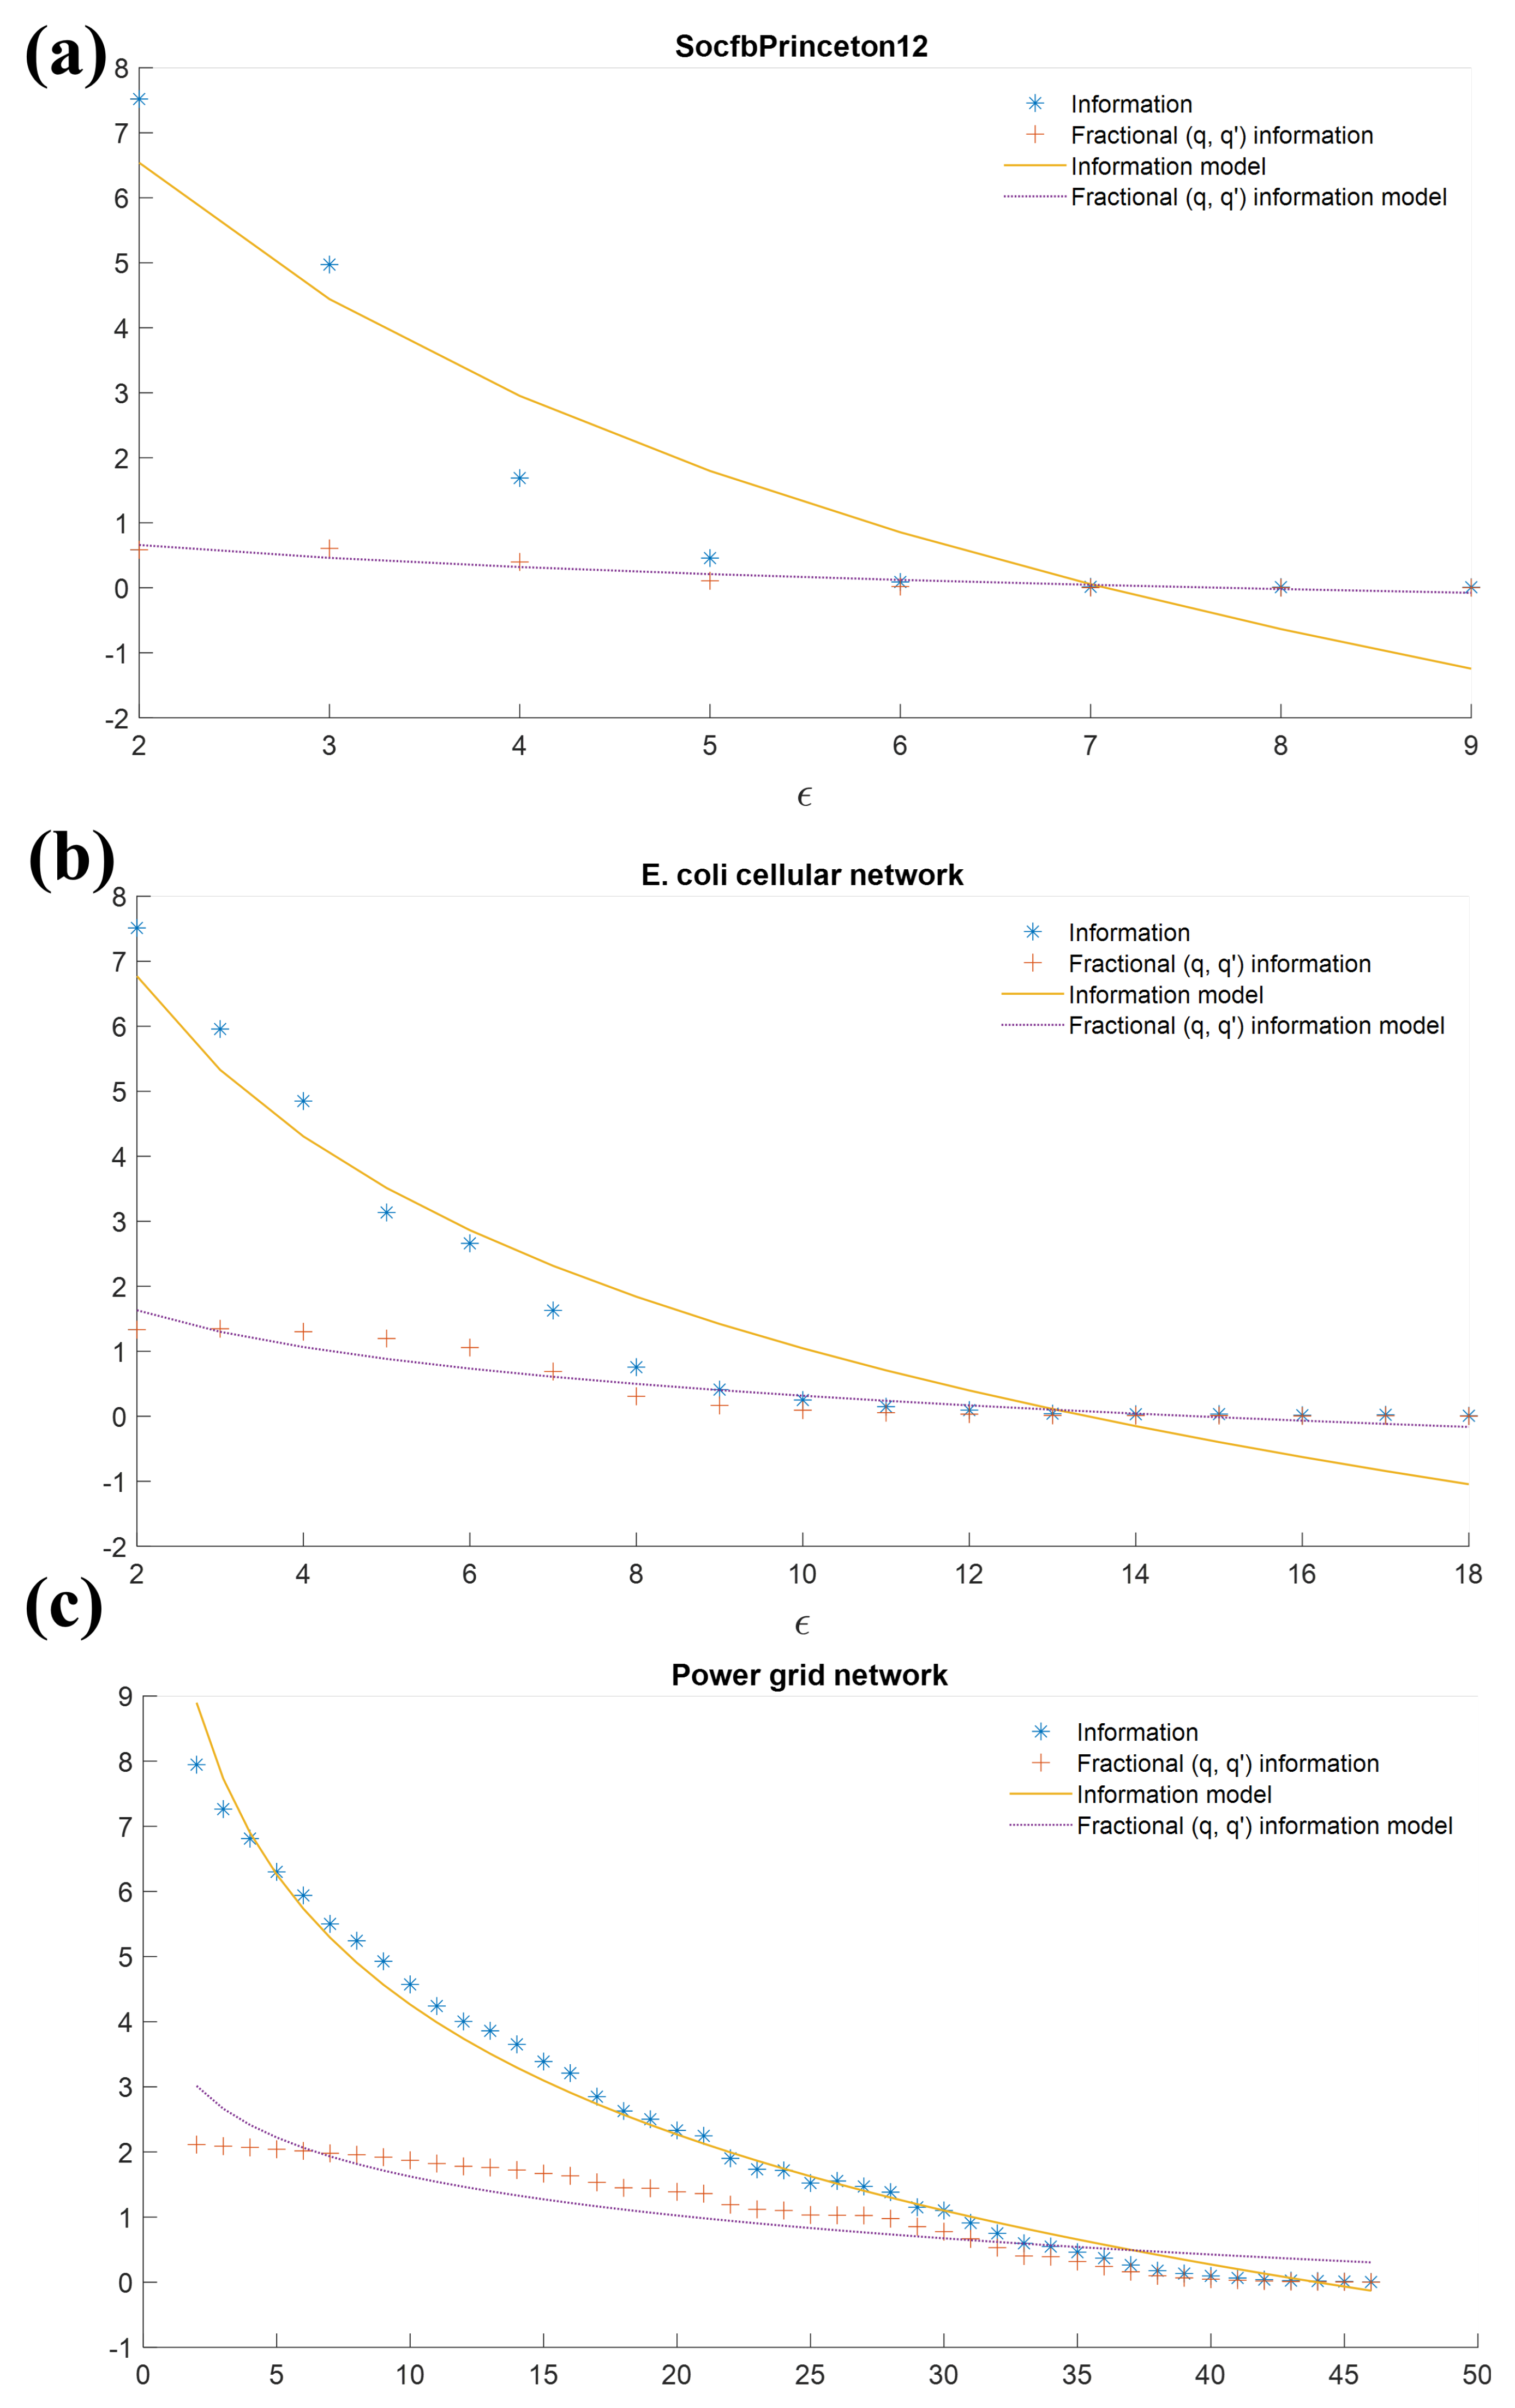
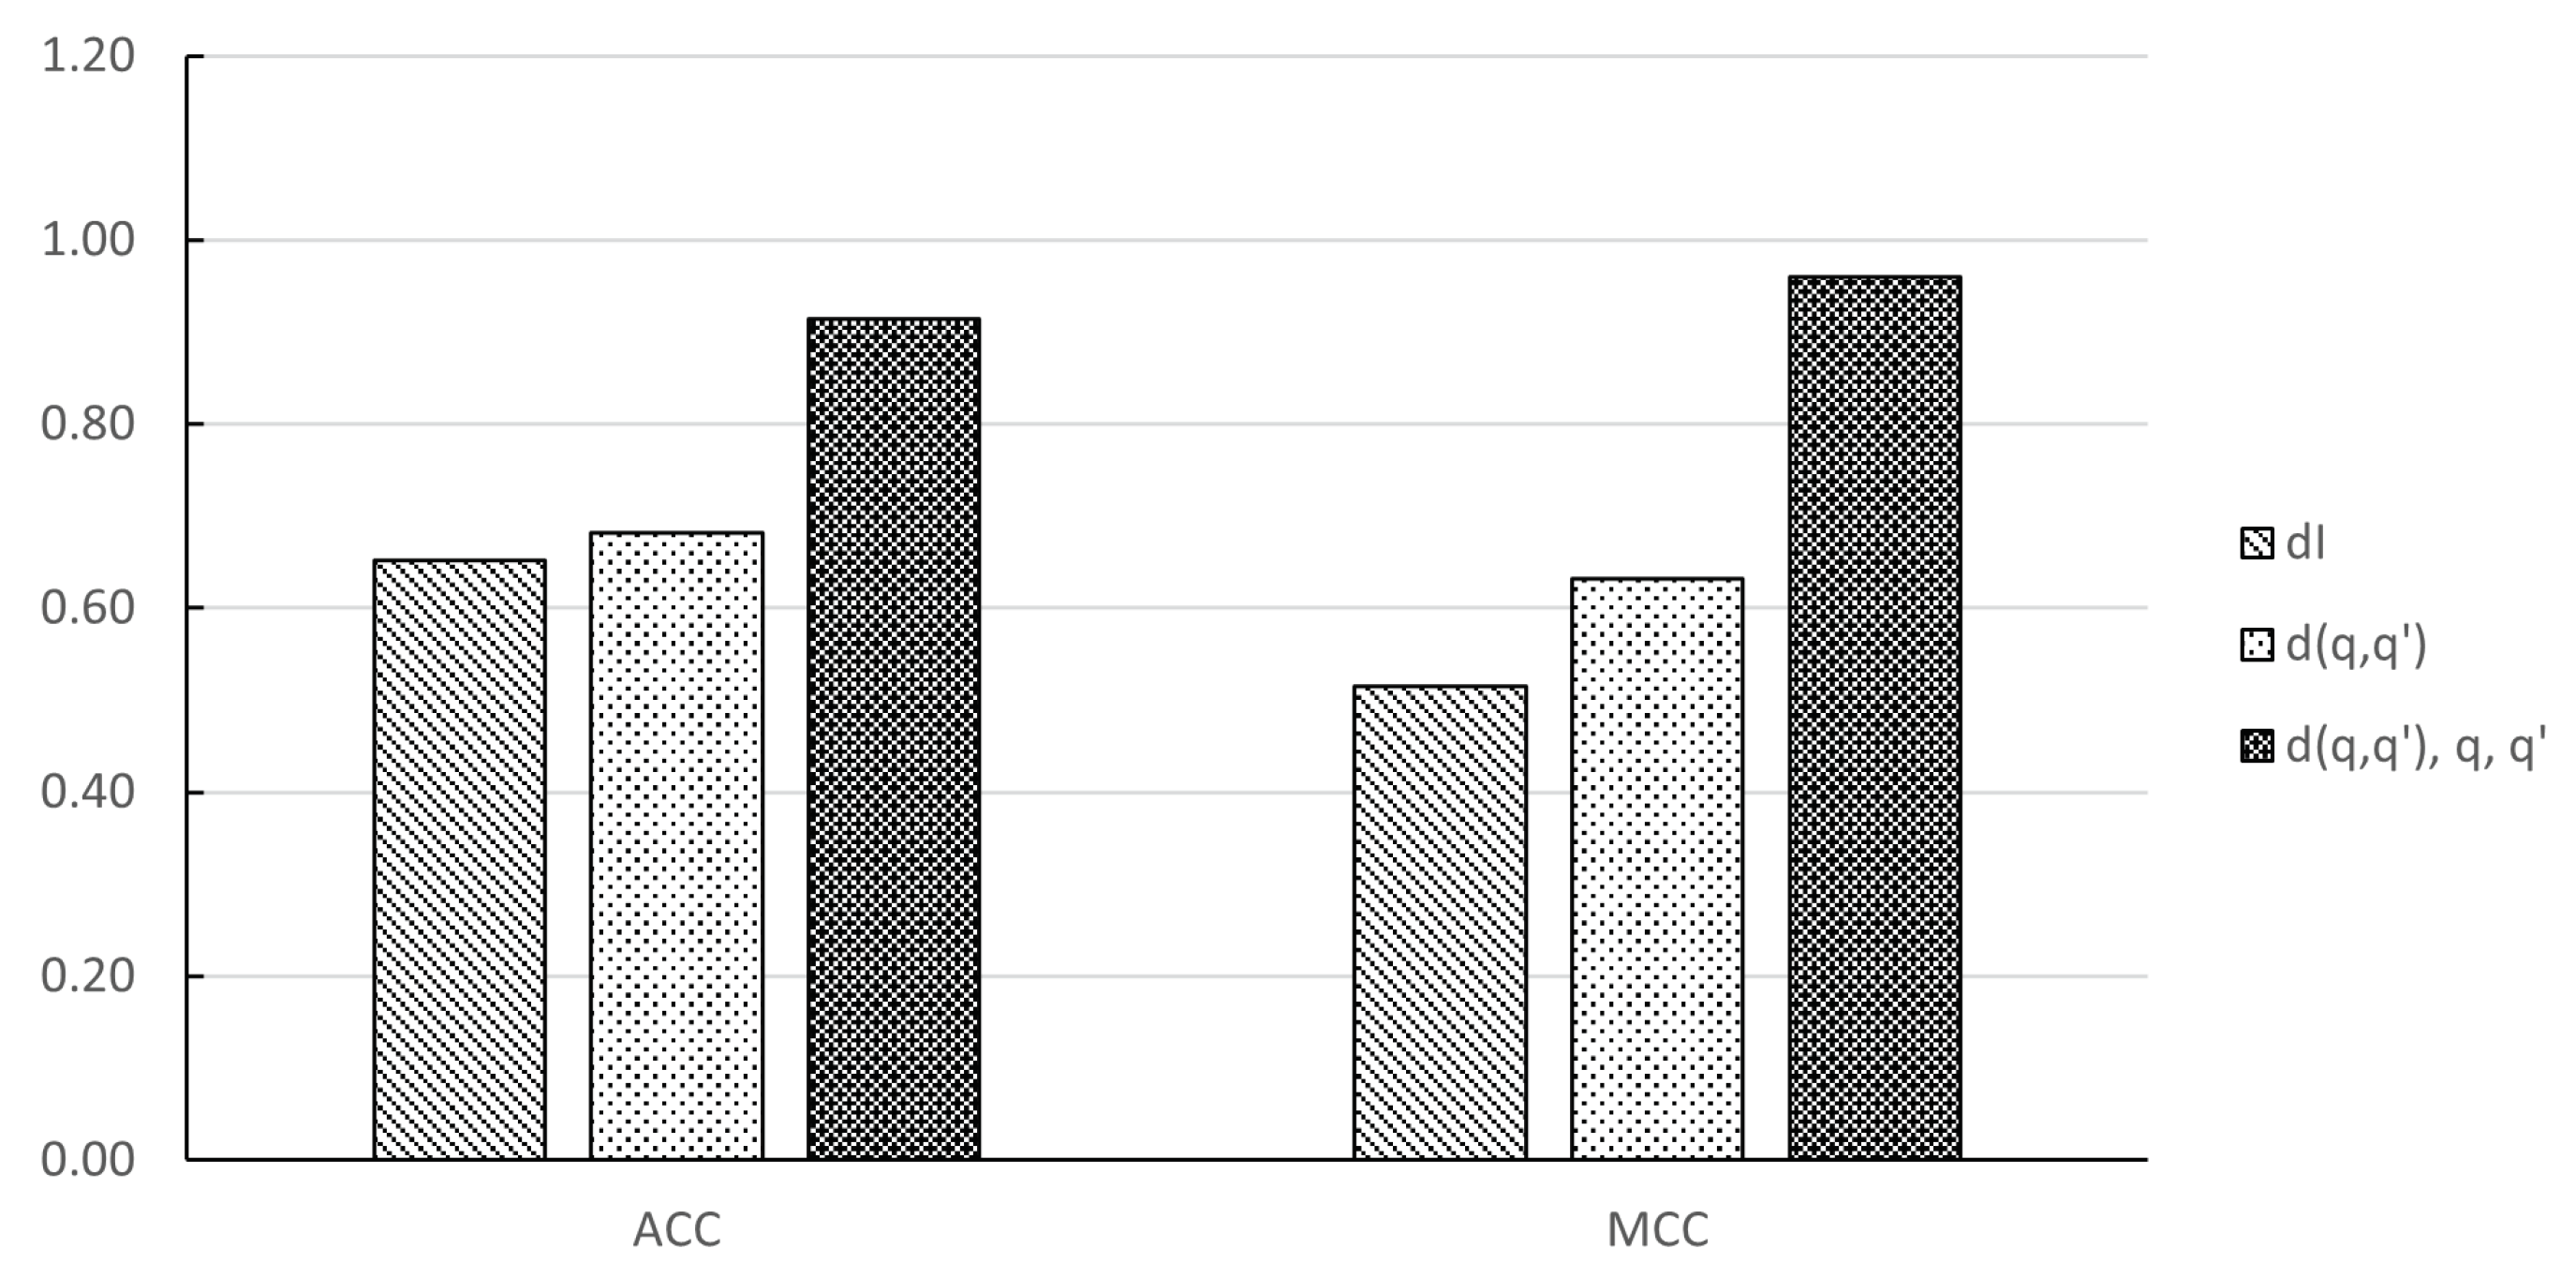
4.1. Real-World Networks

The fractional ( q , q ) information dimension Equation (11) and the classical information dimension Equation (9) were computed for 28 real-world networks gathered from [46,56] (see Table 1 for the diameter, source, and number of nodes and edges for each network). These networks cover several fields, such as biological, social, technological, and communications fields, and so, they can be considered to be representative.
Next, the models of Equations (10) and (12)—which correspond to the classical information dimension and the ( q , q ) information model, respectively—were approximated by carrying out non-linear regression [55] in MATLAB R2022a. The best model was selected according to the summed Bayesian information criterion with bonuses ( S B I C R ) [57]. The S B I C R penalizes overly complex models (which were estimated independently) and the size of the data set employed to approximate the parameters; hence, the model with the largest S B I C R score should be selected.
Table Figure 2 shows the fit values for the information model Equation (10) and fractional ( q , q ) model Equation (12) with respect to the information and ( q , q ) information, respectively. The results of S B I C R , d I , d q , q , q, and q computations are also provided. The columns S B I C R I and S B I C R q , q indicate that Equation (12) performed better than Equation (10) for all networks except PG and POW (in bold). Additionally, q > 1 indicates that the number of sub-systems for a given ε was higher than the baseline (i.e., mean sub-systems found for all ε ). On the other hand, for 12 networks, the interaction between sub-systems ( q > 1 ; in bold) was stronger; furthermore, for 16 networks, the inner interactions between the elements of the sub-systems ( q < 1 ) were higher than those between sub-systems (i.e., outer interactions).
Figure 2a shows the results for the SocfbPrinceton12 network, where the fractional ( q , q ) model (dotted line) is closer to the fractional ( q , q ) information (+) than the information model (solid line) to information (*). This is rather difficult to appreciate in Figure 2b, making the S B I C R a valuable tool for analysis. The opposite scenario can be seen in Figure 2c, where the information model performed better than the fractional ( q , q ) model as the value of S B I C R I was higher than the value of S B I C R ( q , q ) for the Power grid network (PG) (see Table 2).

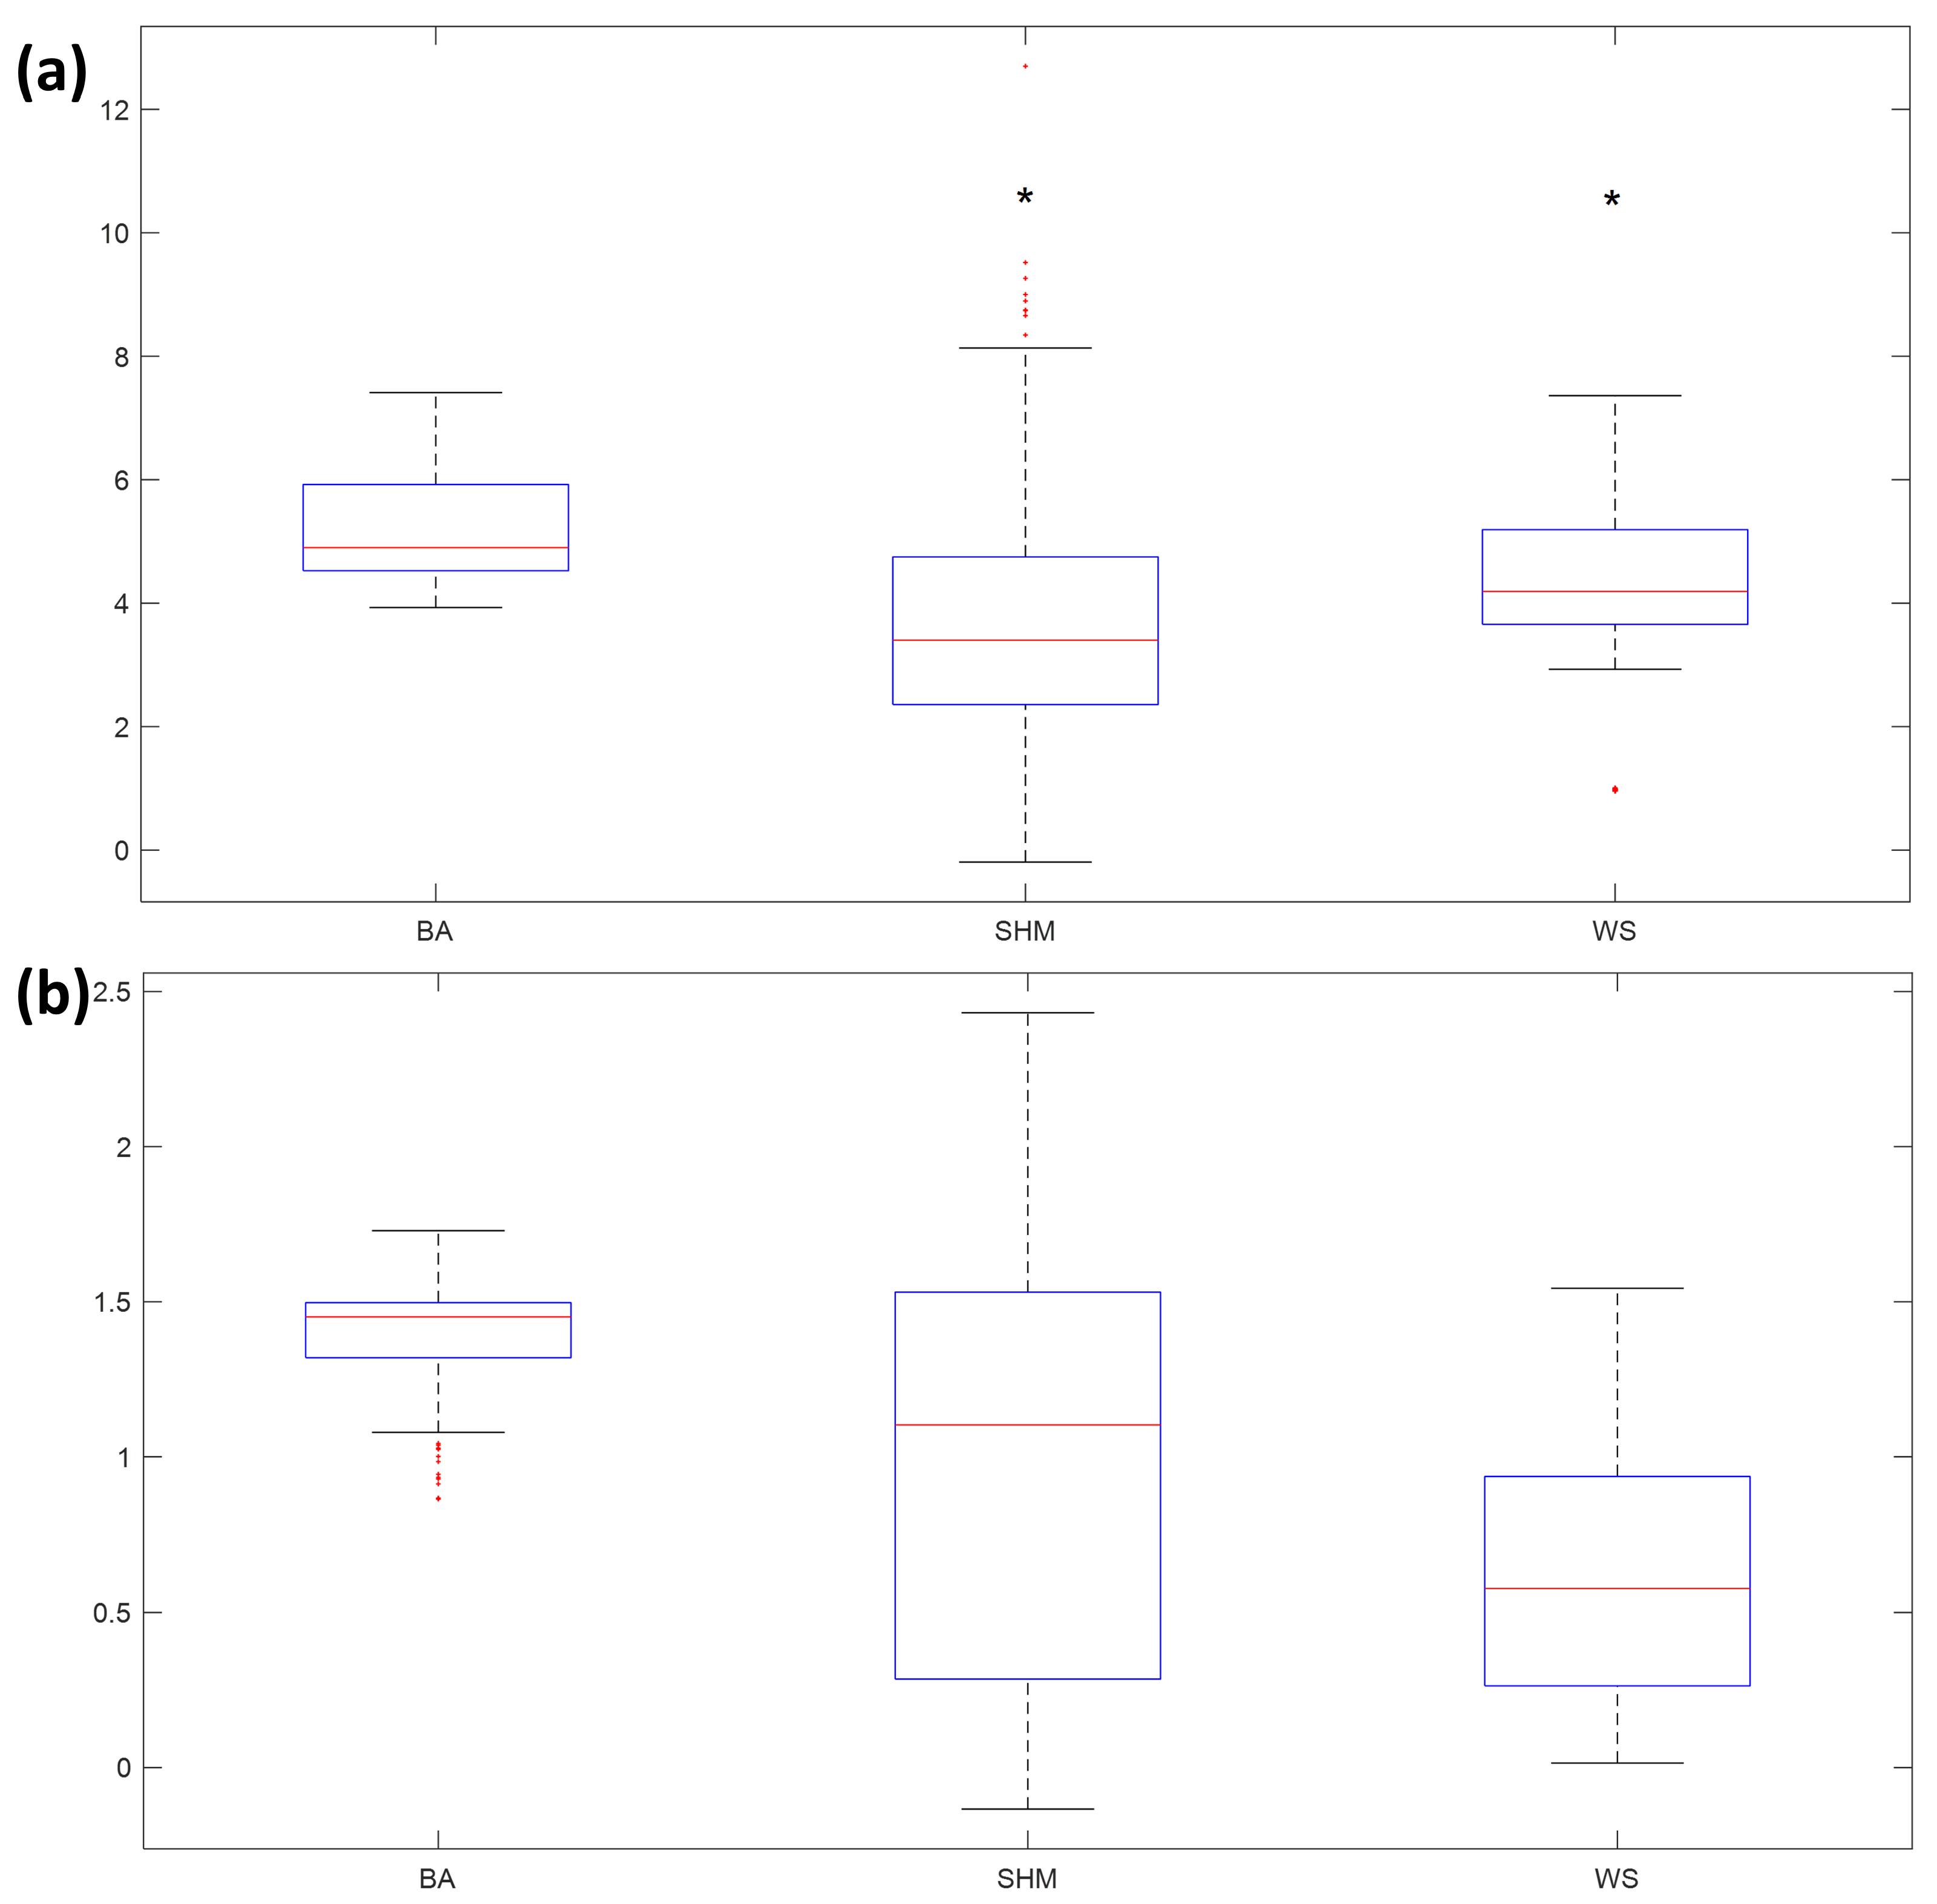
4.2. Synthetic Networks

A similar procedure was followed on the networks generated using the Barabasi–Albert (BA) [58], Song, Havlin, and Makse (SHM) [59], and Watts and Strogatz (WS) models [60]. First, d I and d q , q were computed, following which the best models using Equations (10) and (12) were chosen based on the S B I C R . There were 225 BA–based networks, 211 SHM networks, and 216 WS networks. Table 3 summarises the nodes, edges, d I , d q , q , and the information model selected between Equations (10) and (12). See the Supplementary Materials for details on the parameters of each model used to generate the networks, as well as the specific S B I C R I , S B I C R ( q , q ) , d I , d q , q , q, and q values.
A remarkable finding on the real and synthetic networks was that d q , q < d I . The fractional ( q , q ) model fitted all BA and WS networks and about 71% of the SHM networks better. Table 4 summarises the parameters of the SHM model that produced 29 % ( 153 ) networks for which the information model fit better (see the Supplementary Materials for the meaning of each parameter). The values of the SHM parameters are influenced by the assortativity ( M O D E = 1 ) and hub repulsion ( M O D E = 2 ), such that the only conditions that intersected on M O D E = 1 and M O D E = 2 were G = 2 M = 3 I B = 0 B B = 0.400 , G = 3 M = 2 I B = 0 B B = 1 , and G = 3 M = 2 I B = 0.400 B B = 0.800 .
Additionally, for BA, setting the average node degree ( a d ) equal to 1 produced networks with stronger outer interactions than inner ones ( q > 1 ). This occurred regardless of the number of initial nodes ( n 0 ) and total nodes (n) (see Table S1 in the Supplementary Materials). On the other hand, three SHM networks (SHM_G–3 M–4 IB–0.400 BB–0.000 MODE–2, SHM_G–4 M–3 IB–0.000 BB–0.400 MODE–2, SHM_G–4 M–3 IB–0.400 BB–0.000 MODE–2) and one WS network (WS–2000–2–0.400) obtained q > 1 ; (see Tables S2 and S3). These results suggest that the fractional ( q , q ) information dimension captures the complexity of the network topology, as the SHM model tunes the links between nodes into the boxes ( I B ) and the connections between boxes through B B . The BA and WS models do not possess this capability.
Next, a Kruskal–Wallis test was conducted on d I and d q . q . The results demonstrated that, for α 0.001 , a significant difference was found ( H ( 2 ) = 112.568 , p < 0.0001 ). However, a deeper analysis conducted using the Mann–Whitney U test revealed no difference between the d I of SHM ( m d n = 3.401 ) and WS ( m d n = 4.190 ); see Figure 3a. On the other hand, a significant difference ( H ( 2 ) = 216.667 , p < 0.0001 ) was found between SHM ( m d n = 1.102 ), WS ( m d n = 0.577 ), and BA ( m d n = 1.451 ) for d q . q ; see Figure 3b. The detailed pairwise comparison results of the Mann–Whitney U test are presented in Tables S4 and S5.
Additionally, a C4.5 decision tree, implemented in WEKA [61] as J48, was constructed using three data sets: (1) d I , (2) d q . q , (3) d q . q , q, and q . Each model obtained from these data sets was trained and tested using 10-fold cross-validation. The accuracy (ACC) and Matthew’s correlation coefficient (MCC) were used as metrics to evaluate the classification performance. The model built from d q . q obtained an ACC = 0.682 and MCC = 0.632; both higher than those (ACC = 0.653 and MCC = 0.514) obtained by the model built using d I . Additionally, the models constructed using d q . q , q, and q obtained the best performance (ACC = 0.915, MCC = 0.960), as can be seen from Figure 4. These results suggest that the fractional ( q , q ) information dimension and the q and q parameters better describe the complex topology of the synthetic networks than the information dimension d I .

5. Conclusions

This article introduced a new fractional ( q , q ) information dimension for complex networks. The rationale of the proposed definition is that a network can be divided into several sub-systems. Hence, q measures how far the number of sub-systems (for a given size ε ) is from the mean number of overall sizes, which is treated as the baseline. On the other hand, q (interaction index) measures whether the interactions between sub-systems are greater ( q > 1 ), lesser ( q < 1 ), or equal to the interactions into these sub-systems ( q = 1 ).
Starting from experimental results on real and synthetic networks, a glance at the interactions between sub-systems indicates that clear interconnection patterns emerge, especially in the networks generated using the SHM model, the parameters of which play a crucial role in obtaining networks that the information model best fit. The initial node parameter of the BA model led to the generation of networks where the outer interactions were stronger than inner ones (i.e., q > 1 ), no matter the values of the remaining parameters. Finally, our experiments revealed that d q , q < d I in both types of network.
Additionally, the d q , q values differed between the synthetic networks generated using the BA, SHM, and WS models. The d q , q value, the mean number of sub-systems of the network (q), and the interaction index ( q ) capture the complex topological features of synthetic networks, allowing for their classification with a good performance, even outperforming the classic information dimension d I . For future work, extending the network’s classification using a long short-term memory fed with I ( ε ) , q ε , and β ¯ ε , i α ¯ ε , i might allow us to achieve better results.
There is evidence that the fractional ( q , q ) information dimension of complex networks based on ( q , q ) extropy seems to be a complementary dual statistical index of the fractional ( q , q ) information dimension. It is an exciting area for future research, and we hope to prove the extent to which these new formulations will be helpful.

Supplementary Materials

The following supporting information can be downloaded at: https://www.mdpi.com/article/10.3390/fractalfract7100702/s1, Table S1: The S B I C R , d I , d q , q , q, and q values for the information model Equation (10) and the fractional ( q , q ) information model Equation (12) on BA networks; Table S2: The S B I C R , d I , d q , q , q, and q values for the information model Equation (10) and the fractional ( q , q ) information model Equation (12) on SHM networks; Table S3: The S B I C R , d I , d q , q , q, and q values for the information model Equation (10) and the fractional ( q , q ) information model Equation (12) on WS networks; Table S4: Mann–Whitney U test using adjusted alpha α = 3.333 × 10 4 for d I ; Table S5: Mann–Whitney U test using adjusted alpha α = 3.333 × 10 4 for d ( q , q ) .

Author Contributions

Conceptualization, J.B.-R. and A.R.-A.; formal analysis, A.R.-A. and J.B.-R.; investigation, J.-S.D.-l.-C.-G.; methodology, A.R.-A. and J.-S.D.-l.-C.-G.; supervision, J.B.-R.; writing—original draft, A.R.-A. and J.B.-R.; writing—review and editing, A.R.-A. and J.B.-R. All authors have read and agreed to the published version of the manuscript.

Funding

This research was funded by Instituto Politécnico Nacional grant number 20230066.

Data Availability Statement

The data that support the findings of this study are available from the corresponding author upon reasonable request.

Conflicts of Interest

The authors declare no conflict of interest.

Abbreviations

The following abbreviations are used in this manuscript:
ACCAccuracy
MCCMatthew’s Correlation Coefficient
MDPIMultidisciplinary Digital Publishing Institute
SBICRBayesian Information Criterion with Bonuses
BABarabasi–Albert
SHMSong, Havlin, and Makse
WSWatts and Strogatz

References

  1. Clausius, R. The Mechanical Theory of Heat: With Its Applications to the Steam-Engine and to the Physical Properties of Bodies; Creative Media Partners: Sacramento, CA, USA, 1867. [Google Scholar]
  2. Shannon, C.E. A mathematical theory of communication. Bell Syst. Tech. J. 1948, 27, 379–423. [Google Scholar] [CrossRef]
  3. Beck, C. Generalized information and entropy measures in physics. Contemp. Phys. 2009, 50, 495–510. [Google Scholar] [CrossRef]
  4. Esteban, M.D. A general class of entropy statistics. Appl. Math. 1997, 42, 161–169. [Google Scholar] [CrossRef]
  5. Esteban, M.D.; Morales, D. A summary on entropy statistics. Kybernetika 1995, 31, 337–346. [Google Scholar]
  6. Ribeiro, M.; Henriques, T.; Castro, L.; Souto, A.; Antunes, L.; Costa-Santos, C.; Teixeira, A. The entropy universe. Entropy 2021, 23, 222. [Google Scholar] [CrossRef] [PubMed]
  7. Lopes, A.M.; Tenreiro Machado, J.A. A review of fractional order entropies. Entropy 2020, 22, 1374. [Google Scholar] [CrossRef] [PubMed]
  8. Amigó, J.M.; Balogh, S.G.; Hernández, S. A brief review of generalized entropies. Entropy 2018, 20, 813. [Google Scholar] [CrossRef]
  9. Abe, S. A note on the q-deformation-theoretic aspect of the generalized entropies in nonextensive physics. Phys. Lett. A 1997, 224, 326–330. [Google Scholar] [CrossRef]
  10. Tsallis, C. Possible generalization of Boltzmann-Gibbs statistics. J. Stat. Phys. 1988, 52, 479–487. [Google Scholar] [CrossRef]
  11. Tsallis, C.; Tirnakli, U. Non-additive entropy and nonextensive statistical mechanics—Some central concepts and recent applications. J. Phys. Conf. Ser. 2010, 201, 012001. [Google Scholar] [CrossRef]
  12. Tsallis, C. Introduction to non-extensive Statistical Mechanics: Approaching a Complex World. In Introduction to Non-Extensive Statistical Mechanics: Approaching a Complex World; Chapter Thermodynamical and Nonthermodynamical Applications; Springer: New York, NY, USA, 2009; pp. 221–301. [Google Scholar]
  13. Jackson, D.O.; Fukuda, T.; Dunn, O.; Majors, E. On q-definite integrals. Quart. J. Pure Appl. Math 1910, 41, 193–203. [Google Scholar]
  14. Johal, R.S. q calculus and entropy in nonextensive statistical physics. Phys. Rev. E 1998, 58, 4147. [Google Scholar] [CrossRef]
  15. Lavagno, A.; Swamy, P.N. q-Deformed structures and nonextensive-statistics: A comparative study. Phys. A Stat. Mech. Appl. 2002, 305, 310–315. [Google Scholar] [CrossRef]
  16. Shafee, F. Lambert function and a new non-extensive form of entropy. IMA J. Appl. Math. 2007, 72, 785–800. [Google Scholar] [CrossRef]
  17. Ubriaco, M.R. Entropies based on fractional calculus. Phys. Lett. A 2009, 373, 2516–2519. [Google Scholar] [CrossRef]
  18. Ubriaco, M.R. A simple mathematical model for anomalous diffusion via Fisher’s information theory. Phys. Lett. A 2009, 373, 4017–4021. [Google Scholar] [CrossRef]
  19. Karci, A. Fractional order entropy: New perspectives. Optik 2016, 127, 9172–9177. [Google Scholar] [CrossRef]
  20. Karci, A. Notes on the published article “Fractional order entropy: New perspectives” by Ali KARCI, Optik-International Journal for Light and Electron Optics, Volume 127, Issue 20, October 2016, Pages 9172–9177. Optik 2018, 171, 107–108. [Google Scholar] [CrossRef]
  21. Radhakrishnan, C.; Chinnarasu, R.; Jambulingam, S. A Fractional Entropy in Fractal Phase Space: Properties and Characterization. Int. J. Stat. Mech. 2014, 2014, 460364. [Google Scholar] [CrossRef]
  22. Ferreira, R.A.C.; Tenreiro Machado, J. An Entropy Formulation Based on the Generalized Liouville Fractional Derivative. Entropy 2019, 21, 638. [Google Scholar] [CrossRef]
  23. Ferreira, R.A.C. An entropy based on a fractional difference operator. J. Differ. Equations Appl. 2021, 27, 218–222. [Google Scholar] [CrossRef]
  24. Lad, F.; Sanfilippo, G.; Agrò, G. Extropy: Complementary dual of entropy. Statist. Sci. 2015, 30, 40–58. [Google Scholar] [CrossRef]
  25. Xue, Y.; Deng, Y. Tsallis eXtropy. Comm. Statist. Theory Methods 2023, 52, 751–762. [Google Scholar] [CrossRef]
  26. Liu, J.; Xiao, F. Renyi extropy. Comm. Statist. Theory Methods 2023, 52, 5836–5847. [Google Scholar] [CrossRef]
  27. Buono, F.; Longobardi, M. A dual measure of uncertainty: The Deng extropy. Entropy 2020, 22, 582. [Google Scholar] [CrossRef]
  28. González, S.H.; De La Mota, I.F. Applying complex network theory to the analysis of Mexico city metro network (1969–2018). Case Stud. Transp. Policy 2021, 9, 1344–1357. [Google Scholar] [CrossRef]
  29. Eguíluz, V.M.; Hernández-García, E.; Piro, O.; Klemm, K. Effective dimensions and percolation in hierarchically structured scale-free networks. Phys. Rev. E 2003, 68, 055102. [Google Scholar] [CrossRef]
  30. Ortiz-Vilchis, P.; Ramirez-Arellano, A. Learning Pathways and Students Performance: A Dynamic Complex System. Entropy 2023, 25, 291. [Google Scholar] [CrossRef]
  31. Ramirez-Arellano, A.; Ortiz-Vilchis, P.; Bory-Reyes, J. The role of D-summable information dimension in differentiating covid-19 disease. Fractals 2021, 29, 2150255. [Google Scholar] [CrossRef]
  32. Ramirez-Arellano, A. Students learning pathways in higher blended education: An analysis of complex networks perspective. Comput. Educ. 2019, 141, 103634. [Google Scholar] [CrossRef]
  33. Ortiz-Vilchis, P.; De-la Cruz-García, J.S.; Ramirez-Arellano, A. Identification of Relevant Protein Interactions with Partial Knowledge: A Complex Network and Deep Learning Approach. Biology 2023, 12, 140. [Google Scholar] [CrossRef]
  34. RamirezArellano, A. Classification of Literary Works: Fractality and Complexity of the Narrative, Essay, and Research Article. Entropy 2020, 22, 904. [Google Scholar] [CrossRef] [PubMed]
  35. Ortiz-Vilchis, P.; Ramirez-Arellano, A. An Entropy-Based Measure of Complexity: An Application in Lung-Damage. Entropy 2022, 24, 1119. [Google Scholar] [CrossRef] [PubMed]
  36. De la Cruz-García, J.S.; Bory-Reyes, J.; Ramirez-Arellano, A. A Two-Parameter Fractional Tsallis Decision Tree. Entropy 2022, 24, 572. [Google Scholar] [CrossRef]
  37. Boccaletti, S.; Latora, V.; Moreno, Y.; Chavez, M.; Hwang, D.U. Complex networks: Structure and dynamics. Phys. Rep. 2006, 424, 175–308. [Google Scholar] [CrossRef]
  38. Estrada, E. The Structure of Complex Networks: Theory and Applications; Oxford University Press, Inc.: New York, NY, USA, 2011. [Google Scholar]
  39. Rosenberg, E. A Survey of Fractal Dimensions of Networks; Springer Briefs in Computer Science; Springer: Cham, Switzerland, 2018. [Google Scholar]
  40. Rosenberg, E. Fractal Dimensions of Networks; Springer: Cham, Switzerland, 2020. [Google Scholar]
  41. Wen, T.; Cheong, K.H. The fractal dimension of complex networks: A review. Inf. Fusion 2021, 73, 87–102. [Google Scholar] [CrossRef]
  42. Xu, T.; Moore, I.D.; Gallant, J.C. Fractals, fractal dimensions and landscapes—A review. Geomorphology 1993, 8, 245–262. [Google Scholar] [CrossRef]
  43. Camacho, D.; Panizo-LLedot, Á.; Bello-Orgaz, G.; Gonzalez-Pardo, A.; Cambria, E. The four dimensions of social network analysis: An overview of research methods, applications, and software tools. Inf. Fusion 2020, 63, 88–120. [Google Scholar] [CrossRef]
  44. Peach, R.; Arnaudon, A.; Barahona, M. Relative, local and global dimension in complex networks. Nat. Commun. 2022, 13, 3088. [Google Scholar] [CrossRef]
  45. Ramirez-Arellano, A.; Sigarreta-Almira, J.M.; Bory-Reyes, J. Fractional information dimensions of complex networks. Chaos Interdiscip. J. Nonlinear Sci. 2020, 30, 093125. [Google Scholar] [CrossRef]
  46. Ramirez-Arellano, A.; Hernández-Simón, L.M.; Bory-Reyes, J. Two-parameter fractional Tsallis information dimensions of complex networks. Chaos Solitons Fractals 2021, 150, 111113. [Google Scholar] [CrossRef]
  47. Borges, E.P.; Roditi, I. A family of nonextensive entropies. Phys. Lett. A 1998, 246, 399–402. [Google Scholar] [CrossRef]
  48. Chakrabarti, R.; Jagannathan, R. A (p, q)-oscillator realization of two-parameter quantum algebras. J. Phys. Math. Gen. 1991, 24, L711. [Google Scholar] [CrossRef]
  49. Wei, D.; Wei, B.; Hu, Y.; Zhang, H.; Deng, Y. A new information dimension of complex networks. Phys. Lett. A 2014, 378, 1091–1094. [Google Scholar] [CrossRef]
  50. Song, C.; Havlin, S.; Makse, H.A. Self-similarity of complex networks. Nature 2005, 433, 392. [Google Scholar] [CrossRef] [PubMed]
  51. Song, C.; Gallos, L.K.; Havlin, S.; Makse, H.A. How to calculate the fractal dimension of a complex network: The box covering algorithm. J. Stat. Mech. Theory Exp. 2007, 2007, P03006. [Google Scholar] [CrossRef]
  52. Rosenberg, E. Maximal entropy coverings and the information dimension of a complex network. Phys. Lett. A 2017, 381, 574–580. [Google Scholar] [CrossRef]
  53. Ramirez-Arellano, A.; Hernández-Simón, L.M.; Bory-Reyes, J. A box-covering Tsallis information dimension and non-extensive property of complex networks. Chaos Solitons Fractals 2020, 132, 109590. [Google Scholar] [CrossRef]
  54. Ramirez-Arellano, A.; Bermúdez-Gómez, S.; Hernández-Simón, L.M.; Bory-Reyes, J. d-summable fractal dimensions of complex networks. Chaos Solitons Fractals 2019, 119, 210–214. [Google Scholar] [CrossRef]
  55. Seber, G.; Wild, C. Nonlinear Regression; Wiley Series in Probability and Statistics; Wiley: Hoboken, NJ, USA, 2003. [Google Scholar]
  56. Rossi, R.A.; Ahmed, N.K. The Network Data Repository with Interactive Graph Analytics and Visualization. In Proceedings of the AAAI, Austin, TX, USA, 25–30 January 2015. [Google Scholar]
  57. Dudley, R.M.; Haughton, D. Information criteria for multiple data sets and restricted parameters. Stat. Sin. 1997, 7, 265–284. [Google Scholar]
  58. Barabási, A.L.; Albert, R. Emergence of scaling in random networks. Science 1999, 286, 509–512. [Google Scholar] [CrossRef] [PubMed]
  59. Song, C.; Havlin, S.; Makse, H.A. Origins of fractality in the growth of complex networks. Nat. Phys. 2006, 2, 275. [Google Scholar] [CrossRef]
  60. Watts, D.J.; Strogatz, S.H. Collective dynamics of ‘small-world’ networks. Nature 1998, 393, 440. [Google Scholar] [CrossRef]
  61. Hall, M.; Frank, E.; Holmes, G.; Pfahringer, B.; Reutemann, P.; Witten, I.H. The WEKA Data Mining Software: An Update. SIGKDD Explor. Newsl. 2009, 11, 10–18. [Google Scholar] [CrossRef]
Figure 1. (a) Box covering of a network and (b) network re-normalization for ε = 2 .
Fractalfract 07 00702 g001
Figure 2. Fit of Equations (10) and (11) of (a) SocfbPrinceton12, (b) E. coli cellular, and (c) Power grid network.
Fractalfract 07 00702 g002
Figure 3. (a) d I and (b) d q . q of BA, SHM, and WS networks. Mann–Whitney U test revealed a significant difference in d q . q for all types of networks. The * symbol indicates no statistical difference between them.
Fractalfract 07 00702 g003
Figure 4. Accuracy (ACC) and Matthew’s correlation coefficient of decision trees built on data sets: (1) d I , (2) d q . q , and (3) d q . q , q, and q .
Fractalfract 07 00702 g004
Table 1. Diameter, number of nodes, source, d I , and d q , q of real-world networks.
NetworkFull NameSourceDiameterNodesEdges
ACFAmerican college football[46]4115613
BCEPGBio-CE-PG[46]8169247,309
BGPBio-grid-plant[46]2612722726
BGWBio-grid-worm[46]1216,259762,774
CENC. elegans neural network[46]52972148
CNCCa-netscience[46]17379914
COLSocfbColgate88[56]63482155,044
DRODrosophilamedulla1[56]6177033,635
DSDolphins social network[46]862159
ECCE. coli cellular network[46]1828596890
EMEmail[46]811335451
IOFInfopenflights[56]14290530,442
JMJazz-musician[46]61982742
JUNJung2015[56]16298931,548
LASLada Adamic’s network[46]83503492
LDULabanderiadunne[56]67006444
MARMarvel[56]1119,36596,616
MITSocfbMIT[56]86402251,230
PAIRPairdoc[56]14891425,514
PGPower grid network[46]4649416594
PGPTechpgp[56]2410,68024,340
POWPowerbcspwr10[56]49530013,571
PRISocfbPrinceton12[56]96575293,307
TCTopology of communications[46]7174557
USAAUSA airport network[46]75002980
WHOTechWHOIS[56]8747656,943
YEASTProtein interaction[46]1122237046
ZCKZachary’s karate club[46]53478
Table 2. The SBICR, d I , d q , q , q, and q values obtained for the information model Equation (10) and the fractional ( q , q ) information model Equation (12).
Network SBICR I SBICR ( q , q ) d I d q , q q q
ACF−10.135−7.3481.9130.9302.9760.442
BCEPG−35.380−20.9881.8281.0046.1091.814
BGP−95.919−95.4421.5911.0373.5580.817
BGW−64.525−42.9271.9491.0062.4371.219
CEN−13.897−12.1031.8220.9883.2530.805
CNC−58.166−49.7471.8351.0143.6060.733
COL−25.187−18.3432.6791.0013.6551.364
DRO−23.34−18.2021.4430.9985.8560.662
DS−17.868−14.6161.4980.9893.9590.788
ECC−87.426−66.7061.6251.0295.0441.442
EM−34.459−31.151.5471.0014.6630.915
IOF−65.328−51.6561.7361.0284.8461.112
JM−19.449−13.5322.8050.9862.6590.726
JUN−63.643−58.5112.4851.0065.951.105
LAS−30.269−21.8982.1031.0203.4590.365
LDU−20.750−20.0911.8500.9982.8790.864
MAR−52.612−46.4281.6441.0033.9760.900
MIT−39.208−25.3512.2951.0064.3531.165
PAIR−68.947−57.0651.5821.0042.7260.670
PG−186.322−199.0491.4630.9995.2211.324
PGP−117.159−100.8271.5731.0132.9301.666
POW−186.721−206.6911.5890.9945.1760.489
PRI−45.866−27.3252.5331.0166.3381.234
TC−22.759−22.0251.570.9915.4941.143
USAA−26.655−18.4971.6780.9962.3580.626
WHO−36.125−29.8731.6751.0024.7511.280
YEAST−48.576−43.6221.5331.0066.5000.594
ZCK−9.77−3.6721.5000.9505.0940.696
Table 3. The nodes (max–min), edges (max–min), d I (max–min), d q , q (max–min), and the percentage of the information model for synthetic networks. I = Equation (10) and q , q = Equation (12).
Network ModelNodesEdges d I d q , q Model
BA2000–45002685–40,4553.930–7.4120.864–1.729 q , q (100%)
SHM10–36,4809–880,4750.831–12.6890.005–2.432 q , q (70.83%)
WS2000–40004000–40,0000.955–7.3630.015–1.540 q , q (100%)
Table 4. The parameters of the SHM model that produced networks for which the information model fit better.
GM IB BB MODE
2200.4001
220.4000.4001
2300.4001
230.400 [ 0 , 1 ] 1
2400.8001
320 [ 0 , 1 ] 1
320.400 [ 0.200 , 0.800 ] 1
33 [ 0 , 0.400 ] ≤0.8001
34011
4 [ 2 , 3 ] 00.4001
220 [ 0 , 0.200 , 0.800 ] 2
220.400 [ 0 , 1 ] 2
221≤0.8002
230≤0.4002
230.4000.2002
320 [ 2 , 0.600 , 1 ] 2
320.4000.8002
3400.4002
420≤0.2002
420.400 [ 0.400 , 0.200 ] 2
4300.8002
Disclaimer/Publisher’s Note: The statements, opinions and data contained in all publications are solely those of the individual author(s) and contributor(s) and not of MDPI and/or the editor(s). MDPI and/or the editor(s) disclaim responsibility for any injury to people or property resulting from any ideas, methods, instructions or products referred to in the content.

