Article

Multifractal Characteristics of China’s Stock Market and Slump’s Fractal Prediction

Business School, China University of Political Science and Law, Beijing 100085, China
Fractal Fract. 2022, 6(9), 499; https://doi.org/10.3390/fractalfract6090499
Submission received: 10 June 2022 / Revised: 21 August 2022 / Accepted: 1 September 2022 / Published: 5 September 2022

Abstract

:
It is necessary to quantitatively describe or illustrate the characteristics of abnormal stock price fluctuations in order to prevent and control financial risks. This paper studies the fractal structure of China’s stock market by calculating the fractal dimension and scaling behavior on the timeline of its eight big slumps, the results show that the slumps have multifractal characteristics, which are correlated with the policy intervention, institutional arrangements, and investors’ rationality. The empirical findings are a perfect match with the anomalous features of the stock prices. The fractal dimensions of the eight stock collapses are between 0.84 and 0.98. The fractal dimension distribution of the slumps is sensitive to market conditions and the active degree of speculative trading. The more mature market conditions and the more risk-averse investors correspond to the higher fractal dimension and the fall which is less deep. Therefore, the fractal characteristics could reflect the evolution characteristics of the stock market and investment philosophy. The parameter set calculated in this paper could be used as an effective tool to foresee the slumps on the horizon.

1. Introduction

An effective way to evaluate and predict financial stability on-time is by studying the characteristics of the stock market and its operation rules. Many empirical studies have proved that the stock market is a complex fractal object [1,2,3,4], its nonlinear evolution and multi-scale characteristics can be described quantitatively using the self-similar behavior analysis method of multi-fractal theory. Many valuable research results have been obtained on the fluctuations of various types of financial markets [5,6,7,8,9]. Many scholars verified that the Chinese stock market has nonlinear multifractal characteristics. Chen et al. constructed an indicator of extremes and predicted the financial extremes from the complex network perspective based on 12 kinds of worldwide stock indices [10]. Zhuang et al. used the Multifractal Detrended Fluctuation Analysis (MF-DFA) method and generalized Hurst exponents to evaluate ten important Chinese sectoral stock indices and revealed that they have different degrees of multifractality [11]. Du and Ning found that the Shanghai stock market has weak multifractal features and there are long-range power-law correlations between the index series [12]. Chen et al. verified the multifractal walk of the Chinese stock market, and established a stock price prediction model combining the wavelet, genetic algorithm, and neural network, according to the local scale characteristics and multi-scale correlation of the multifractal process [13]. Li proposed that the temporal spectrum of the dominant fractal dimension α0 could be used to characterize stock market fluctuations, and that the spectrum parameter set ( α 0 ,   Δ α , B ) could distinguish the bubble from the normal fluctuation status well [14]. Li et al. found the degree of the marketization of the stock market has a significant impact on the multifractal spectrum of the bubbles of the Shanghai Stock Exchange Composite Index (SSECI) [15].
Although multifractality, as a nonlinear method, has been used by many scholars to study high-frequency financial time series to investigate the problems and phenomena which cannot be explained by traditional economic theory, so far, most of the related research remains in the stage of inspecting the multifractal characteristics of financial asset price volatility. To my knowledge, the dynamic mechanism of the formation of such fractal characteristics and scaling behavior has not been explored, and the relations between fractal structure and policy, the stock market institutional arrangement, and investors’ rationality has not been dug into deeply. In recent years, the research on the stock market fractals has almost stopped, and the existing research results have not been effectively applied in the prediction of the stock market crash. The main reason is that the huge fluctuation of the stock market in China is a policy-induced plunge, and institutional arrangements and investors’ rationality also affect stock market volatility, and in turn, affect its multifractal characteristics. Correctly understanding and analyzing the impact of them on stock market fractal characteristics is of great significance to the slump’s early warning. However, as mentioned above, there is still a lack of research in this area, which is the focus of this paper.
The organization of the paper is as follows. Section 2 is devoted to identifying slump episodes and describing the trigger and market conditions of the slumps in China’s stock market. Section 3 gives the calculation results of the multifractal spectrum of the Chinese stock market slumps. Section 4 reveals the correlation between multifractals and policies, market institutional surroundings, and investors’ rationality. Section 5 illustrates the fractal prediction of the stock market slump. Section 6 summarizes the paper’s conclusions.

2. The Eight Slumps of China’s Stock Market and Their Direct Triggers

The Chinese stock market has experienced eight large ups and downs since its opening. Since the trading volume and stock market value of the Shanghai Stock Exchange are much larger than those of the Shenzhen Stock Exchange in the past, the SSECI is used in this paper to represent the trend of the Chinese stock market.
Although there is no numerically specific definition of a stock market slump, the term commonly applies to steep double-digit percentage losses in a stock market index over a period of several days. Here we define a stock market slump as an event when the SSECI declines relative to the historical maximum for more than 25 percent (the 25% was selected as the threshold value mainly because it could well distinguish the eight widely recognized major stock market crashes in China. We have also tried to use other values as the threshold, e.g. 20%, such that three more shocks are also eligible: 1999 (the SSECI index from 1756 points on 30 June 31999 down to 1361 on 4 January 2000), 2018 (from 3587 points on 30 January 2018 to 2440 on 4 January 2019), and 2021 (from 3708 on 21 December 2021 to 3023 on 16 March 2022). However, due to the low steepness of the decline of the three oscillations, the consistency of the variability of the calculated fractal parameters are not obvious, especially for Δα. Therefore, only the results of the eight meltdowns selected using a 25% threshold value are reported here). The beginning of the slump is the date when the SSECI falls below this threshold level. The time of the trough is the date when the SSECI reaches its minimum level during the slump. The time of recovery is the first date when the SSECI reaches 25 percent of the pre-slump maximum level after the slump is triggered. To avoid counting the same slump twice, additional triggers occurring within a slump are considered part of the existing slump, instead of being an indicator of a new slump. The eight slump episodes are identified here by applying an operational version of this criterion to the data of the SSECI, and their specific time, the extent of the fall, and the direct triggers are shown in Table 1.
Table 1 tells us, firstly, that the eight slumps were triggered by different policies, the slumps in 1993, 2001, and 2007 are mainly due to the accelerated expansion of the secondary market, the other five slumps are initially due to the measures to alleviate the market overheating such as raising the deposit reserve ratio, enhancing stamp duty, imposing a limit on the rise and fall of prices, deleveraging, and so on. Secondly, traders’ mentalities are gradually becoming more and more rational and mature from the lack of professional knowledge in the 1990s to the present, and their risk attitudes have changed a lot during this process. Thirdly, the institutional environment of the primary market has been marching on from a government-led to market-oriented system. The approval system for securities issuance has been gradually substituted by an examination registration system.

3. Fractal Characteristics of China’s Stock Market Slumps

Multifractal is a method using a singularity spectrum to quantitatively describe the distribution of the probability on the whole set caused by different local conditions or different levels in the evolution process of the fractals, which is a measure of the degree of irregularity and inhomogeneity of the fractal structure. It can reproduce the financial transactions with drastic fluctuations in the financial market [2], obtain detailed information of the different degrees of volatility of financial asset prices on different time scales [5], provide the probability estimate of market movements, show the nature of market volatility [7], and thus gain a better understanding of the dynamics of the unpredictable financial market. The multifractal spectrum is composed of two relations. One is the power function relationship between the scale T and the subset composed of a series of probabilities μ(T): μ(T) ∝T ∙ α, α is called the singular exponent and reflects the singularity degree of the fractal object. The other is the power function relation between the number of boxes M(T) needed to cover the time series and the scale of T: M(T) ∝T ∙ f(α). Here, f(α) is the multifractal spectrum, which represents the fractal dimension of a subset of the same α value. There are many methods to calculate the fractal dimension, such as the box dimension [16], similarity dimension [17], capacity dimension [18], correlation dimension [19], information dimension [20], perimeter-area dimension [21], etc. The box-counting dimension is one of the most widely used fractal dimension algorithms. This paper will use this method to calculate the fractal dimension and multifractal spectrum.
In order to study the changes in the characteristics of the slumps and their evolution features of the multifractal dimension under different market conditions, we have divided the sample periods in terms of different trading day time scale, i.e., 132, 64, 32, 16, 8, 4, 2, and 1 days, for the eight slumps (in order to show the whole picture of the lnMq(T) and lnT relationship as much as possible, there must be a sufficiently long sample interval. It can be found that the multifractal spectrum calculated using more than 132 trading days has no change in the linear relationship between lnMq(T) and lnT. Therefore, here, the multifractal spectrum of 132 trading data before and after a sharp fall occurred is reported. In this case, T takes 1/132, 1/64, 1/32, 1/16, 1/8, 1/4, 1/2, and 1), and then calculated the multifractal dimension in terms of the distribution characteristics of each scale. The detailed calculation method is exhibited in Appendix A.
For the time series satisfying the multifractal feature, the logarithmic partition function lnMq(T) and the logarithmic time length lnT should have a good linear relationship. Figure 1 shows the lnMq(T) ~ lnT curve clusters with different values of q of the eight slumps. q, a weight factor, denotes the specific gravity of different probability measures for the partition function Mq(T).
It can be seen from Figure 1 that no matter what value q takes, lnMq(T) ~ lnT has a good linear relationship and shows scale invariance when |lnT|< 5. This result is strong evidence of the existence of a multi-scale relationship in the SSECI time series, indicating that the price fluctuation of each scale obeys the multifractal random walk.
Figure 2 gives the generalized correlation dimensions Dq with different values of q.
Figure 2 illustrates that D0 > D1 > D2 >…> D for all eight slumps. It is only if D0 = D1 = D2 =…> D that the fractal is uniform, so the eight slumps all have a multifractal structure. As q increases, Dq decreases. When q > 180, Dq changes very little, so D = D180 is a reasonable consideration.
Singular intensity α and the multifractal spectrum f(α) are calculated according to Formulas (A1)–(A3) in the Appendix A. Figure 3 shows the singular spectrum of each slump.
The value of α is determined by the information radiated from the dynamic process of the normalized SSECI, and the range of its value indicates the size of the distribution range of a singular intensity. The spectrum span of the slumps in 1992, 1993, and 1994 are relatively large, indicating that the amplitude of the SSECI are relatively large at that time. Strong multifractal characteristics mean more obvious nonlinear fluctuations. In addition, the asymmetry of the singular spectrum reflects the variation range of the scale index caused by large or small fluctuations. It can be seen from Figure 3 that the singular spectra of the 1992 and 2007 slumps are symmetric, indicating that the scale range of the long range correlation caused by the small or large fluctuation of the SSECI is constant. For the 2009 and 2015 slumps, the peak of the fractal spectrum is right-biased, and its left end is significantly lower than the right end, so the α ~ f(α) spectrum belongs to the dense distribution of buying power dominated, which means higher normalized prices dominate the multifractal behavior of the SSECI change, and the stock collapse occurs at the time when the SSECI tends to rise. Apart from the 1993, 1994, 1997, and 2001 slumps, the peak of the fractal spectrum is left-biased and the right end is significantly lower than the left end, and the α ~ f(α) spectrum belongs to the sparse distribution of abnormal prices, which means the lower normalized prices dominate the multifractal behavior of the price change, and the stock collapse occurs at the time when the SSECI tends to decline.
For a certain scale, Δα reflects the inhomogeneity degree of the probability distribution measure on the whole fractal structure and the complexity of the process, and reflects the amplitude of fluctuation of the SSECI data. The greater Δα is, the more uneven the uncertainty distribution of the SSECI is, the more violent the data fluctuation is, and the greater vitality the stock market presents. Δf equals the ratio of the number of peak and trough positions of the SSECI under the condition that the scale remains unchanged. Δf > 0 indicates that for each group of data, the number of the SSECI reaching the highest point is more than what it reached at the lowest point. Δf < 0 means that the number of the SSECI that reached the highest point is less than that which it reached at the lowest point. R = (α0 − αmin)/(αmax − α0), which is called the deflection coefficient of the multifractal spectrum and reflects the asymmetry degree of the curves. If R > 1, the vertex of the spectrum is skewed to the right, and a larger R corresponds to a more right-oriented deviation. If R < 1, the vertex of the spectrum deviates to the left, and a smaller R corresponds to a more left-oriented deviation. If R = 1, the spectrum has a symmetric shape. So, the three parameters (R, Δα, and Δf (α)) of the multifractal spectrum can perfectly express the characteristic change of the multifractal spectrum of each stock collapse. Table 2 gives the Δα, Δf, and R obtained from the multifractals of eight stock collapse processes; here, Δα and Δf are equal to the differences between α and f(α) when q is 2 and 180, individually.
As can be seen from Table 2, the values of Δα for the various slumps are different, which indicates that the heterogeneity degree of probability measure distribution on the whole fractal structure and the complexity of the process are also different. The different Δf represents that each slump occurs in a different upward or downward trend of the SSECI.

4. The Impact of Policies, Market Institutional Conditions, and Investors’ Rationality on the Stock Market Multifractals

The ups and downs of China’s stock market are affected seriously by policy intervention, investors’ sentiment, and stock market institutional arrangements. Therefore, its fractal characteristics should also be correlated with them. It can be explored by the comparative analysis of the fractal dimension of the eight slumps which took place under different market conditions.

4.1. The “Stock Market Expansion” Policy Leads to a Smaller Fractal Dimension of the Stock Collapse

As can be seen from Figure 2, the values of fractal dimension D for the eight slumps are between 0.84–0.98. The smaller the D is, the greater the non-uniformity of the spatial distribution of speculative trading behavior is, the stronger the vulnerability of the stock market is, and the deeper the slump declines. The fractal dimension is negatively correlated with the depth of the slump. However, when the speculative trading activities have relatively weak non-uniformity in the market trading space, the D is larger. This is consistent with the eight slumps of the SSECI. For example, the 1992 slump had the smallest fractal dimension, D = 0.8446, and the slump lasted for 5 months, with a maximum decline of 72%; the 2001 slump had the highest fractal dimension, D = 0.9795, and the slump lasted for 48 months, with a maximum decline of 55%, reflecting the fact that the consistency of the former speculative transaction is greater than that of the latter. So, the fractal dimension D could represent the concentration degree of stock market bubbles and speculative trading activities and the consistency degree of stock market trading.
We further observed that the 1993 collapse triggered by the policy of “old eight shares expansion”, the 2001 collapse triggered by the “reduction of state-owned shares”, and the 2007 collapse triggered by the “lifting the ban of the non-tradable shares”, all of which were meant to expand the stock market. However, the other five slumps were triggered by various policies aimed at alleviating the market frenzy, including raising the stamp duty, imposing limits on the rise or fall of stock price, raising the reserve requirement ratio, deleveraging, and so on. It can be found that the market expansion policy as a trigger could makes the collapse more serious under the same fractal dimension, or the fractal dimension value increases under the same crash intensity.
The reason why the market expansion policies as a trigger bring so strong a slump effect is that the price of the new expanded share is usually lower than that of the shares in circulation, but only a small part of the privileged people have the priority to buy it, which provides opportunity for them to cash out at a high margin. Legally speaking, such a share expansion is not in line with the spirit of contract. However, it was once considered to be a financial innovation to serve the state-owned companies’ development in China. So, as soon as the share expansion is announced, the stock prices will go down, reflecting shareholders’ resistance and rebellion to such “innovation”.

4.2. The Mature Market Conditions Reduce the Width of the Fractal Spectrum of the Slump

Figure 3 shows that the Δα values of the collapses in 1993, 1994, and 1997 are larger than those of the last five collapses. The reason for this is because China’s stock market was in the start-up period before 1997, and the stock market lacked unified laws and regulations for stock issuance examination and approval management. After 1997, especially with the promulgation of <the Procedures for Approval of Stock Issuance> by the China Securities Regulatory Commission (CSRC) on 6 March 2000, the institutional arrangement of the securities market gradually advanced from being “government-led” to “market-oriented”.
It can be seen that, compared with immature market conditions, relatively mature market conditions will reduce the range of price fluctuations, and the span of the corresponding slump spectrum is narrower, that is, the Δα value is becoming smaller, indicating that the non-uniformity of the SSECI distribution decline, and the intensity of price fluctuations near the collapse is lower.

4.3. The Investors’ Rationality Affects the Time of Stock Collapse

From Table 2 and Figure 3, for the 1992, 1993, 1994, 1997, and 2001 slumps, R < 1, and the α-f(α) spectra all belong to the sparse type, meaning the selling prices dominate the multifractal behavior of price change, meaning the price has a tendency to go down. Meanwhile, Δf < 0 indicates that the slumps occur at the position where the selling power dominates the stock price movement.
For the collapse in 2007, R > 1, and the α ~ f (α) spectrum belongs to an intensive type, meaning the buying power dominates the multifractal behavior of price change. However, Δf = −0.0001 < 0, indicating that the rising trend of the SSECI is accompanied by local turbulence.
For the slumps in 2009 and 2015, R > 1, the α ~ f(α) spectra belong to the intensive type, indicating that the collapses occur at the position where the buyer power dominates the multifractal behavior of price change, and the stock price tends to rise. Δf > 0 indicates that the slumps occur at the position where the buying power dominates the stock price movement. The larger Δf is, the nearer the SSECI is to peak.
The rationality of investors could be a good reason for explaining the above phenomenon. Stock traders in China exhibit different characteristics in different periods: the first generation of traders (who entered the stock market in the early 1990s) entered the new securities market with some certain blindness, and were attracted only by the myth of making money during the stock market boom. Most of them lacked professional knowledge, and had weak risk awareness. The second generation (who entered the stock market in the early 2000s) mastered some trading techniques, most of them were well-educated and had a certain risk awareness, but still were far from being rational traders. The 3rd generation (who entered the stock market in the second half of the 2000s) were more rational and matured in the investment mentality, and their risk tolerance tended to increase. The fourth generation (who entered the stock market around and after the 2010s), called ultra-sophisticated individualists by some scholars, were highly intelligent, unscrupulous, and manipulated different applications of stock speculation technology in the bull and bear market. Their risk traits: “Be greedy when others are fearful, and be fearful when others are greedy”. They wanted to get high investment returns by leveraging up during the stock market boom, but at the first sign of trouble, they were quick and desperate to get out of the market, even at any cost. This inevitably led to a stampede on the stock market. Such traders would be bound to increase volatility in China’s stock market, and could result in the slump which took place at the position where the buyers’ power still dominated the price movement (Δf > 0).

5. Fractal Prediction of Stock Market Slump

According to the multifractal analysis in section IV, a percussive anomaly characteristic exists before and after the largest volatility of the SSECI: when the large volatility approaches, the opening of the bell-shaped spectrum is obviously widened, its top becomes round, the spectrum tends to be right (or left)-biased, and the right (or left) end of the spectrum is significantly lowed. Just after the biggest fluctuations, the opening of the spectrum will quickly become smaller, and the top of the spectrum will revert back to sharp from smooth.
In order to illustrate clearly how the desired multifractal parameter changes as it approaches the point of crisis, we calculated the eight slumps’ multifractal parameters of crisis phenomena in the moving window mode, when the parameters are calculated for a part of the time series that slides along it with a certain step. Considering that |lnT| < 5 is the fractal scale-free range, we here choose 16 trading days as the window width. Figure 4 shows the temporal spectrum of the multifractal spectrum for eight slumps in nine stages of the SSECI calculated using the method demonstrated in the Appendix A. Stage 5 is the crash period, Stage 4 and 6 are near the crash period, Stage 3 and 7 are before and after the large shock period, Stage 2 and 8 are at the beginning and end of the abnormal fluctuations, and Stage 1 and 9 are the normal periods far from the crash.
As can be seen from Figure 4, the multifractal spectrum curves of the SSECI time series at each stage of the eight slumps are different in shape, and the spectrum parameters change significantly, which indicates that the distribution structure of the SSECI fluctuations is very complex. Comparing the multifractal spectra of the eight slumps at different stages, it can be found that:
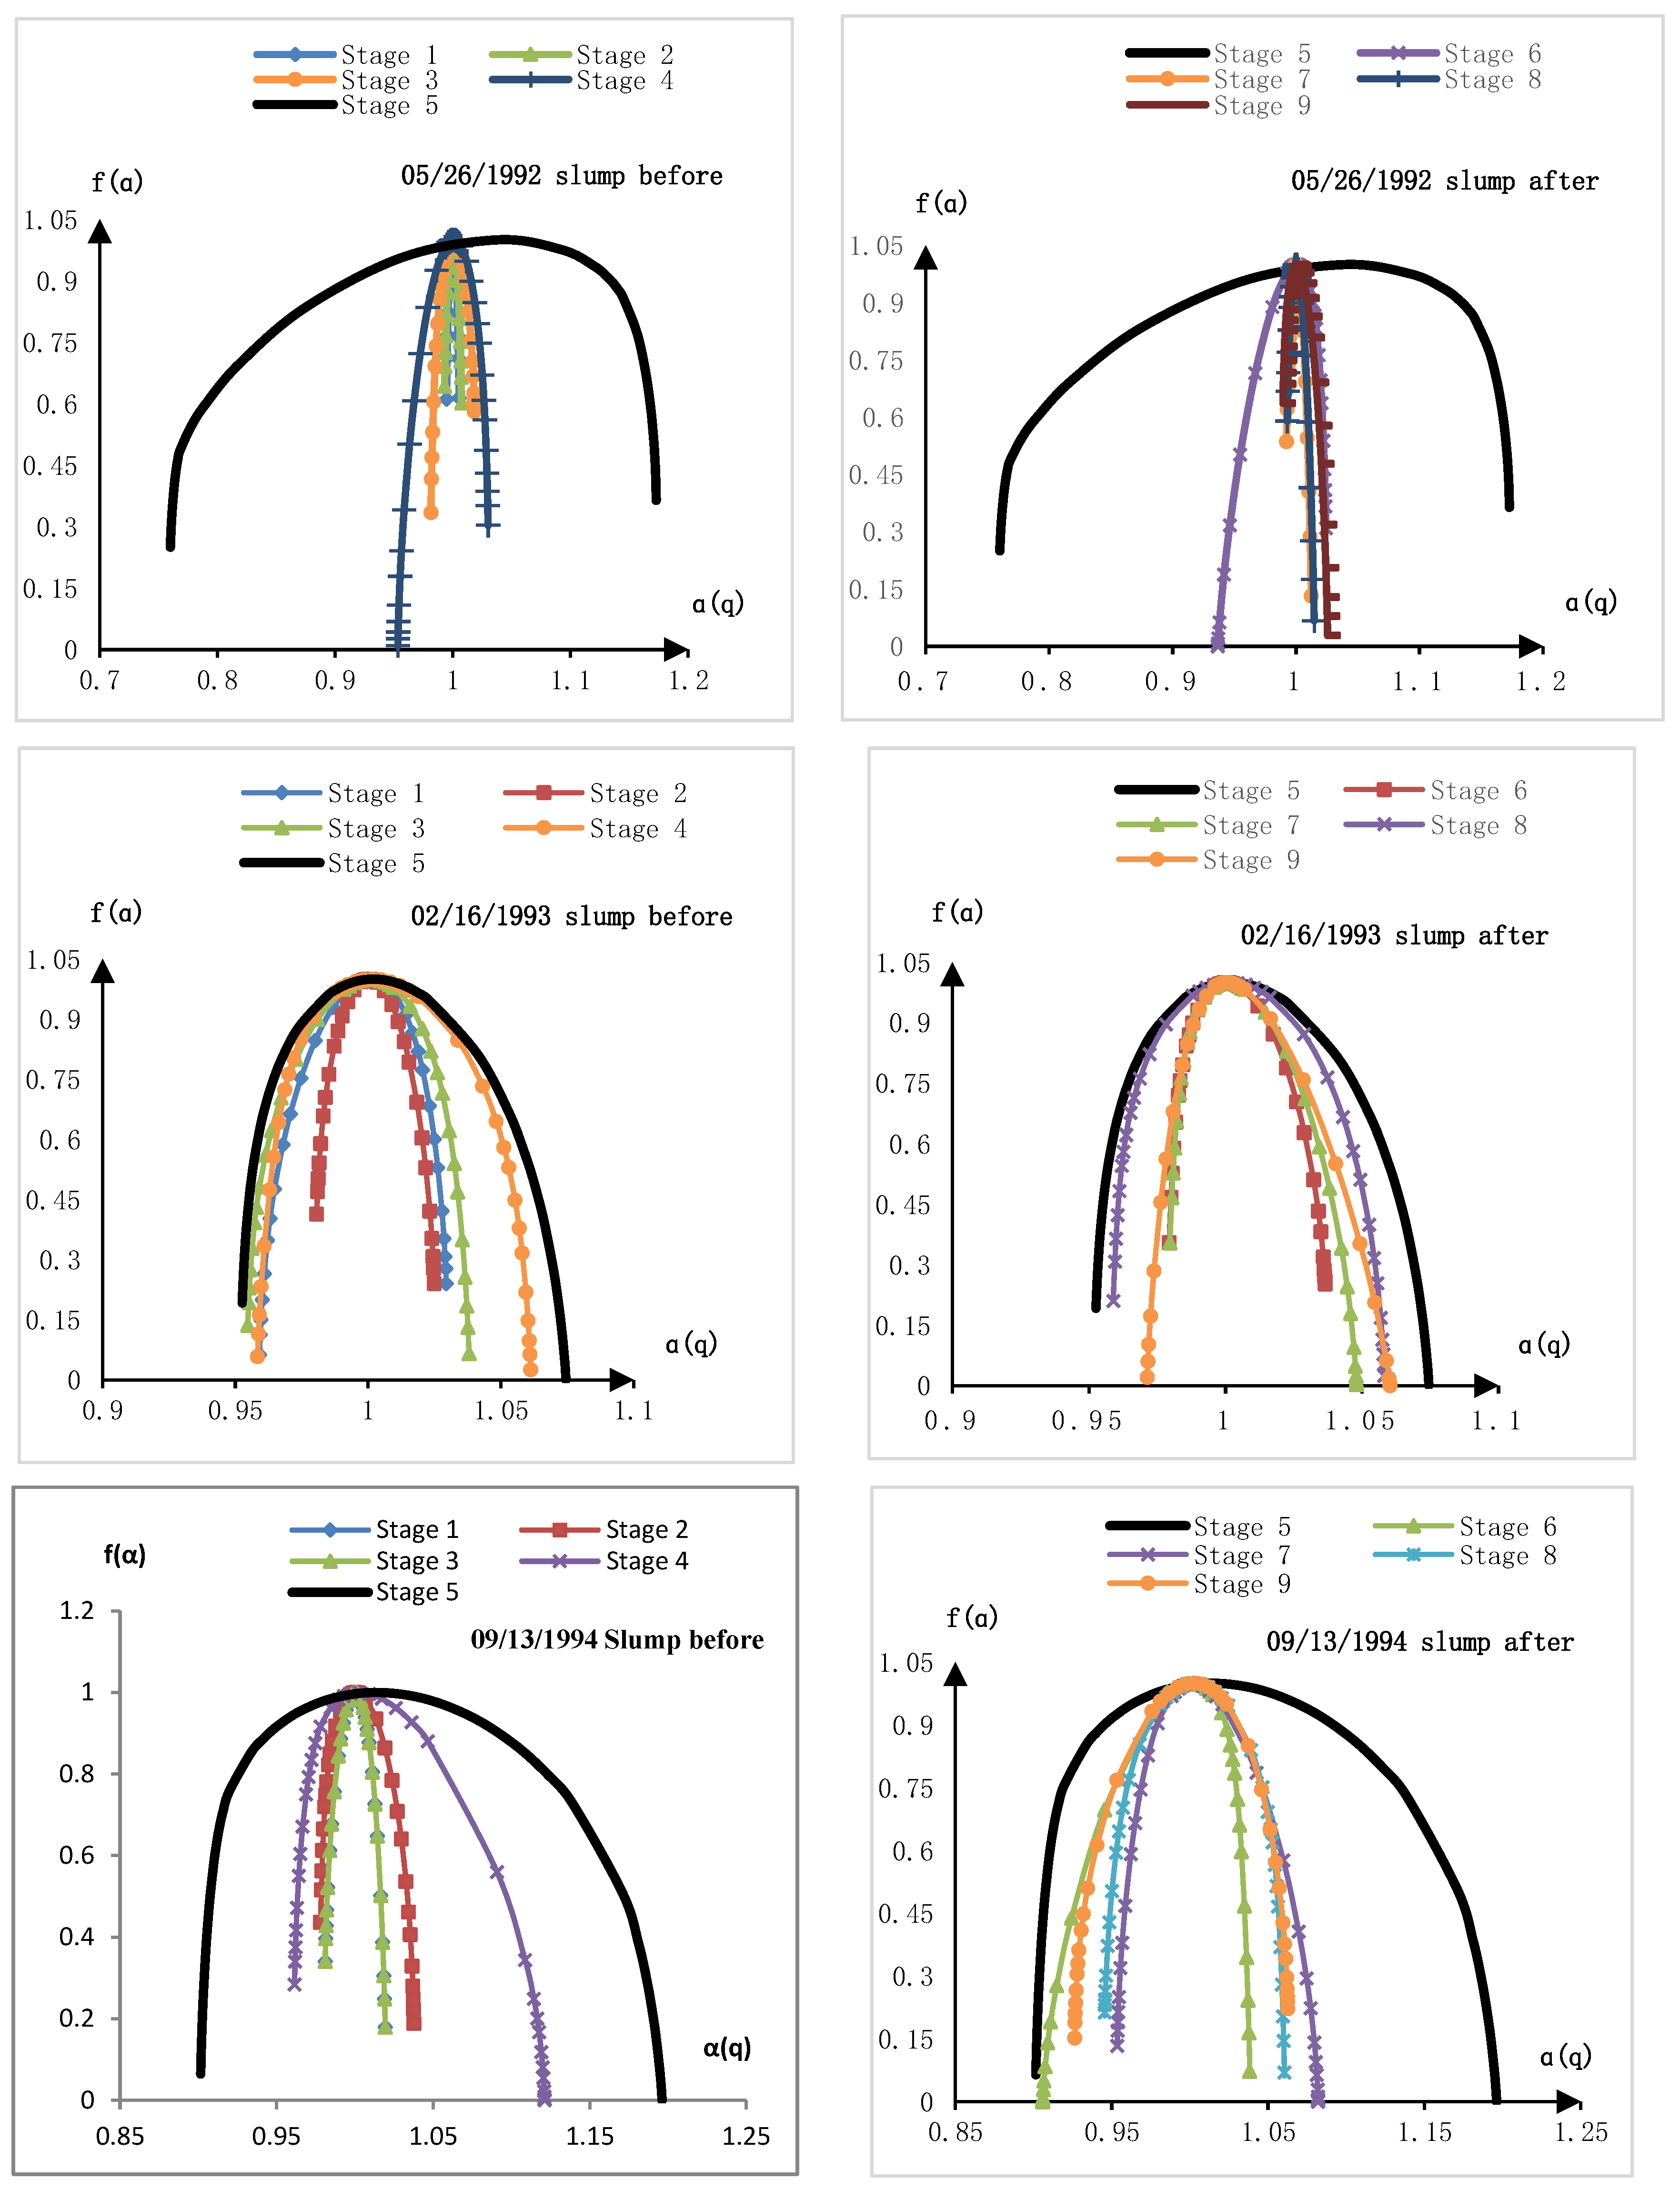
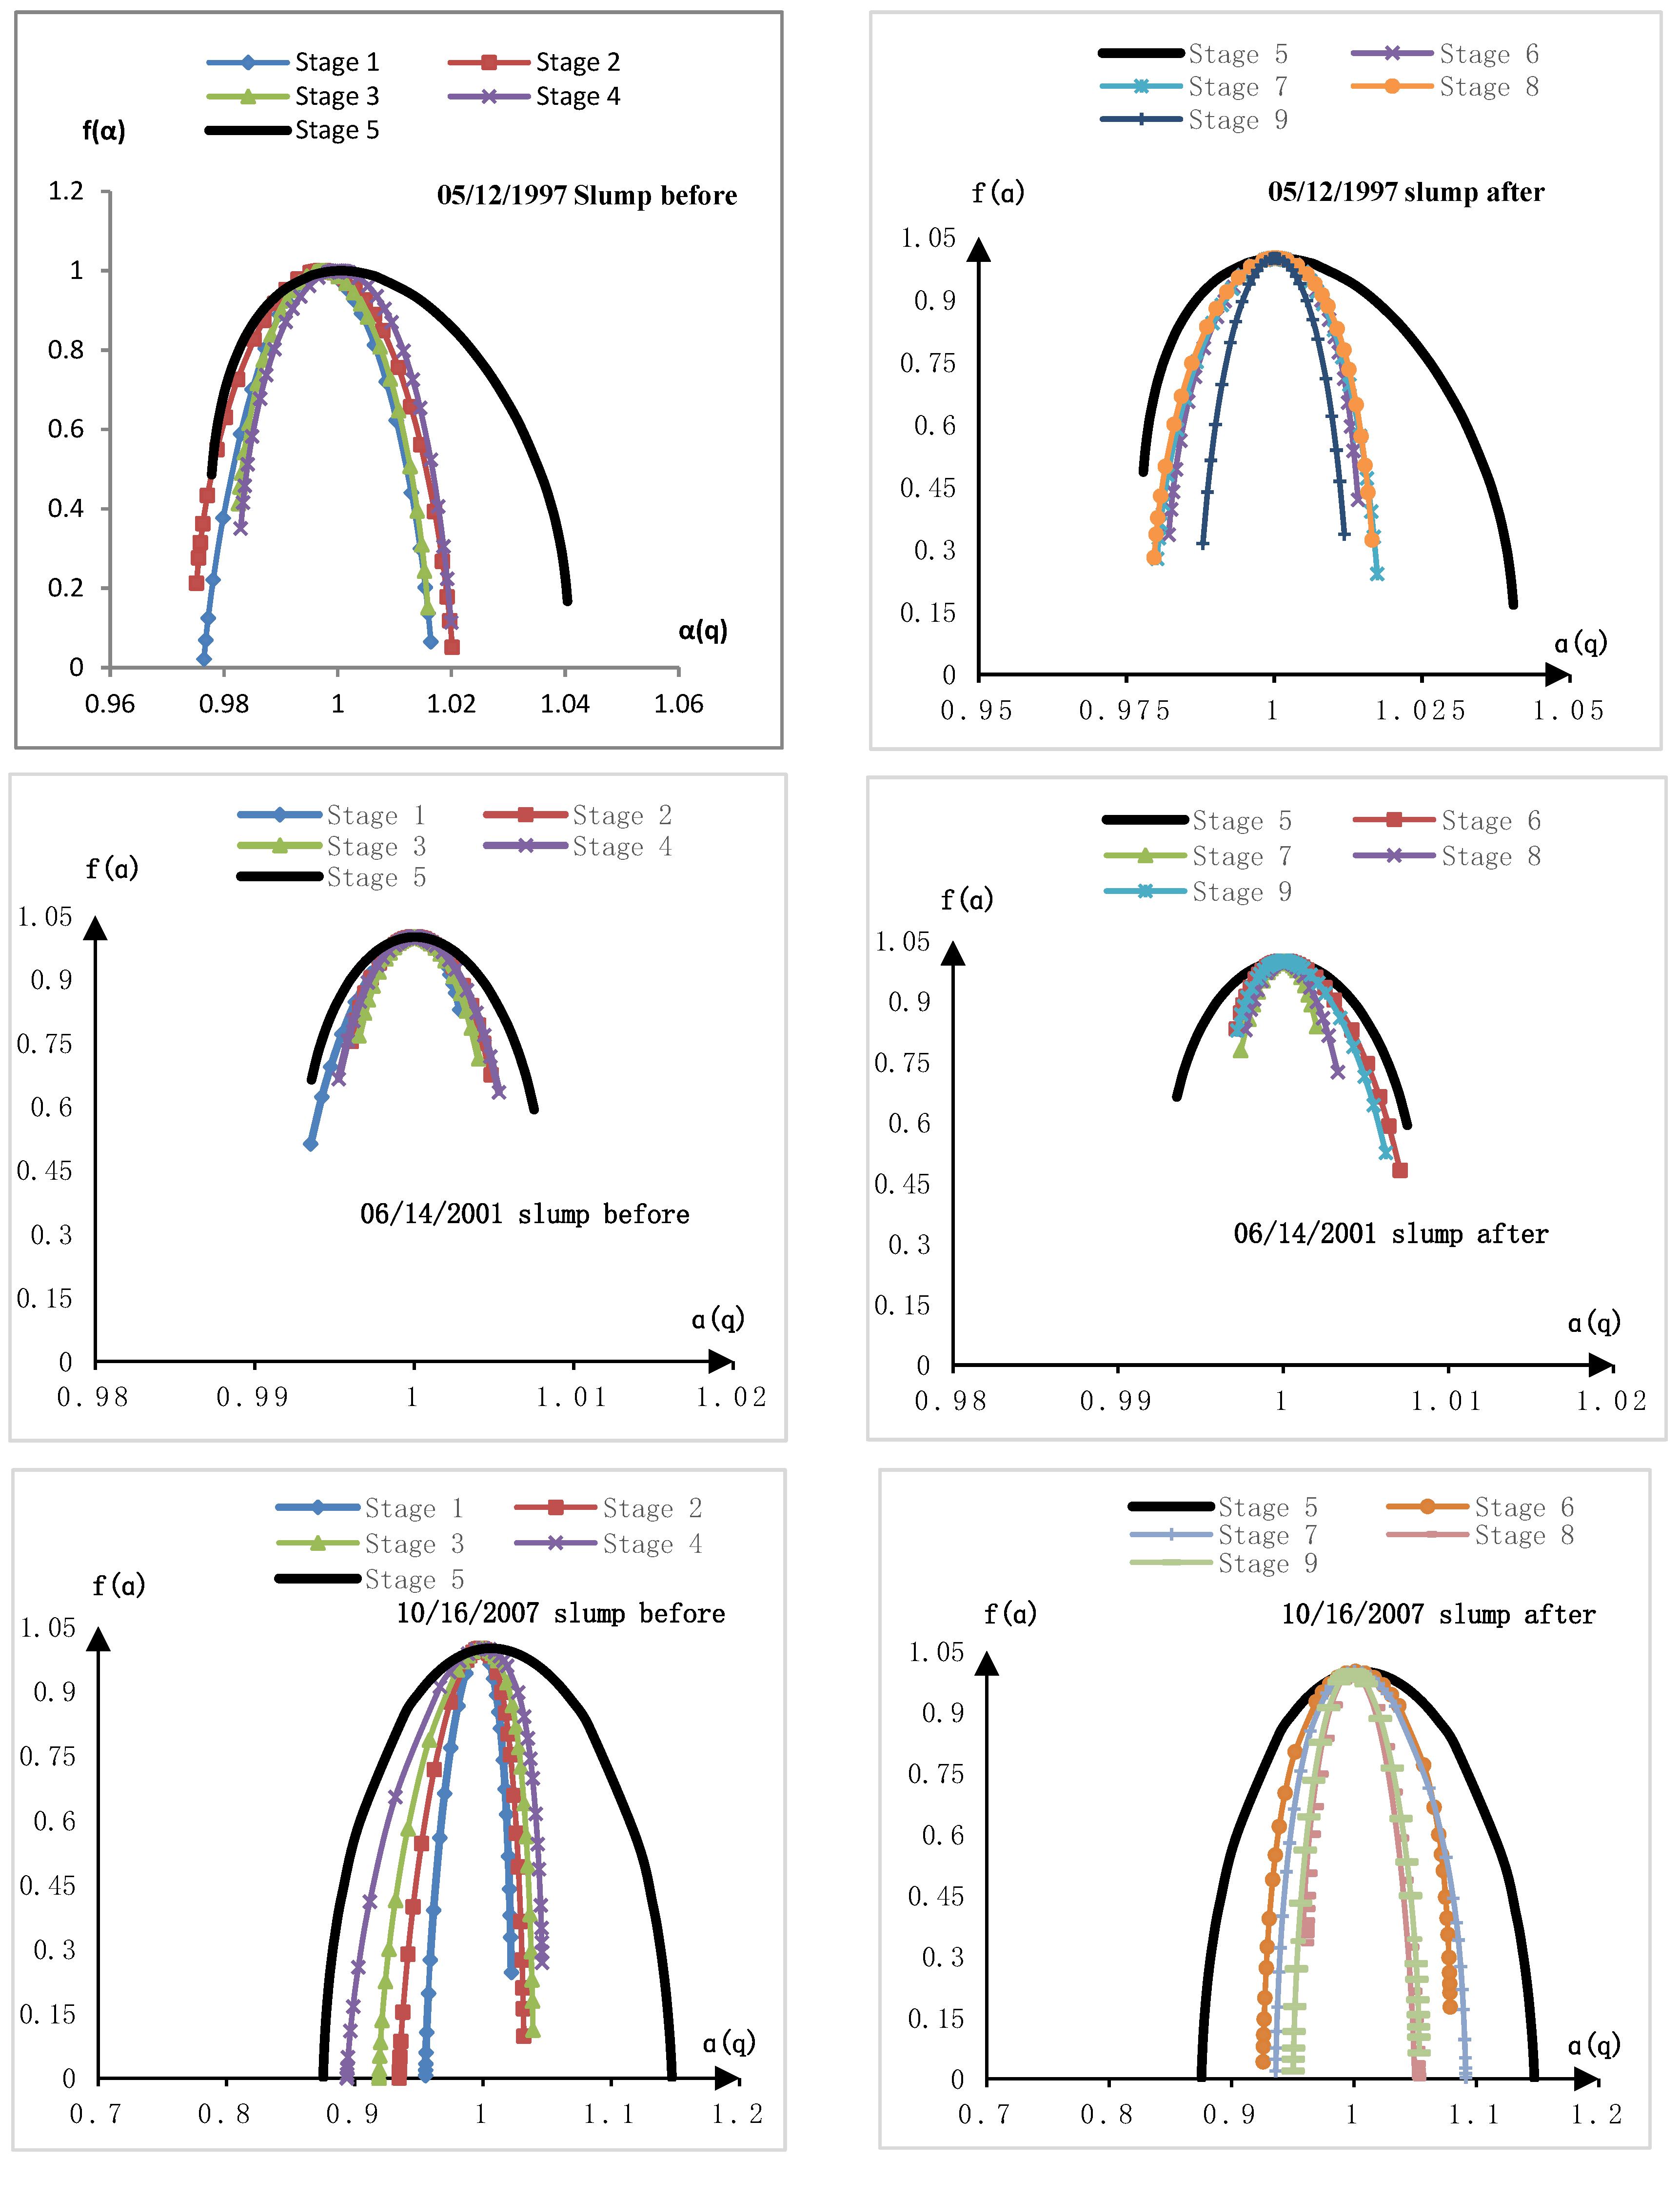
  • When the SSECI fluctuate in a normal state (corresponding to the stage 1 and 2 in Figure 4), the top of the bell-shaped spectrum is relatively sharp, the opening is narrow, and the curve is concentrated in a very small range, which indicates that the stock market is in disorder, and stock price fluctuation is relatively stable.
  • When the SSECI oscillation become larger (corresponding to the stage 3 and unit 4 in Figure 4), the opening of the α ~ f(α) spectrum changes from narrow to wide, the top becomes round from sharp, the span widens significantly, and the left or right endpoints drop. The long-term correlation of the stock market system gradually accumulates under the effect of the cluster effect, and the system approaches the critical state.
  • At the biggest oscillation stage (corresponding to the stage 5 in Figure 4), the opening of the bell-shaped spectrum widens to the maximum and the top becomes the most round and flat. It shows that the stock price fluctuates very violently at this stage, which is caused by the turbulence inside the system.
  • At stage 6 and 7 in Figure 4, the sharp swings tend to abate, the span of the α ~ f(α) spectrum narrows rapidly, and the top becomes slightly round from round. These characteristics suggest that sustained declines have been followed by a rebound in stock prices, accompanied by partial declines.
  • At stage 8 and 9 in Figure 4, a certain period of time has passed after the sharp oscillation, the change of fractal spectra for each slump shows different features. The spectra of the slumps in 2001, 2007, and 2009 are dominated by the sparse type, indicating that stock prices mainly fall after a surge. For other slumps, the spectra have both a sparse and intensive type, indicating that stock prices will rebound to a certain extent after sustained sharp falls. These activities will evolve over time and will not end in a short time.
The alternating expansion and contraction of the multifractal spectrum just shows that the dynamic system of the stock trading is in an extremely unstable state before and after the sharpest fluctuations. As the slump approaches, the span of the α ~ f(α) spectrum gradually widens, the top becomes slightly round from sharp, and the value of f(αmin) (or f(αmax)) drops quickly. When the opening of the spectrum becomes narrower and the top becomes sharper, it indicates the end of abnormal stock price movements. These appearances reflect the changes in the complexity of the fractal structure of the SSECI series, which provide the precursory information with predictive significance for the beginning and end of the stock slump.

6. Conclusions

This paper uses the SSECI daily data to calculate China’s stock market multifractal parameters, and explores the impact of the policy interventions, institutional conditions, and the investors’ characteristics on the fractal parameters. We find that the shape of the multifractal spectrum and the changes of its parameters have certain rules; the policy interventions, market conditions, and investors’ trading features can obviously influence the time and intensity of the collapse. The specific conclusions are as follows:
  • The stock market collapse process has self-similar characteristics in a limited scale, which can be studied and analyzed using multifractal theory;
  • The fractal dimension of stock slumps triggered by the “stock market expansion” policy is smaller than those of stock slumps triggered by measures to alleviate stock market overheating such as raising the reserve ratio and stamp duty, deleveraging, etc., and the non-uniformity of the fractal structure of the former is less than that of the latter.
  • The maturity of market conditions and the institutional arrangement of the stock market affect Δα, which represents the intensity of stock price fluctuations. The larger Δα is, the speedier the stock price rises. The slumps in 1992, 1993, and 1997, with a relatively deeper drop, correspond to the higher Δα values, while the other five stock slumps with a relatively smaller drop correspond to the lower Δα values.
  • The rationality of the traders affects the time of stock collapse. The first five slumps occurred in the status where the seller power dominated the stock price, but the subsequent three slumps happened at the position where the buying power dominated the market prices, which suggests that traders possess “ultra-sophisticated individualists” characteristics. Their foreknowledge of impending risks brings forward the timing of stock crashes and enhances the Δα.
  • The temporal spectrum of the α ~ f(α) fractal spectrum has a good precursor property of collapse. The alternating relaxation and contraction of the multifractal spectrum just shows that the dynamic system of stock prices is in an extremely unstable state before and after the sharpest fluctuations. As it approaches the critical state, the span of the α ~ f(α) spectrum widens quickly, the top becomes round from sharp, and the value of f(αmin) (or f(αmax)) drops sharply. When the opening of the spectrum becomes narrower and the top becomes sharper, it indicates the end of the abnormal stock price movements.
Due to the parameters of the multifractal spectrum being subject to the influence of policy interventions, institutional arrangement, and investors’ rationality, it is necessary to take into account their impact when fractal spectrum parameters are used to guide risk management or to construct risk measure indexes.

Funding

This research was funded by the Scientific Research and Innovation Project of China University of Political Science and Law, grant number 20ZFG79001, and the Humanities and Social Science Foundation of the Ministry of Education of China, grant number project 19YJA790046.

Informed Consent Statement

This research article describing a study do not involve humans.

Data Availability Statement

The SSECI data is at https://www.wind.com.cn/.

Conflicts of Interest

The authors declare no conflict of interest.

Appendix A. The Method of Calculating Multi-Fractal Parameters

Multi-fractal parameters are composed of fractal sets of several sub-fractal dimensions, which involve all of the non-integer fractal dimensions considered. Kantelhardt developed the multifractal detrended volatility analysis (MF-DFA) by extending the one-dimensional detrended volatility analysis (DFA) method [22]. Although some scholars used the MF-DFA method to analyze the financial time series and showed that the Chinese stock market had multifractal characteristics [10,23], Thomas Lux’s research on the New York and German stock markets showed that the MF-DFA method could not diagnose whether multifractals really existed in the financial data [24]. Therefore, we apply the method of multifractal statistical physics here, which is a generalization of the box-counting method and has been used in some of the literature [5,14]. Compared with MF-DFA, the statistical physical method greatly reduces the computational complexity and has a larger scale invariant range for irregular multifractals. Applying the multifractal statistical physics to financial analysis, the steps to solve the multifractal spectrum are as follows:
(1)
To cover the one-dimensional time series by the “box” with the scale of T, that is, divide it into non-overlapping intervals according to the unit time scale T.
(2)
Normalize each data, let probability measures μ i ( T ) = p i p i and Σμi = 1; μi is the sum of the i-th interval data with time scale T and pi is the sum of the stock indices collected in the i-th interval with scale T.
(3)
To calculate the partition function Mq(T) of a multi-fractal system which is defined as the weighted sum of the probability μi(T) to the q power:
M q ( T ) i = 1 n μ i q ( T )
Here, n is the total number of time windows whose time length is T, and q is the real number in (−∞ ~ +∞).
Different q values denote the specific gravity of different probability measures of μi for the partition function Mq(T). When q is positive, the larger q is, the greater weight of the larger value of the probability measure of μi will be. It describes the dense areas. When q is negative, the greater the absolute value of q is, the greater the weight of the smaller value of the probability measure μi will be, which is the sparse area.
For the multi-fractal distribution, the partition function has the following scaling relationship with the time length T:
Mq ( T ) T h ( q )
(4)
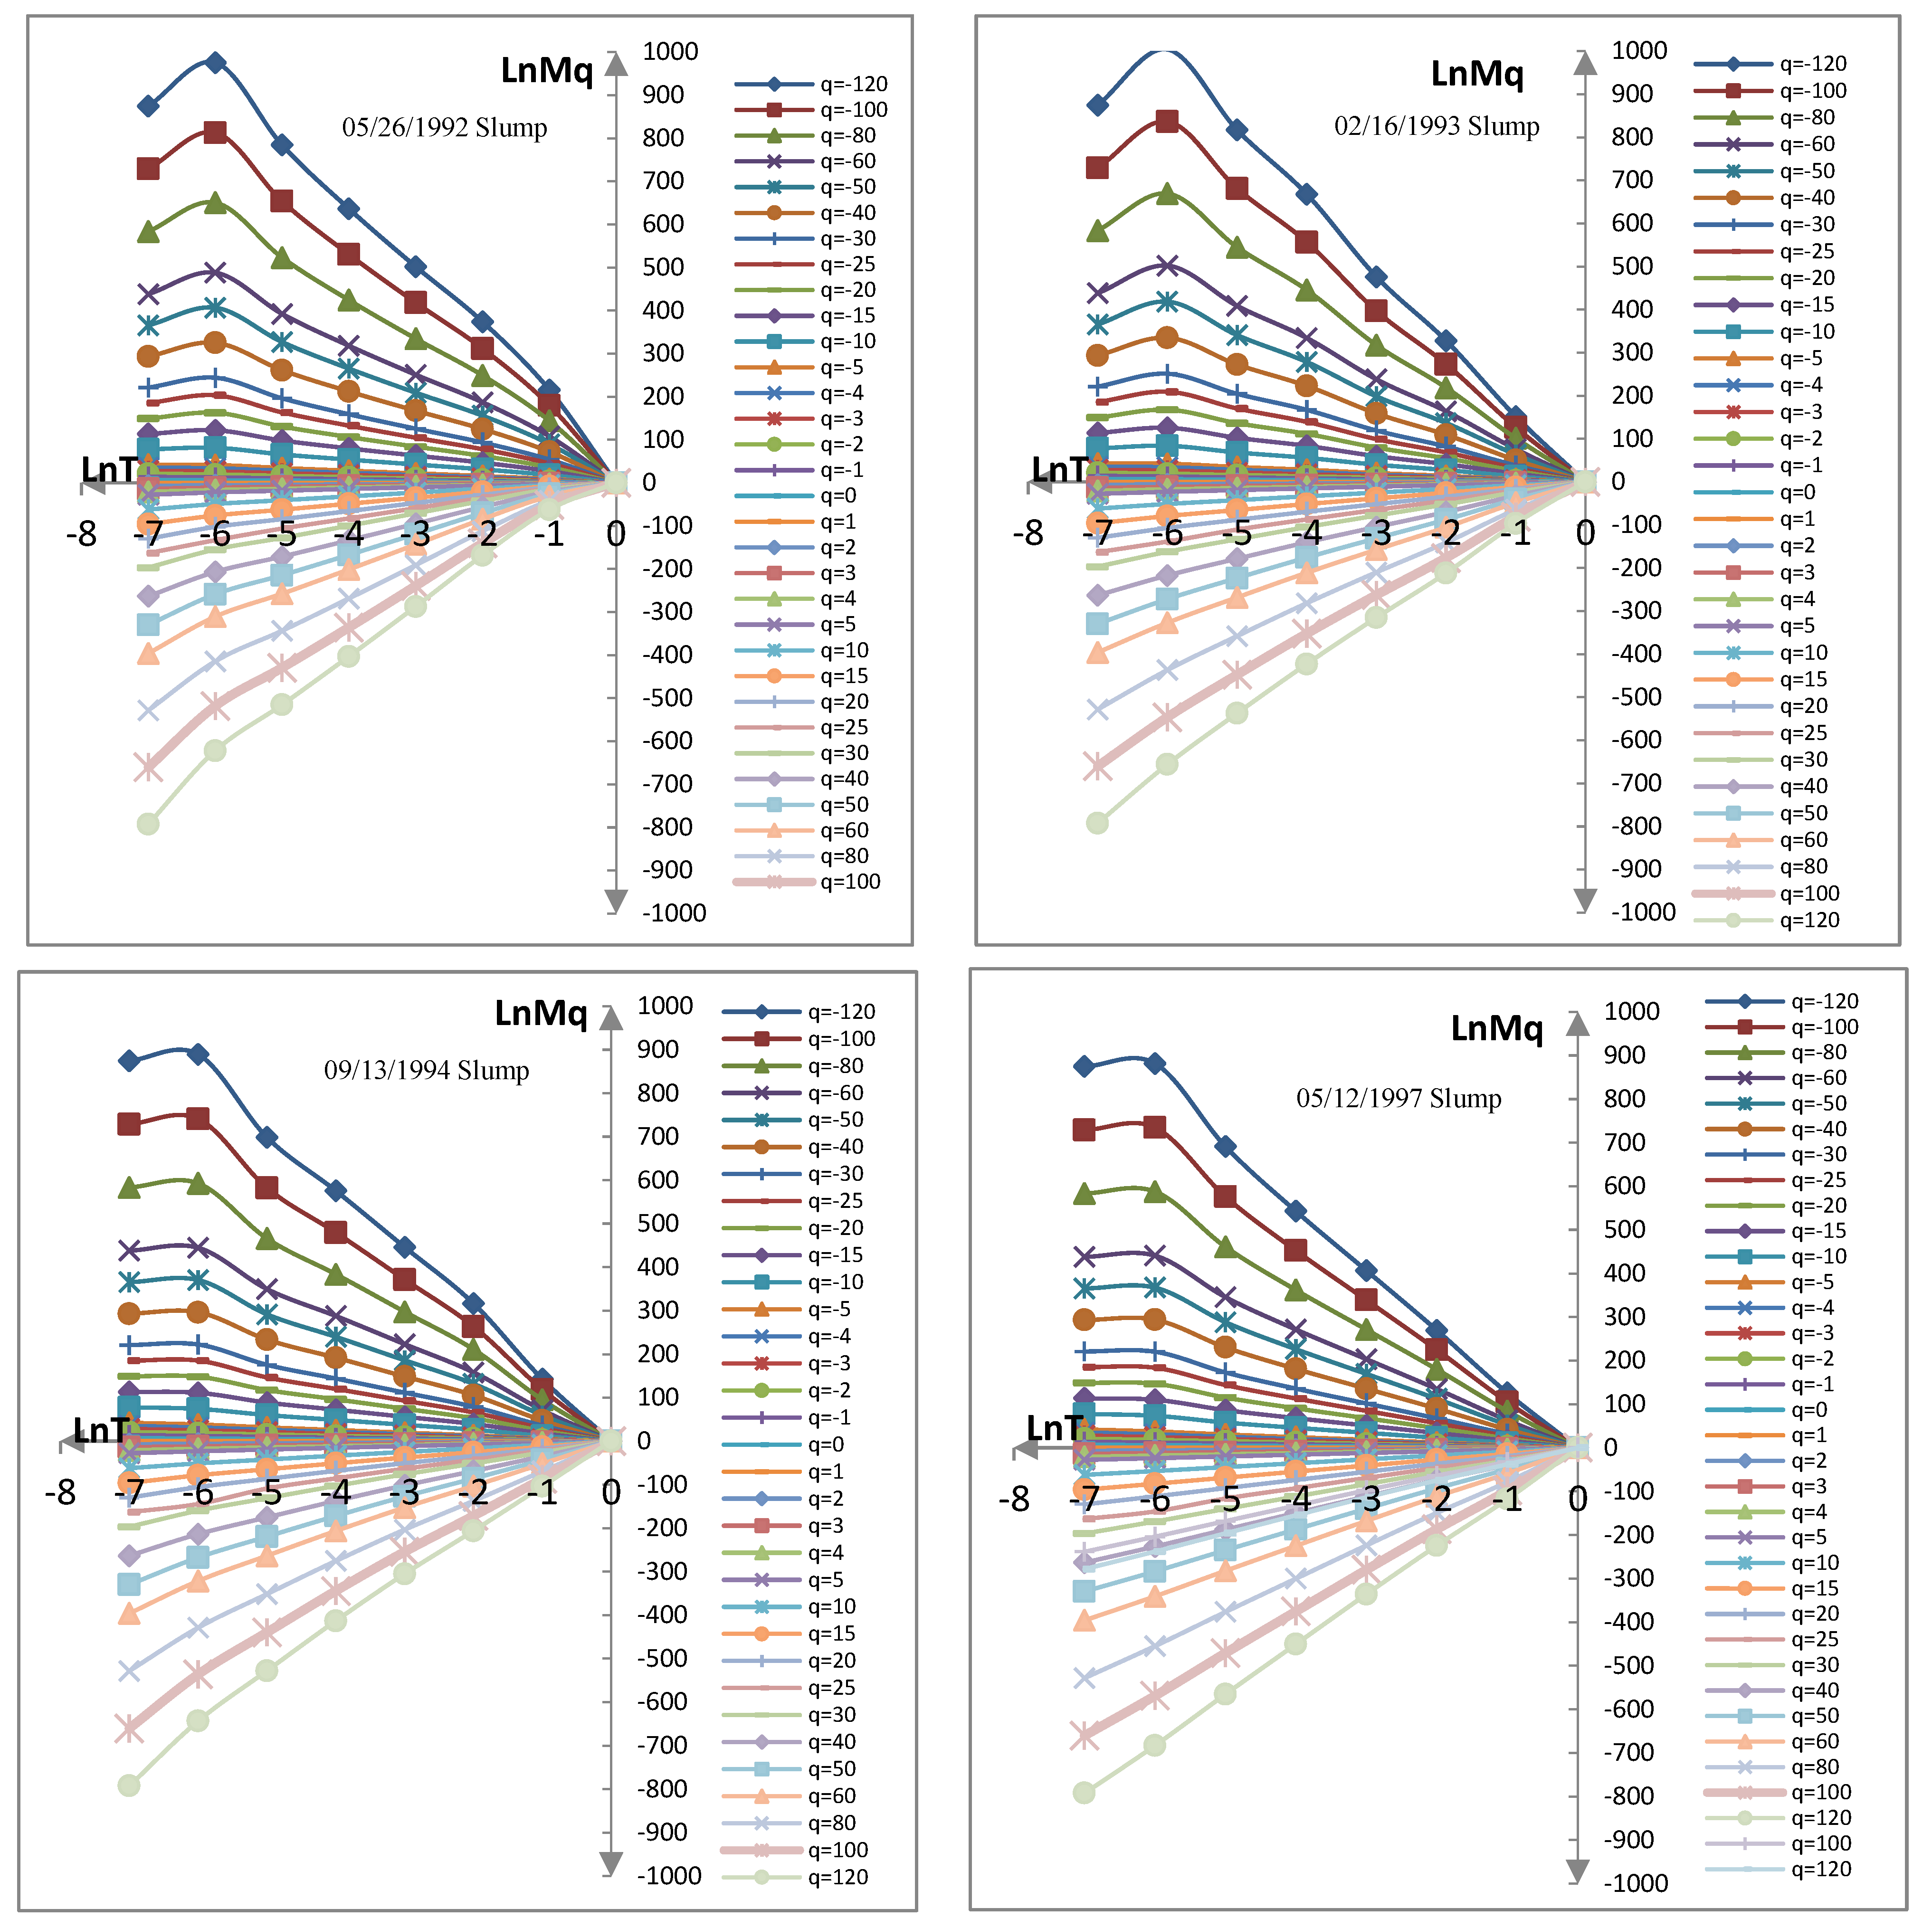
Formula (A2) gives the curve lnMq(T) ~ lnT, if there is a good linear relationship between lnMq(T) and lnT, the distribution belong to a multi-fractal distribution. The slope of the curve h(q) can be estimated by the least square regression of the lnM ~ lnT, fitting to the points in the scale-free interval (namely the linear interval), and lnA is the residual of the regression.
ln ( M q ( T ) ) = h ( q ) lnT + lnA
(5)
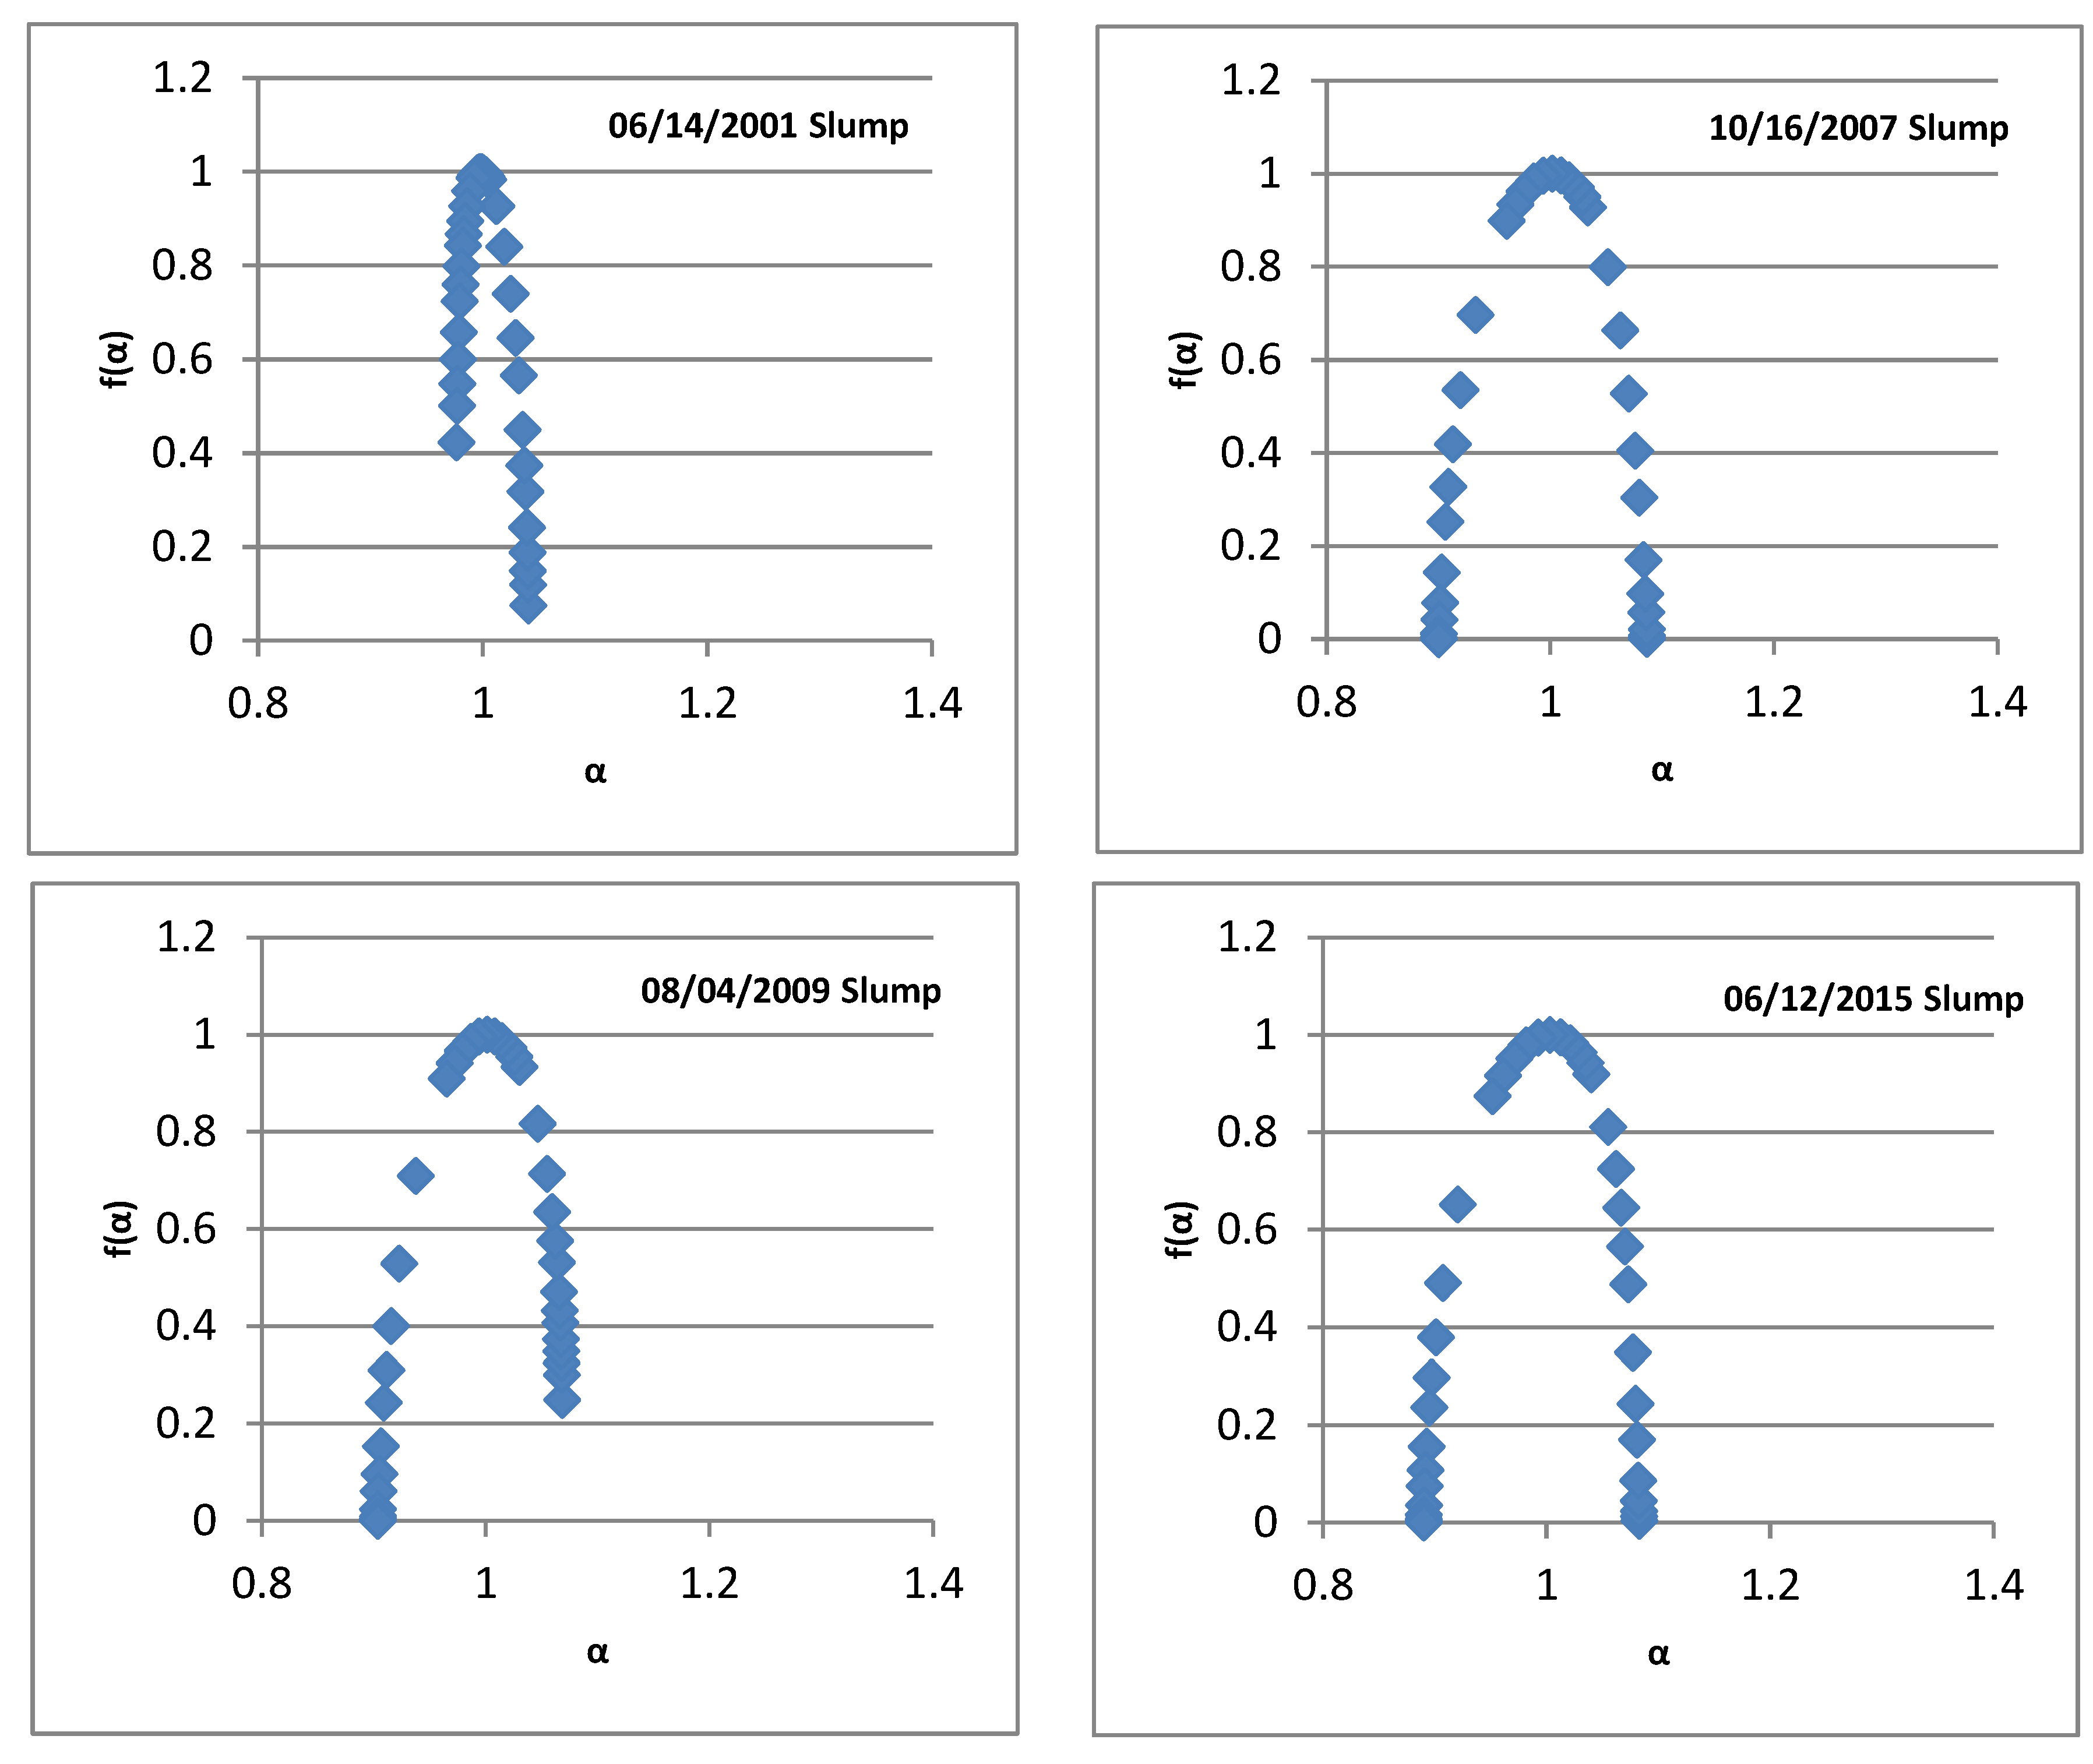
If the time series studied have multi-fractal properties, the following equation can be obtained by using the statistical physics method and Legendre transformation:
τ (q) = qh(q) − 1
α(q) = dτ(q)/dq = h(q) + qdh(q)/dq
∆α = αmax − αmin
f(α) = αq − τ(q) = q(α − h(q)) + 1
∆f = f(αmax) − f(αmin)
D q = τ ( q ) q 1
Here, τ ( q ) stands for the mass index, α(q) is the singular index, f(α) is the multi-fractal spectrum, and Dq is the generalized fractal dimension.

Appendix B. Notes

  • “August 10 incident”: On August 10, Shenzhen, in the fourth “1992 Stock Subscription Warrant” lottery. Five million application forms for the subscription of public offers were issued, and each person could buy 10 application forms with his/her ID card. All the application forms were sold out in less than half a day, but some people could not believe that and doubted about whether backdoor buying existed. That evening, thousands of people who failed to buy the form marched on Shennan Middle Road, carrying slogans of anti-corruption and justice, and sieged the Shenzhen municipal government and the People’s Bank of China. The Shenzhen municipal government spent nearly the whole night coming up with a plan to issue an additional 0.5 million forms for the subscription of new shares, and the matter was put to rest gradually. That is called the “August 10 incident”. It triggered a plunge in the Shanghai and Shenzhen stock markets.
  • “Old eight shares”: From 1990 to 1992, in the initial “experimental phase”, only eight stocks were listed in Shanghai, the so-called “old eight shares”. They are Shanghai Shenhua electrician joint company, Shanghai Yuyuan tourist shopping mall CO, LTD, Shanghai Fila vacuum electronics CO, LTD, Shanghai CO, LTD, Zhejiang phoenix chemical CO, LTD Company, Shanghai Feile Audio CO, LTD, Shanghai Aiyang Electronic Equipment CO, LTD, and Shanghai Yanzhong Industrial CO, LTD.
  • The “327 Treasury bond”: “327” is the code name of the Treasury bond futures contract. It is a 3-year Treasury bond which was issued in 1992 and matured in June 1995. The total amount of the bond issued was 24 billion Yuan. On 23 February 1995, Shanghai Wanguo Securities Company illegally traded 327 contracts, and in the last 8 min of the trading time, a total of 10.56 million selling orders were sold, with a face value of 211.2 billion Yuan of the Treasury bond. In the end, Wanguo lost 1.6 billion Yuan due to government intervention.
  • “The reduction of state-owned shares”: This means that the state transfered the state-owned untradeable shares to other shareholders at the market price so that they could be circulated in the market. Since the number of shares held by the state was so large, even the state was to sell a small portion of its shares, meaning the market supply would suddenly increase and share prices would fall.
  • “Deleveraging”: On 13 June 2015, the China Securities Regulatory Commission (CSRC) issued a statement on Sina Weibo, “Securities companies are prohibited to facilitate over-the-counter capital allocation activities” and strictly investigated the capital allocation, causing the stock market to plunge.
  • “Ultra-sophisticated individualists”: The term “Ultra-sophisticated individualists”, as well as the term “extreme refined individualists”, was first put forward by Professor Qian Liqun of Peking University when he spoke about the talent cultivation of China’s university education. He said “They are highly intelligent, secular, sophisticated, good at performance, know how to cooperate, and are better at using the system to achieve their goals”. Once this concept was put forward, it not only spread widely in the Chinese scholar circle, but also became the truest portrayal for some personal behaviors in real life. Here, it refers to such market traders who make extreme use of all the modern technology, resources, and system defects to maximize their interests. It can be said that this is the root of the over-the-counter stock market allocation system which was played to the extreme in 2015, and also the social root of the slump of the Chinese stock market in 2015.

References

  1. Mandelbrot, B.B. A multifractal walk down wall street. Sci. Am. 1999, 5, 20–23. [Google Scholar] [CrossRef]
  2. Stosic, D.; Stosic, D.; Stosic, T.; Stanley, H.E. Multifractal properties of price change and volume change of stock market indices. Phys. A Stat. Mech. Its Appl. 2015, 428, 46–51. [Google Scholar] [CrossRef]
  3. Andreadis, I.; Serletis, A. Evidence of a random multifractal turbulent structure in the Dow Jones industrial average. Chaos Solitons Fractals 2002, 13, 1309–1315. [Google Scholar] [CrossRef]
  4. Fulco, U.L.; Lyra, M.L.; Petroni, F.; Serva, M.; Viswanathan, G.M. A stochastic model for multifractal behavior of stock prices. Int. J. Mod. Phys. B 2004, 18, 681–689. [Google Scholar] [CrossRef]
  5. Ho, D.S.; Lee, C.K.; Wang, C.C.; Chuang, M. Scaling characteristics in the Taiwan stock market. Phys. A 2004, 332, 448–460. [Google Scholar] [CrossRef]
  6. Cont, R.; Potters, M.; Bouchaud, J.P. Scaling in Stock Market Data: Stable Laws and Beyond; Springer: Berlin/Heidelberg, Germany, 1997; Volume 7, pp. 75–85. [Google Scholar]
  7. Wang, B.H.; Hui, P.M. The distribution and scaling of fluctuations for Hang Seng index in Hong Kong stock market. Eur. Phys. J. B 2001, 20, 573–579. [Google Scholar]
  8. Zhuang, X.T.; Huang, X.Y.; Sha, Y.L. Research on the fractal structure in the Chinese stock market. Phys. A 2004, 333, 293–305. [Google Scholar] [CrossRef]
  9. Sun, X.; Chen, H.; Yuan, Y.; Wu, Z. Predictability of multifractal analysis of Hang Seng stock index in Hong Kong. Phys. A 2001, 301, 473–482. [Google Scholar] [CrossRef]
  10. Chen, D.-R.; Liu, C.; Zhang, Y.-C.; Zhang, Z.-K. Predicting Financial Extremes Based on Weighted Visual Graph of Major Stock Indices. Complexity 2019, 5320686, 1–17. [Google Scholar] [CrossRef]
  11. Zhuang, X.; Wei, Y.; Ma, F. Multifractality, efficiency analysis of Chinese stock market and its cross-correlation with WTI crude oil price. Phys. A Stat. Mech. Its Appl. 2015, 430, 101–113. [Google Scholar] [CrossRef]
  12. Du, G.; Ning, X. Multifractal properties of Chinese stock market in Shanghai. Phys. A Stat. Mech. Its Appl. 2008, 387, 261–269. [Google Scholar] [CrossRef]
  13. Chen, W.; Wei, Y.; Lang, Q.; Lin, Y.; Liu, M. Financial market volatility and contagion effect: A copula–multifractal volatility approach. Phys. A Stat. Mech. Its Appl. 2014, 398, 289–300. [Google Scholar] [CrossRef]
  14. Li, Y.; Vilela, A.; Stanley, H.E. The institutional characteristics of multifractal spectrum of China’s stock market. Phys. A Stat. Mech. Its Appl. 2020, 550, 124129. [Google Scholar] [CrossRef]
  15. Li, Y. Multifractal view on China’s stock market crashes. Phys. A Stat. Mech. Its Appl. 2019, 536, 122591. [Google Scholar] [CrossRef]
  16. Olga, M.; Veronica, N. The use of fractal dimension calculation algorithm. Agents Actions 2007, 25, 234–236. [Google Scholar]
  17. Zhang, H.; Wei, D.; Hu, Y.; Lan, X.; Deng, Y. Modeling the self-similarity in complex networks based on Coulomb’s law. Commun. Nonlinear Sci. Numer. Simul. 2016, 35, 97–104. [Google Scholar] [CrossRef]
  18. Gusso, A.; Mello, L.D. Fractal dimension of basin boundaries calculated using the basin entropy. Chaos Solitons Fractals 2021, 153, 2. [Google Scholar] [CrossRef]
  19. Stelter, P.; Pfingsten, T. Calculation of the fractal dimension via the correlation integral. Chaos Solitons Fractals 1991, 1, 273–280. [Google Scholar] [CrossRef]
  20. Liu, J.; Ding, W.; Dai, J.; Zhao, G.; Sun, Y.; Yang, H. Unreliable determination of fractal characteristics using the capacity dimension and a new method for computing the information dimension. Chaos Solitons Fractals 2018, 113, 16–24. [Google Scholar] [CrossRef]
  21. Imre, A.R. Artificial fractal dimension obtained by using perimeter–area relationship on digitalized images. Appl. Math. Comput. 2006, 173, 443–449. [Google Scholar] [CrossRef]
  22. Kantelhardt, J.W.; Zschiegner, S.A.; Koscielny-Bunde, E.; Havlin, S.; Bunde, A.; Stanley, H.E. Multifractal detrended fluctuation analysis of nonstationary time series. Phys. A Stat. Mech. Its Appl. 2002, 316, 87–114. [Google Scholar] [CrossRef]
  23. Gu, R.; Shao, Y.; Wang, Q. Is the efficiency of stock market correlated with multifractality? An evidence from the Shanghai stock market. Phys. A Stat. Mech. Its Appl. 2013, 392, 361–370. [Google Scholar] [CrossRef]
  24. Lux, T. Detecting multi-fractal properties in asset returns: The failure of the scaling estimator. Econ. Work. Pap. 2003, 15, 481–491. [Google Scholar]
Figure 1. Curves of lnMq(T) vs. ln(T) with different values of q.
Fractalfract 06 00499 g001aFractalfract 06 00499 g001b
Figure 2. Generalized correlation dimensions Dq with different values of q.
Fractalfract 06 00499 g002aFractalfract 06 00499 g002b
Figure 3. The multi-fractal spectra f(α) for the slump records of the SSECI.
Fractalfract 06 00499 g003aFractalfract 06 00499 g003b
Figure 4. The temporal spectrum of the multifractal spectrum for eight slumps.
Fractalfract 06 00499 g004aFractalfract 06 00499 g004bFractalfract 06 00499 g004c
Table 1. Chinese stock market slump samples and their context.
No.Beginning of SlumpPrice Decline to Trough (%)Month to TroughTriggersInvestors’ FeatureMarket Institutional Conditions
126 May 199258.9231. Stamp duty on stock trading increased from 1‰ to 3‰;
2. “August 10 incident” ①.
1. Most investors lacked professional knowledge;
2. Investors had weak risk awareness.
The authoritative approval system was based on quota control in the primary market, the issuing scale of listed companies’ stocks was controlled by authority
216 February 199375.4315“Old eight shares” expansion ②.1. Most investors lacked professional knowledge;
2. Investors had weak risk awareness.
1. The authoritative approval system was based on quota control in the primary market;
2. Financial consolidation for soft landing strategy.
313 September 199451.38161. Chang T + 0 to T + 1;
2. “327 Treasury bond futures incident” ③.
The number of well-educated investors increased who had a certain risk awareness.1. The authoritative approval system was based on quota control in the primary market;
2. The contractionary macroeconomic policies were used to alleviate the inflationary pressure.
412 May 199730.66241. Stamp duty on stock trading increased from 3‰ to 5‰;
2. Limit the price rise and fall within 10%.
Investors’ investment mentality became more and more rational and mature, and their risk tolerance increased.1. The authoritative approval system was based on broker-dealer recommendation in the primary market;
2. The overall outbreak of southeast Asia economic crisis.
514 June 2001 52.18421. The Reduction of State-owned Shares to Raise Social Security Fund in 2001 ④;
2. China officially launched the delisting system in 2001.
Investors’ investment mentality became more and more rational and mature, and their risk tolerance increased.1. The authoritative approval system was based on broker-dealer recommendation in the primary market;
2. The entire world economy has entered a depression cycle;
3.China’s stock market is positioned to serve the financing of state-owned enterprises.
616 October 200770.97111. Monetary policy gradually shifted from “prudent” to “moderately tight”;
2. Stock markets in major economies broke out;
3. Lifting the ban on Non-tradable Shares.
Ultra-sophisticated individualists ⑤.1. The authoritative approval system was based on sponsor recommendation in the primary market;
2. The global financial crisis took place.
74 August 200928.1219The reserve requirement ratio was raised by 1 percentage point.Ultra-sophisticated individualists.1. The authoritative approval system was based on sponsor recommendation in the primary market;
2. The economy was overheating and inflation was rising.
812 June 201544.952“Deleveraging” ⑥.Ultra-sophisticated individualists.1. The primary market adopted administrative ratification system;
2. Policy preferences focused on supporting high-tech equipment manufacturing Internet +, Industry 4.0, state-owned enterprise reform expectations.
Note: A crash is triggered when, relative to the historical maximum, the SSEI declined more than 25 per cent. The end of a trough is the date when the index reached 25 percent of pre-trigger maximum level the first instance after the trigger time. We exclude triggers occurring within six months of the initial trigger time. Source: The materials are collated by author according to the network publications of China Securities Regulatory Commission (CSRC). The annotation in the table could be found at the end of the article.
Table 2. The value of Δα, Δf, and R for the eight slumps.
No.SlumpsαmaxαminΔαα0Rf(αmax)f(αmin)Δf
126 May 19921.27820.84010.43811.04220.85640.01580.0247−0.0089
216 February 19931.34230.88150.46081.01590.411800.0501−0.0501
313 September 19941.19910.86050.33861.00970.787800.0030−0.003
412 May 19971.08340.93960.14380.99980.72050.00070.1013−0.1006
514 June 2001 1.04060.97640.06420.99790.50300.07540.4233−0.3479
616 October 20071.08650.90030.18621.00191.20220.00010.0002−0.0001
74 August 20091.06830.90360.16471.00141.46180.24910.00020.2489
812 June 20151.08280.89000.19281.00291.41460.00330.00050.0028
Note: αmax and αmin are the corresponding values when q = 2 and q = 180. Δα = αmax − αmin; Δf = f(αmax) − f(αmin).
Publisher’s Note: MDPI stays neutral with regard to jurisdictional claims in published maps and institutional affiliations.

