Article

Experimental Investigation of the Relationship between Surface Crack of Concrete Cover and Corrosion Degree of Steel Bar Using Fractal Theory

1
Guangdong Provincial Key Laboratory of Durability for Marine Civil Engineering, Shenzhen University, Shenzhen 518060, China
2
College of Civil and Environmental Engineering, Harbin Institute of Technology, Shenzhen 518055, China
*
Author to whom correspondence should be addressed.
Fractal Fract. 2022, 6(6), 325; https://doi.org/10.3390/fractalfract6060325
Submission received: 6 May 2022 / Revised: 9 June 2022 / Accepted: 10 June 2022 / Published: 12 June 2022

Abstract

:
Conventionally, crack width is used to assess the corrosion level, whereas other important characteristics such as the variation in crack width at different locations on the surface are disregarded. These important characteristics of surface crack can be described comprehensively using the fractal theory to facilitate the assessment of the corrosion level. In this study, the relationship between steel corrosion and the fractal characterization of concrete surface cracking is investigated. Reinforced concrete prisms with steel bars of different diameters and with different corrosion rates were evaluated. High-resolution images of cracks on the surfaces of these specimens were captured and processed to obtain their fractal dimensions. Finally, a relationship between the fractal dimension, steel bar diameter, and the corrosion rate is established. The results show that the fractal dimension is associated closely with the corrosion rate and steel bar diameter. This study provides new ideas for evaluating corroded reinforced concrete structures.

1. Introduction

The deterioration of reinforced concrete (RC) structures is caused by multiple factors, among which the susceptibility of reinforcing steel against corrosion by severe environments is one of the most detrimental factors [1,2]. Steel corrosion damages RC structures in two aspects: First, the effective working area of the steel bars is reduced. Second, as the steel corrodes, the iron in the steel bars is oxidized, thus producing corrosion products that occupy a larger volume than the original material [3]. This volume augmentation induces tensile stress, which results in concrete cracking and even structural failure [4]. The shape and development of corrosion-induced cracks must be considered when evaluating the durability of RC structures. For existing concrete structures, the costs of repairs and maintenance can be reduced significantly if the corrosion behavior of reinforcements is detected timely, followed by the implementation of appropriate repair measures [2].
Currently, the methods for detecting the corrosion behavior of steel bars in RC structures can be classified into destructive testing and non-destructive testing (NDT) [1,2,5,6]. Destructive testing can be performed indoors and is the most reliable reference method, although extremely time-consuming. NDT methods are primarily classified into three categories: physical, electrochemical [5,7], and empirical methods. In the physical method, the corrosion behavior of steel bars is primarily evaluated by measuring the variation in their physical properties due to steel corrosion, such as resistance, heat conduction, or sound wave propagation, whereas in the electrochemical methods, the correlation between electrical and chemical effects are considered. An electrochemical system measures the potential and current of oxidation as well as reduction reactions [7]. The empirical method evaluates the corrosion behavior of steel bars based on the measured values of the steel bar, the thickness of the concrete cover, concrete strength, the invasive depth of harmful ions and their content, and the crack width. Among these characteristics, the average width of corrosion-induced cracks on the surface of the concrete is the most important factor for evaluating the corrosion behavior of RC structures [8,9,10]. Meanwhile, three other important morphological characteristics of corrosion-induced cracks, which are associated closely with the corrosion rate of steel bars, are disregarded. The three characteristics are as follows: (1) variations in the crack width at different positions; (2) the irregular shapes of corrosion-induced cracks; (3) the appearance of secondary cracks.
Therefore, a more accurate damage assessment of corroded and deteriorated RC structures must be established. Since corrosion-induced cracks are the most intuitive and accessible phenomenon associated with steel corrosion, the shape of cracks and their development must be described accurately and comprehensively to establish a relationship between the morphological characteristics of corrosion-induced cracks and the corrosion rate of steel bars. Defining this relationship can provide a simpler and more accurate NDT method for evaluating the corrosion level of steel bars in RC structures. Using fractal theory, which can describe the complexity of randomly shaped objects [11,12,13], the main morphological characteristics of corrosion-induced cracks can be described.
In 1975, Mandelbrot [11,12] proposed the concept of fractal geometry known as “the geometry of nature.” Fractal theory was applied to address irregular shapes and it was widely used in the field of civil engineering hitherto. Fractal theory is typically applied to describe three types of contents: First, it is applied to describe the geometry form of a component in concrete, such as aggregates [14,15] and pores [16,17,18], different types of soils [15,19,20] and cement [21,22], dam soil deposits [15], and loess plateau soils [19,20]. Second, it is applied to describe fractured surfaces [23,24,25], which can then be used to analyze the characteristics of the fractured surface and establish a relationship between the fractal dimension of the fractured surface and the fracture energy. Third, it is applied for identifying the damages or locations of structural cracks [26,27,28] that progress from stress–strain locations, as well as for non-destructive evaluations.
To enrich the literature, an explicit relationship between the fractal dimension of a surface crack and the corrosion rate of a steel bar was derived as follows: First, 76 RC prisms with three different diameters of steel bar and seven corrosion rates were cast, and the high-resolution images of the specimens’ surface cracks were captured. Subsequently, the images were binarized using MATLAB software, and the corrosion-induced cracks were characterized based on fractal theory. The results show that the corrosion-induced cracks on the surface of the specimens exhibited clear fractal characteristics. Finally, based on the fractal characteristics of the corrosion-induced cracks, an empirical relationship involving the fractal dimension of the crack, the corrosion rate, and the steel bar diameter was established.

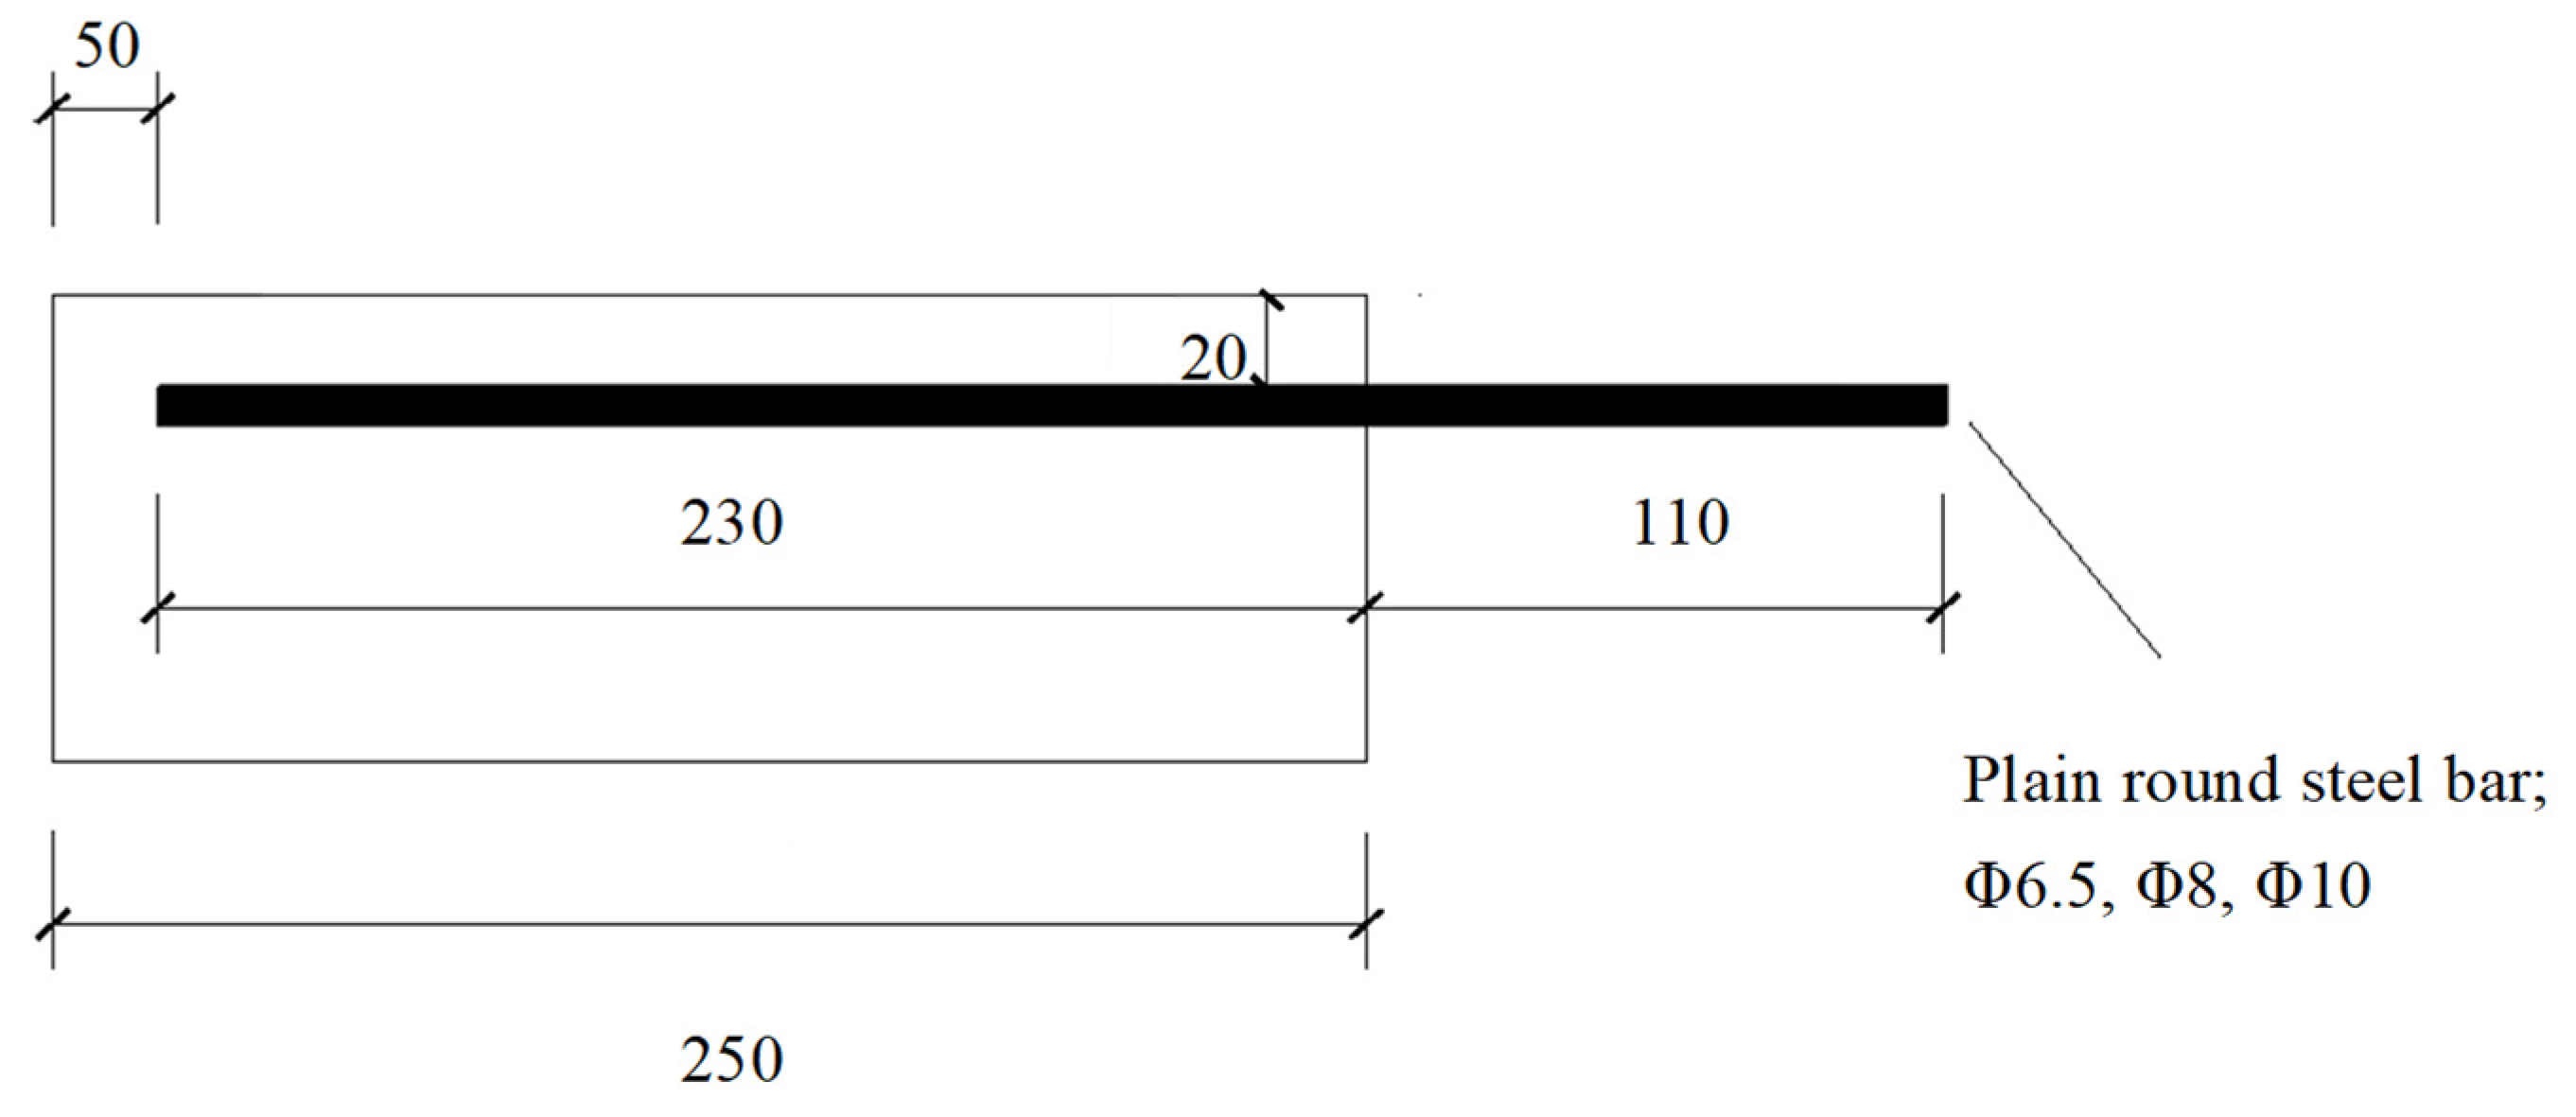
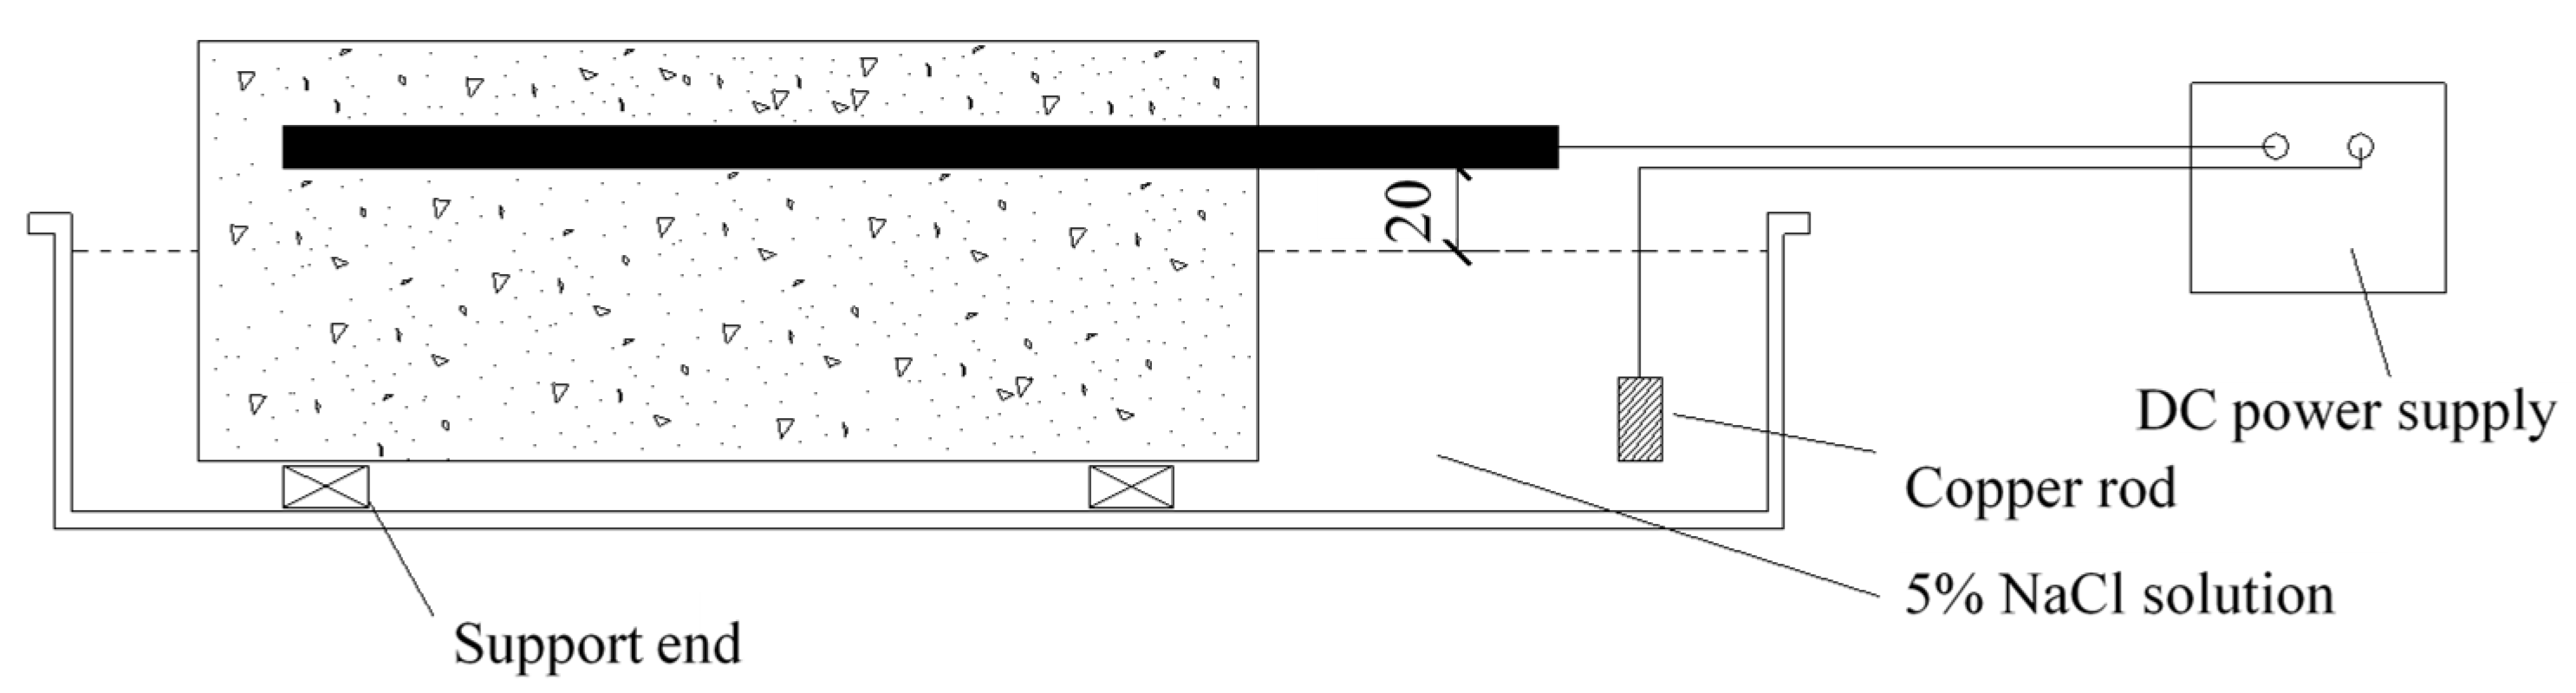
2. Experimental Program
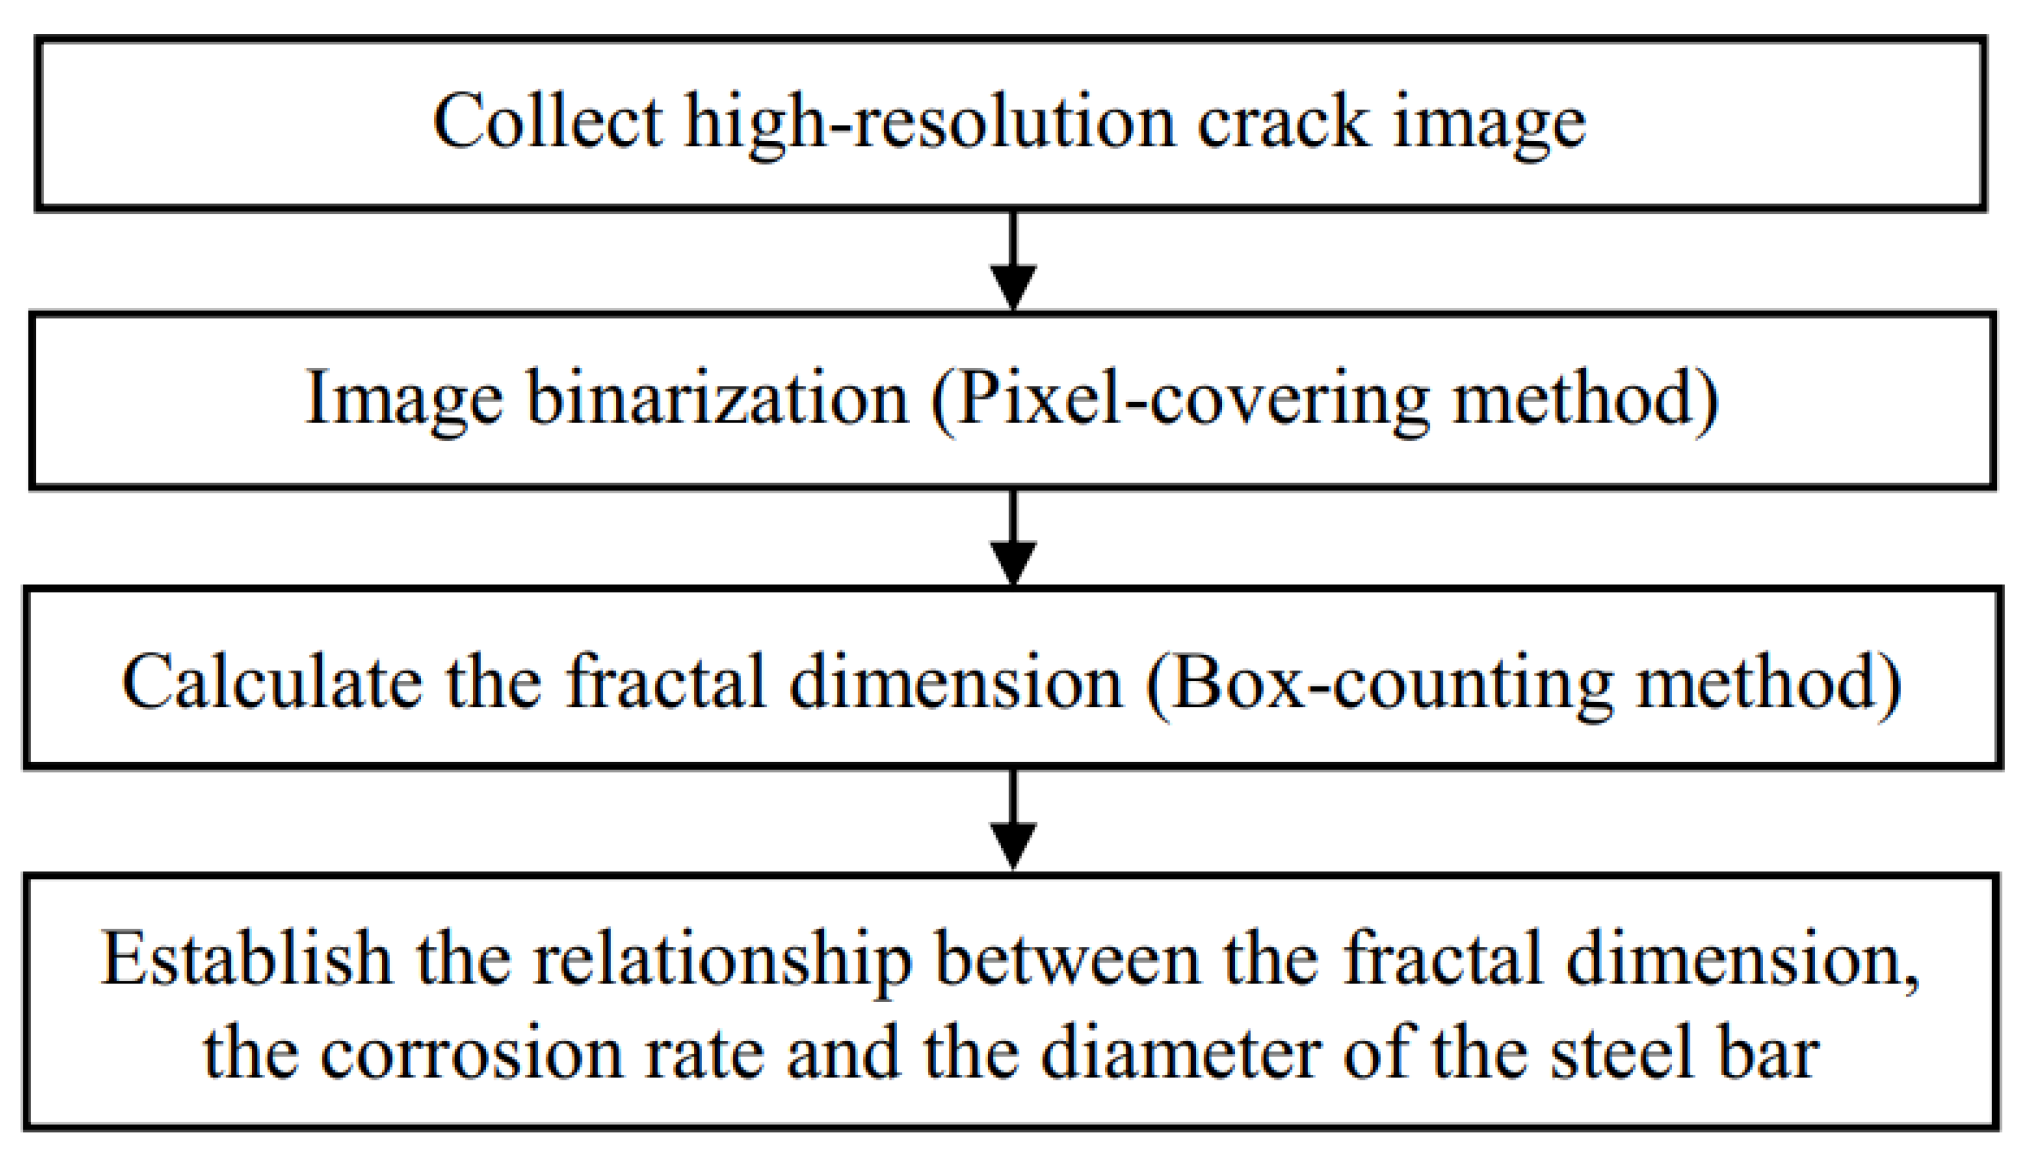
The 76 RC prisms were cast in concrete with an average compressive strength of 46.60 MPa, and the cross-sectional dimensions of the specimens were 100 mm × 100 mm × 250 mm. Three types of HPB300 reinforcements with different diameters (6.5, 8, and 10 mm) were used, and the basic properties of HPB300 are listed in Table 1. The total length of the reinforcement was 450 mm, with an embedded length of 340 mm. The concrete cover thickness was set at 20 mm in accordance with the Chinese Code for Design of Concrete Structures (GB50010-2015) [29]. Moreover, the steel bars were corroded via the electrical accelerating method based on seven corrosion rates: 0%, 5%, 10%, 15%, 20%, 25%, and 30%. The geometry of the specimens is shown in Figure 1. The description of the specimens, the relevant parameters, and the test results are shown in Table 2. The letters of the specimen label in Table 2 indicate the theoretical corrosion rate, A–G represent the theoretical corrosion rate of the reinforcement from 0–30%, the number after the theoretical corrosion rate represents the diameter of the reinforcement inside the specimen, and “number” in the subsequent introduction denotes the serial numbers of the specimens in the same group of tests. More details regarding the material proprieties and the bonding performance of fiber-reinforced polymer-to-concrete joints under the effect of corrosion cracking are available in [30].
The steel bars in actual structures are not completely immersed in a salt solution. To ensure that the electrolyte solution is in sufficient contact with the steel bars’ surface, the semi-immersion method was used in this study because the steel bar corrosion based on this method closely emulates the scenario in a natural environment [31]. As shown in Figure 2, the concrete specimens were semi-immersed in a 5% NaCl solution. To ensure that the electrolyte infiltrated the steel bar through the capillary action of the pores inside the concrete, the distance between the lower surface of the steel bar in the concrete specimen and the upper surface of the solution was set as 20 mm. The current density was set as 0.2 mA/cm2 in this test, based on the protocol established by Maaddawy and Soudki [32].

3. Methodology

Fractal dimension reflects the effectiveness of a space occupied by complex shapes, and it is a measure of the irregularity of complex shapes. Investigations related to fractal theory typically involve two methodologies, which are briefly introduced in the following subsections.

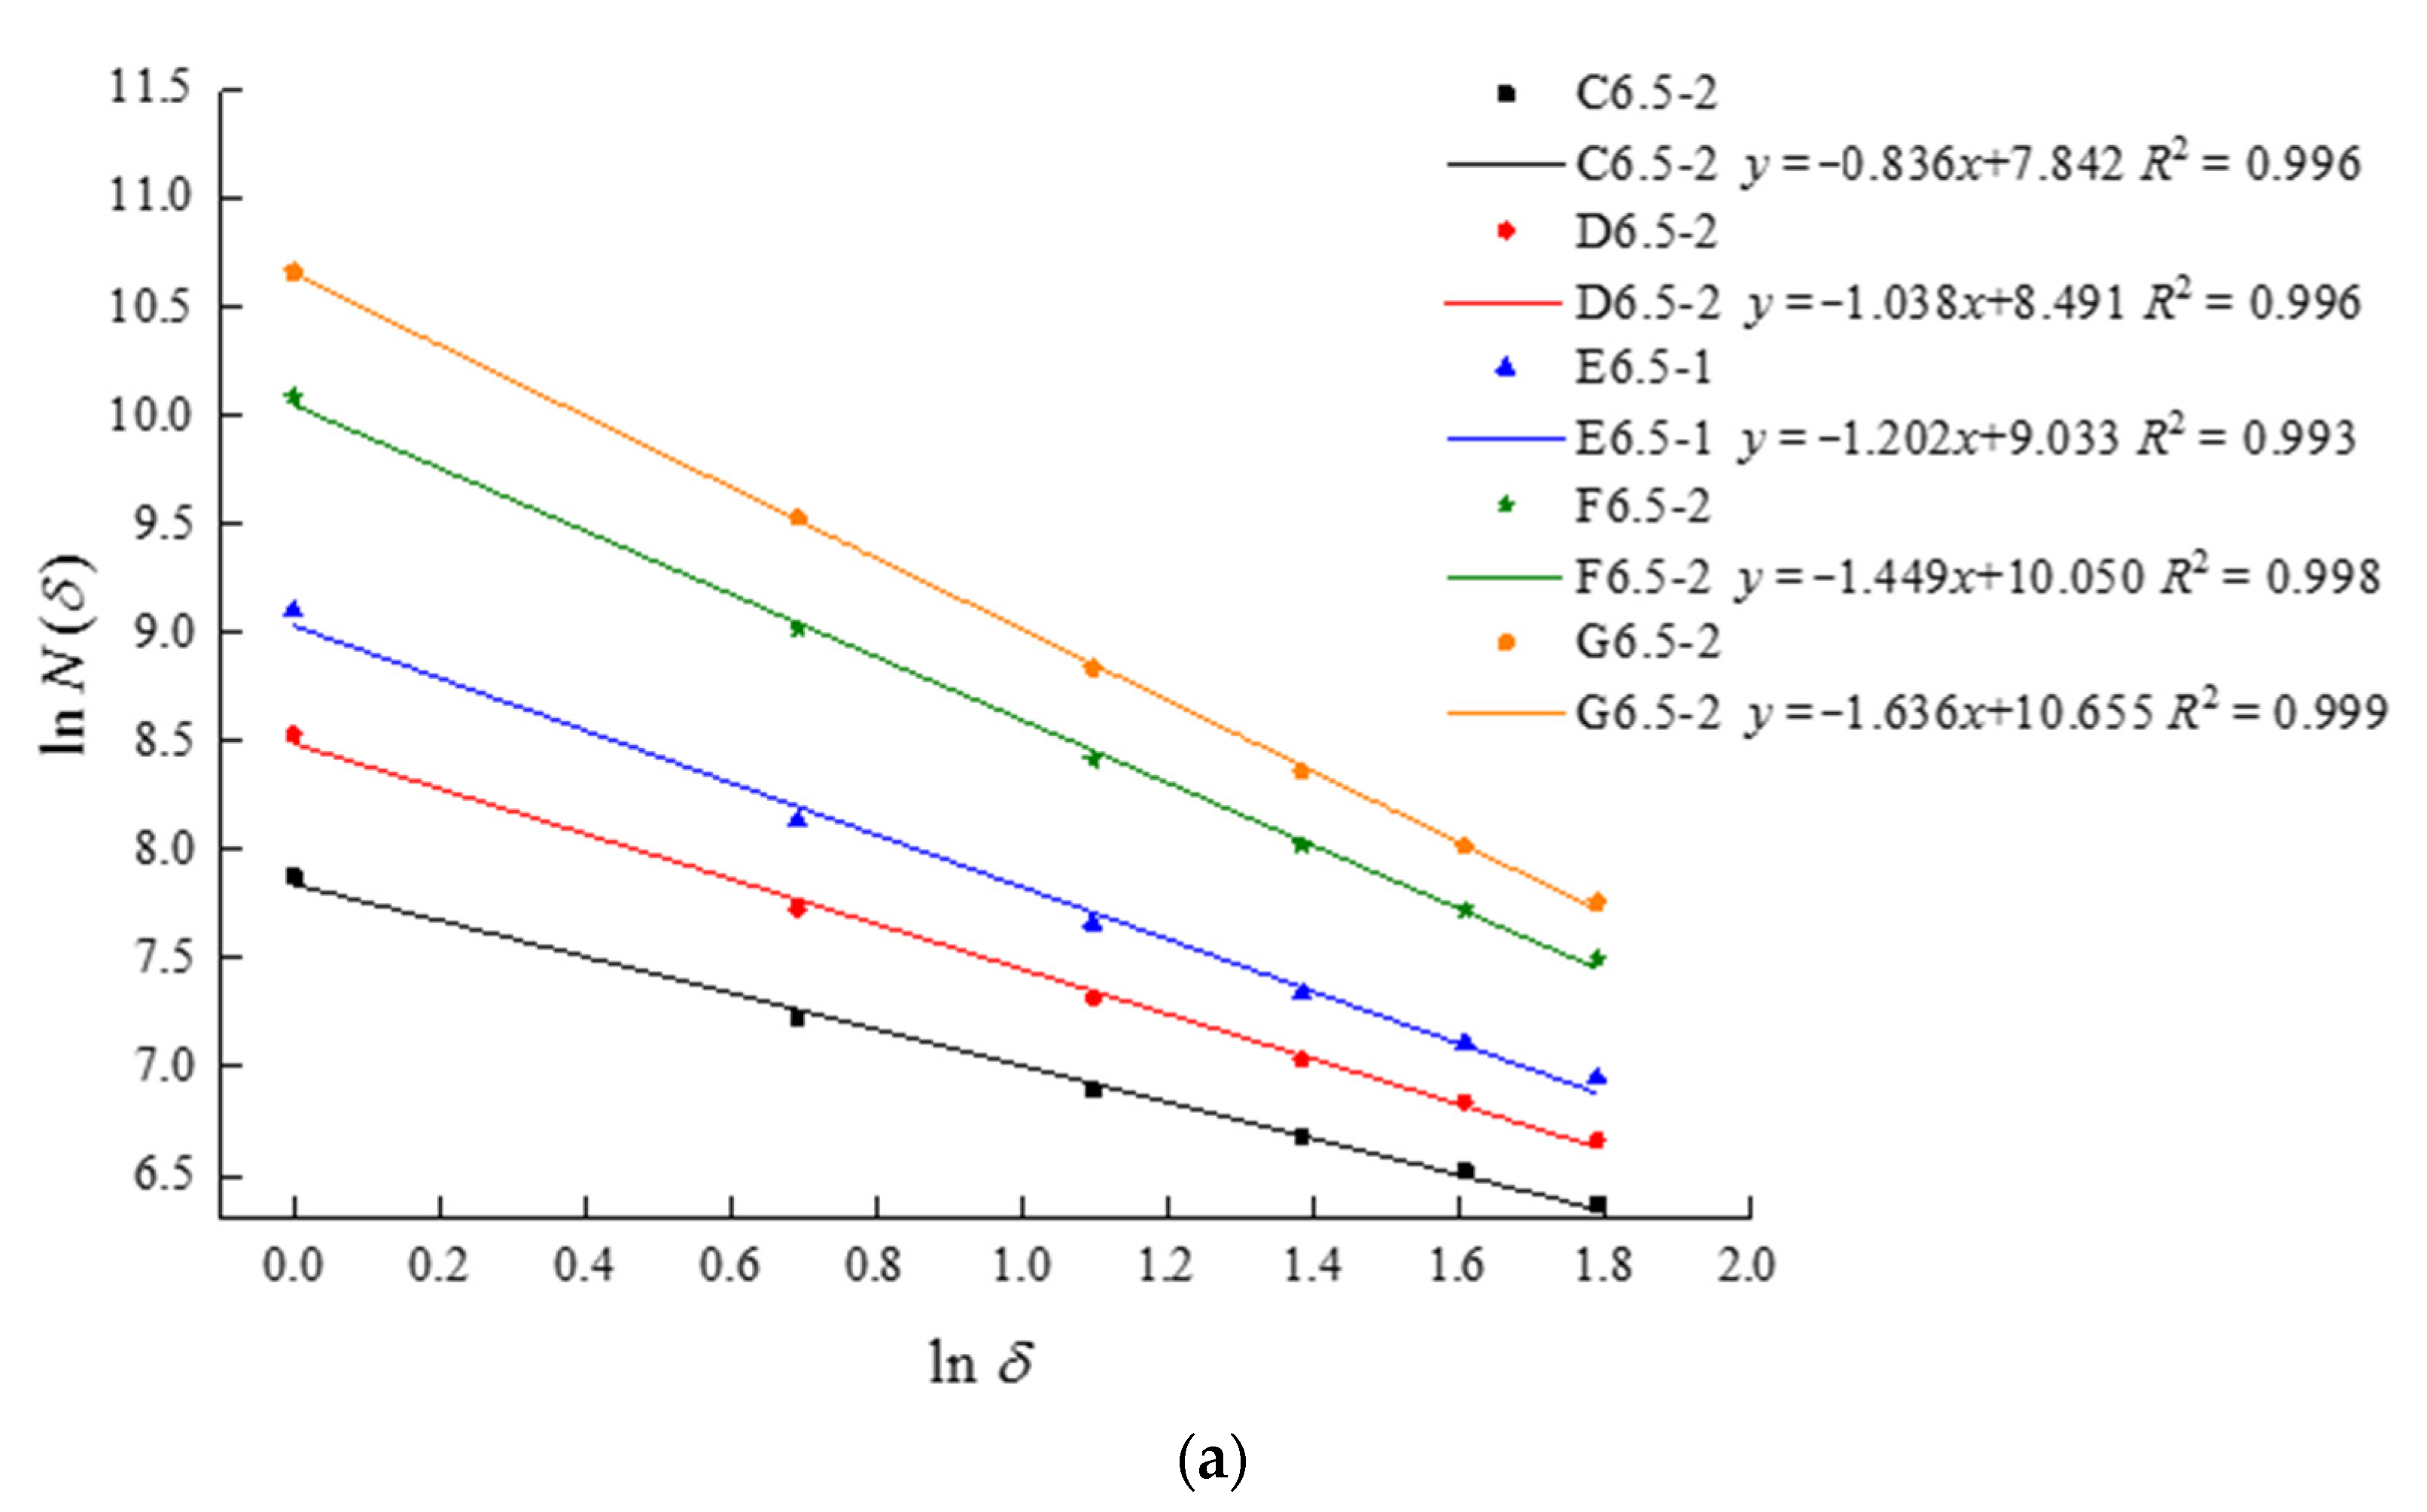
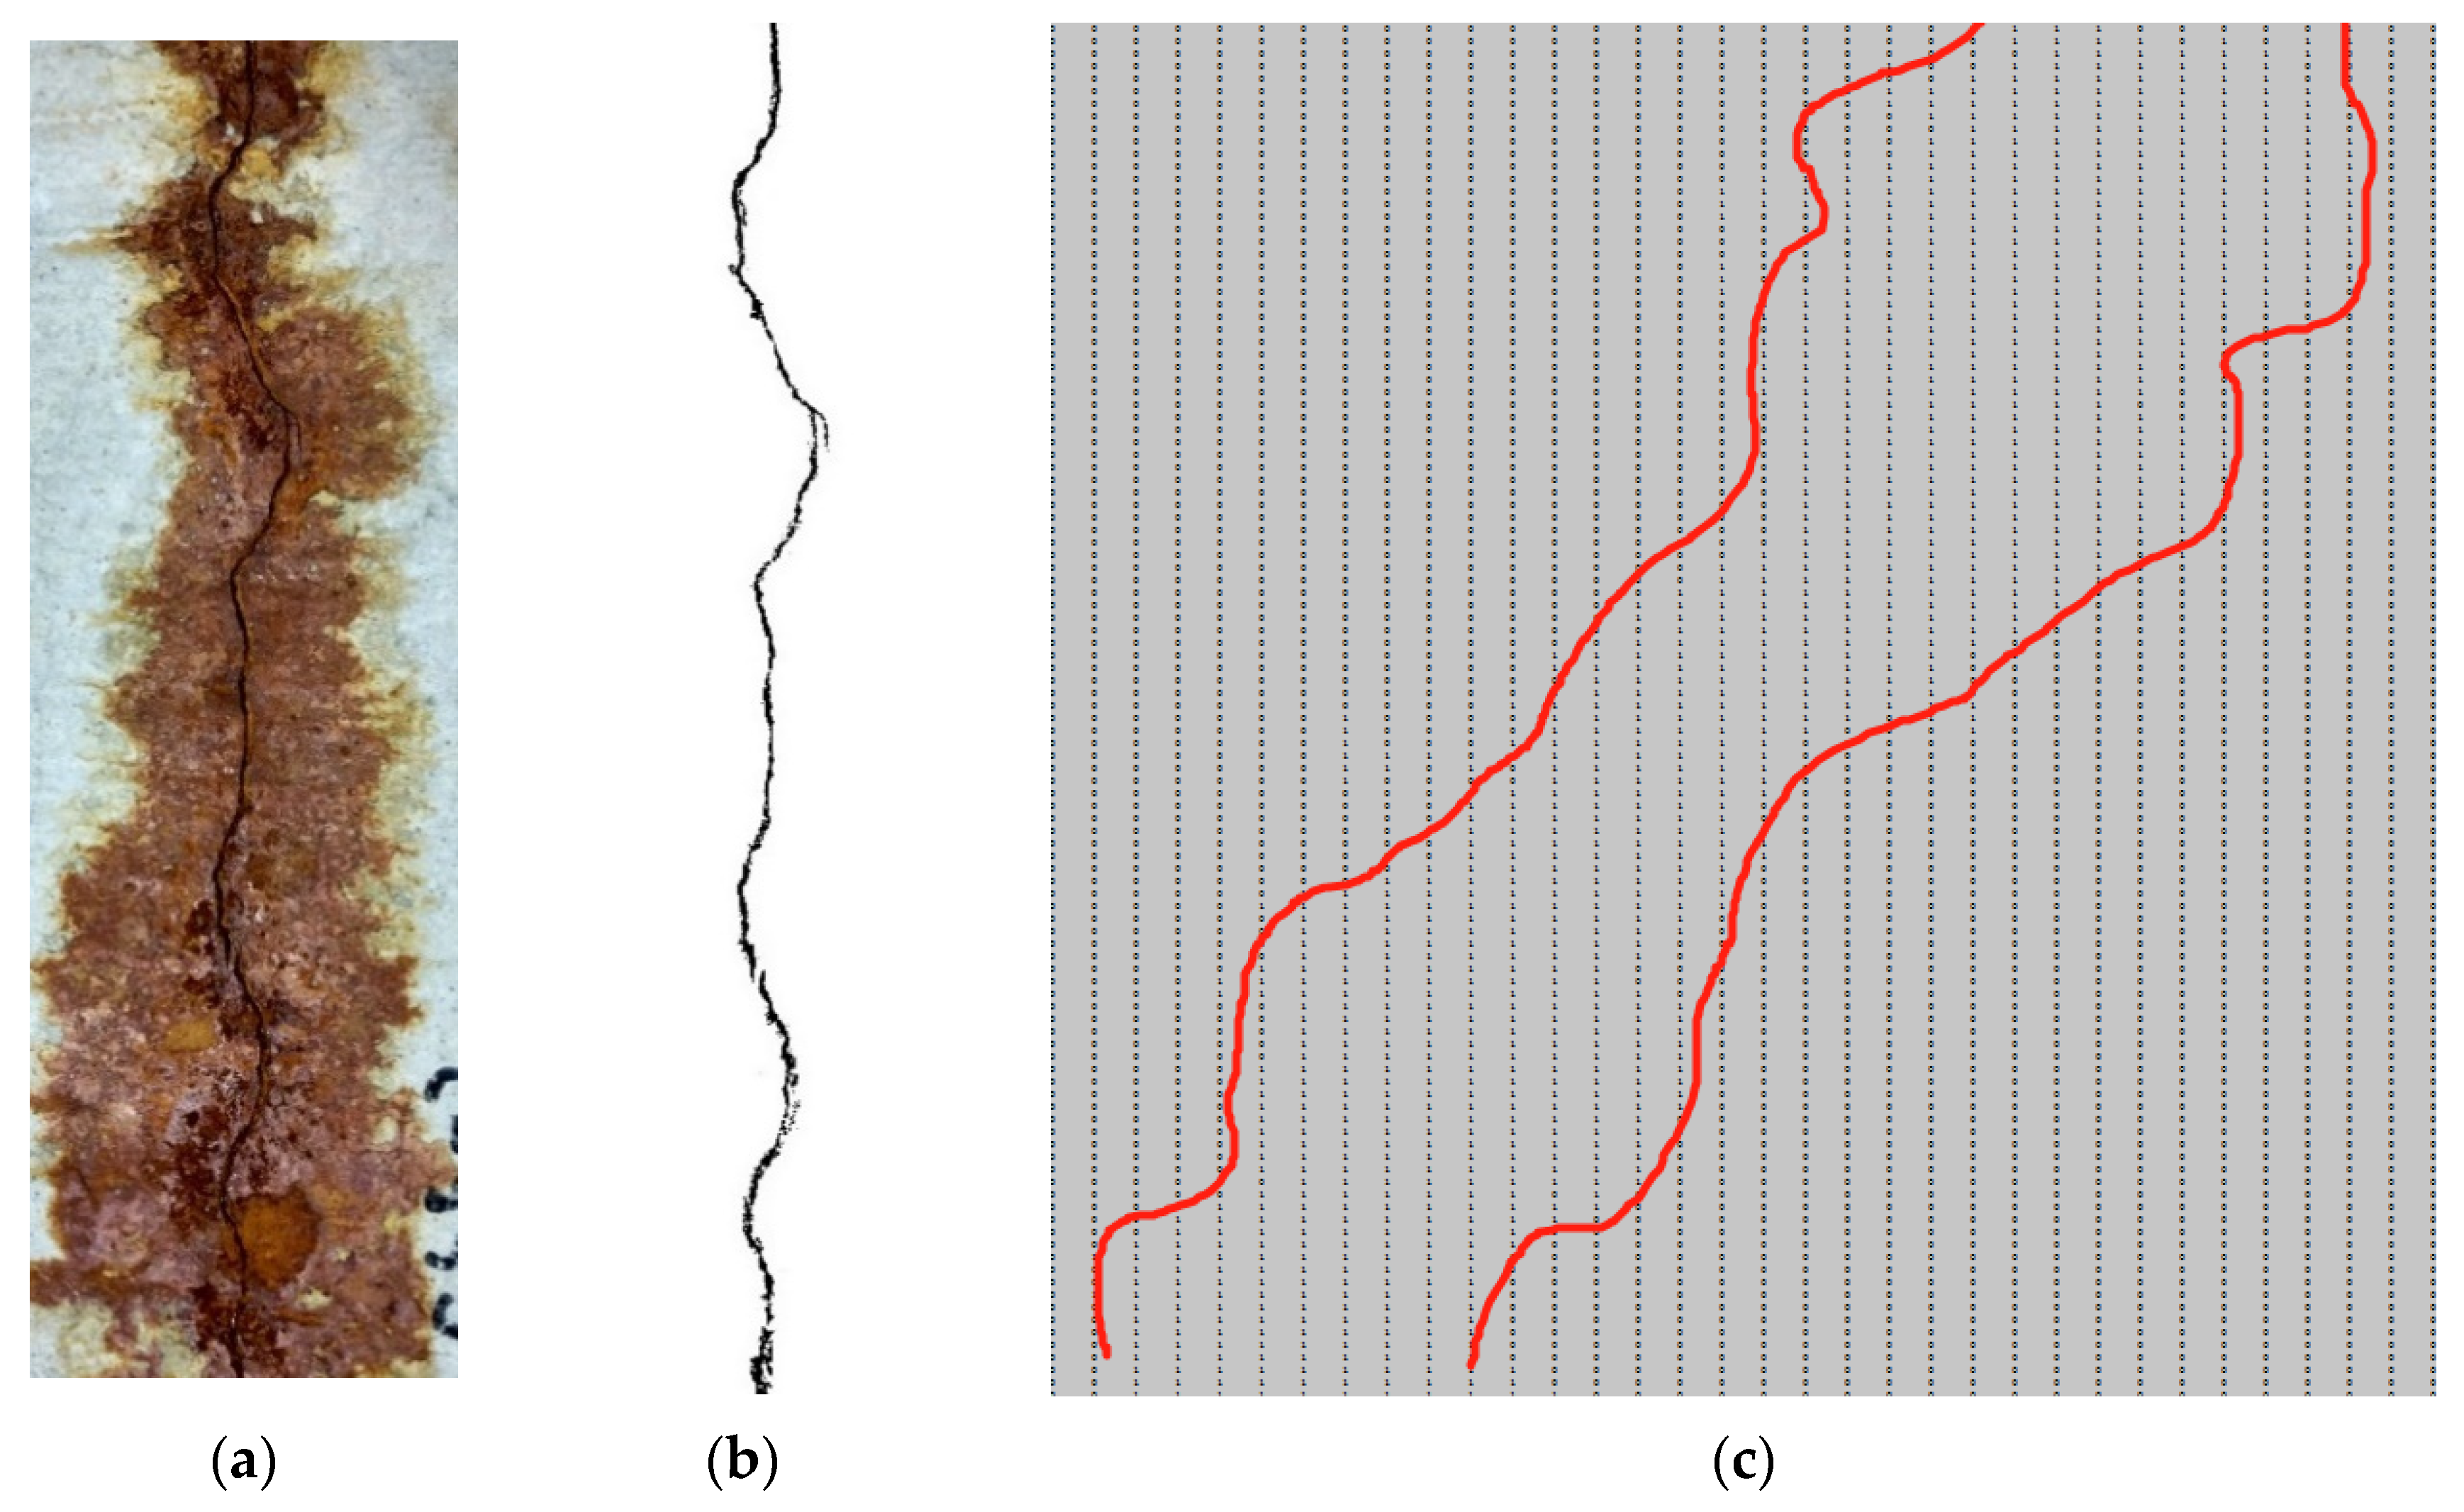
3.1. Box-Counting Method

The box-counting method is also known as the covering algorithm, which covers the fractal curve with square boxes of different sizes (δ × δ); a schematic diagram of the theoretical model is shown in Figure 3. For a box of size δ, the total number of boxes N required to cover the fractal curve can be calculated. Assuming that the fractal curve is covered with δi × δi boxes in step i, the number of boxes required is Ni (δi). To cover it with δi+1 × δi+1 boxes in step i + 1, the number of boxes required is Ni+1 (δi+1). The relationship between the ratio of the number of boxes required and the size of the box at any two scales can be [34,35,36] expressed as follows:
N i + 1 / N i ~ ( δ i + 1 / δ i ) D
Furthermore, N = D can be obtained where C is a constant, and D is the fractal dimension. More specifically, the fractal dimension D can be expressed as:
D ~ ln ( N i + 1 / N i ) / ln ( δ i + 1 / δ i )
ln N = ln C D ln δ
Using this method, D can be obtained by calculating the slope S of the fitting line of a set of (lnδ, lnN) data (Equation (4)), which is obtained during the covering process [34,35,36]. Furthermore, the D derived from the slope of the fitting line can reflect the irregularity of the fractal pattern, and its numerical value can indicate the self-similarity degree.
D = S

3.2. Pixel-Covering Method

A digital image is stored in a computer as pixels. A digital image that is m pixels wide and n pixels high can be represented as an (m × n) matrix, where each element in the matrix represents a pixel. The value of the element represents the pixel color or index color [37]. By setting the color value, each pixel on the image can only appear as black or white. More specifically, after transforming the high-resolution image into a binary image, the values “1” and “0” represent black and white, respectively. In the computational calculation, if the value of any element in a small matrix (box) is 1 (in other words, the elements in the small matrix are not all 0), then the box contains the objects to be calculated. Subsequently, N, which also represents the total number of sub-matrices containing element “1,” can be counted under different mesh partitions of the entire matrix. To combine this method with the box-counting method, D can be obtained using MATLAB (2021b-windows/64bit; Creator: Cleve Molar; USA) such that meshing and computations can be performed automatically after the high-resolution image is transformed into a binary image.
The method to evaluate steel bar corrosion using the fractal dimension of corrosion-induced cracks proposed herein can be illustrated via a flow chart, as shown in Figure 4.

3.3. Fractal Dimension of Corrosion-Induced Cracks

Specimen G6.5-2 is presented as an example herein to demonstrate the analytical procedure required to calculate the fractal dimensions of a corrosion-induced crack. First, the high-resolution crack image of specimen G6.5-2 was transformed into a grayscale image using MATLAB; next, the image was transformed into binary images in black and white (Figure 5).
Subsequently, the binary image was saved and transformed into a binary matrix, where “0” and “1” represent white and black pixels, respectively (Figure 5c). The binary matrix was covered with square boxes of different sizes (δ × δ pixels), and the total number of boxes containing “1” was counted (denoted as N(δ)). Finally, the logarithmic coordinates corresponding to δ and N(δ) were plotted in the coordinate system and fitted linearly. Based on the box-counting method [11,12], the slope of the fitting line is the D of the corrosion-induced crack.

4. Results and Discussion

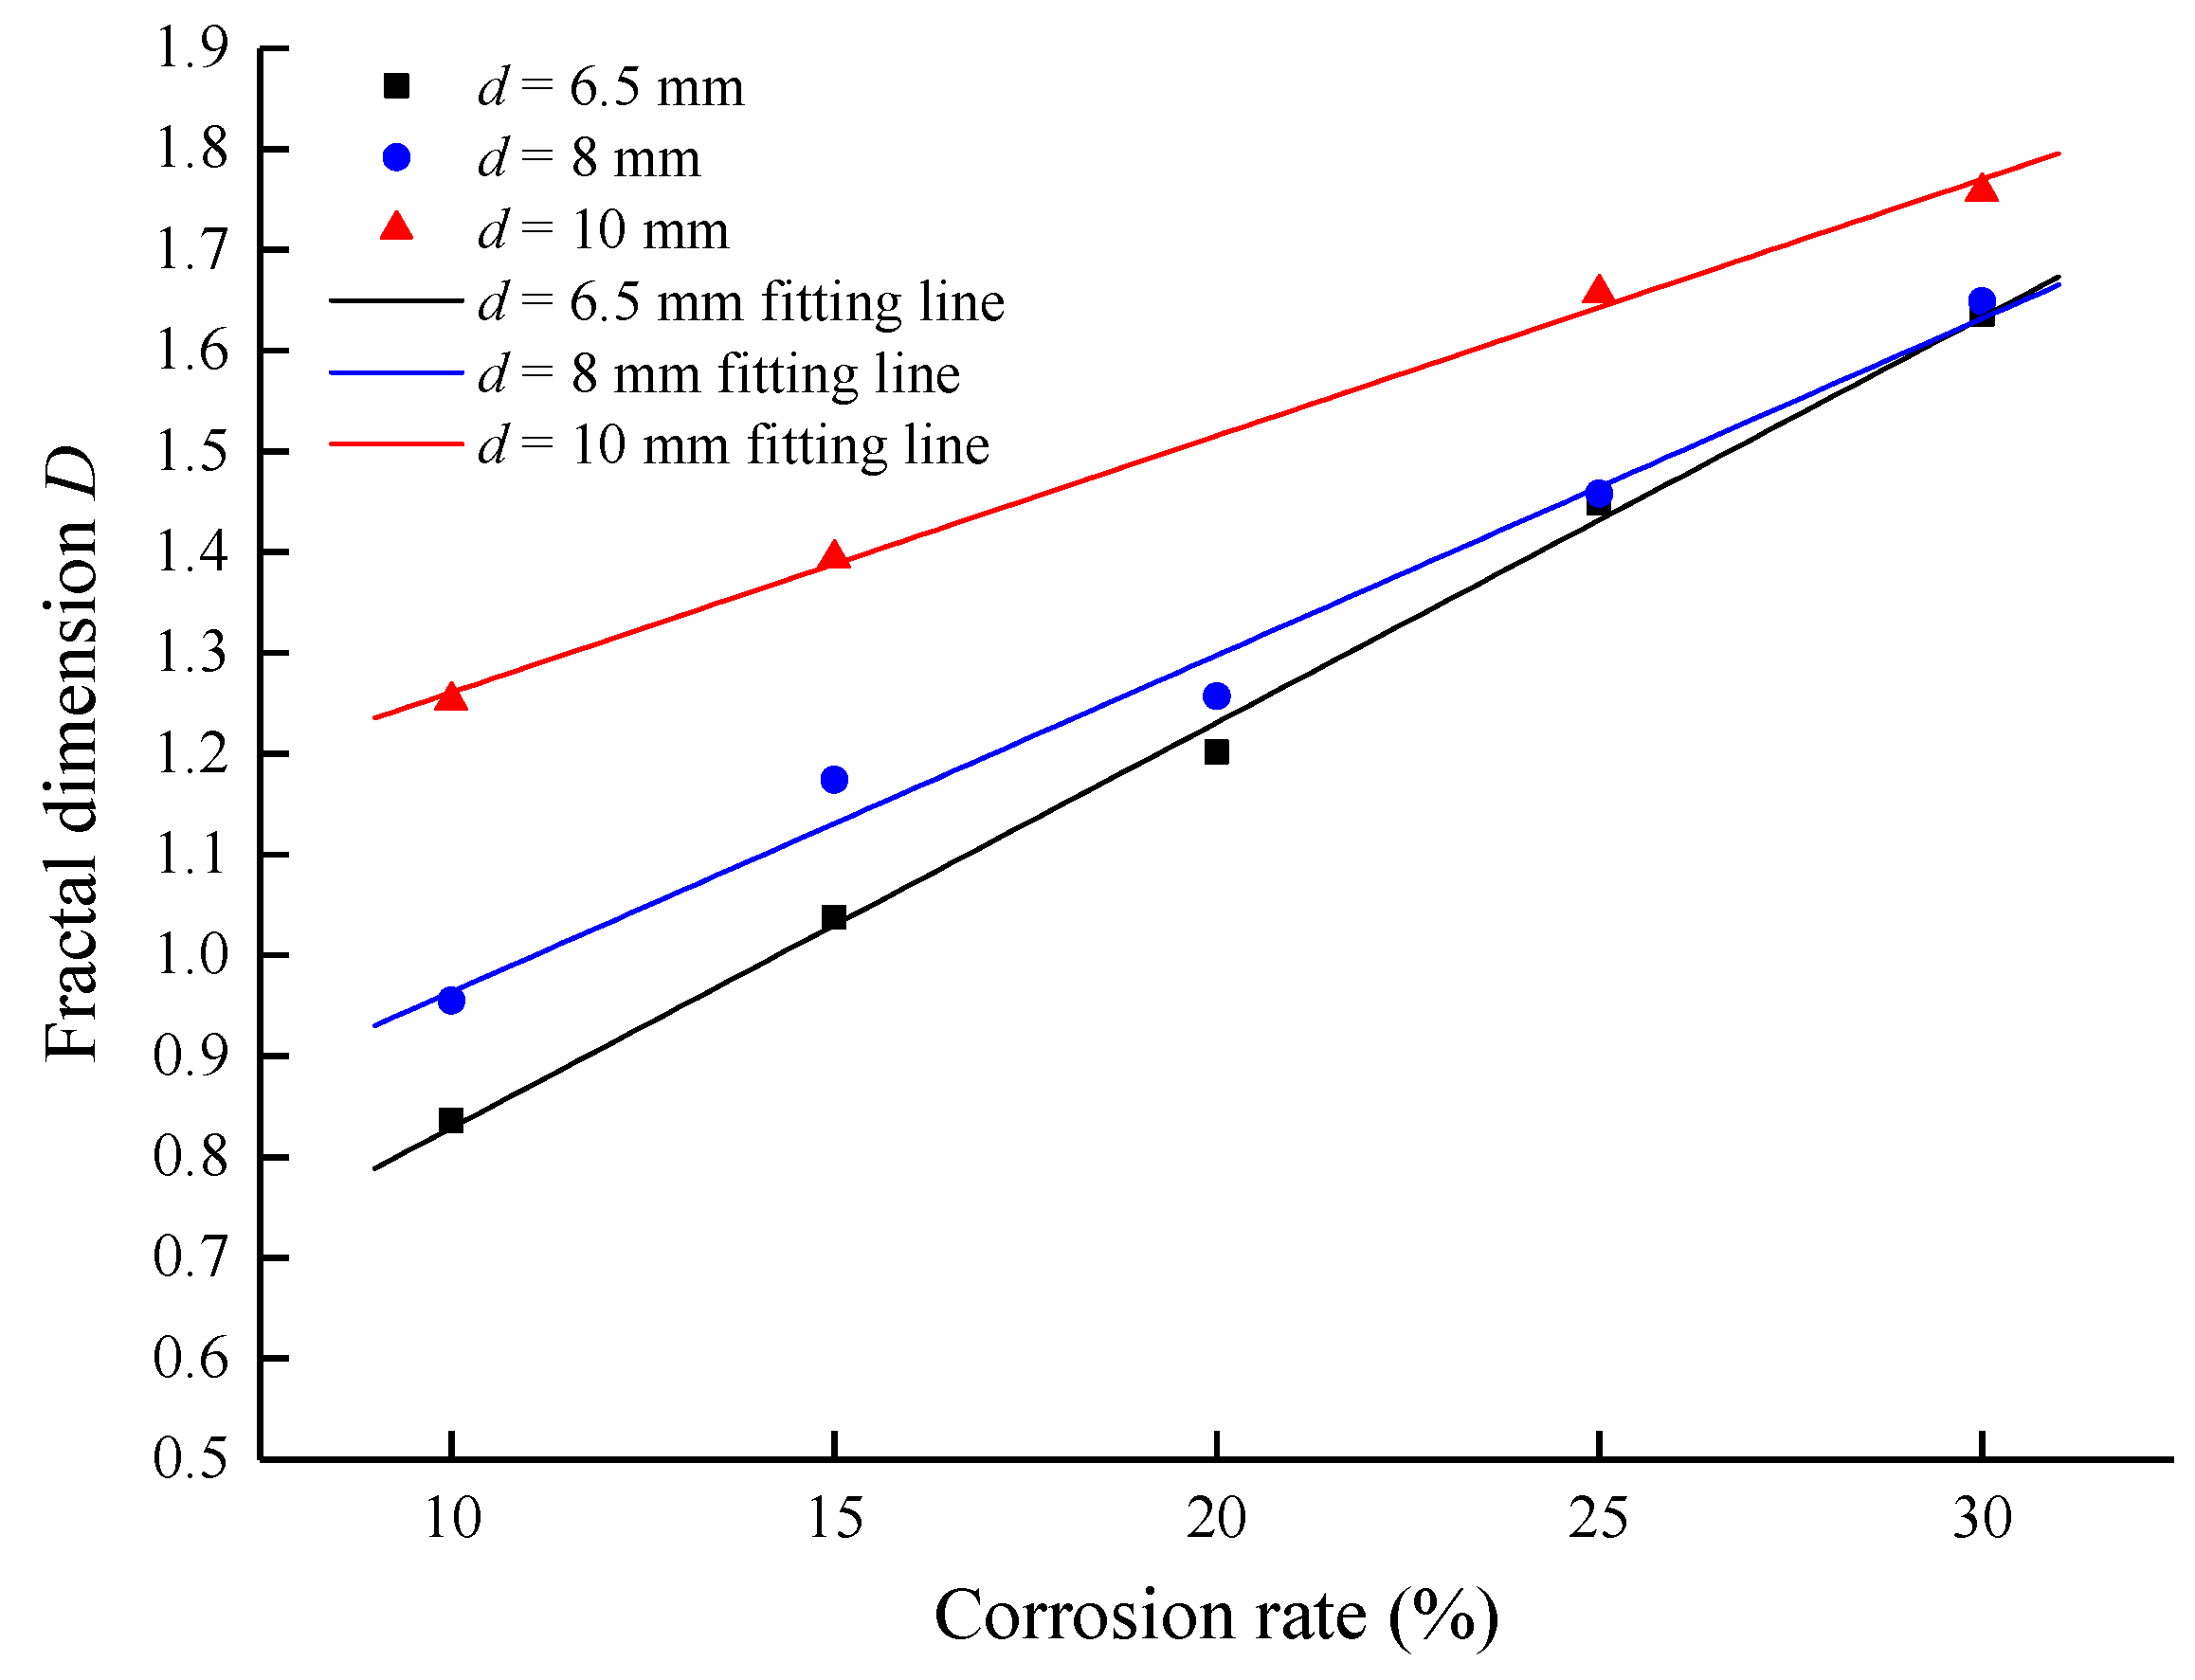
4.1. Relationship between Corrosion Degree and the Fractal Dimension of Cracks

The fractal dimension of a corrosion-induced crack was calculated using the pixel-covering method [36,37]. One specimen from each group with a well-defined crack was selected, whereas specimens from group E10 were not analyzed because they featured severe damage and cracks filled with corrosion products, which would affect the accuracy of the binarization results. The binary diagram of the corrosion-induced cracks for the remaining specimens is shown in Figure 6. Table 3 lists the calculated results of δ and N for each specimen.
The relationship between lnδ and lnN for rust expansion cracks in concrete with different corrosion degrees is presented in Figure 7. As shown, the lnδ and lnN values of all specimens indicate a linear relationship, with the coefficient of determination R2 greater than 0.99, indicating that the cracks generated by corrosion and subsequently causing the expansion of concrete exhibit significant fractal characteristics. Therefore, they can be aptly described and analyzed based on fractal theory [11,12,31]. The fractal dimension D represented by the slope of the fitting line (Figure 7) reflects the irregularity of the profile of the corrosion-induced cracks with fractal characteristics. In Equation (3), C is a scaling coefficient and an absolute measurement parameter that reflects the size of the crack profile under a cell with side length δ. When describing the two-dimensional distribution of corrosion-induced cracks on the external surface of concrete specimens, the scale coefficient C indicates the complexity of the distribution of corrosion-induced cracks, as well as the number, length, and width of the cracks. A greater C, i.e., wider and longer cracks, implies the greater complexity of the distribution of corrosion-induced cracks [37], from which a higher corrosion degree of the reinforcement inside the concrete can be inferred.
As presented in Figure 7 and Figure 8, the fractal dimension and the intercept of the fitted line increase as corrosion progresses for the same steel bar diameter. For example, the lnN values for a 10 mm diameter specimen were 9.02, 9.76, 10.72, and 11.28 for 15%, 20%, 25%, and 30% corrosion degrees, respectively. The fractal dimension decreased with the steel bar diameter; however, as the corrosion rate increased, the fractal dimension increment of the steel bar with a small diameter increased. At the same corrosion level, the steel bars with larger diameters yielded higher volumes of rust as compared with those with a smaller diameter. Consequently, greater circumferential tensile stresses of concrete were generated around the steel bars, in addition to a more rapid cracking development and the generation of more complex crack patterns. However, as the corrosion rate increased and the cracks developed to a certain degree of severity, the cracks and voids of concrete generated around the steel bars enabled the corrosion products to spread and overflow. Consequently, a corrosion-induced expansive force was released, the development of concrete cracks decelerated, and the irregularity and self-similarity of the concrete cracks stabilized. Additionally, the fractal dimensions of the corrosion-induced cracks with steel bars of different diameters became more similar as the corrosion rate increased, and they progressed gradually to two dimensions.
The scale coefficient C for different steel bar diameters and corrosion rates are shown in Figure 9, where the largest scale coefficient (81,454) corresponds to the 30% corrosion rate of specimen G10-4 specimen, and the smallest scale coefficient (2634) corresponds to the 10% corrosion rate of specimen C6.5-2. The scale coefficient for the black pixel points of the corrosion-induced cracks increased exponentially with the corrosion rate, with an increase of approximately 200% (176–268%) for every 5% increment in the corrosion rate, irrespective of the steel bar diameter. Moreover, as the diameter of the steel bar increased, the scale coefficient increased significantly. These findings suggest that the development of the corrosion-induced cracks is governed significantly by the corrosion degree and steel bar diameter; in fact, this conjecture is supported by the experimental and theoretical analyses of Alonso et al. [10].
The fractal dimension–corrosion rate relationship shown in Figure 8 was linearly fitted to obtain the corresponding relationship equations for different steel bar diameters.
d = 6.5 mm (black line in Figure 8):
D = 0.0402 η + 0.4278
d = 8 mm (blue line in Figure 8):
D = 0.0334 η + 0.6298
d = 10 mm (red line in Figure 8):
D = 0.0255 η + 1.0063
By considering the steel bar diameter, Equations (5)–(7) can be summarized to obtain the relationship between the fractal dimension, steel bar diameter, and corrosion rate, as shown in Equation (8).
D = [ ( 6.738 0.42 d ) η + d 2 ] × 10 2   6 . 5   mm d 10   mm ;   5 % η 30 %
Here, D is the fractal dimension, d is the steel bar diameter, and η is the corrosion rate. Therefore, the corrosion rate of the steel bar can be evaluated based on D and d.
Because the key factors in this equation such as the concrete strength, concrete cover thickness, and the existence of stirrups were not considered in the tests, the influence coefficient was set to a fixed value and can be investigated more comprehensively later. Since the original image is the basis for calculation, a higher-definition camera is necessitated to capture images of small cracks. If the color contrast is clear, then the threshold can be increased appropriately to improve the measurement accuracy.

4.2. Verification of Proposed Relationship between Corrosion Rate and Fractal Dimension

A total of 28 specimens were used to verify the accuracy and randomness of the relationship between the corrosion rate and fractal dimension (as shown in Equation (8)).
The comparison between the experimental and predicted values is shown in Figure 10, and the accuracy of the proposed model was verified based on three statistical indicators: the coefficient of determination R2, the ratio of averages (Average) and the integral of absolute error (IAE). Among them, IAE is the most frequently used indicator to determine the variation sensitivity of the difference between the experimental and predicted values [38].
The coefficient of determination R2 between the experimental and the predicted values was 0.856, the IAE was 9.35%, and the ratio of the average values of the fitting line was 0.981 l. Based on the results, the proposed relationship is highly accurate and is, thus, applicable to the same batch of specimens. In terms of the effects of key factors, such as the concrete strength, concrete cover thickness, and the existence of stirrups, their relevant influence coefficients can be investigated subsequently to improve the accuracy of the results. Figure 10 shows that the dispersion between the lower and higher dimensional zones is larger compared with that in the middle zone. Because the crack development in the lower dimensional zone occurred at an early stage and was subtle, a clearer image of the crack was required; as such, a certain deviation was indicated in terms of the number of black pixel points captured. In the high fractal dimension area, the overflow of corrosion products from some specimens intensified the color around the cracks and directly filled some of the cracks, resulting in deviations in the final calculation results. However, in actual projects, RC structures are naturally corroded and corrosion overflow is not as conspicuous as that in artificial accelerated corrosion degradation tests; therefore, the prediction of steel bar corrosion based on actual engineering projects can ensure a certain degree of accuracy. As the aforementioned two aspects do not significantly affect the intermediate fractal dimension interval, the results obtained are more accurate.
For practical engineering structures based on big data, the corrosion degree of corroded structures can be estimated more accurately in the future by capturing images at a fixed distance, uploading in batches, and performing analyses as mentioned above, which is simpler and more accurate than the method of measuring crack widths and averaging them to obtain the corrosion degree. Instead of assessing the corrosion degree of RC structures by measuring the crack width in one dimension only, the two-dimensional approach, i.e., the fractal dimension method, provides more comprehensive and stable results. In addition, it yields quantitative results for the corrosion degree and is more suitable for application to actual engineering structures, where natural corrosion occurs.

5. Conclusions

Herein, fractal theory was introduced to analyze the fractal dimension of corrosion-induced cracks in deteriorated RC structures. A relationship was established between the fractal dimension of the crack, the corrosion rate, and the steel bar diameter. The following conclusions were obtained:
(1)
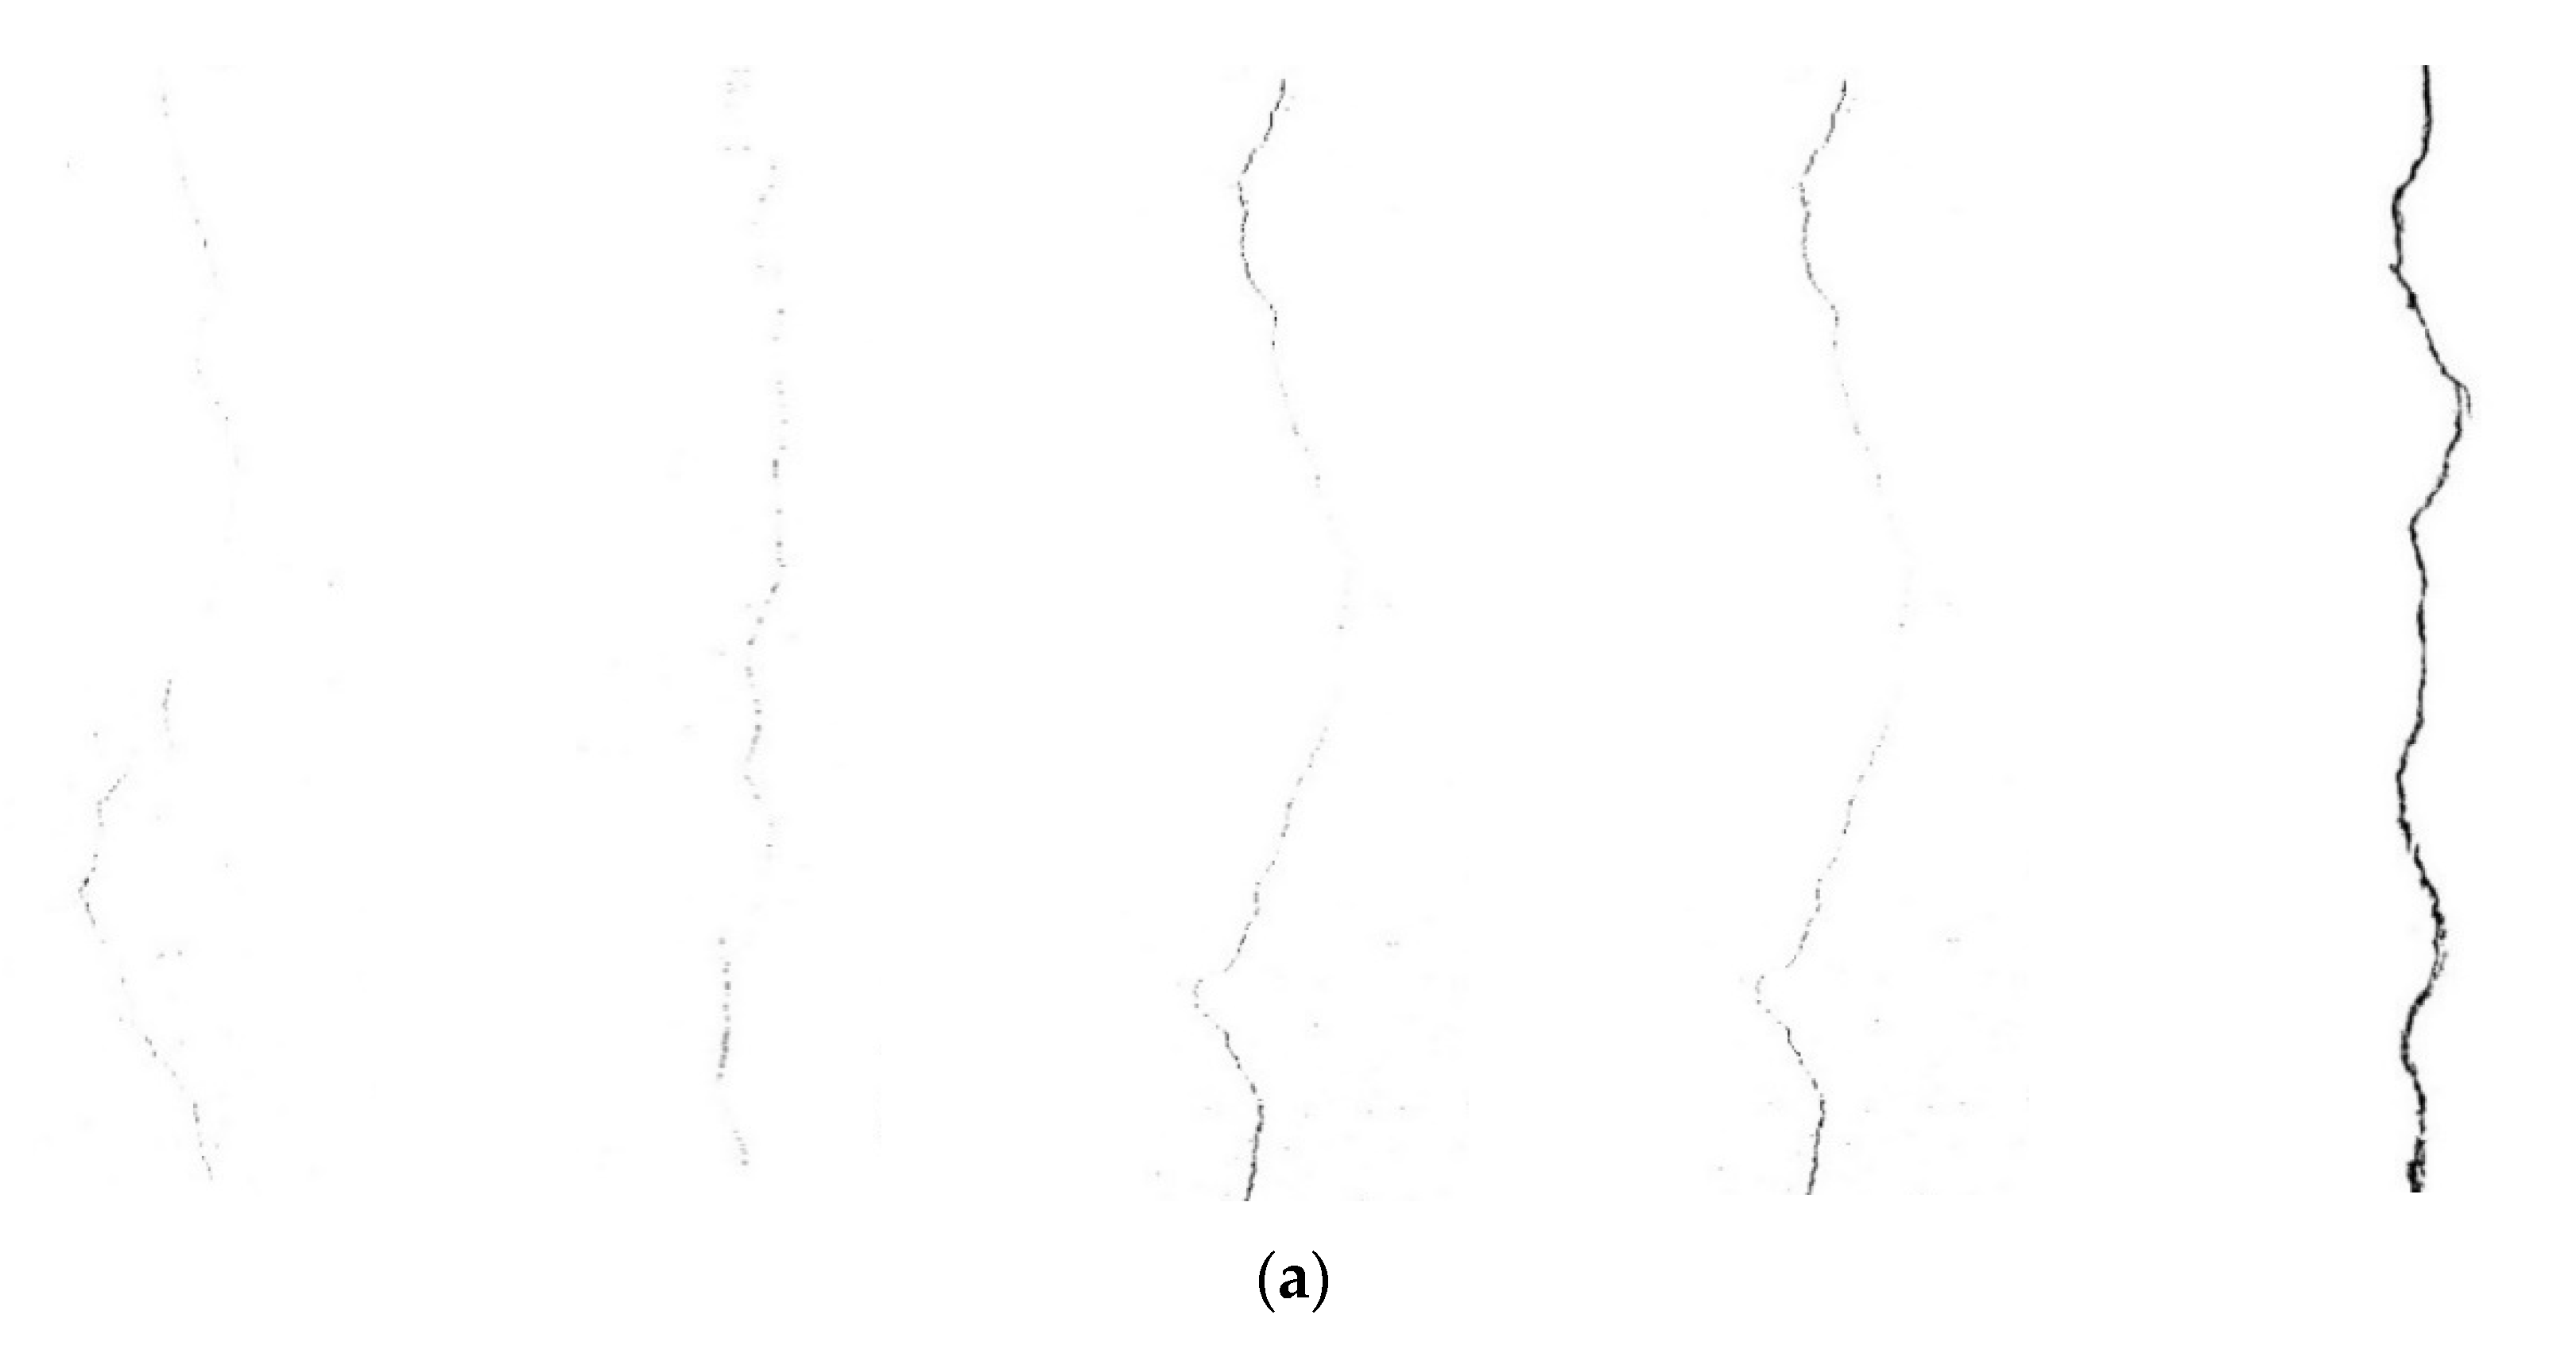
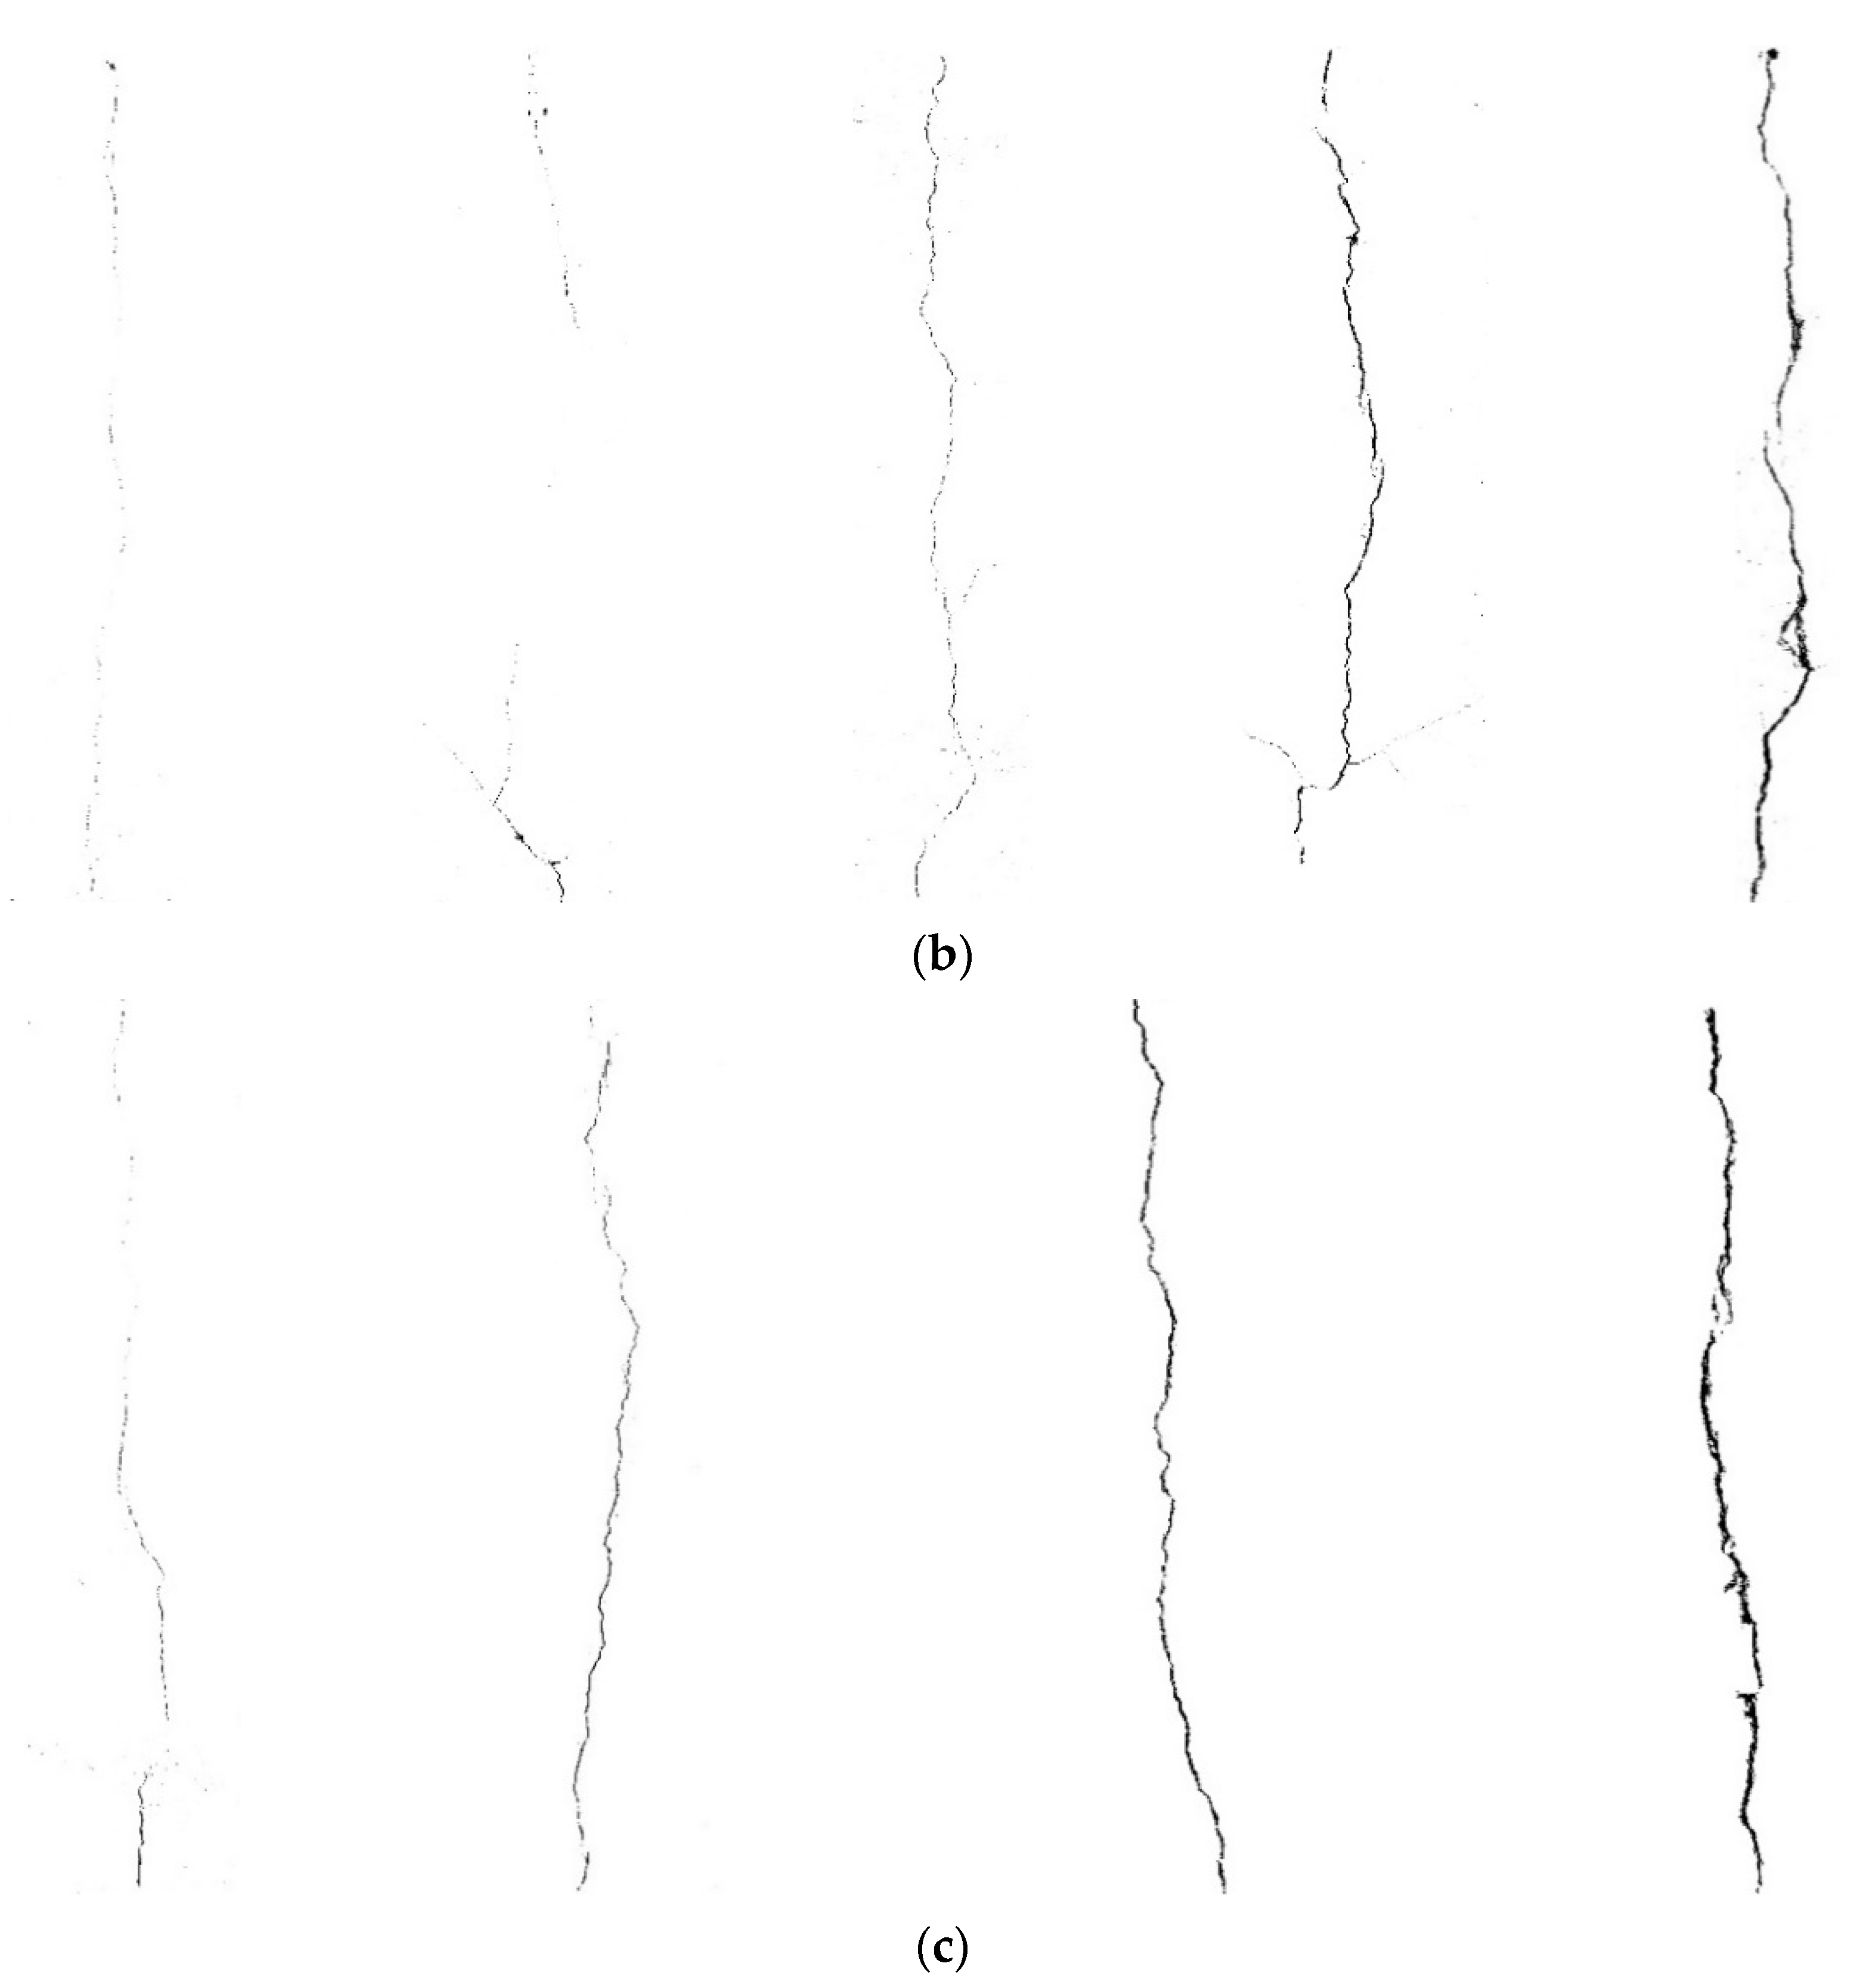
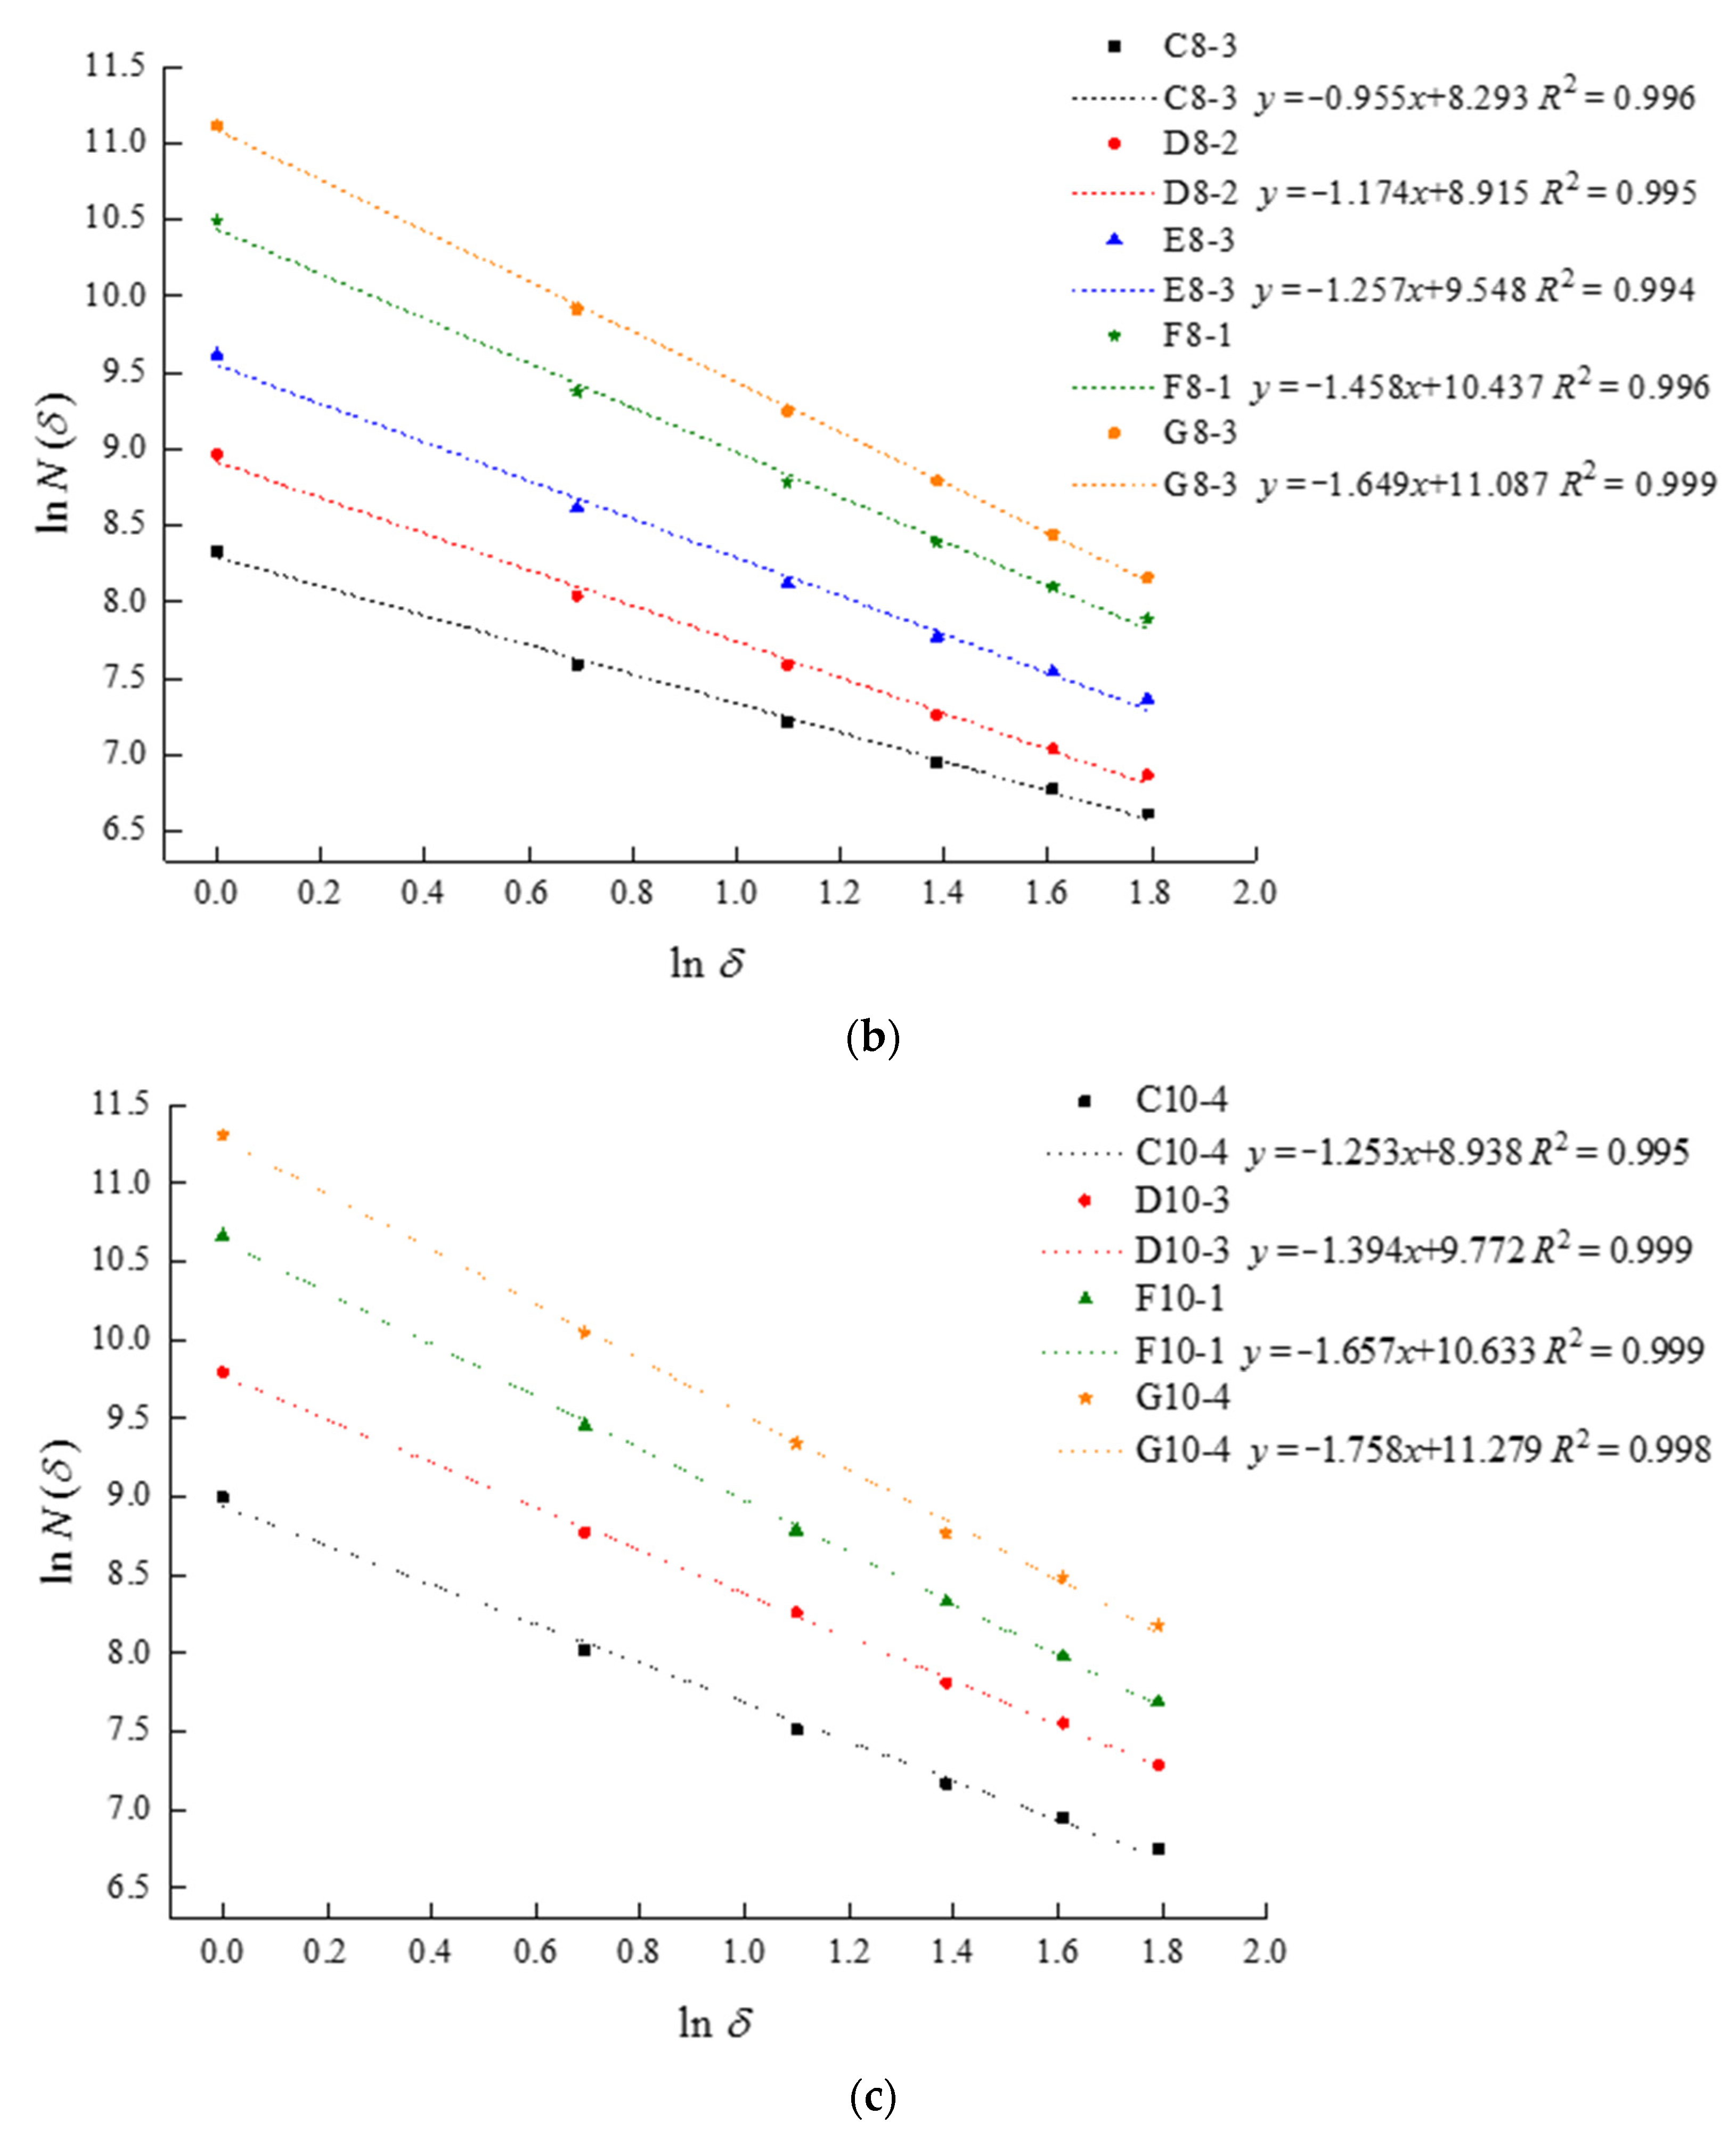
Corrosion-induced cracks on the surface of the specimens exhibited clear fractal characteristics. For a uniform steel bar diameter, the fractal dimension and fitting line interception increased with the corrosion rate, which indicates a larger fractal dimension corresponding to more severe corrosion in the steel bar. Moreover, the smaller the steel bar diameter, the smaller the corresponding fractal dimension. However, as the corrosion rate increased, the fractal dimension increment of the specimens with a small steel bar diameter increased.
(2)
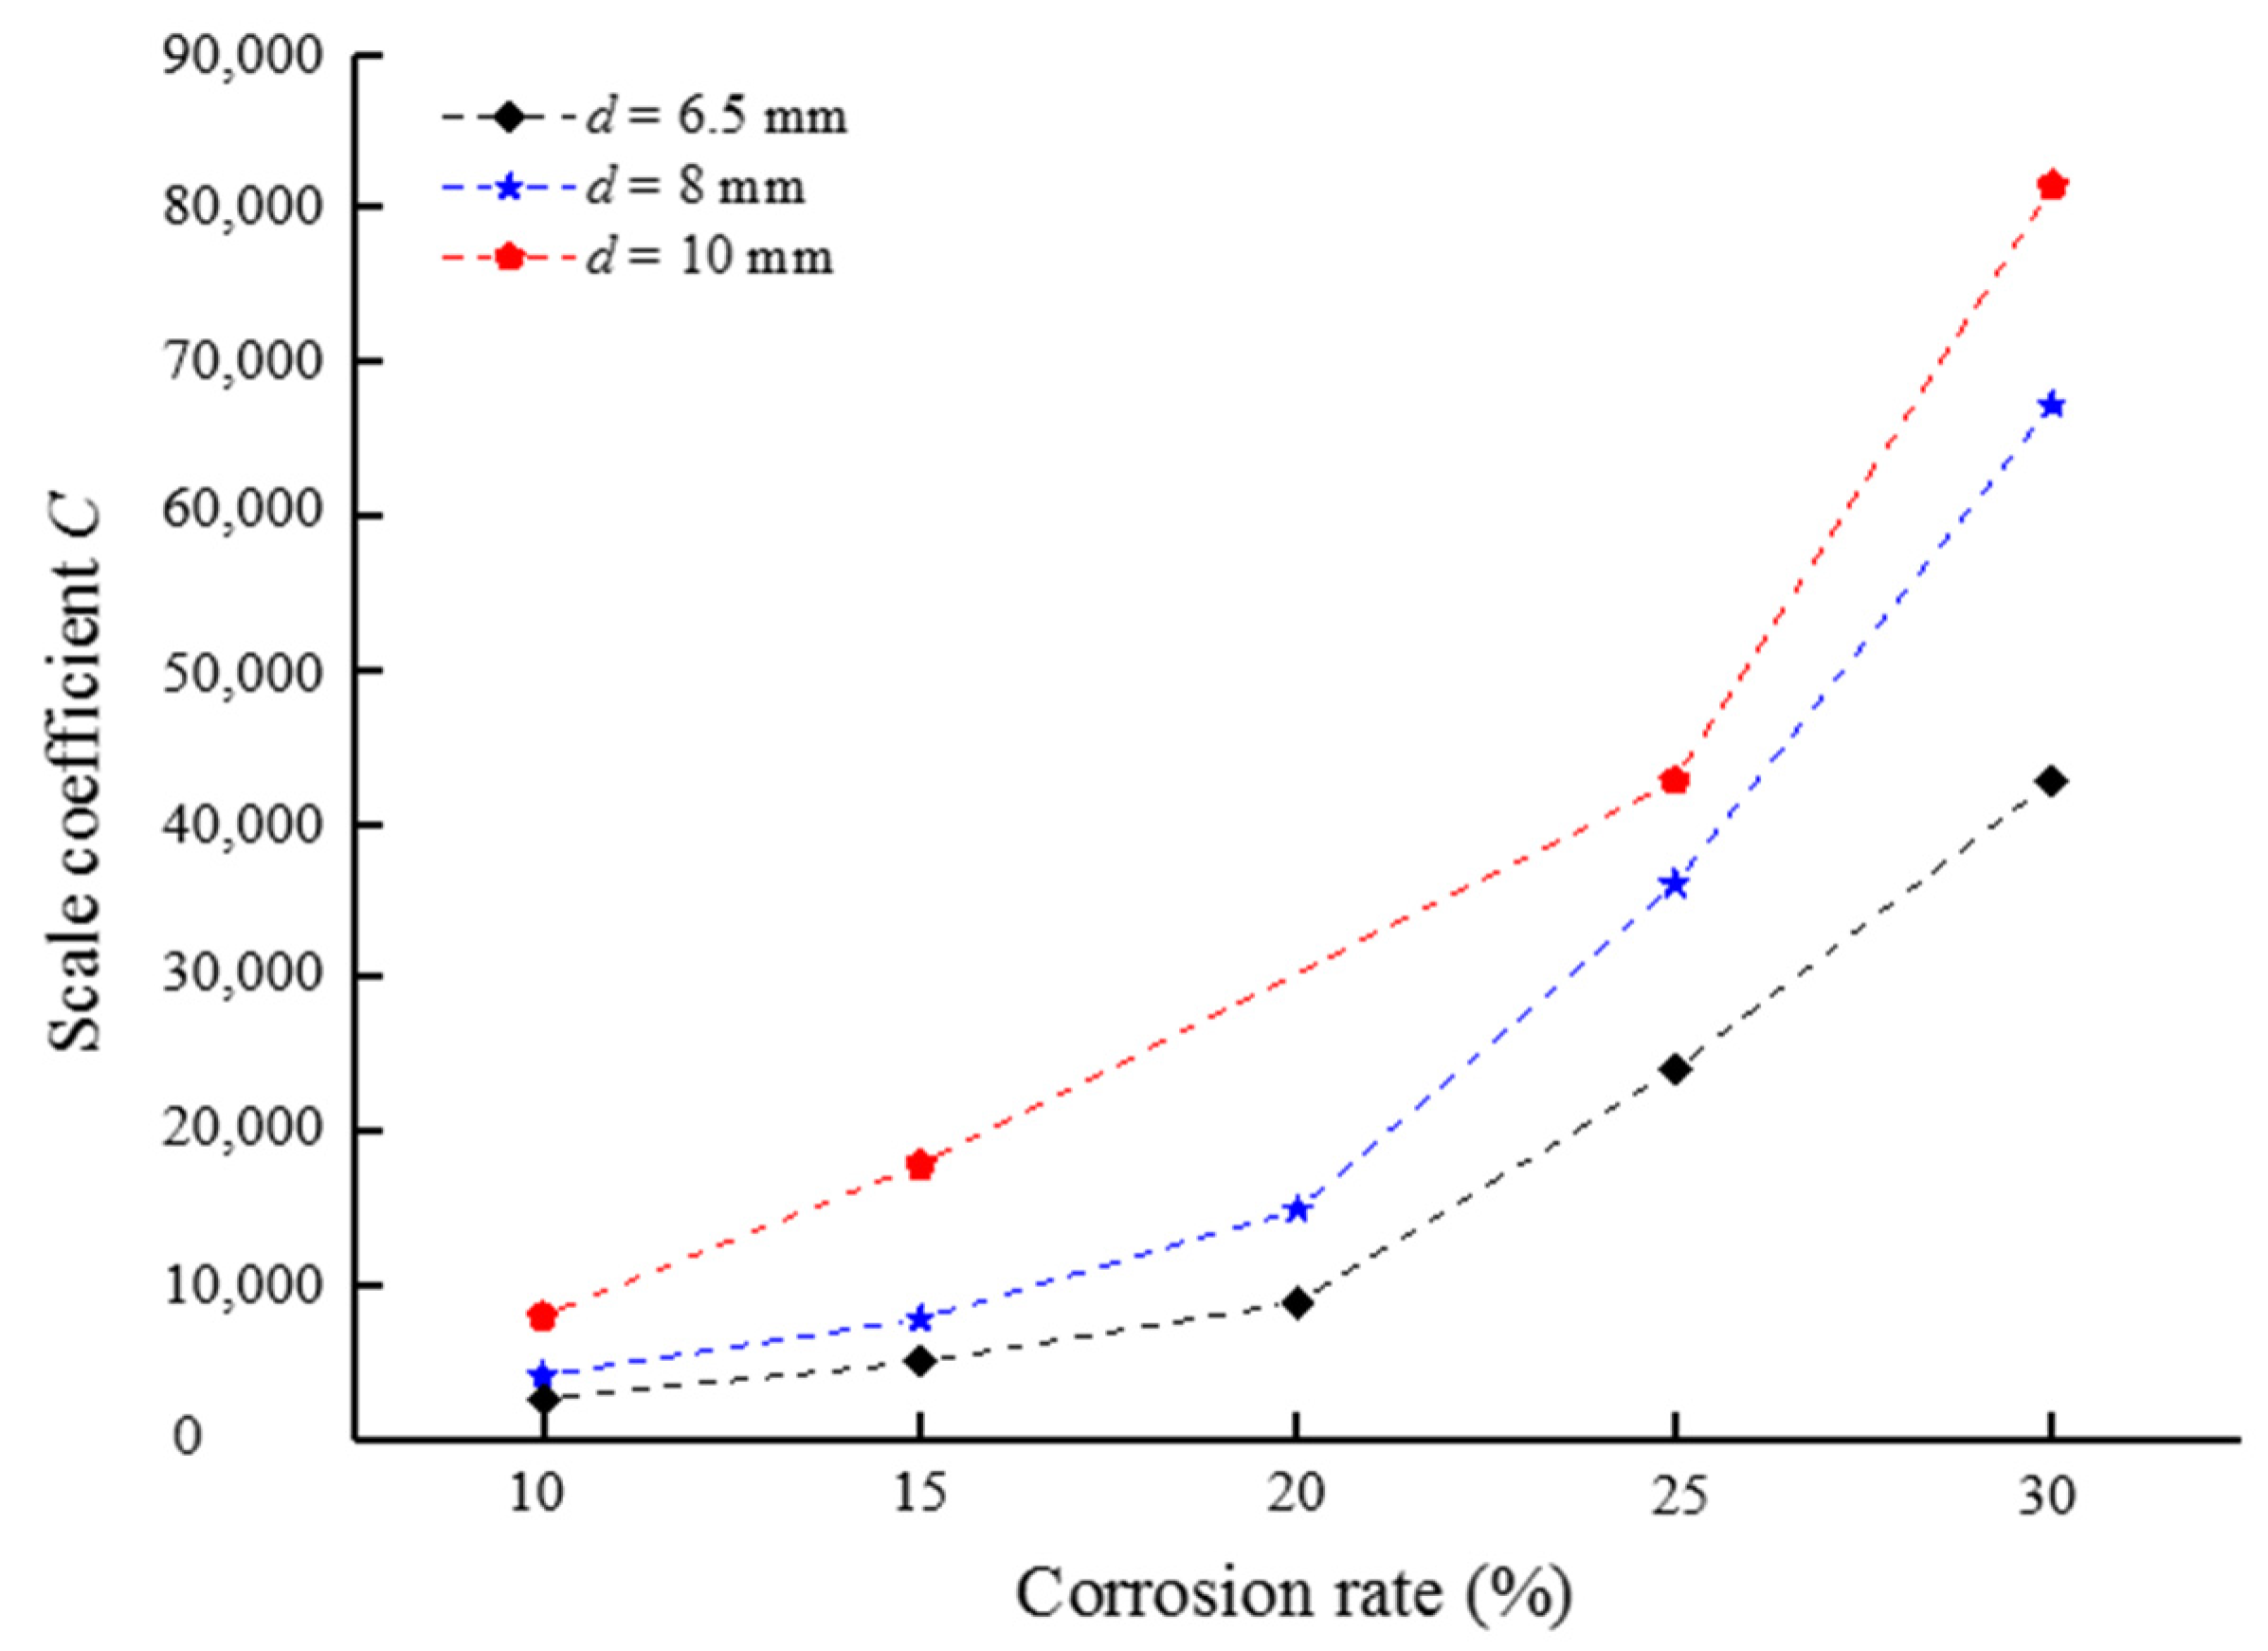
The scale coefficient of the corrosion-induced crack was sensitive to the corrosion rate. The scale coefficients increased by approximately 200% (176–268%) with every 5% increment in the corrosion rate, regardless of the steel bar diameter. In addition, the scale coefficient increased significantly with the increase in the steel bar diameter.
(3)
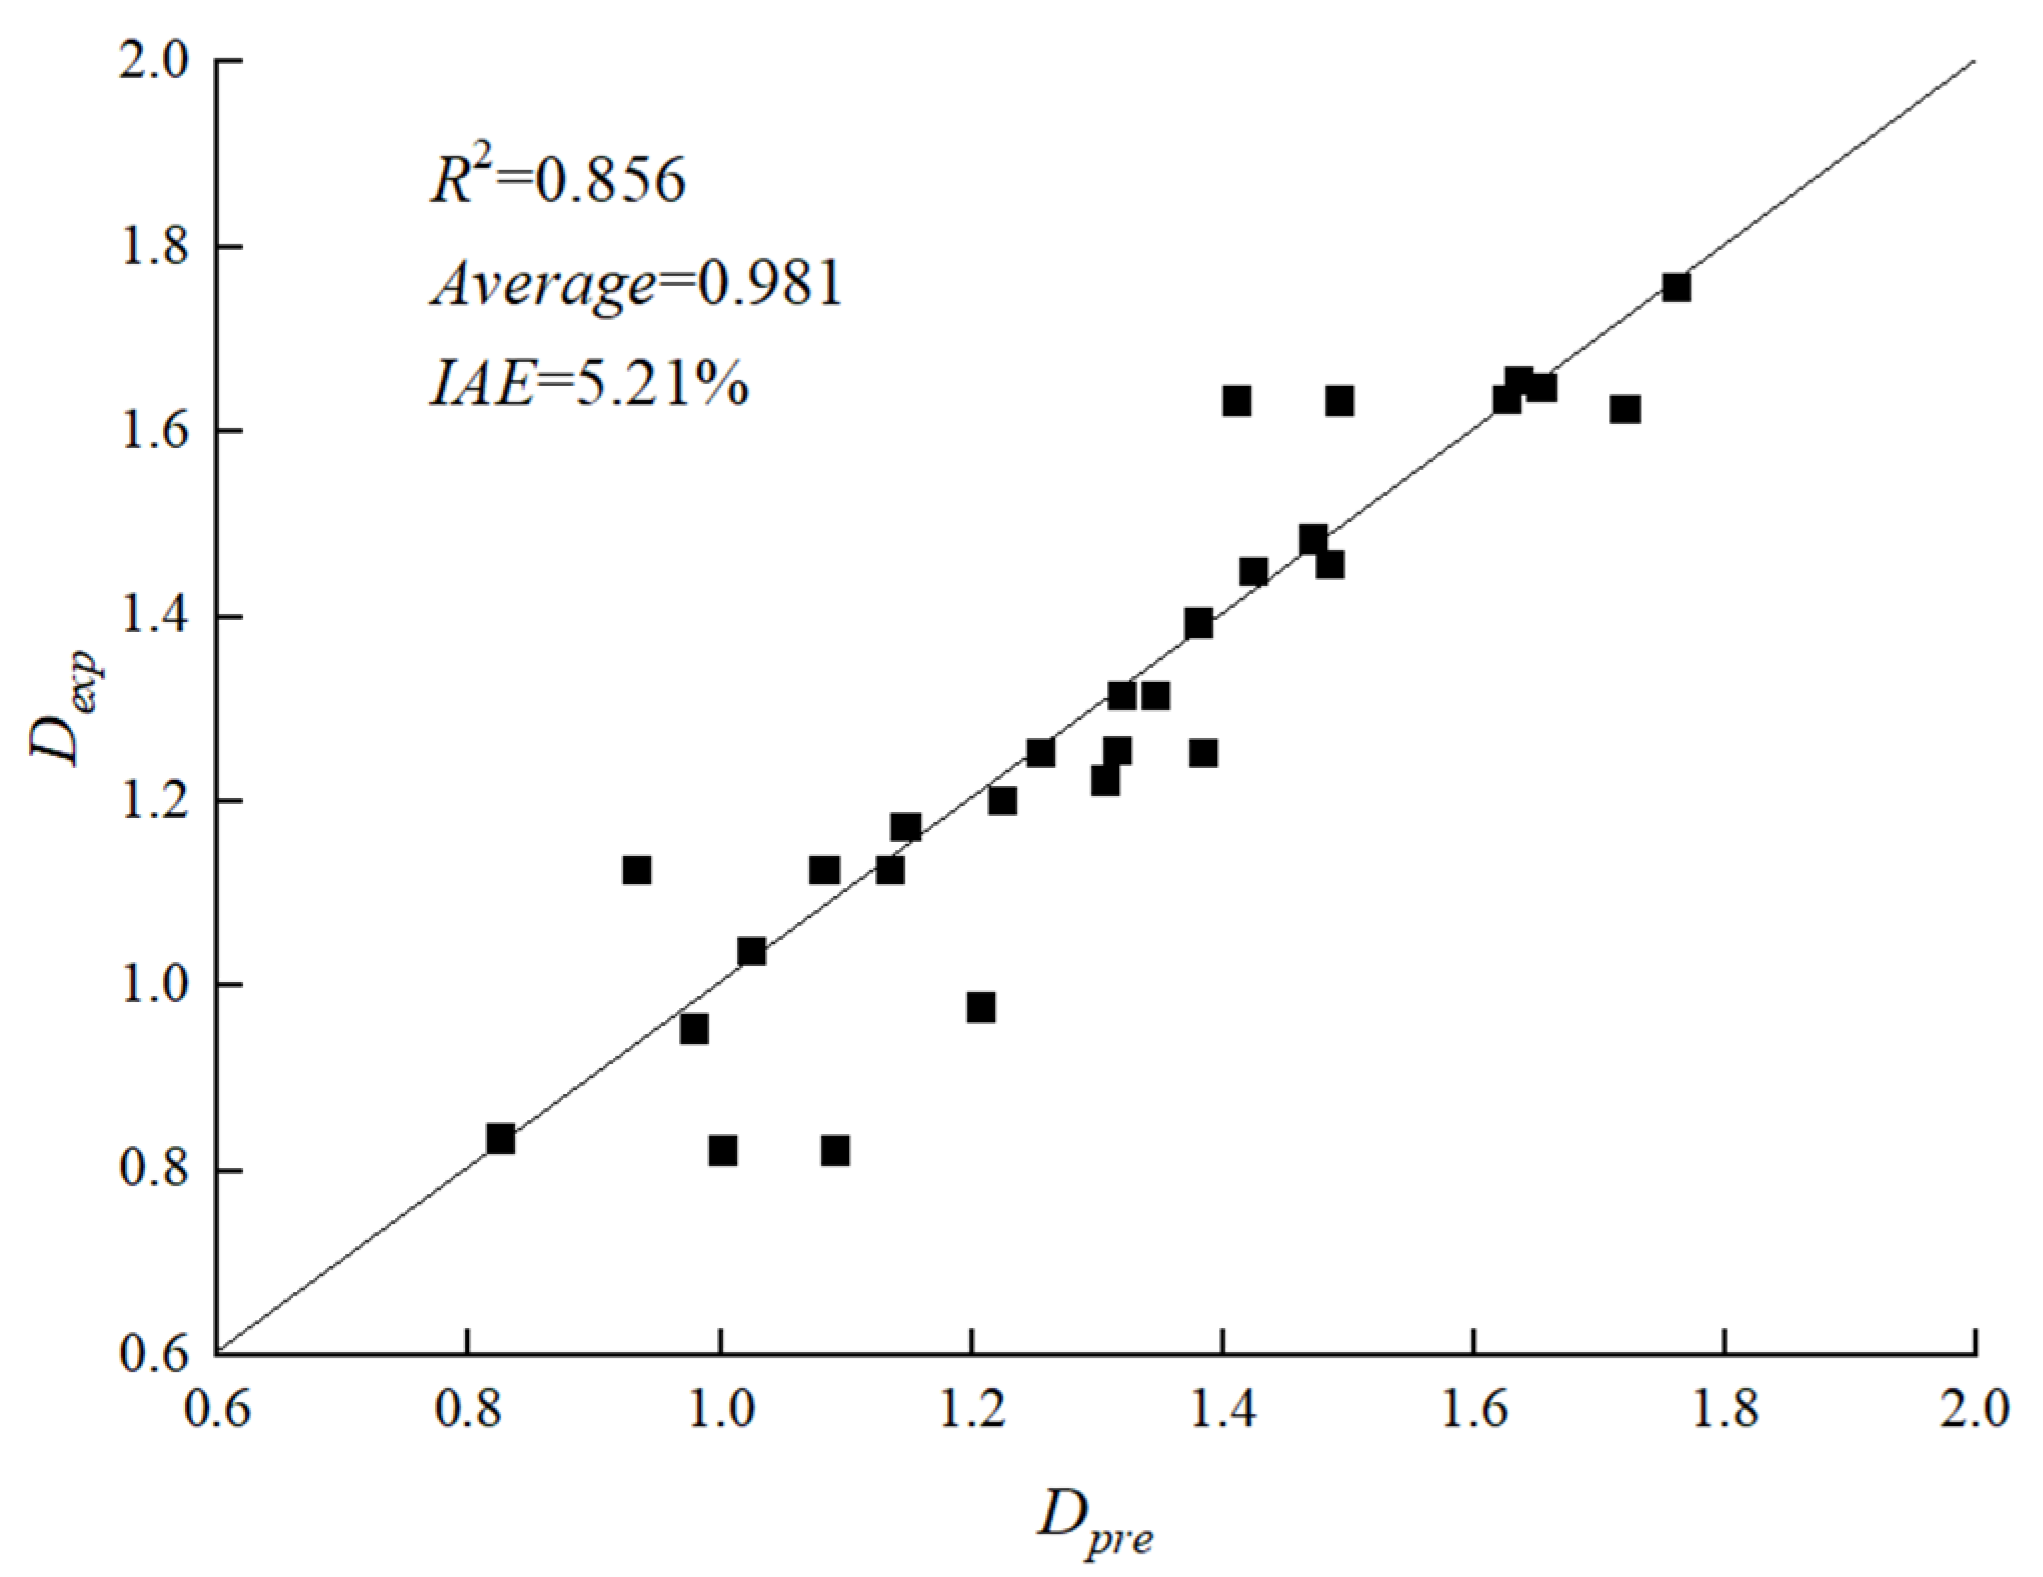
The relationship between the fractal dimension of the crack, the corrosion rate, and the steel bar diameter was established and the verification results are good. A new non-destructive detective method, based on this proposed relationship, can be developed to rapidly evaluate the corrosion behavior of a steel bar in deteriorated RC structures.
(4)
Finally, a relationship involving the fractal dimension of the crack, the corrosion rate, and the steel bar diameter was established, and verification results based on that relationship were favorable. A new non-destructive detection method based on this proposed relationship can be developed to rapidly evaluate the corrosion behavior of steel bars in deteriorated RC structures.

Author Contributions

Conceptualization, W.L. (Weiwen Li); methodology, T.S.; software, Z.P.; validation, Z.P.; investigation, Z.P.; data curation, P.Y.; writing—original draft preparation, M.W.; writing—review and editing, M.W.; writing—review and editing, W.L. (Wei Liu); writing—review and editing, J.L.; supervision, X.Y.; project administration, W.L. (Weiwen Li) All authors have read and agreed to the published version of the manuscript.

Funding

This research was funded by the National Natural Science Foundation of China (NSFC Grant Numbers: 51878415, 51908373).

Institutional Review Board Statement

Not applicable.

Informed Consent Statement

Not applicable.

Data Availability Statement

The data used to support the findings of this study are available from the corresponding author upon request.

Acknowledgments

Technical support is acknowledged from Guangdong Provincial Key Laboratory of Durability for Marine Civil Engineering (SZU), No. 2020B1212060074.

Conflicts of Interest

The authors declare no conflict of interest.

References

  1. Dong, B.; Fang, G.; Liu, Y.; Dong, P.; Zhang, J.; Xing, F.; Hong, S. Monitoring reinforcement corrosion and corrosion-induced cracking by X-ray microcomputed tomography method. Cem. Concr. Res. 2017, 100, 311–321. [Google Scholar] [CrossRef]
  2. Michel, A.; Pease, B.J.; Geiker, M.R.; Stang, H.; Olesen, J.F. Monitoring reinforcement corrosion and corrosion-induced cracking using non-destructive x-ray attenuation measurements. Cem. Concr. Res. 2011, 41, 1085–1094. [Google Scholar] [CrossRef]
  3. Zhao, Y.; Dong, J.; Wu, Y.; Wang, H.; Li, X.; Xu, Q. Steel corrosion and corrosion-induced cracking in recycled aggregate concrete. Corros. Sci. 2014, 85, 241–250. [Google Scholar] [CrossRef]
  4. Choi, Y.S.; Yi, S.T.; Kim, M.Y.; Jung, W.Y.; Yang, E.I. Effect of corrosion method of the reinforcing bar on bond characteristics in reinforced concrete specimens. Constr. Build. Mater. 2014, 54, 180–189. [Google Scholar] [CrossRef]
  5. Pradhan, B.; Bhattacharjee, B. Performance evaluation of steel bar in chloride contaminated concrete by corrosion rate. Constr. Build. Mater. 2009, 23, 2346–2356. [Google Scholar] [CrossRef]
  6. Patil, S.; Karkare, B.; Goyal, S. Acoustic emission vis-à-vis electrochemical techniques for corrosion monitoring of reinforced concrete element. Constr. Build. Mater. 2014, 68, 326–332. [Google Scholar] [CrossRef]
  7. Zaki, A.; Chai, H.; Aggelis, D.; Alver, N. Non-destructive evaluation for corrosion monitoring in concrete: A review and capability of acoustic emission technique. Sensors 2015, 15, 19069–19101. [Google Scholar] [CrossRef]
  8. Ying, Z.; Su, L. Relationship between Crack Width and Corrosion Ratio of Rebar. In Proceedings of the Fifth International Conference on Measuring Technology and Mechatronics Automation, Hong Kong, China, 16–17 January 2013. [Google Scholar]
  9. Shayanfar, M.A.; Barkhordari, M.A.; Ghanooni-Bagha, M. Effect of longitudinal rebar corrosion on the compressive strength reduction of concrete in reinforced concrete structure. Adv. Struct. Eng. 2016, 19, 897–907. [Google Scholar] [CrossRef]
  10. Alonso, C.; Andrade, C.; Rodriguez, J.; Diez, J.M. Factors controlling cracking of concrete affected by reinforcement corrosion. Mater. Struct. 1998, 31, 435–441. [Google Scholar] [CrossRef]
  11. Mandelbrot, B.B. Fractals: Form, Chance, and Dimension; W. H. Freeman: New York, NY, USA, 1977; p. 346. [Google Scholar]
  12. Mandelbrot, B.B.; Wheeler, J.A. The Fractal Geometry of Nature. J. R. Stat. Soc. 1983, 147, 468. [Google Scholar] [CrossRef]
  13. Wang, L.; Guo, X.; Yang, H.; Wang, Y.; Tang, S. Comparison of fly ash, PVA fiber, MgO and shrinkage-reducing admixture on the frost resistance of face slab concrete via pore structural and fractal analysis. Fractals 2021, 29, 2140002. [Google Scholar] [CrossRef]
  14. Diamond, S. Aspects of concrete porosity revisited. Cem. Concr. Res. 1999, 29, 1181–1188. [Google Scholar] [CrossRef]
  15. Qi, F.; Zhang, R.; Liu, X.; Niu, Y.; Zhang, H.; Li, H.; Li, J.; Wang, B.; Zhang, G. Soil particle size distribution characteristics of different land-use types in the Funiu mountainous region. Soil Tillage Res. 2017, 184, 45–51. [Google Scholar] [CrossRef]
  16. Huang, J.; Li, W.; Huang, D.; Wang, L.; Chen, E.; Wu, C.; Li, Y. Fractal analysis on pore structure and hydration of magnesium oxysulfate cements by first principle, thermodynamic and microstructure-based methods. Fractal Fract 2021, 5, 164. [Google Scholar] [CrossRef]
  17. Wang, L.; Song, X.; Yang, H.; Wang, L.; Tang, S.; Wu, B.; Mao, W. Pore structural and fractal analysis of the effects of MgO reactivity and dosage on permeability and F–T resistance of concrete. Fractal Fract. 2022, 6, 113. [Google Scholar] [CrossRef]
  18. Wang, L.; Luo, R.; Zhang, W.; Jin, M.; Tang, S. Effects of fineness and content of phosphorus slag on cement hydration, permeability, pore structure and fractal dimension of concrete. Fractals 2021, 29, 2140004. [Google Scholar] [CrossRef]
  19. Wei, X.; Wei, N. Fractal features of soil particle size distribution in layered sediments behind two check dams: Implications for the Loess Plateau, China. Geomorphology 2016, 266, 133–145. [Google Scholar] [CrossRef]
  20. Soto, M.A.; Chang, H.K.; Van Genuchten, M.T. Fractal-based models for the unsaturated soil hydraulic functions. Geoderma 2017, 306, 144–151. [Google Scholar] [CrossRef]
  21. Yang, H.M.; Zhang, S.M.; Wang, L.; Chen, P.; Shao, D.K.; Tang, S.W.; Li, J.Z. High ferrite Portland cement with slag: Hydration, microstructure, and resistance to sulfate attack at elevated temperature. Cem. Concr. Compos. 2022, 130, 104560. [Google Scholar] [CrossRef]
  22. Wang, L.; Jin, M.; Guo, F.; Wang, Y.; Tang, S. Pore structural and fractal analysis of the influence of fly ash and silica fume on the mechanical property and abrasion resistance of concrete. Fractals 2021, 29, 2140003. [Google Scholar] [CrossRef]
  23. Konkol, J.; Prokopski, G. Fracture toughness and fracture surfaces morphology of metakaolinite-modified concrete. Constr. Build. Mater. 2016, 123, 638–648. [Google Scholar] [CrossRef]
  24. Restuccia, L.; Reggio, A.; Ferro, G.A.; Kamranirad, R. Fractal analysis of crack paths into innovative carbon-based cementitious composites. Theor. Appl. Fract. Mec. 2017, 90, 133–141. [Google Scholar] [CrossRef]
  25. Armandei, M.; Sanchez, E.D. Correlation between fracture roughness and material strength parameters in SFRCs using 2D image analysis. Constr. Build. Mater. 2017, 140, 82–90. [Google Scholar] [CrossRef]
  26. Carpinteri, A.; Lacidogna, G.; Pugno, N. A fractal approach for damage detection in concrete and masonry structures by the acoustice mission technique. Acoust. Tech. 2004, 38, 31–37. [Google Scholar]
  27. Carpinter, A.; Lacidogna, G.; Niccolini, G.; Puzzi, S. Critical defect size distributions in concrete structures detected by the acoustic emission technique. Meccanica 2008, 43, 349–363. [Google Scholar] [CrossRef]
  28. Hadjileontiadis, L.J.; Douka, E.; Trochidis, A. Fractal dimension analysis for crack identification in beam structures. Mech. Syst. Signal. Processing 2005, 19, 659–674. [Google Scholar] [CrossRef]
  29. Code for Design of Concrete Structures, GB50010-2015; China Architecture and Building Press: Beijing, China, 2015.
  30. Yang, X.; Pan, Z.J.; Li, W.W.; Xing, F. Bonding Performance of Fiber-Reinforced Polymer-to-Concrete Joints under the Effect of Corrosion Cracking. J. Mater. Eng. Perform. 2020, 29, 342–357. [Google Scholar] [CrossRef]
  31. Tsoeleng, L.T.; Odindi, J.; Mhangara, P.; Malahlela, O. Assessing the performance of the multi-morphological profiles in urban land cover mapping using pixel based classifiers and very high resolution satellite imagery. Sci. Afr. 2020, 10, e00629. [Google Scholar] [CrossRef]
  32. Maaddawy, T.A.E.; Soudki, K.A. Effectiveness of Impressed Current Technique to Simulate Corrosion of Steel Reinforcement in Concrete. J. Mater. Civil. Eng. 2003, 15, 41–47. [Google Scholar] [CrossRef]
  33. Gu, X.; Zhang, W.; Huang, Q. Accelerated corrosion technique for reinforcement steel bars in concrete. J. Struct. Eng. 2009, 25, 101–105. [Google Scholar]
  34. Farhidzadeh, A.; Dehghan-Niri, E.; Moustafa, A.; Salamone, S.; Whittaker, A. Damage assessment of reinforced concrete structures using fractal analysis of residual crack patterns. Exp. Mech. 2013, 53, 1607–1619. [Google Scholar] [CrossRef]
  35. Issa, M.A.; Issa, M.A.; Islam, M.S.; Chudnovsky, A. Fractal dimension––a measure of fracture roughness and toughness of concrete. Eng. Fract. Mech. 2003, 70, 125–137. [Google Scholar] [CrossRef]
  36. Raghavendra, B.S.; Dutt, N.D. Computing fractal dimension of signals using multiresolution box-counting method. Int. J. Inf. Math. Sci. 2010, 6, 50–65. [Google Scholar]
  37. Tong, J. Analysis on Entire Period of Corrosion-Induced Crack of Reinforced Concrete Based on Digital Image Correlation Method. Ph.D. Thesis, Zhejiang University, Zhejiang, China, 2005. [Google Scholar]
  38. Yoshiyuki, M.; Kiyoshi, M.; Koji, T.; Hiromichi, S. A study on shear reinforcement of reinforced concrete beams externally bonded with carbon fiber sheets. Compos. Interfaces 1997, 5, 285–295. [Google Scholar]
Figure 1. Geometry size of specimen (unit: mm).
Fractalfract 06 00325 g001
Figure 2. Accelerated corrosion test for the steel bar [33].
Fractalfract 06 00325 g002
Figure 3. Schematic diagram of box-counting method.
Fractalfract 06 00325 g003
Figure 4. Flowchart of the proposed algorithm.
Fractalfract 06 00325 g004
Figure 5. Schematic diagram of binary method conversion: (a) Original image of G6.5-2 crack; (b) Binary graph of G6.5-2 crack; (c) Binary matrix of G6.5-2 crack.
Fractalfract 06 00325 g005
Figure 6. Binary graph of corrosion-induced cracks with different corrosion degrees and steel bar diameters: (a) Binary graph of rust expansion crack with d = 6.5 mm; (b) Binary graph of rust expansion crack with d = 8 mm; (c) Binary graph of rust expansion crack with d = 10 mm.
Fractalfract 06 00325 g006aFractalfract 06 00325 g006b
Figure 7. Double logarithm diagram for fractal dimension of specimens with different corrosion degrees: (a) Double logarithm graph of d = 6.5 mm fractal dimension; (b) Double logarithm graph of d = 8 mm fractal dimension; (c) Double logarithm graph of d = 10 mm fractal dimension.
Fractalfract 06 00325 g007aFractalfract 06 00325 g007b
Figure 8. Relationship between fractal dimension and corrosion rate.
Fractalfract 06 00325 g008
Figure 9. Relationship between corrosion rate and scale coefficient.
Fractalfract 06 00325 g009
Figure 10. Comparison of experimental and predicted values of fractal dimension.
Fractalfract 06 00325 g010
Table 1. The basic properties of HPB300.
Reinforcement Diameter
(mm)
Yield Strength
(MPa)
Modulus of Elasticity
(GPa)
6.5326218
8321
10338
Table 2. Parameters and results of specimens.
Specimen LabelReinforcement Diameter
(mm)
Theoretical Corrosion Rate
(%)
A10100
B6.56.55
B885
B10105
C6.56.510
C8810
C101010
D6.56.515
D8815
D101015
E6.56.520
E8820
E101025
F6.56.525
F8825
F101025
G6.56.530
G8830
G101030
Table 3. Calculation parameters δ and N of fractal dimension.
d = 6.5 mmδNd = 8 mmδNd = 10 mmδN
C6.5-212634C8-314168C10-418052
213762197223036
39823135531825
47974104341296
5676587451037
D6.5-215083D8-217867D10-3117,866
222672310826449
315023197433858
411364142142460
59345114051980
E6.5-118952E8-3114,950E101
23401255072
32123333503
41537423724
51223518815
F6.5-2124,048F8-1136,094F10-1142,763
28242211,790212,762
345153650936531
430554440044136
522565329352916
G6.5-2142,792G8-3167,192G10-4181,454
213,751220,265223,004
36886310,422311,394
442704656246404
530295464254824
Publisher’s Note: MDPI stays neutral with regard to jurisdictional claims in published maps and institutional affiliations.

