Article

Correlation Analysis between Rail Track Geometry and Car-Body Vibration Based on Fractal Theory

1
College of Urban Transportation and Logistics, Shenzhen Technology University, Shenzhen 518118, China
2
School of Urban Railway Transportation, Shanghai University of Engineering Science, Shanghai 201620, China
3
College of Transportation Engineering, Tongji University, Shanghai 201804, China
*
Author to whom correspondence should be addressed.
Fractal Fract. 2022, 6(12), 727; https://doi.org/10.3390/fractalfract6120727
Submission received: 6 November 2022 / Revised: 2 December 2022 / Accepted: 5 December 2022 / Published: 9 December 2022
(This article belongs to the Special Issue Fractal Analysis and Its Applications in Geophysical Science)

Abstract

:
The effect of track geometry on vehicle vibration is a major concern in high-speed rail (HSR) operation from the perspectives of ride comfort and safety. However, how to quantitatively characterize the relation between them remains a problem to be solved in track quality assessment. By using fractal analysis, this paper studies the detailed correlation between track surface and alignment irregularities and car body vertical and lateral acceleration in various wavelength ranges. The time-frequency features of the track irregularity and car-body acceleration are first analyzed based on empirical mode decomposition (EMD). Then, the fractal features of the inspection data are determined by calculating the Hurst exponent of their intrinsic mode functions (IMFs). Finally, the fractal dimensions of the track irregularity and car-body acceleration are obtained, and the correlation between their fractal dimensions with respect to different IMFs is revealed using regression analysis. The results show that the fractal dimension is only related to the roughness of the IMF waveforms of the track irregularity and car-body vibration and is irrelevant to the amplitude of the time series of the data; the correlation coefficient of the fractal dimension of the track irregularity and car-body acceleration is greater than 0.7 for wavelengths greater than 30 m, indicating that the relationship between track irregularity and car-body vibration acceleration is more obvious for long wavelengths. The findings of this research could be used for optimizing HSR track maintenance work from the viewpoint of the ride quality of high-speed trains.

1. Introduction

In the past few decades, high-speed rail (HSR), characterized by excellent operation safety and ride comfort, has developed rapidly all over the world. In high-speed rail (HSR) systems, the ride comfort and safety of high-speed train are closely related to the track irregularities, which is the main excitation source of the vehicle–track system. To ensure the requirement of high ride quality of HSR, the geometric condition of the track structure should be maintained carefully [1]. In HSR track maintenance, the requirements for the control of track geometry deviation and vehicle vibration are strict. For example, in Chinese HSR, the control limits of track surface and alignment irregularities are ±2 mm, whilst the control limits of car body vertical and lateral acceleration are ±1 m/s2 and ±0.6 m/s2, respectively [2]. In most cases, the newly built lines can satisfy these requirements. However, for the lines which have operated for more than ten years, though the geometric condition remains good, the car-body acceleration always exceeds the limit, according to the inspection results. Note that the track irregularity is the main excitation source of the vehicle–track system [3,4,5] and can even affect the dynamic performance of the pantograph-catenary system [6]. Therefore, to reveal the root cause of the deterioration of ride quality, it is necessary to conduct in-depth research on the relationship between track geometry and vehicle vibration.
In recent years, the relationship between track geometry and car-body acceleration has been intensively studied, either by modeling of the vehicle–track system or by the analysis of track inspection data. The main purpose of establishing the vehicle–track model is to assess the effect of track irregularity on the dynamic response of the vehicle system with respect to different wavelengths [7] and formulate the corresponding management limits for track irregularities [8,9]. To further consider the long-term dynamic performance of the vehicle–track system, some novel methods are used, such as the spectral evolution model [10], the wheel-rail surrogate model [11], the neural network model [12], etc. However, these studies mainly focus on the feature of the vehicle–track system response, rather than the detailed correlation between the track irregularity and vehicle response. In addition, due to the limited accuracy of the dynamic models, it is difficult to quantitatively analyze the correlation between track irregularity and vehicle vibration. The research on the correlation between the two is mainly based on the analysis of the track inspection data, thanks to the rapid development of advanced high-speed track inspection trains. With the masses track irregularity and car-body vibration acceleration data, which are synchronously acquired, the correlation analysis can be easily conducted. These studies are mainly carried out from the aspects of track defect detection [13,14], serviceability assessment for rail infrastructure [15,16], track maintenance scheduling [17,18], etc. In these studies, the feature and distribution of the track irregularity and vehicle vibration are mainly discussed in the time domain. Yet, the detailed relationship between the two at different frequency ranges has not attracted sufficient attention. Consequently, the excessive vibration excited by the track irregularity at sensitive wavelength bands has not been revealed adequately.
An effective solution to this problem is to conduct time-frequency analysis of the track inspection data. Among the time-frequency analysis methods, empirical mode decomposition (EMD), an adaptive function which does not require predetermined basis functions, has been proven to be suitable for non-stationary signals, such as track irregularities and vehicle responses [13,19]. However, the meso-feature at different frequency ranges of the inspection data needs further study to quantitatively analyze the relationship between the track irregularity and corresponding car-body vibration.
In view of this, this research studies the fractal characteristics of the track irregularity and car-body acceleration, and the correlation between their fractal dimensions in various wavelength bands. The rest of this paper is organized as follows: Section 2 analyzes the time-frequency characteristics of track irregularity and car-body vibration acceleration based on EMD. In the Section 3, the fractal characteristics of track irregularity and car-body vibration acceleration are determined, and the calculation method of fractal dimension is given. In the Section 4, the mapping relationship between track irregularity and car-body acceleration with respect to fractal dimension is established in a quantitative manner. Lastly, some concluding remarks of this paper are given in the Section 5.

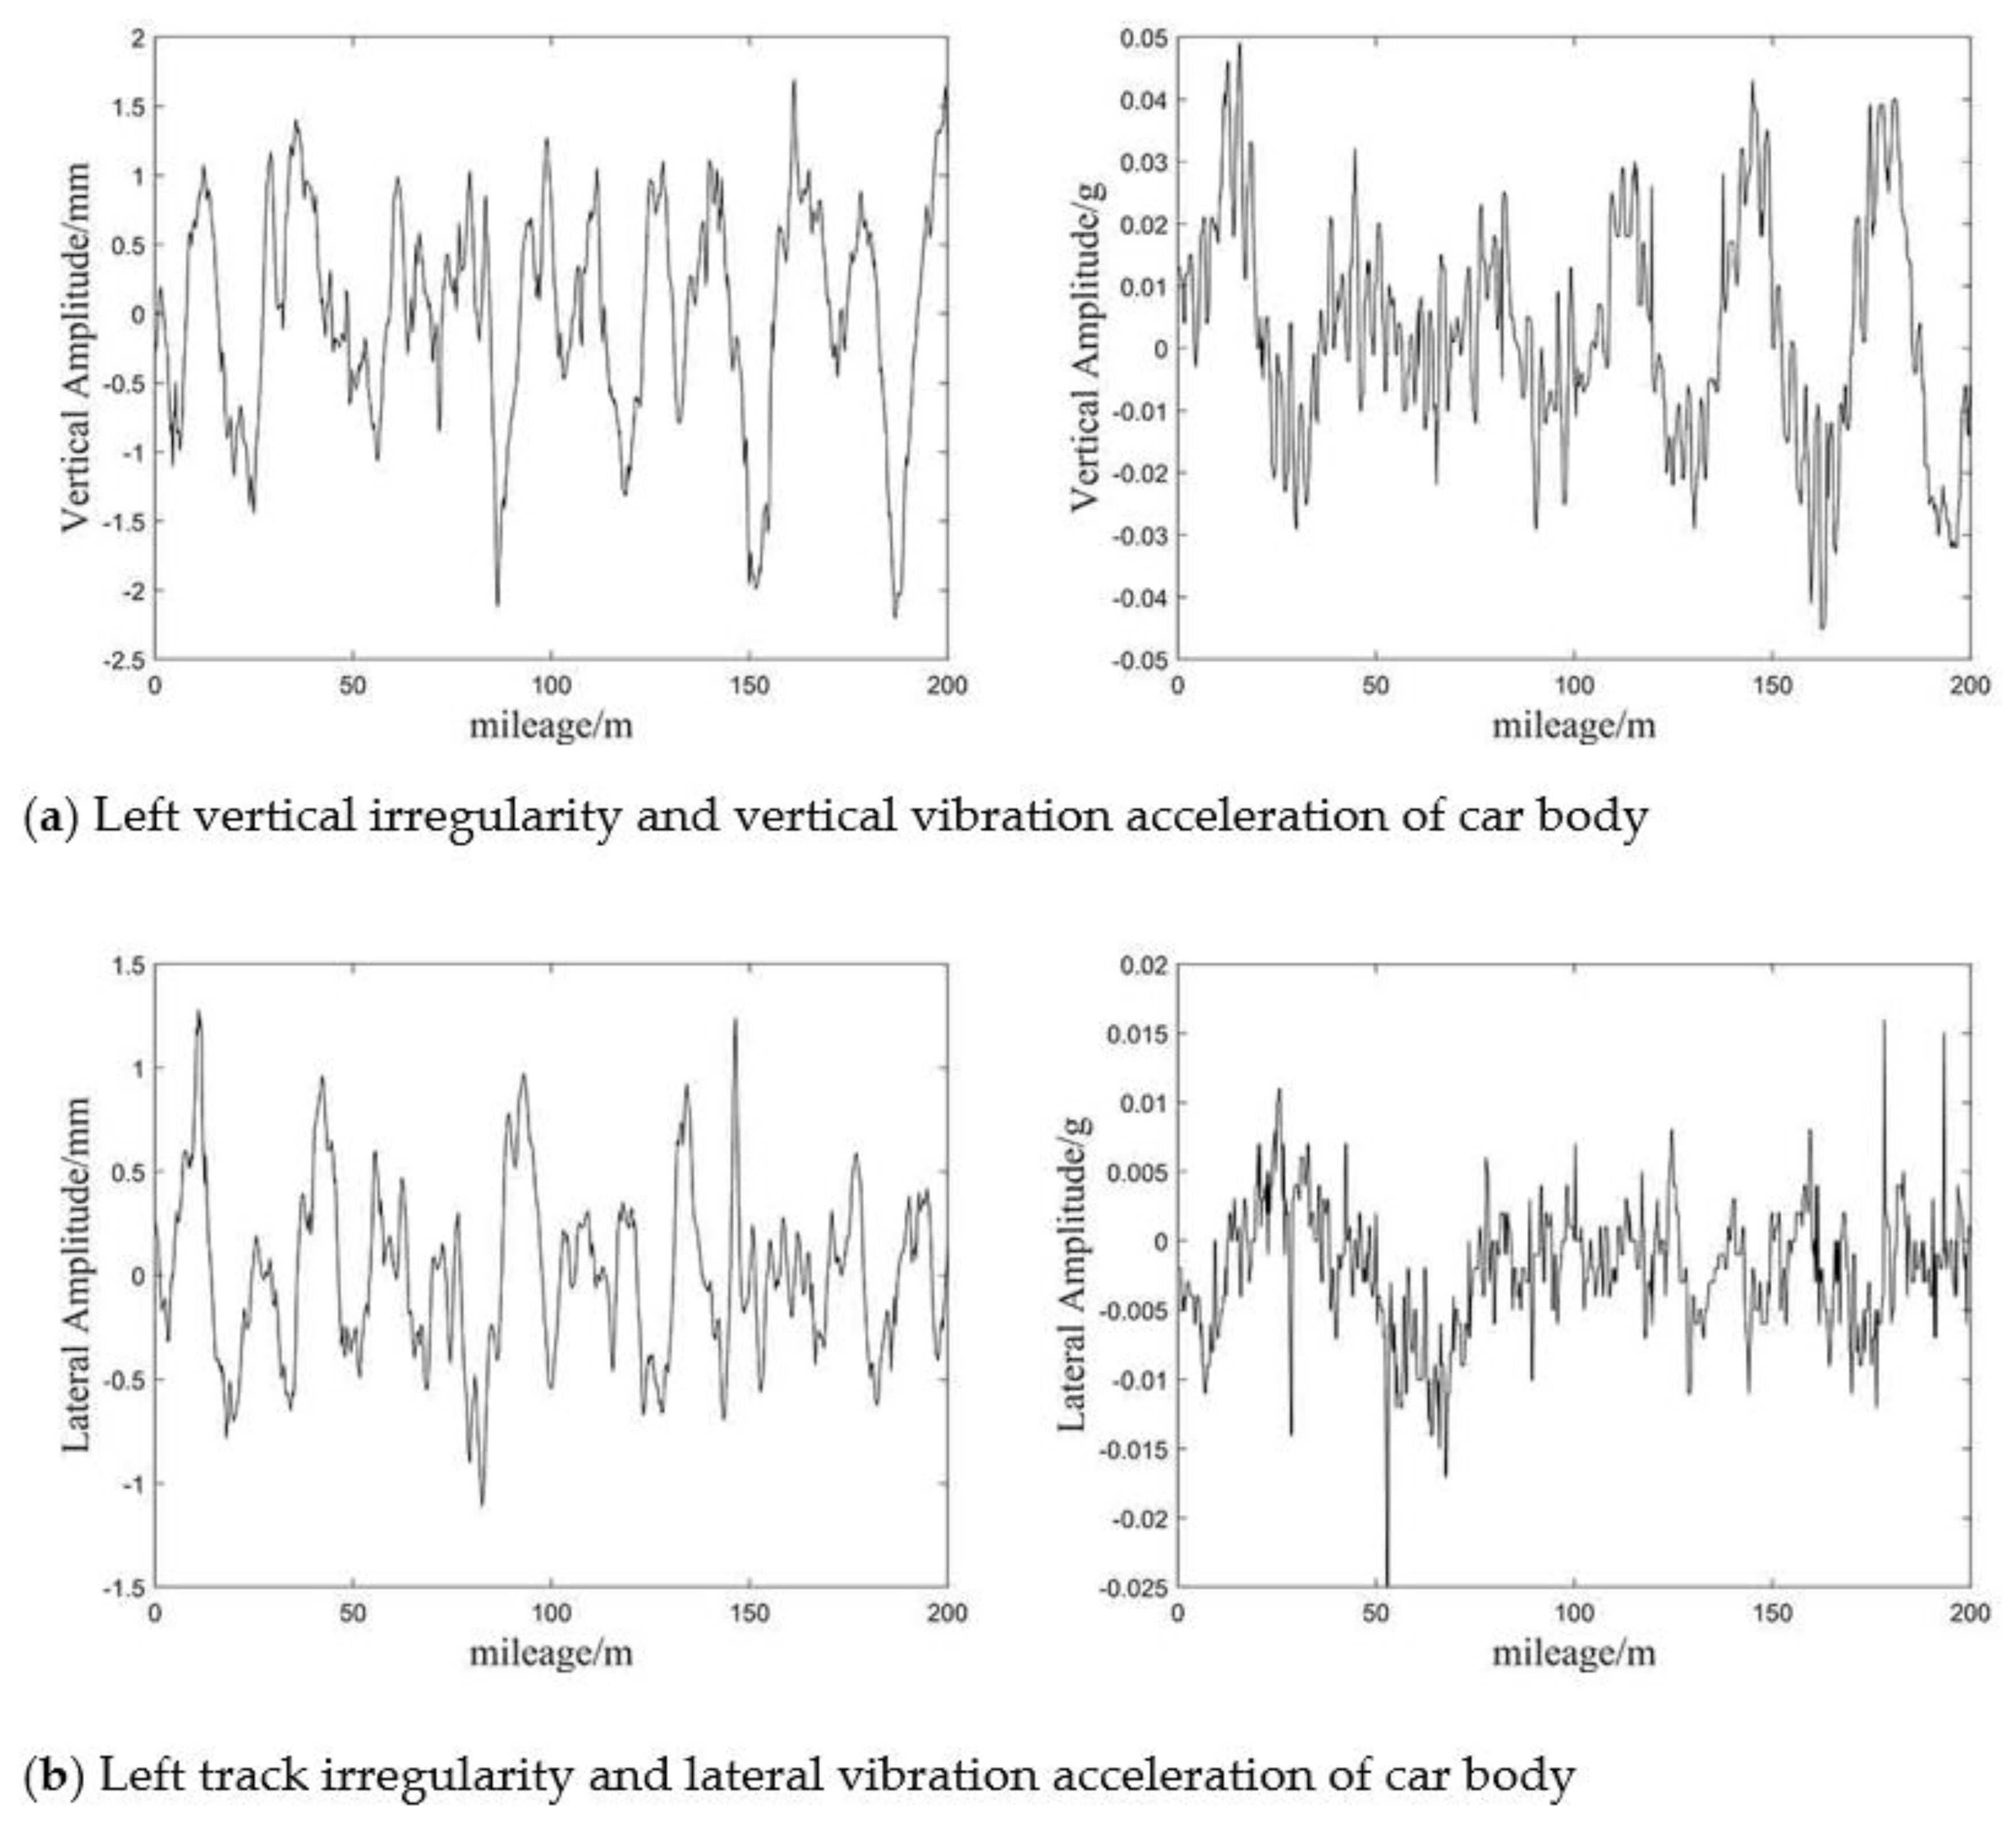
2. Time-Frequency Analysis of Track Geometry and Car-Body Vibration Data

Track irregularity is the excitation of vehicle vibration, and the relationship between them has been intensively studied based on the vehicle–track coupling models developed by previous studies [20]. However, because the track irregularity is a random process [21], the vibration response of the vehicle–track system also presents strong randomicity, so the car-body vibration acceleration cannot be expressed by a deterministic function. As a result, the response features have rarely been quantitatively expressed in previous research. For the purpose of exploring the relationship between track irregularity and car-body vibration, this paper uses empirical mode decomposition (EMD) [19], an effective time-frequency analysis method, to calculate their IMFs. It has been found by previous research that the track surface and alignment irregularities are the excitation sources of the vertical and lateral vibration of the car body, respectively; the two types of track irregularities can be considered uncorrelated [11,22]. In this regard, this paper mainly analyzes the correlation between the surface irregularity of the track and the vertical acceleration of the car body, and that between the track-alignment irregularity and the lateral acceleration of the car body.
The samples of track irregularities and car-body accelerations were collected by a high-speed track geometry car running on the Chinese high-speed rail networks. Track irregularities were measured under wheel load at a sampling interval of 0.25 m. The car body responses, including vertical and lateral accelerations, were collected synchronously with the track irregularities. Figure 1 shows the time series of the track surface irregularity, car-body vertical acceleration, track-alignment irregularity, and car-body lateral acceleration. The data, which correspond to an HSR line section with a length of 200 m, were collected by a high-speed track inspection train. This train, named Comprehensive Inspection Train (CIT), can conduct inspection of both track geometry and vehicle vibration at high speed (>200 km/h). The sampling rate is 4 per meter.
It can be seen in Figure 1 that there is no obvious correlation between the track irregularity and car-body acceleration in the time domain. This is probably because of the strong damping effect of the secondary suspension system of the high-speed train, which increases the complexity of the car body’s dynamic responses. However, in essence, the car-body vibration is caused by track irregularity, and the suspension system only reduces the car-body vibration energy in some frequency ranges. Consequently, the car-body vibration energy is redistributed in different frequency ranges, and the relationship between track irregularity and car-body vibration acceleration becomes unclear in the time domain.
With the recognition of this, an effective time-frequency analysis method is necessary to explore the correlation between track irregularity and car-body vibration in different frequency ranges. The time-frequency analysis method is superior to conventional time-domain and frequency-domain analysis in determining the time-space distribution characteristics of track irregularity and car-body vibration. EMD, which has obvious advantages in dealing with non-stationary data, is used to decompose both the track irregularity and car-body acceleration data. The decomposition results are shown in Figure 2 and Figure 3. It can be seen in Figure 2 and Figure 3 that eight IMFs of track irregularity and car-body vibration acceleration were obtained by EMD. Each IMF was adaptively decomposed from the inspection data in the order of short wave to long wave. The IMFs represent the time series at the corresponding frequency ranges, which can be determined by calculating the power spectral densities (PSDs) of the IMFs.
By comparing the IMFs of track irregularity and car-body vibration acceleration, it can be seen that some peak values of the acceleration data are found at the time when the track irregularity also reaches a large amplitude, but the detailed patterns of the waveforms have great differences. This indicates that a large amplitude of track irregularity at certain frequency ranges can cause an increase in the dynamic response of the car body, but it is difficult to establish a one-to-one mapping relationship directly from the IMF waveforms. Therefore, the meso-variance in the time series of the IMFs should be studied to explore inherent characteristics of irregularity and acceleration data.

3. Fractal Properties of Track Geometry and Car-Body Acceleration

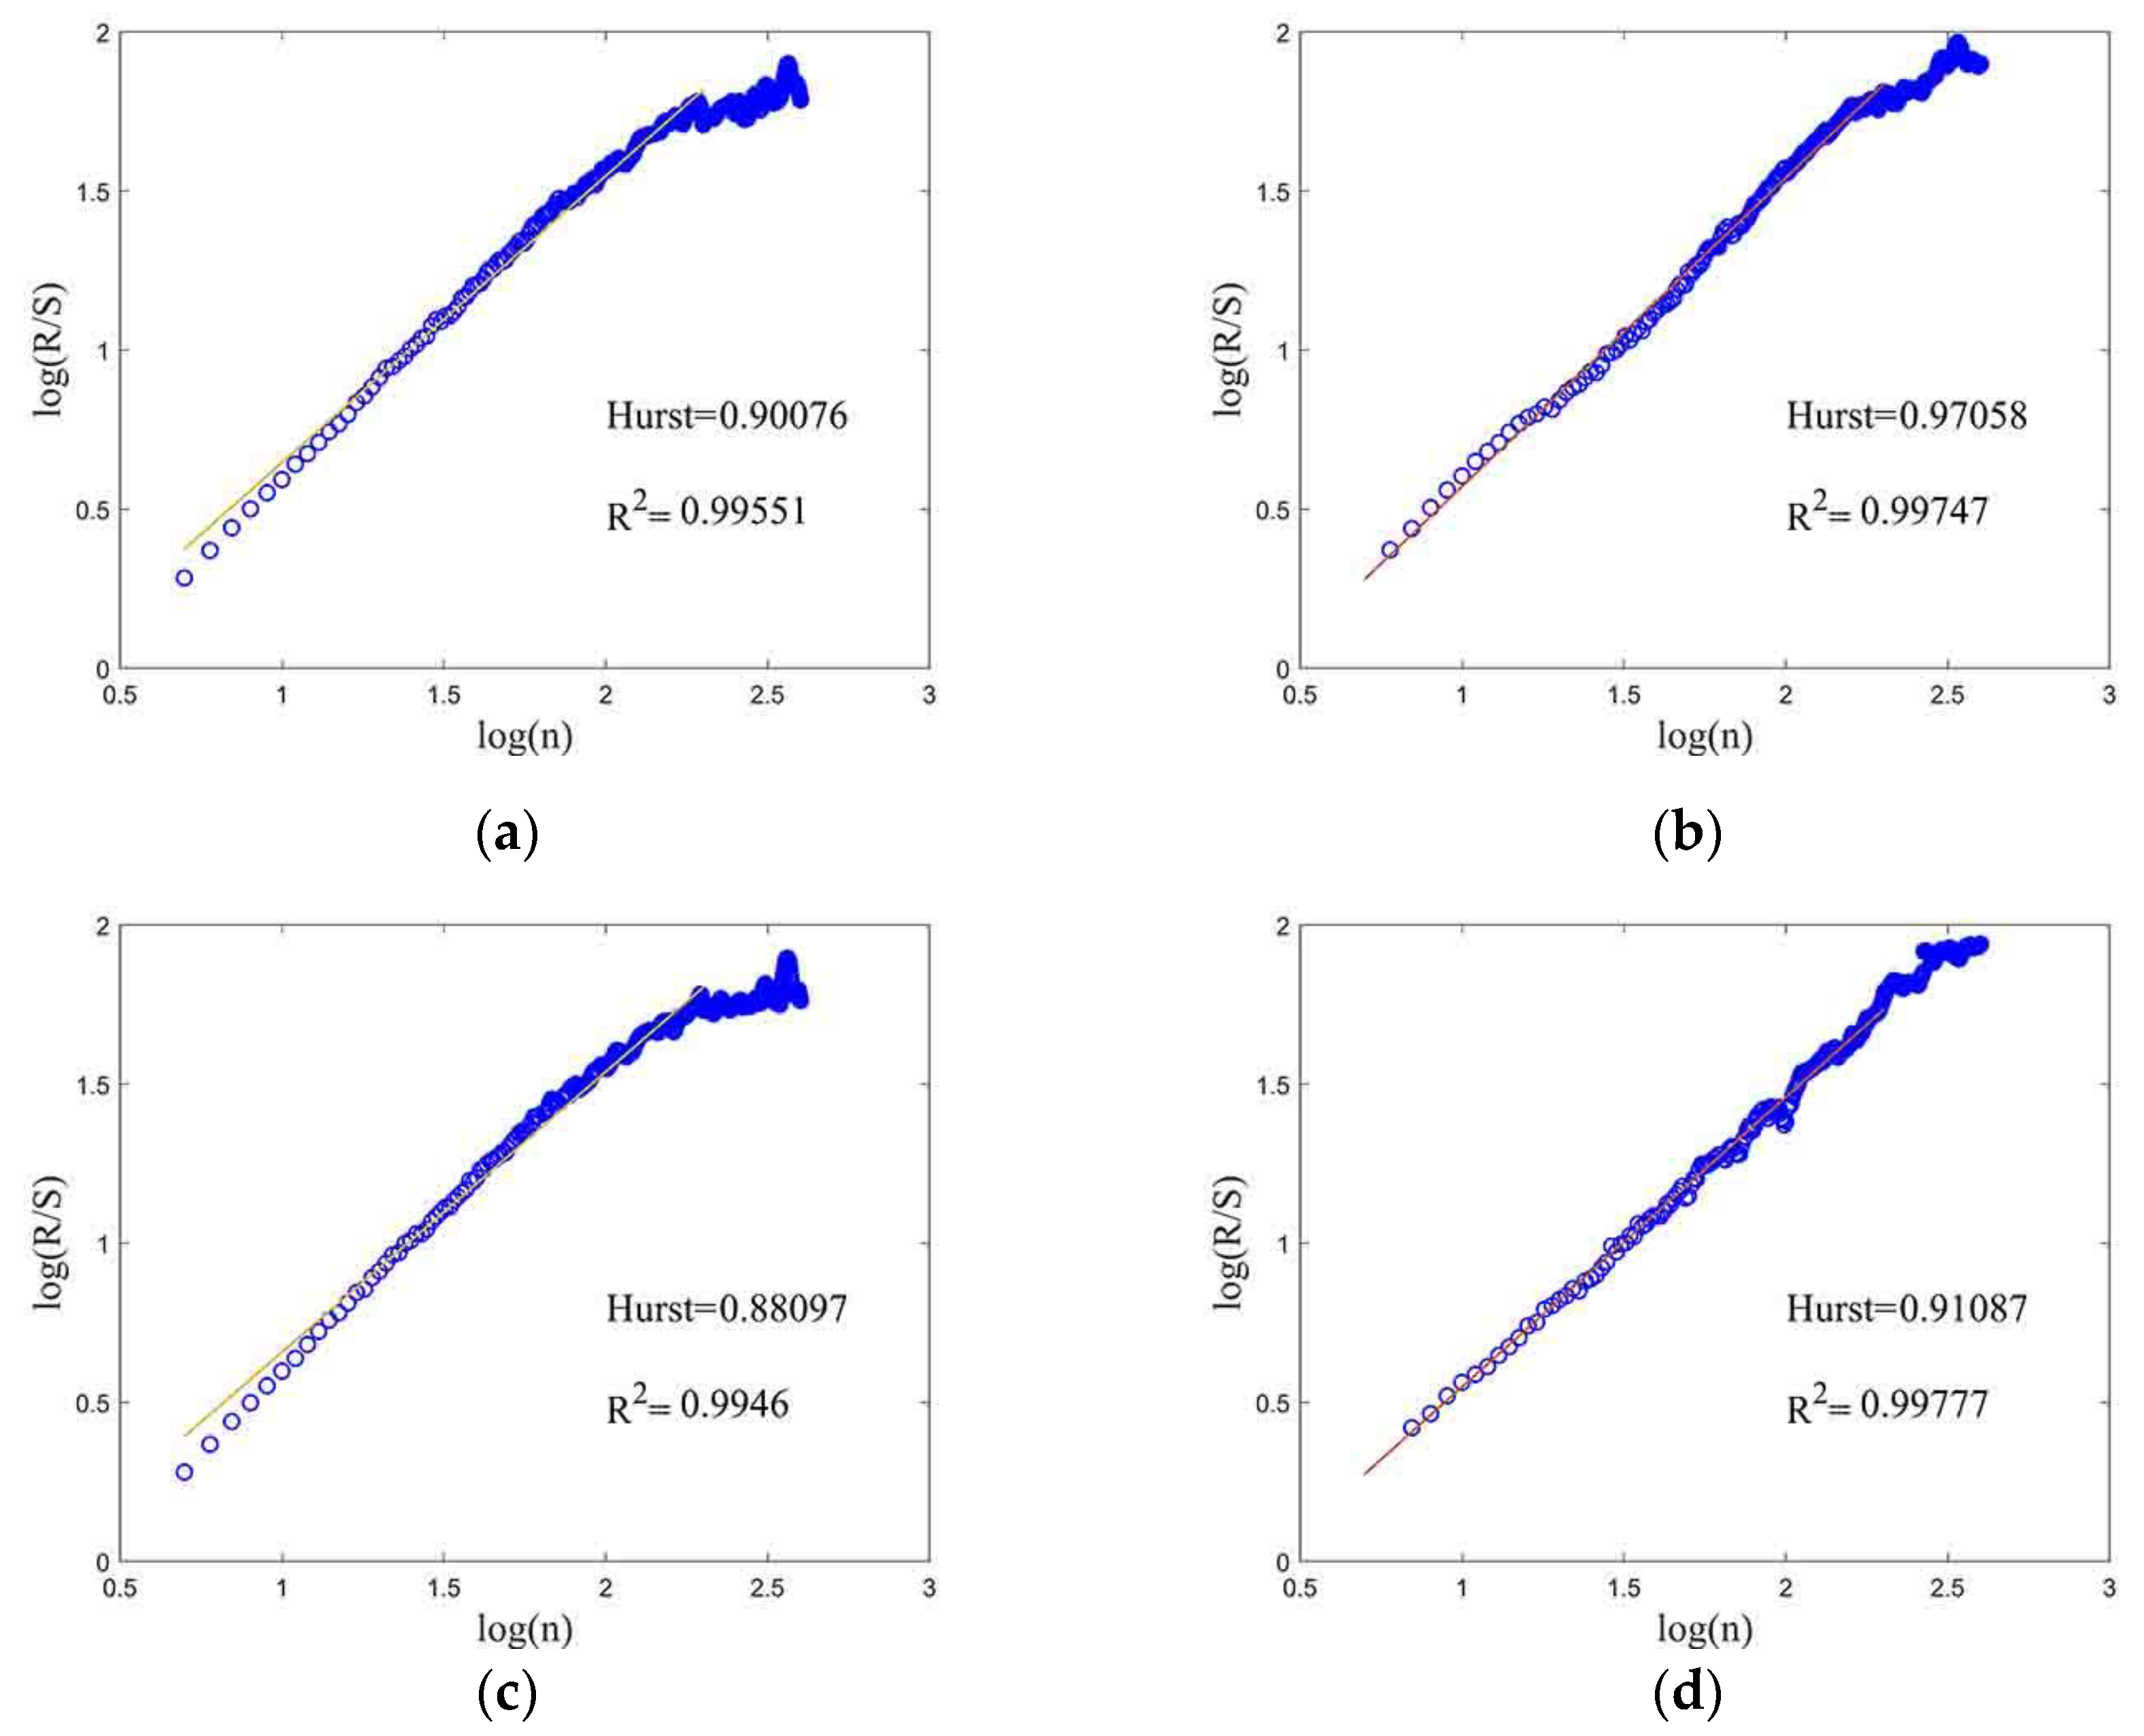
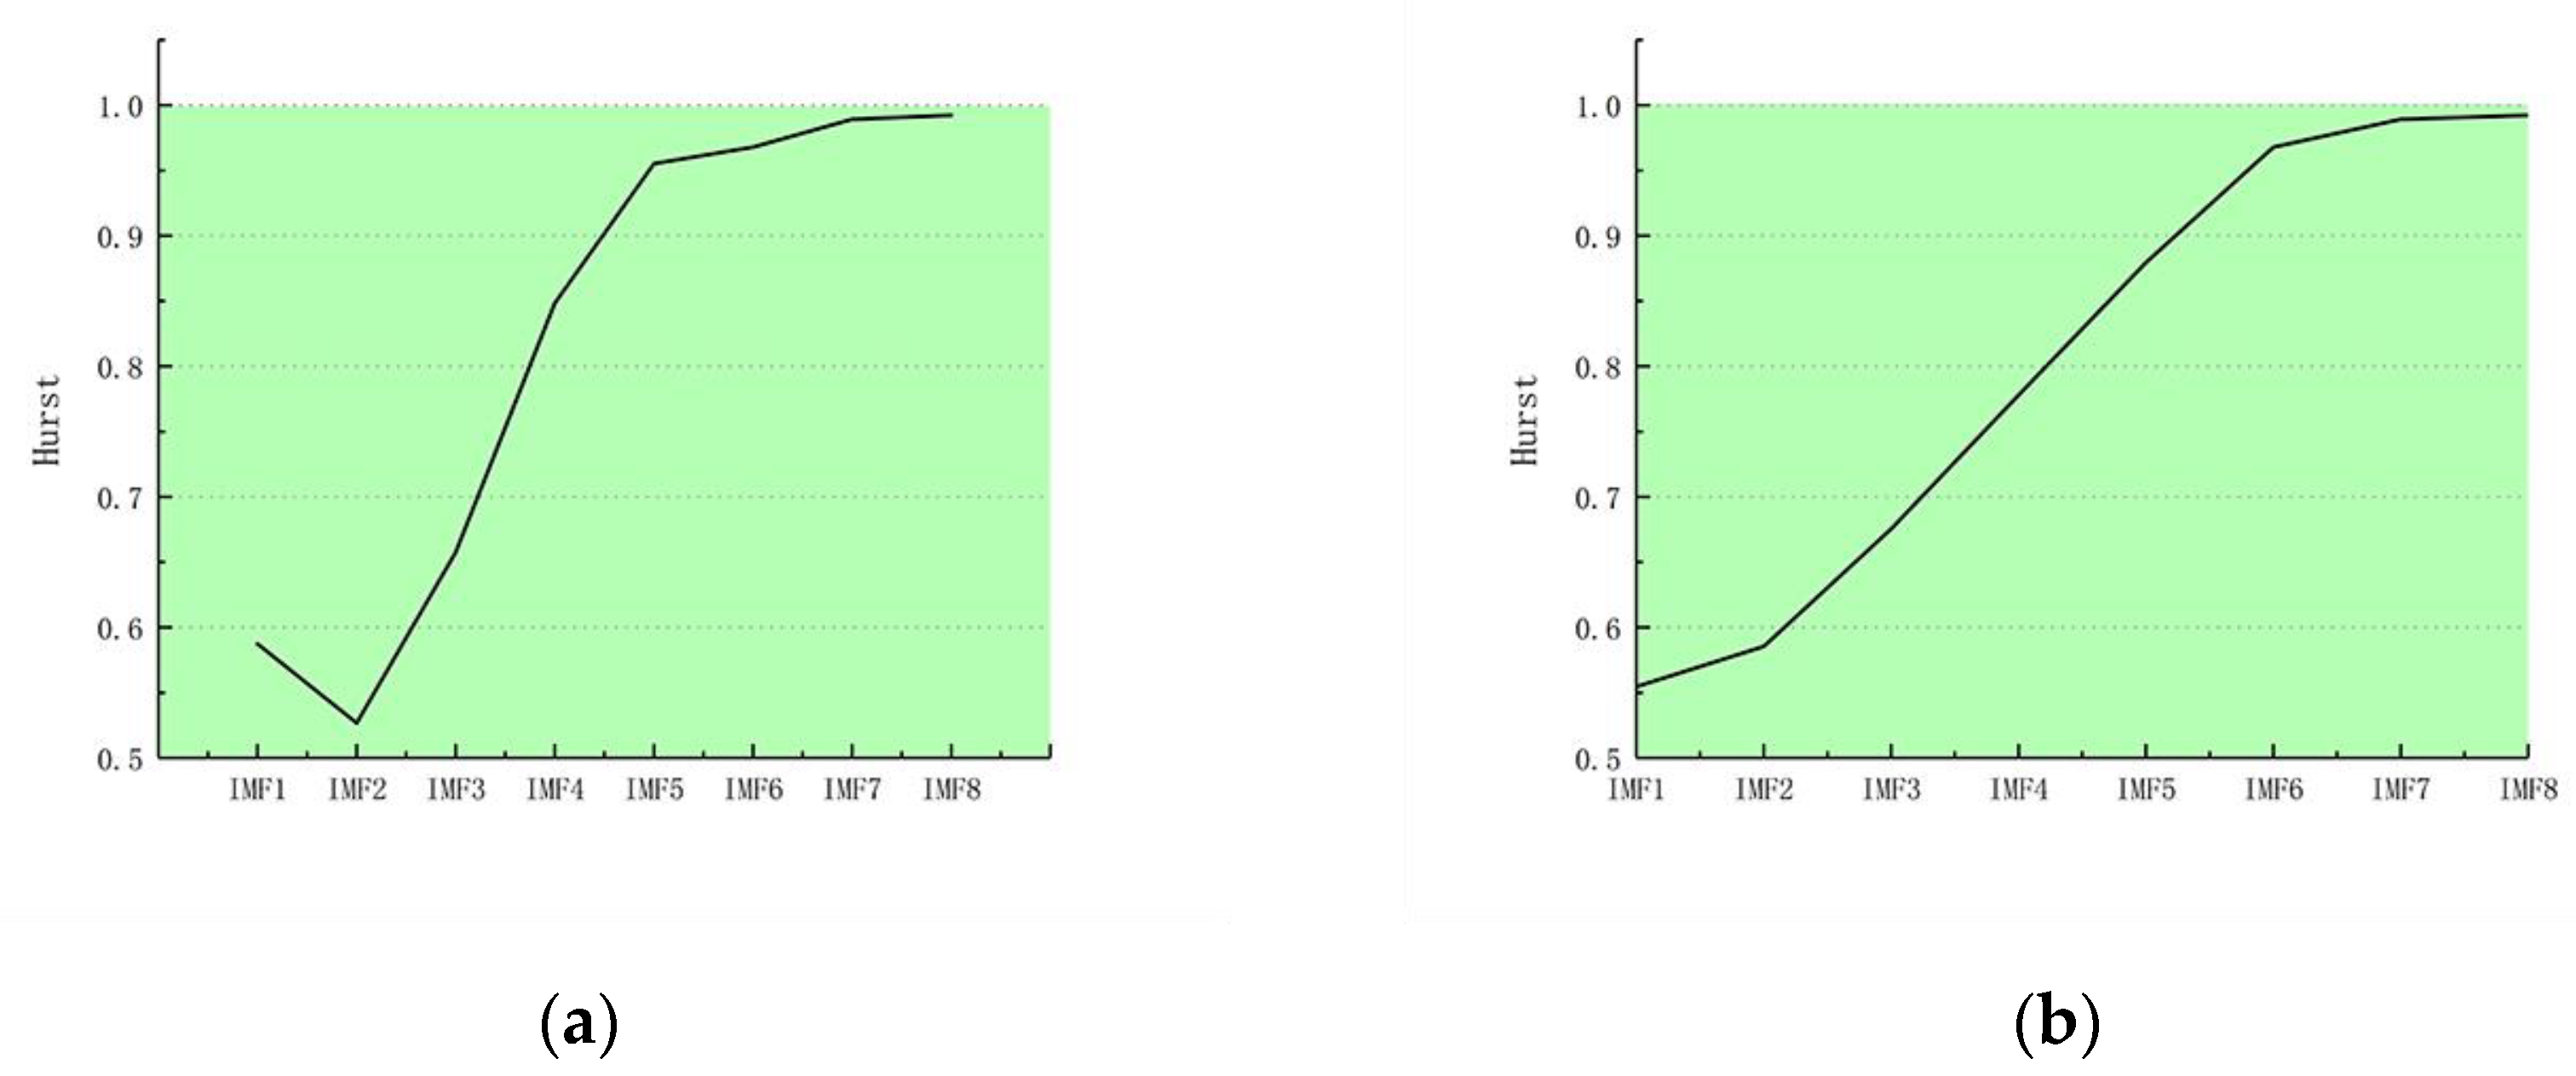
3.1. Self-Similarity Analysis

Fractal analysis, as a nonlinear theory, has attracted a great amount of attention in recent years. In fractal theory, the irregularity of fractal objects can be described as the fractal dimension [23,24]. It is generally believed that fractal objects need to have the properties of self-similarity and scale-invariance [25,26]. Therefore, before calculating the fractal dimensions, it is necessary to determine whether the track irregularity data and car-body acceleration data satisfy such fractal properties.
Considering that the track irregularity and car-body vibration acceleration data are mostly statistically self-similar fractals, this paper uses the Hurst exponent, which is based on statistical parameters, to analyze the similarity of the inspection data. Based on the definition of fractal geometry, this paper adopts the R/S analysis method [27,28] to calculate the Hurst exponent, and to determine whether the calculated scale (sub-series size) and measure (rescaled range) satisfy the power-law relation. The main calculation procedure is as follows:
Step 1. Divide the original time series of track irregularity { y i | i = 1 , 2 , 3 N } into M sub-series with data length n: ( y 1 , y 2 , , y n ) ,   ( y n + 1 , y n + 2 , , y 2 n ) ,…,   ( y ( M 1 ) n + 1 , y ( M 1 ) n + 2 , , y M n ) , where M = N / n , M is an integer, and n > 2 .
Step 2. Calculate the mean value of different sub-series.
y ¯ n , m = 1 n i n y i , m
where y ¯ n , m is the mean value of the m-th sub series.
Step 3. Calculate the cumulative deviation R n , m :
R n , m = [ max 1 k n i = 1 k ( y i , m y ¯ n , m ) min 1 k n i = 1 k ( y i , m y ¯ n , m ) ]
Step 4. Calculate the standard deviation S n , m :
S n , m = [ 1 n i = 1 n ( y i , m y ¯ n , m ) 2 ] 1 2
Step 5. Rescale the range:
R S ~ C n H ~ n H
The logarithm of both sides of Equation (4) is:
log R S = log C + Hlog n
where: C is constant, H is Hurst Exponent, and R S is the rescaled range.
Step 6. Change the value of n to obtain different R S values. In the double logarithmic coordinate system, the Hurst Exponent can be obtained by linear regression of ( log n , log R S ) using the least-square method (the slope of the regression line is the Hurst exponent).
Using the same data source in Section 2, the Hurst exponent was calculated for the track irregularity and vehicle body vibration acceleration data. The results are shown in Figure 4. It can be seen in Figure 4 that the correlation coefficient values of the regression analysis are all greater than 0.9, indicating that the calculation results of Hurst exponents are reliable. In addition, the Hurst exponent values of track irregularity and car-body vibration acceleration are both greater than 0.8, indicating that the series on the selected scales are positively correlated with statistical self-similarity.
Figure 5 shows the Hurst exponent calculation results of the corresponding IMF. It is shown that for most of the IMFs, the corresponding Hurst exponents are greater than 0.5, which further proved that the track irregularity and car-body vibration acceleration data have significant statistical self-similarity.
The scale-invariance of the inspection data can be discussed from the perspective of the track irregularity spectrum. The essence of track irregularity spectrum analysis is to study the distribution of measurement (power spectral density) at different scales (spatial frequencies) by changing the measurement scale. From the track-irregularity spectrums formulated by various countries with different railway lines, there is an obvious linear relationship between the track irregularity spectrums of different lines within a certain scale interval. This shows that the track irregularity has scale-invariance and is not affected by the type of track structure or foundation. Similarly, the car-body vibration acceleration data also present scale-invariance, according to their PSD curve. From the above analysis, it can be concluded that the track irregularity and car-body acceleration have typical fractal features.

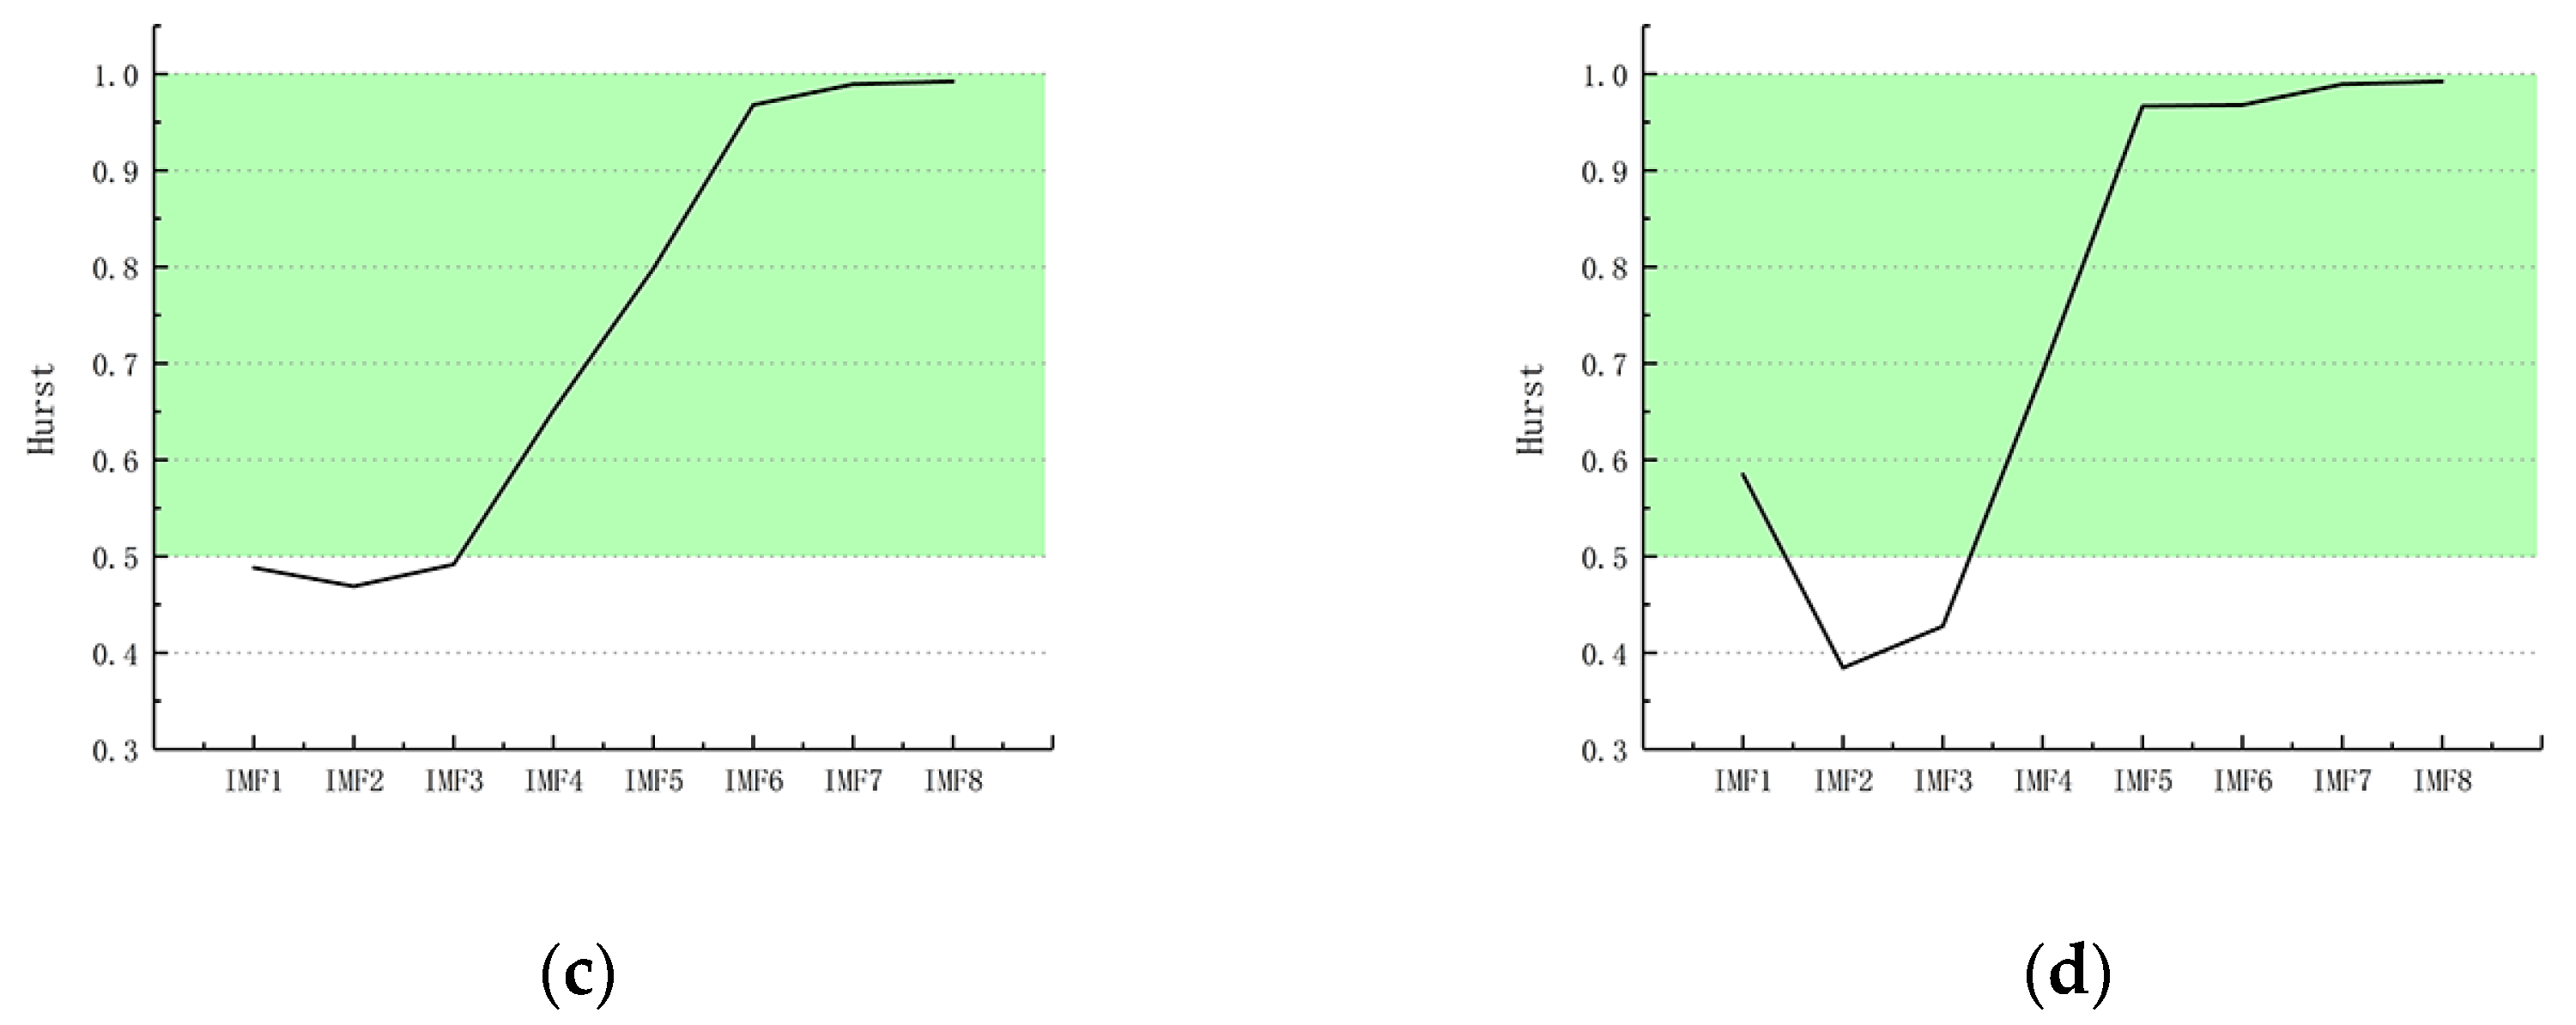
3.2. Fractal Dimension of Track Irregularity and Car-Body Acceleration

The fractal dimension is a commonly used index to measure the complexity and irregularity of geometric patterns [29]. Due to the different measures and scales that characterize fractals, different fractal dimension algorithms are proposed. Compared with other methods—the box method, power spectral method, etc.—the variogram method has the advantages of good robustness and strong adaptability [30]. In this regard, we used the variogram method to calculate the fractal dimensions of the track irregularity and car-body vibration data. The calculation process was as follows [31,32]:
Step 1. Create a rectangular window with a width of w that can cover a certain amount of the inspection data. Note that the data point in the rectangular window should be no less than two.
Step 2. Divide the track inspection data to form a matrix according to the rectangular window with width w. The height h of each rectangle can then be determined as the difference between the maximum value and the minimum value of the data points in each column of the matrix.
Step 3. Calculate the areas of all rectangles under the current rectangle width w, and define S as the sum of these areas.
Step 4. Change the width w to get different S ( w ) , and divide S ( w ) by w 2 to get N ( w ) . Plot ( log ( 1 w ) , log N ( w ) data points in the double logarithmic coordinate system, and perform least-squares linear regression on their linear region to obtain the slope k of the regression line. The fractal dimension can then be defined as D = 2 − k.

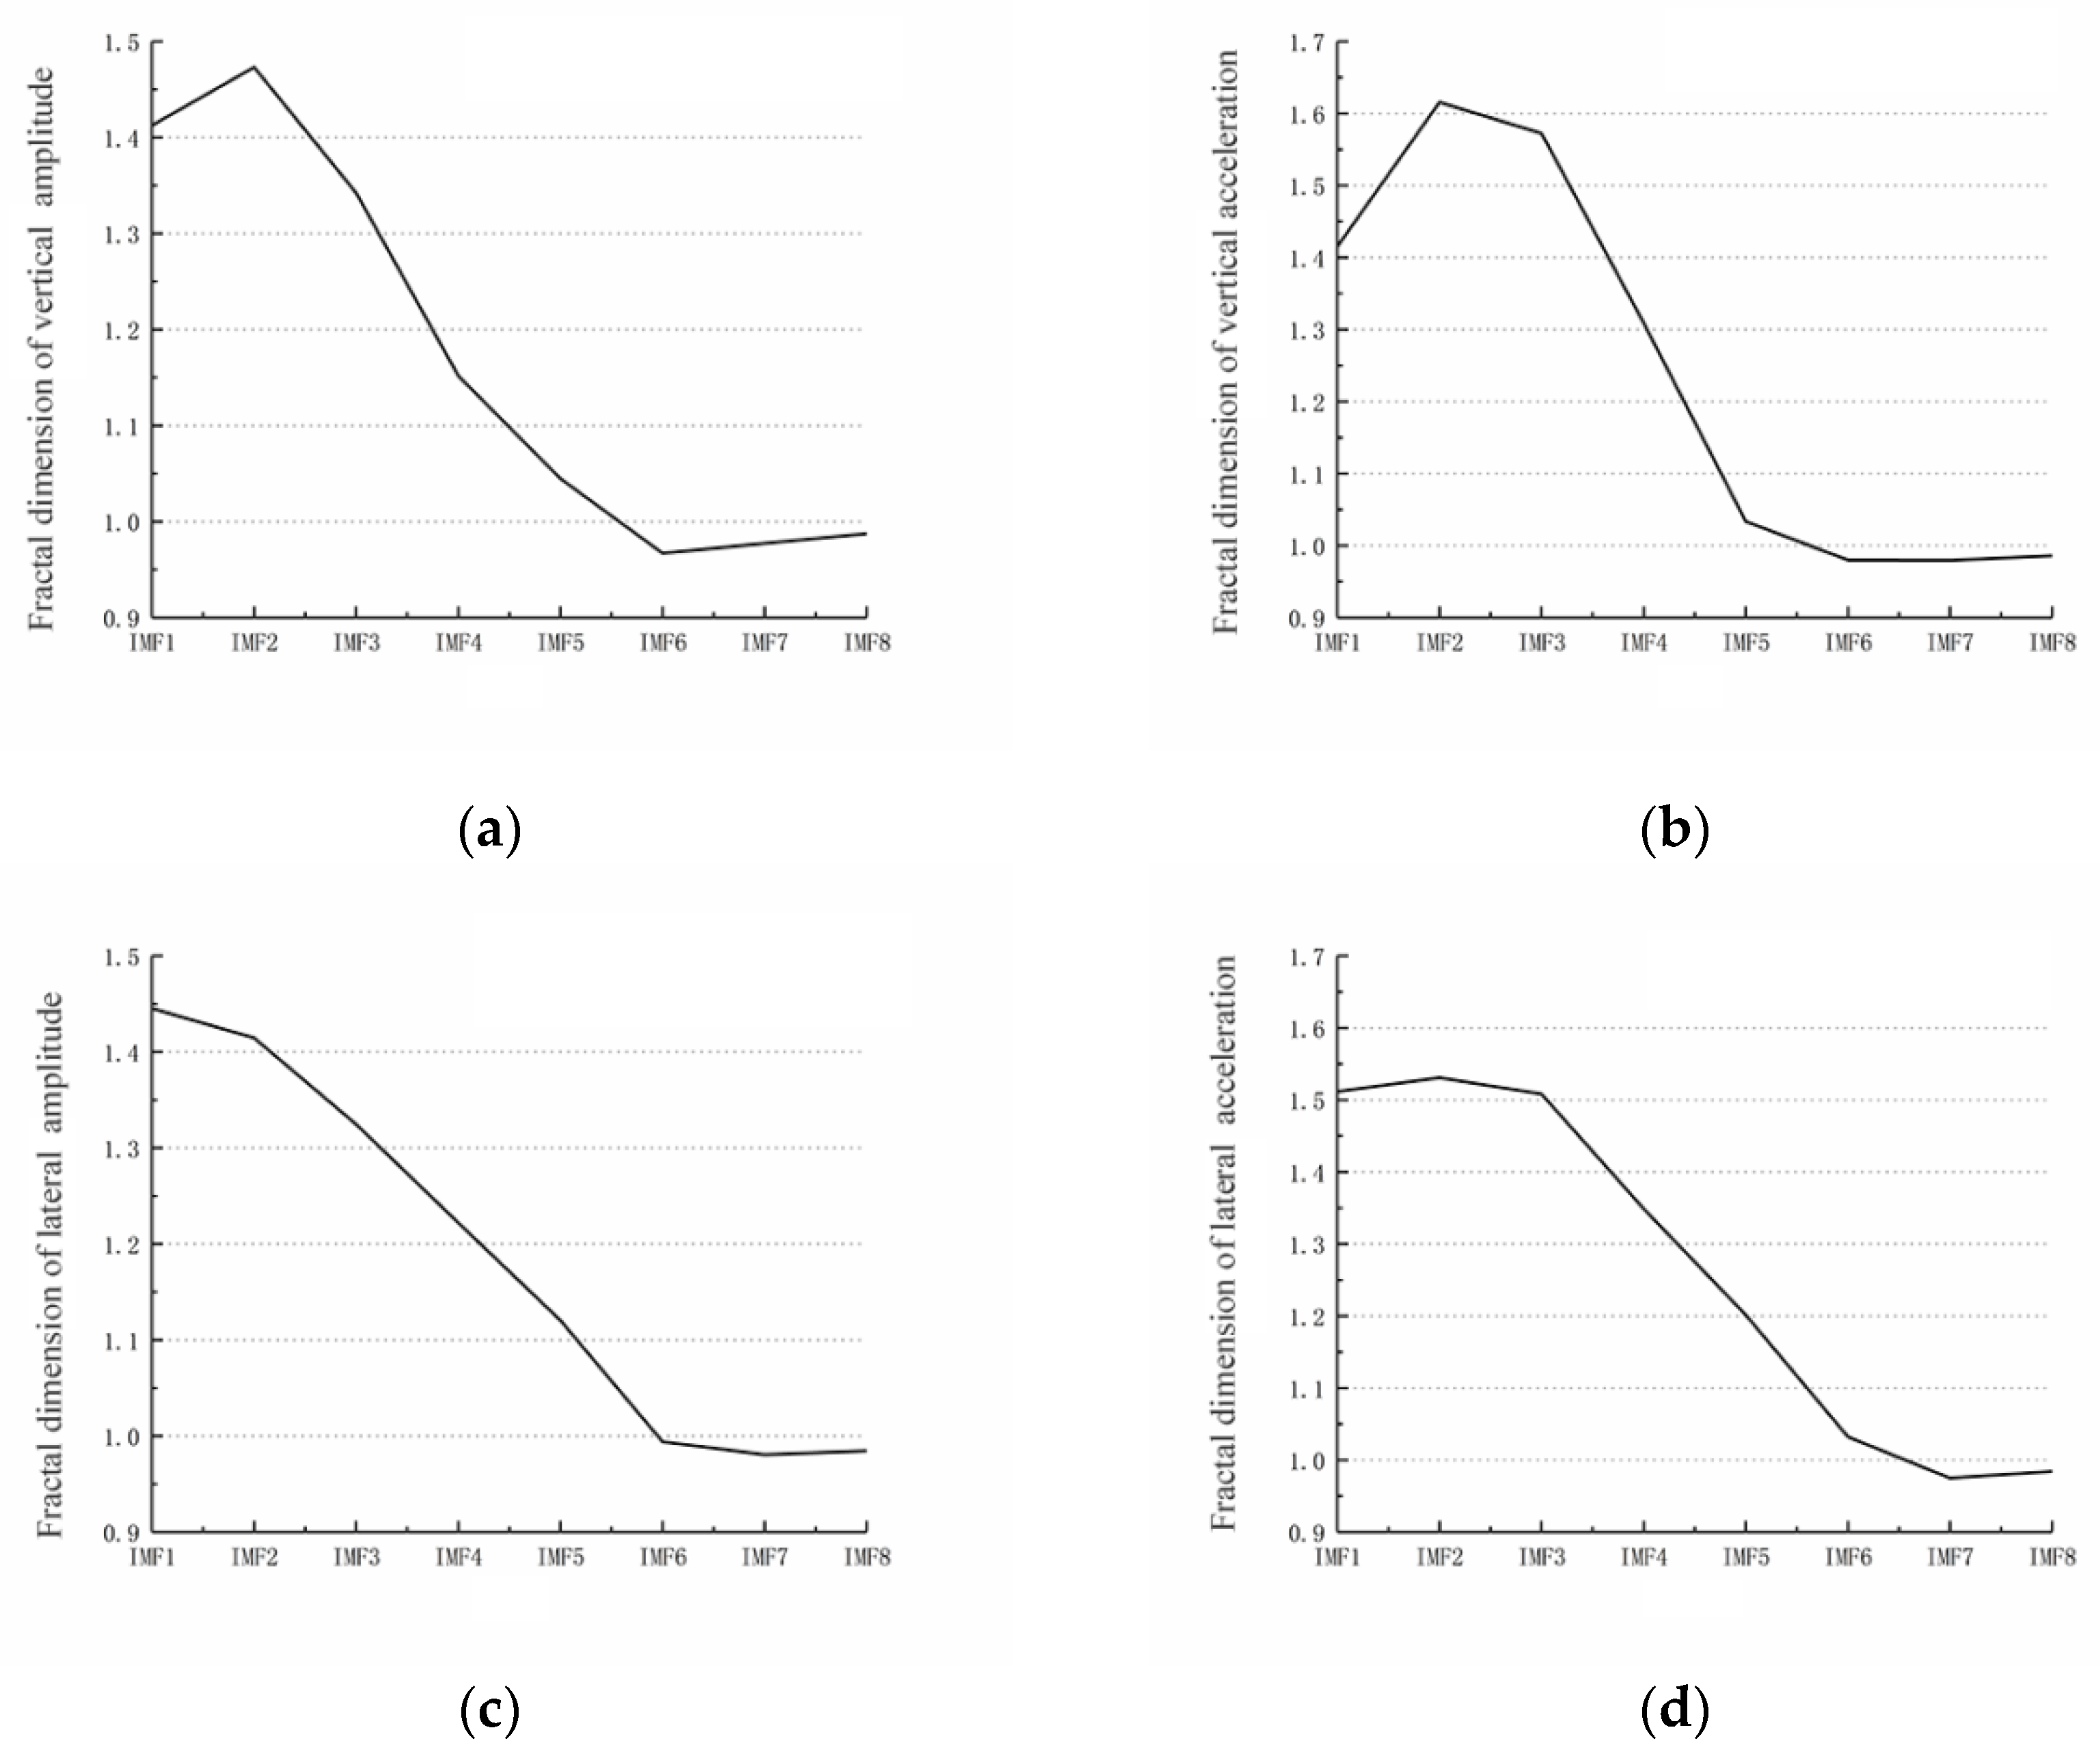
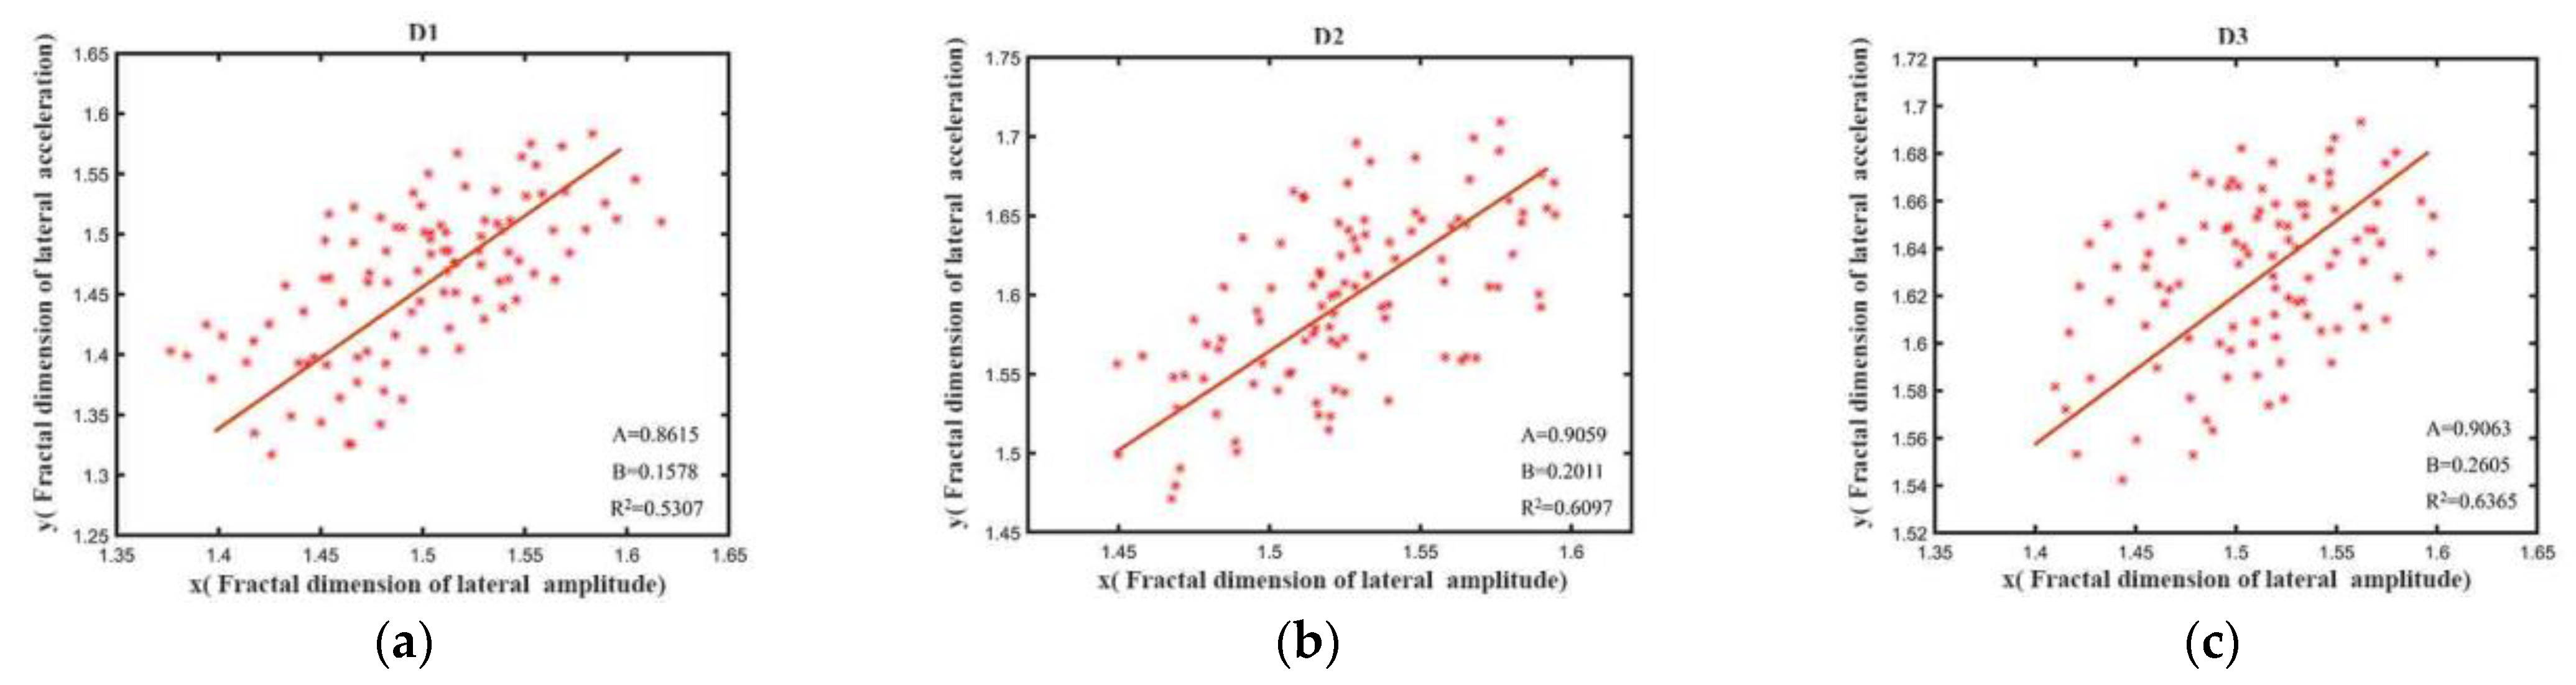
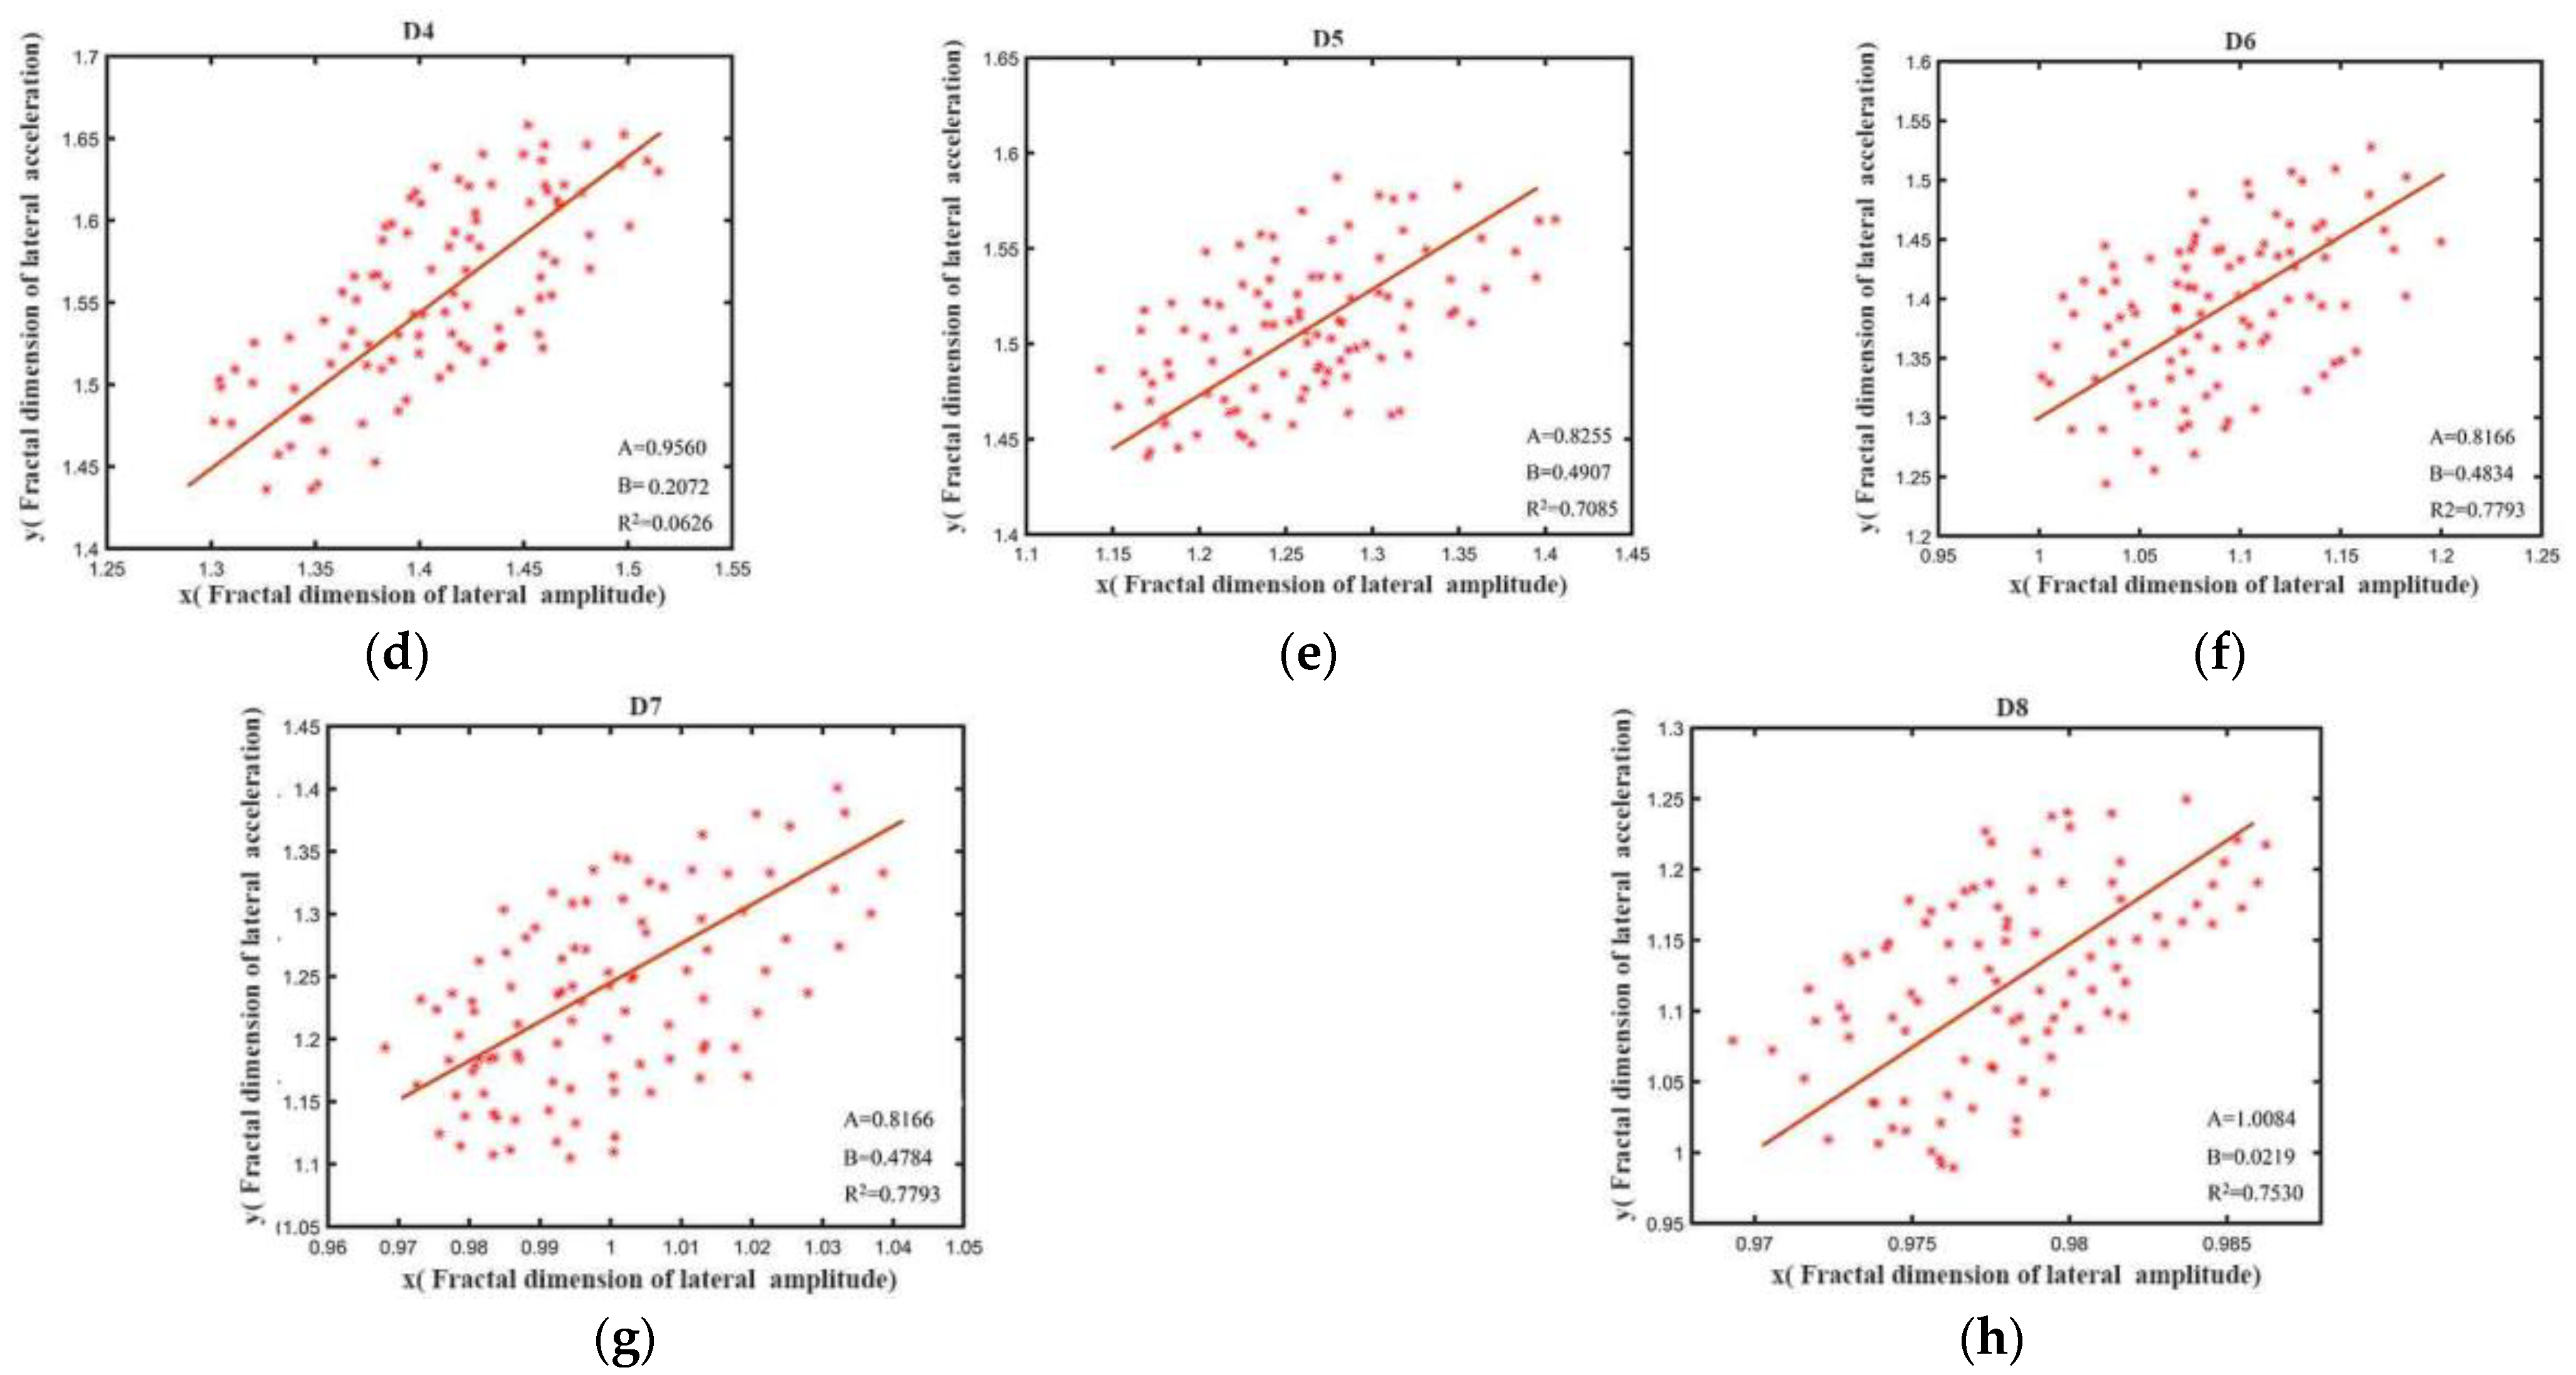
4. Correlation between Track Irregularity and Car-Body Acceleration

Using the proposed calculation process, the fractal dimensions of track irregularity and car-body acceleration can be obtained, and the results are shown in Figure 6. It can be seen in Figure 6 that the fractal dimension of track irregularity decreases as the wavelength increases. The fractal dimensions of different IMFs of the surface irregularities decrease from 1.41 to 0.99, and the fractal dimensions of the IMFs of the alignment irregularity decrease from 1.45 to 0.99. This indicates that the waveform of the IMFs is more complex at the shorter wavelengths. In contrast, at longer wavelengths, the variation in the IMF waveform is smooth, and the fractal dimension is relatively small. Similar results were also found in the car-body acceleration data. In addition, the variation trends of the fractal dimension of the car-body vertical acceleration and the track surface irregularity, and the fractal dimension of the car-body lateral acceleration and the track-alignment irregularity, are nearly the same. This confirms the relationship between car-body acceleration and the corresponding types of track irregularities.
Through the above analysis, it can be concluded that the fractal dimension can effectively present the detailed variation in the track irregularity and car-body acceleration. The fractal dimension is independent of the amplitude of the track inspection data but only related to the roughness of the curve. Therefore, the fractal dimension can reflect the inherent features of the track irregularity and car-body acceleration. In view of this, to explore the mapping relationship between track irregularity and car-body vibration acceleration, we conducted regression analysis of their fractal dimensions.
The track irregularity and car-body vibration data subject to regression analysis were collected at the same rail line section in Section 2, but the length of the data was increased to 2 km, so the total number of the samples was 100. The regression formula can be defined as:
Y = A x + B
where Y is the fractal dimension of car-body acceleration; x is the fractal dimension of track irregularity; A and B are the regression coefficients.
The regression results are shown in Figure 7 and Figure 8, and the regression parameter values are listed in Table 1 and Table 2.
It can be seen in Figure 7 and Figure 8 and Table 1 and Table 2 that:
(1) The correlation coefficient of surface irregularity and car-body vertical vibration acceleration is greater than 0.7 in IMF 3–IMF 7 except for IMF 4 (the lower limit of the corresponding wavelength range is 13 m), and the correlation coefficient of alignment irregularity and car-body lateral vibration acceleration is greater than 0.7 in IMF 4–IMF 8 (the lower limit of the corresponding wavelength range is 30 m). This indicates that with long wavelengths, the track irregularity and car-body vibration are highly correlated. Similar results were also found in [1,3], which state that track-surface irregularities at long wavelengths have a strong influence on car-body acceleration. This finding is also in line with the operation practice of HSR that the excessive vibration of the car body generated during HSR operation is mostly caused by the deterioration of the track geometry with long wavelengths.
(2) By contrast, with the short wavelengths, the correlation coefficient is smaller. There are two main reasons for this phenomenon: (i) The waveform of the track irregularity at smaller wavelength ranges is more complex, and the amplitude of track irregularity at short with is relatively small. (ii) The vibration at higher frequency ranges is easier to be reduced by the vehicle suspension system. Consequently, unlike the long wavelength ranges, the track irregularity in short wavelength ranges can hardly generate the car-body vibration with a clear correspondence with the excitation source.
(3) Compared with the correlation between track surface irregularity and car-body vertical acceleration, the correlation between alignment irregularity and car-body lateral acceleration is higher, indicating that the vehicle’s lateral vibration is largely determined by the track alignment. This finding is consistent with the results presented in reference [19], which revealed the strong correlation between the IMFs of track alignment irregularity and car-body lateral acceleration.

5. Conclusions

This paper explored the correlation between the track geometry and car-body vibration at different wavelength ranges in a quantitative manner. To this end, the EMD, as an effective method to deal with the non-stationary signals, was used to decompose the irregularity data and the acceleration data. To investigate the detailed correlation between the IMFs’ track irregularity and the corresponding IMFs of car body responses, the theory of fractal geometry was adopted to calculate their fractal features. On this basis, the correlation between track surface irregularity and car-body vertical acceleration, and the correlation between track alignment irregularity and car-body lateral acceleration revealed via regression analysis. The main conclusions of this research are as follows:
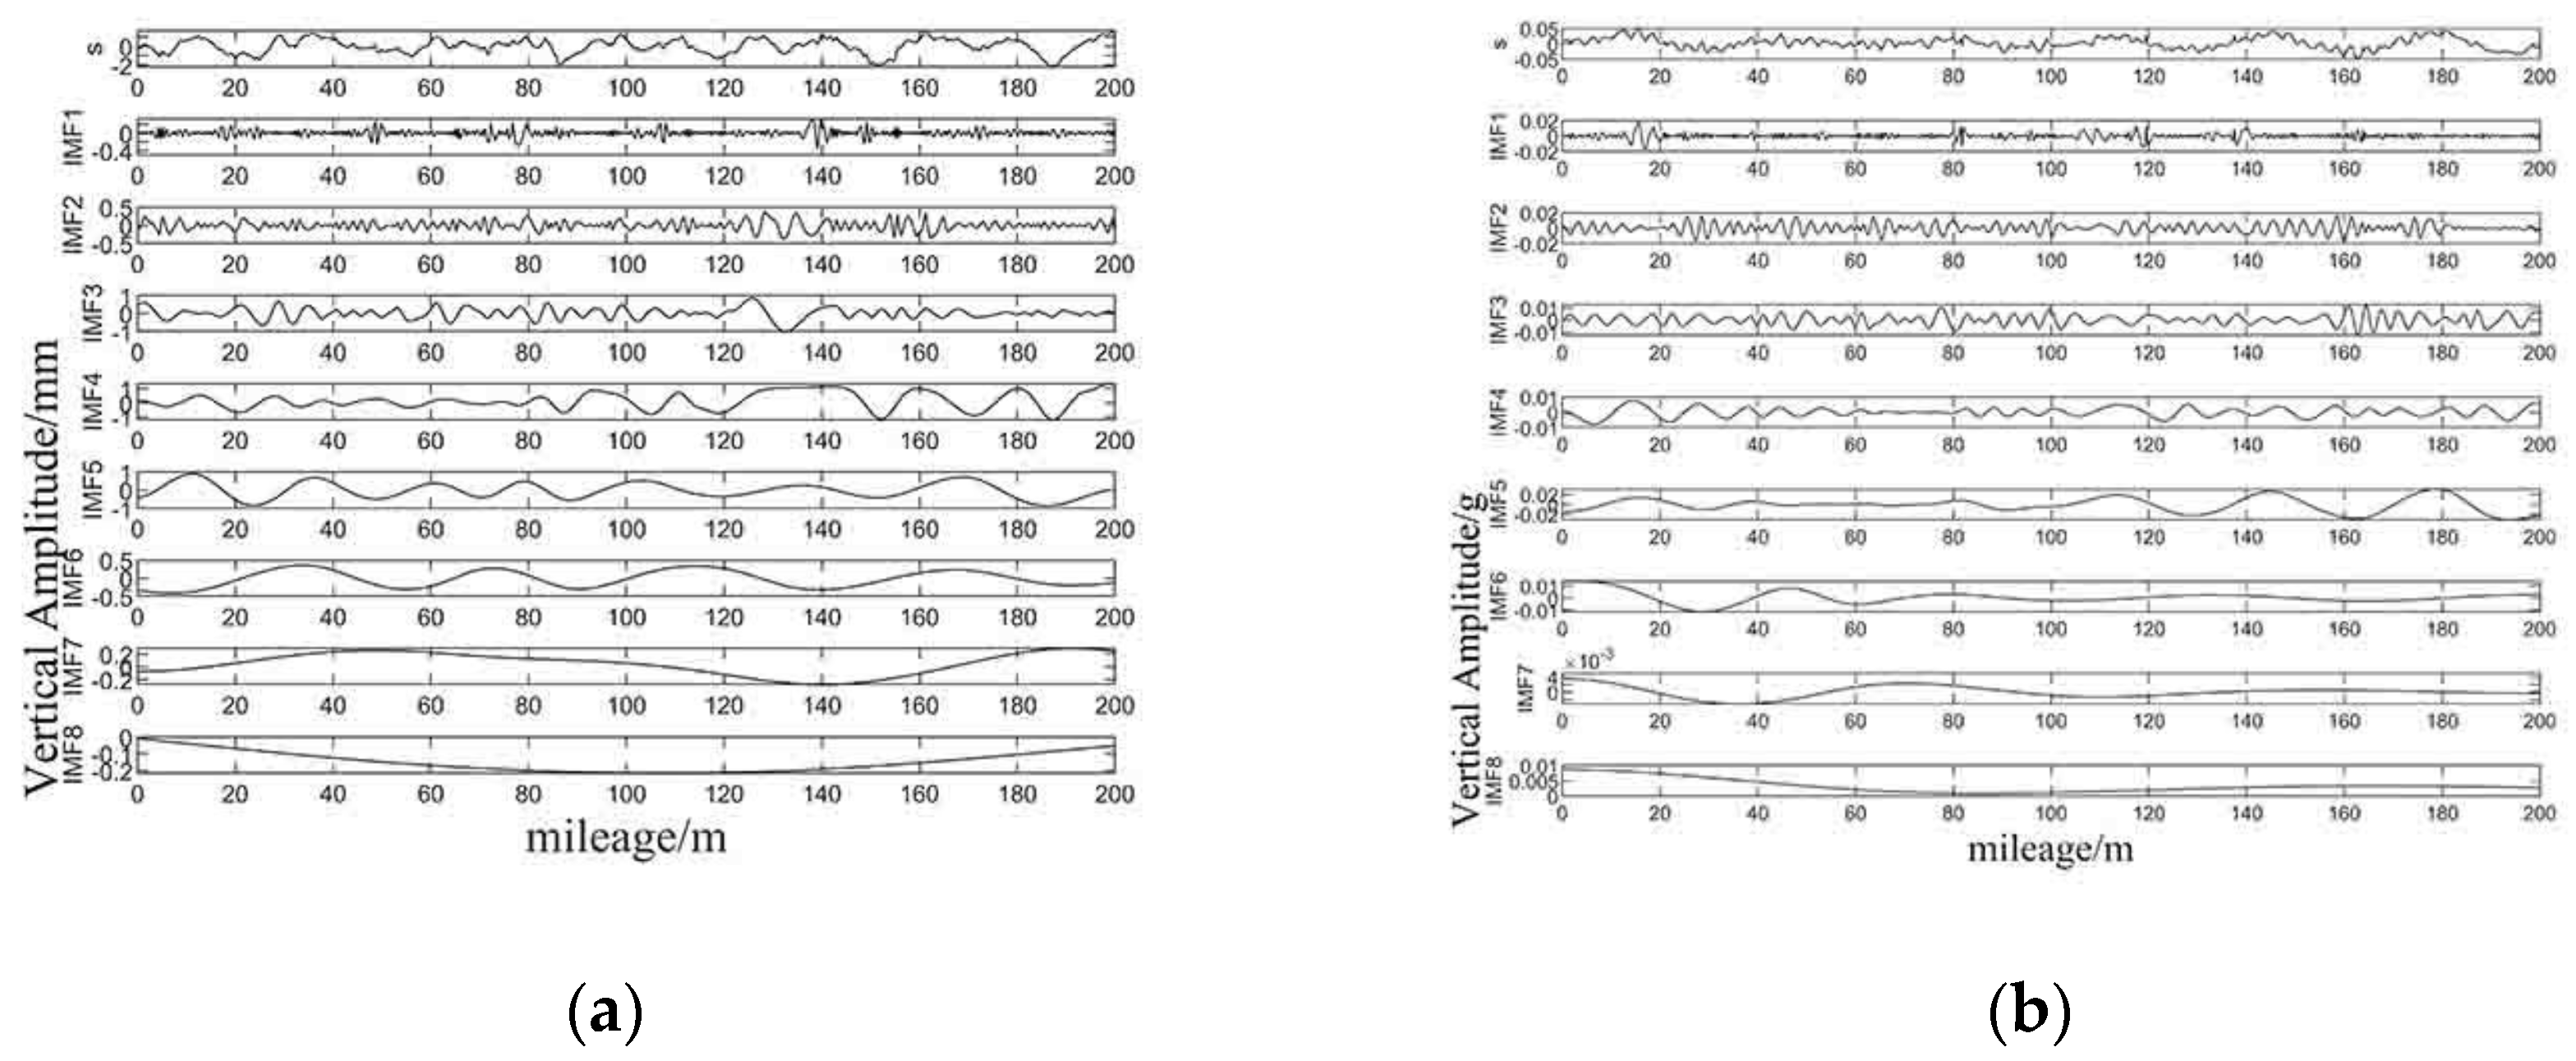
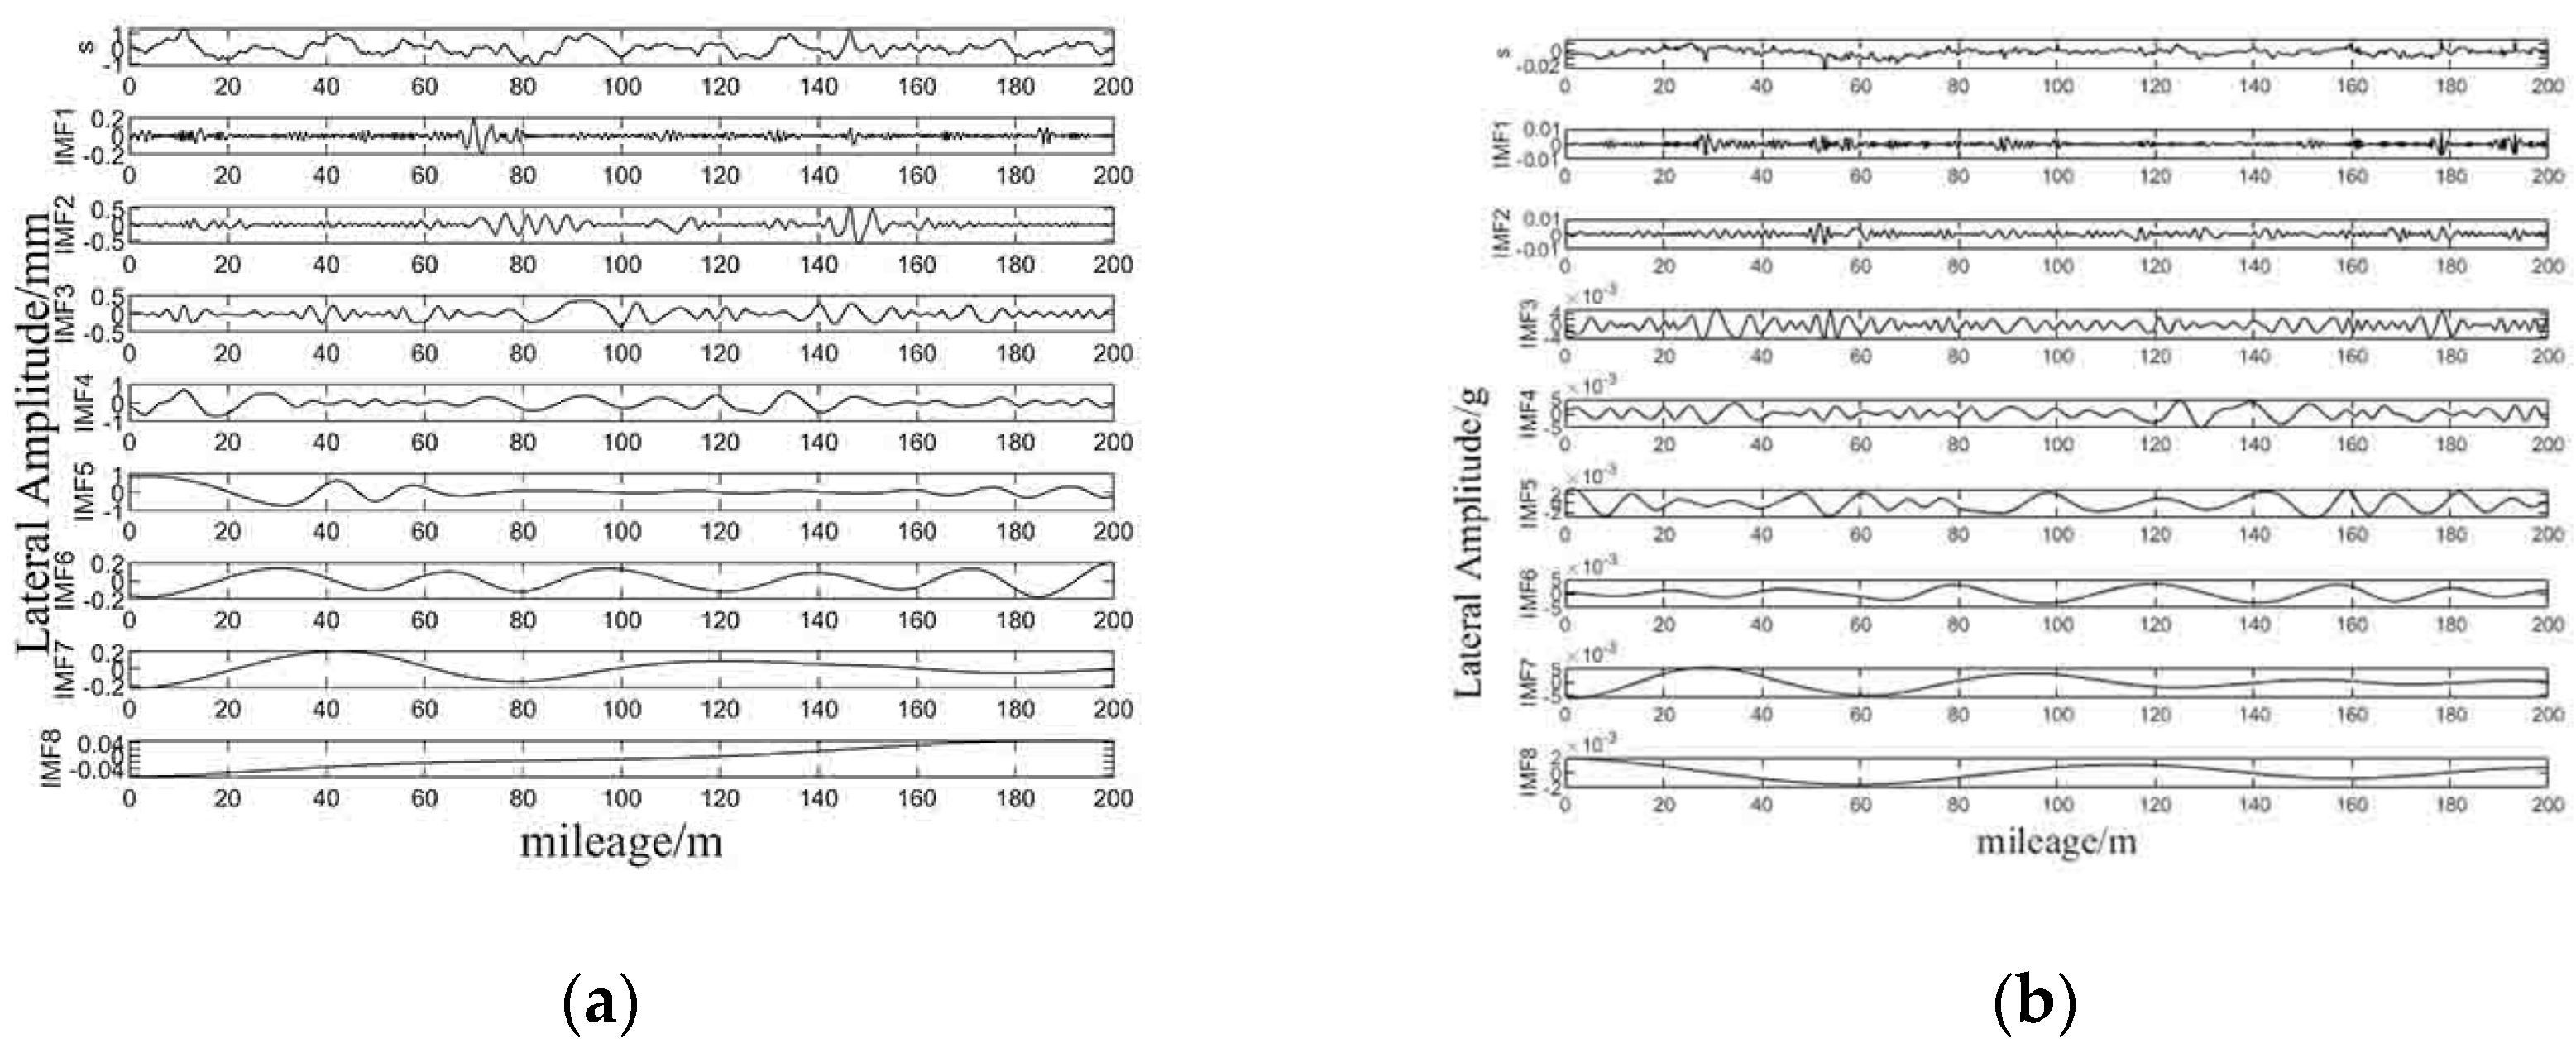
  • The relationship between the time series of track irregularity and the corresponding car-body acceleration is not obvious, but on the IMF waveform, the peaks of the irregularity data match well with those in the acceleration data;
  • Both the track irregularity and car-body vibration acceleration satisfy the fractal features based on the calculation results of the Hurst exponent, so the features of their waveforms can be characterized by their fractal dimensions;
  • With an increase in wavelength, the fractal dimensions of both track irregularity and car-body acceleration decrease gradually; the variation trends of the fractal dimensions of vertical acceleration and surface irregularity are the same; similarly, the variation trends of the fractal dimensions of lateral acceleration and alignment irregularity are the same; the fractal dimension is only related to the roughness of the waveform and is irrelevant to the amplitude of the time series;
  • The corresponding relationship between the fractal dimensions of the track irregularity and the car-body vibration acceleration is clear in the long wavelength region, through a large correlation coefficient.
The main contribution of this research is revealing the detailed relationship between track geometry and car-body vibration in various frequency ranges. This can help to explain the excessive vibration of high-speed trains, which is frequently reported in operation, especially for the sections where the track irregularity does not exceed the tolerance limit. The findings have implications for optimizing the track maintenance work by focusing on the sensitive wavelength ranges of the track geometry. Meanwhile, this research also opens good perspectives to the effective assessment of track quality which could further enhance the ride quality of high-speed trains.
However, it is worth noting that the samples of track irregularity and car-body acceleration used in this research were collected on a single HSR line. Whether the results can be applied to other lines with different operation speeds and different types of infrastructure needs further discussion. It is necessary to further study the fractal features of various track inspection data to reveal the effects of the potential factors on the fractal dimensions of the data. In addition, though the fractal theory has been proven feasible in characterizing the detailed time-frequency features of the track inspection data, the use of fractal analysis in track quality assessments is scarce. To facilitate the use of fractal analysis in maintenance work, future research needs to focus on the association of the fractal dimensions with the maintenance plan of the HSR track.

Author Contributions

Conceptualization, X.-Z.L. and Z.-W.L.; methodology, X.-Z.L. and Z.-W.L.; software, Z.-W.L. and J.W.; validation, X.-Z.L. and C.-J.S.; formal analysis, X.-Z.L., Z.-W.L., and C.-J.S.; investigation, Z.-W.L. and J.-H.X.; resources, Z.-W.L. and J.W.; data curation, X.-Z.L. and Z.-W.L.; writing—original draft preparation, X.-Z.L. and C.-J.S.; writing—review and editing, Z.-W.L.; visualization, C.-J.S.; supervision, Z.-W.L. and J.-H.X.; project administration, Z.-W.L., J.W. and J.-H.X.; funding acquisition, X.-Z.L. and Z.-W.L. All authors have read and agreed to the published version of the manuscript.

Funding

This research was funded by the National Natural Science Foundation of China (grants 52178430 and 52208441), General Project of University Stable Support Plan of Shenzhen (grant no. 20220719115545001) and the Natural Science Foundation of Top Talent of SZTU (grant no. GDRC202128).

Data Availability Statement

All data, models, or code that support the findings of this study are available from the corresponding author upon reasonable request.

Conflicts of Interest

The authors declare no conflict of interest.

References

  1. Choi, I.I.; Um, J.; Lee, J.S.; Choi, H. The influence of track irregularities on the running behavior of high-speed trains. Proc. Inst. Mech. Eng. F J. Rail Rapid Transit 2012, 227, 94–102. [Google Scholar] [CrossRef]
  2. Zhang, W.; Zeng, J.; Li, Y. A review of vehicle system dynamics in the development of high-speed trains in China. Int. J. Dyn. Control 2013, 1, 81–97. [Google Scholar] [CrossRef] [Green Version]
  3. Xin, T.; Wang, P.; Ding, Y. Effect of long-wavelength track irregularities on vehicle dynamic responses. Shock Vib. 2019, 2019, 4178065. [Google Scholar] [CrossRef]
  4. Zhai, W.; Wang, K.; Cai, C. Fundamentals of vehicle–track coupled dynamics. Veh. Syst. Dyn. 2009, 47, 1349–1376. [Google Scholar] [CrossRef]
  5. Xin, L.; Li, X.; Zhu, Y.; Liu, M. Uncertainty and sensitivity analysis for train-ballasted track-bridge system. Veh. Syst. Dyn. 2020, 58, 453–471. [Google Scholar] [CrossRef]
  6. Song, Y.; Wang, Z.; Liu, Z.; Wang, R. A spatial coupling model to study dynamic performance of pantograph-catenary with vehicle-track excitation. Mech. Syst. Signal Process. 2021, 151, 151107336. [Google Scholar] [CrossRef]
  7. Xu, L.; Zhai, W. A novel model for determining the amplitude-wavelength limits of track irregularities accompanied by a reliability assessment in railway vehicle-track dynamics. Mech. Syst. Signal Process. 2017, 86, 260–277. [Google Scholar] [CrossRef]
  8. Sadeghi, J.; Rabiee, S.; Khajehdezfuly, A. Effect of rail irregularities on ride comfort of train moving over ballast-less tracks. Int. J. Struct. Stab. Dyn. 2019, 19, 1950060. [Google Scholar] [CrossRef]
  9. Liu, C.; Thompson, D.; Griffin, M.J.; Entezami, M. Effect of train speed and track geometry on the ride comfort in high-speed railways based on ISO 2631-1. Proc. Inst. Mech. Eng. Part F J. Rail Rapid Transit 2019, 234, 765–778. [Google Scholar] [CrossRef] [Green Version]
  10. Xu, L.; Zhai, W. A spectral evolution model for track geometric degradation in train-track long-term dynamics. Veh. Syst. Dyn. 2020, 58, 1–27. [Google Scholar] [CrossRef]
  11. Li, Z.; Liu, X.; Chen, S. A reliability assessment approach for slab track structure based on vehicle-track dynamics and surrogate model. Proc. Inst. Mech. Eng. Part O J. Risk Reliab. 2022, 236, 79–89. [Google Scholar] [CrossRef]
  12. Sadeghi, J.; Askarinejad, H. Application of neural networks in evaluation of railway track quality condition. J. Mech. Sci. Technol. 2012, 26, 113–122. [Google Scholar] [CrossRef]
  13. Tsai, H.; Wang, C.; Huang, N.E.; Kuo, T.; Chieng, W. Railway track inspection based on the vibration response to a scheduled train and the Hilbert–Huang transform. Proc. Inst. Mech. Eng. Part F J. Rail Rapid Transit 2014, 229, 815–829. [Google Scholar] [CrossRef]
  14. Li, Z.; Liu, X.; He, Y. Identification of temperature-induced deformation for HSR slab track using track geometry measurement data. Sensors 2019, 19, 5446. [Google Scholar] [CrossRef] [Green Version]
  15. Kraft, S.; Causse, J.; Martinez, A. Black-box modelling of nonlinear railway vehicle dynamics for track geometry assessment using neural networks. Veh. Syst. Dyn. 2018, 57, 1241–1270. [Google Scholar] [CrossRef]
  16. Balouchi, F.; Bevan, A.; Formston, R. Development of railway track condition monitoring from multi-train in-service vehicles. Veh. Syst. Dyn. 2020, 59, 1397–1417. [Google Scholar] [CrossRef] [Green Version]
  17. Higgins, C.; Liu, X. Modeling of track geometry degradation and decisions on safety and maintenance: A literature review and possible future research directions. Proc. Inst. Mech. Eng. Part F J. Rail Rapid Transit 2018, 232, 1385–1397. [Google Scholar] [CrossRef]
  18. Soleimanmeigouni, I.; Ahmadi, A.; Kumar, U. Track geometry degradation and maintenance modelling: A review. Proc. Inst. Mech. Eng. Part F J. Rail Rapid Transit 2018, 232, 73–102. [Google Scholar] [CrossRef]
  19. Li, Z.; Lian, S.; He, Y. Time-frequency analysis of horizontal vibration for vehicle-track system based on Hilbert-Huang Transform. Adv. Mech. Eng. 2015, 5, 954102. [Google Scholar] [CrossRef]
  20. Zhai, W.; Han, Z.; Chen, Z.; Ling, L.; Zhu, S. Train-track-bridge dynamic interaction: A state-of-the-art review. Veh. Syst. Dyn. 2019, 57, 984–1027. [Google Scholar] [CrossRef]
  21. Haigermoser, A.; Luber, B.; Rauh, J.; Gräfe, G. Road and track irregularities: Measurement, assessment and simulation. Veh. Syst. Dyn. 2015, 53, 878–957. [Google Scholar] [CrossRef]
  22. Lei, X.; Noda, N.A. Analyses of dynamic response of vehicle and track coupling system with random irregularity of track vertical profile. J. Sound Vib. 2002, 258, 147–165. [Google Scholar] [CrossRef]
  23. Hyslip, J.P. Fractal analysis of track geometry data. Transp. Res. Rec. J. Transp. Res. Board 2002, 1, 50–57. [Google Scholar] [CrossRef] [Green Version]
  24. Landgraf, M.; Hansmann, F. Fractal analysis as an innovative approach for evaluating the condition of railway tracks. Proc. Inst. Mech. Eng. Part F J. Rail Rapid Transit 2018, 233, 596–605. [Google Scholar] [CrossRef]
  25. Xie, H.; Wang, J.; Xie, W. Fractal effects of surface roughness on the mechanical behavior of rock joints. Chaos Solitons Fractals 1997, 8, 221–252. [Google Scholar] [CrossRef]
  26. Cox, B.L.; Wang, J.S.Y. Fractal surfaces: Measurement and applications in the earth sciences. Fractals 2012, 1, 87–115. [Google Scholar] [CrossRef]
  27. Peng, J.; Liu, Z.; Liu, Y.; Wu, J.; Han, Y. Trend analysis of vegetation dynamics in Qinghai–Tibet Plateau using Hurst Exponent. Ecol. Indic. 2012, 14, 28–39. [Google Scholar] [CrossRef]
  28. Rafique, M.; Iqbal, J.; Ali, S.S.A.; Alam, A.; Javed, L.K.; Barkat, A.; Ali, S.M.; Ahmad, Q.S.; Nikolopoulos, D. On fractal dimensions of soil radon gas time series. J. Atmos. Sol. Terr. Phys. 2022, 227, 105775. [Google Scholar] [CrossRef]
  29. Taciroğlu, M.V.; Karaşahin, M.; Tığdemir, M.; Işıker, H. Fractal analysis of high speed rail geometry data: A case study of Ankara-Eskişehir high speed rail. Measurement 2020, 165, 108120. [Google Scholar] [CrossRef]
  30. Li, Z.; Wu, P.; Liu, X.; He, Y. Fractal characteristics of ballastless track irregularities of high-speed railway. J. Vib. Shock. 2022, 41, 281–288. (In Chinese) [Google Scholar]
  31. Liang, X.; Lin, B.; Han, X.; Chen, S. Fractal analysis of engineering ceramics ground surface. Appl. Surf. Sci. 2012, 258, 6406–6415. [Google Scholar] [CrossRef]
  32. Miller, S. Improved method for fractal analysis using scanning probe microscopy. J. Vac. Sci. Technol. B Microelectron. Nanometer Struct. 1992, 10, 1203. [Google Scholar] [CrossRef]
Figure 1. Time series of track irregularity and car-body acceleration.
Fractalfract 06 00727 g001
Figure 2. Decomposition of left surface irregularity and vertical acceleration of car body by EMD: (a) left surface; (b) car-body vertical acceleration.
Fractalfract 06 00727 g002
Figure 3. Decomposition of left alignment irregularity and lateral acceleration of car body by EMD: (a) left alignment; (b) car-body lateral acceleration.
Fractalfract 06 00727 g003
Figure 4. R/S Curve and Hurst exponent of track irregularity and car-body acceleration: (a) left surface irregularity; (b) vertical acceleration of car body; (c) left alignment; (d) lateral acceleration of car body.
Fractalfract 06 00727 g004
Figure 5. Hurst exponents of the IMFs: (a) left surface irregularity; (b) vertical acceleration of car body; (c) left alignment; (d) lateral acceleration of car body.
Fractalfract 06 00727 g005aFractalfract 06 00727 g005b
Figure 6. Fractal dimensions of track irregularity and car-body acceleration: (a) left surface irregularity; (b) vertical acceleration of car body; (c) left alignment; (d) lateral acceleration of car body.
Fractalfract 06 00727 g006
Figure 7. Regression of track surface irregularity and car-body vertical acceleration: (a) IMF 1; (b) IMF 2; (c) IMF 3; (d) IMF 4; (e) IMF 5; (f) IMF 6; (g) IMF 7; (h) IMF 8.
Fractalfract 06 00727 g007
Figure 8. Regression of track-alignment irregularity and car-body lateral acceleration: (a) IMF 1; (b) IMF 2; (c) IMF 3; (d) IMF 4; (e) IMF 5; (f) IMF 6; (g) IMF 7; (h) IMF 8.
Fractalfract 06 00727 g008aFractalfract 06 00727 g008b
Table 1. Regression analysis results of surface irregularity and car-body vertical acceleration.
Parameter AParameter BCorrelation Coefficient
IMF10.72201.71390.5916
IMF20.66961.65290.5553
IMF30.87921.45330.7164
IMF40.85131.45970.6476
IMF50.81741.28560.7302
IMF60.91501.05260.7014
IMF70.96010.97090.9286
IMF80.84990.93600.5370
Table 2. Regression analysis results of alignment irregularity and car-body lateral acceleration.
Parameter AParameter BCorrelation Coefficient
IMF10.86151.73290.6195
IMF20.90591.42730.6097
IMF30.90631.78120.6365
IMF40.95601.40620.7071
IMF50.82551.42560.7085
IMF60.81661.25840.7793
IMF70.84791.12840.7326
IMF81.00842.09570.7530
Publisher’s Note: MDPI stays neutral with regard to jurisdictional claims in published maps and institutional affiliations.

