Article

Fractal Analysis on Pore Structure and Hydration of Magnesium Oxysulfate Cements by First Principle, Thermodynamic and Microstructure-Based Methods

1
State Key Laboratory of Water Resources and Hydropower Engineering Science, Wuhan University, Wuhan 430010, China
2
Department of Architecture and Civil Engineering, City University of Hong Kong, Kowloon, Hong Kong, China
3
China Three Gorges Corporation, Beijing 100038, China
4
Changjiang River Scientific Research Institute of Changjiang Water Resources Commission, Wuhan 430010, China
5
College of Material Science and Engineering, Xi’an University of Architecture and Technology, Xi’an 710055, China
6
Department of Civil and Hydraulic Engineering, Huazhong University of Science and Technology, Wuhan 430010, China
7
Department of Civil Engineering, Qinghai University, Xining 810016, China
8
College of Chemistry and Molecular Sciences, Wuhan University, Wuhan 430010, China
9
Suzhou Institute of Wuhan University, Suzhou 215123, China
10
State Key Laboratory of Green Building in Western China, Xi’an University of Architecture and Technology, Xi’an 710055, China
*
Author to whom correspondence should be addressed.
Fractal Fract. 2021, 5(4), 164; https://doi.org/10.3390/fractalfract5040164
Submission received: 23 August 2021 / Revised: 28 September 2021 / Accepted: 30 September 2021 / Published: 11 October 2021
(This article belongs to the Special Issue Fractal and Fractional in Cement-based Materials)

Abstract

:
Magnesium oxysulfate (MOS) cement is a typical eco-friendly cementitious material, which presents excellent performances. In this work, a novel multiscale modeling strategy is proposed to simulate the hydration and pore structure of MOS cement system. This work collected and evaluated the Gibbs free energy of formation for main hydrates and equilibrium constant of main reactions in MOS cement system based on a first principle calculation using Material Studio. Followingly, the equilibrium phase compositions of MOS cement system were simulated through PHREEQC to investigate the molar ratio dependence of equilibrium phase compositions. Results showed that large M (MgO/MgSO4) was beneficial for the formation of 5Mg(OH)2·MgSO4·7H2O (Phase 517) and large H (H2O/MgSO4) tended to decompose MOS cement paste and cause leaching. The microstructure-based method visualized the hydration status of MOS cement systems at initial and ultimate stages via MATLAB and the results showed that large M was significant to reduce porosity, and similar results for the case of small H. Fractal analysis confirms that fractal dimension of pore structure (Df) was significantly decreased after the hydration of MOS and was positively correlated to the porosity of the paste. In addition, it can be referred that large M and small H were beneficial for modifying the microstructure of MOS paste by decreasing the value of Df.

1. Introduction

In recent decades, the explosive development of MgO-based cements has lied in an environmental consideration. Compared to the manufacture temperature of ordinary Portland cement, the lower temperature is required to produce MgO. Therefore, the energy saving associated with this decreased temperature makes MgO-based cements the core of eco-friendly cement production in the future. Magnesium oxysulfate cement (MOS) is a typical eco-friendly non-hydraulic material, first proposed by a Belgian scholar in 1957, similar to the magnesium oxychloride cement (MOC) [1,2]. MOS paste is prepared through the chemical reaction of active MgO powder and magnesium sulfate solution. MOS-based materials have attracted much attention due to their excellent performances, such as good fire resistance, good steel protection, low density and thermal conductivity, etc. [3,4]. MOS paste is similar in concept to MOC paste, except that MgSO4 solution is used instead of MgCl2 solution to form cementitious binder. Typically, the main chemical reactions in MOS cement system are shown as below:
5 M g O + M g S O 4 + 12 H 2 O 5 M g ( O H ) 2 M g S O 4 7 H 2 O
3 M g O + M g S O 4 + 11 H 2 O 3 M g ( O H ) 2 M g S O 4 8 H 2 O
As early as in 1957, Demediuk and Cole [1] analyzed the hydrated products in the MOS paste under the temperature range of 30–120 °C. They identified four magnesium oxysulfate phases (Phase 318, Phase 513, Phase 115 and Phase 123). Phases 512, 517, 131, 122, 251 and 514 were reported in other literatures [5]. These phases observed in MOS pastes are shown in Table 1.
The phase transformation and stability of hydrated phases in MOS paste, are expected to be primarily associated with two molar ratios, i.e., MgO/MgSO4 (M) and H2O/MgSO4 (H). Generally, the following six main phases are generated within the temperature range from 30 °C to 120 °C [9]: Phase 517 (5Mg(OH)2·MgSO4·7H2O), Phase 318 (3Mg(OH)2·MgSO4·8H2O), Phase 513 (5Mg(OH)2·MgSO4·3H2O), Phase 115 (Mg(OH)2·MgSO4·5H2O), Phase 123 (Mg(OH)2·2MgSO4·3H
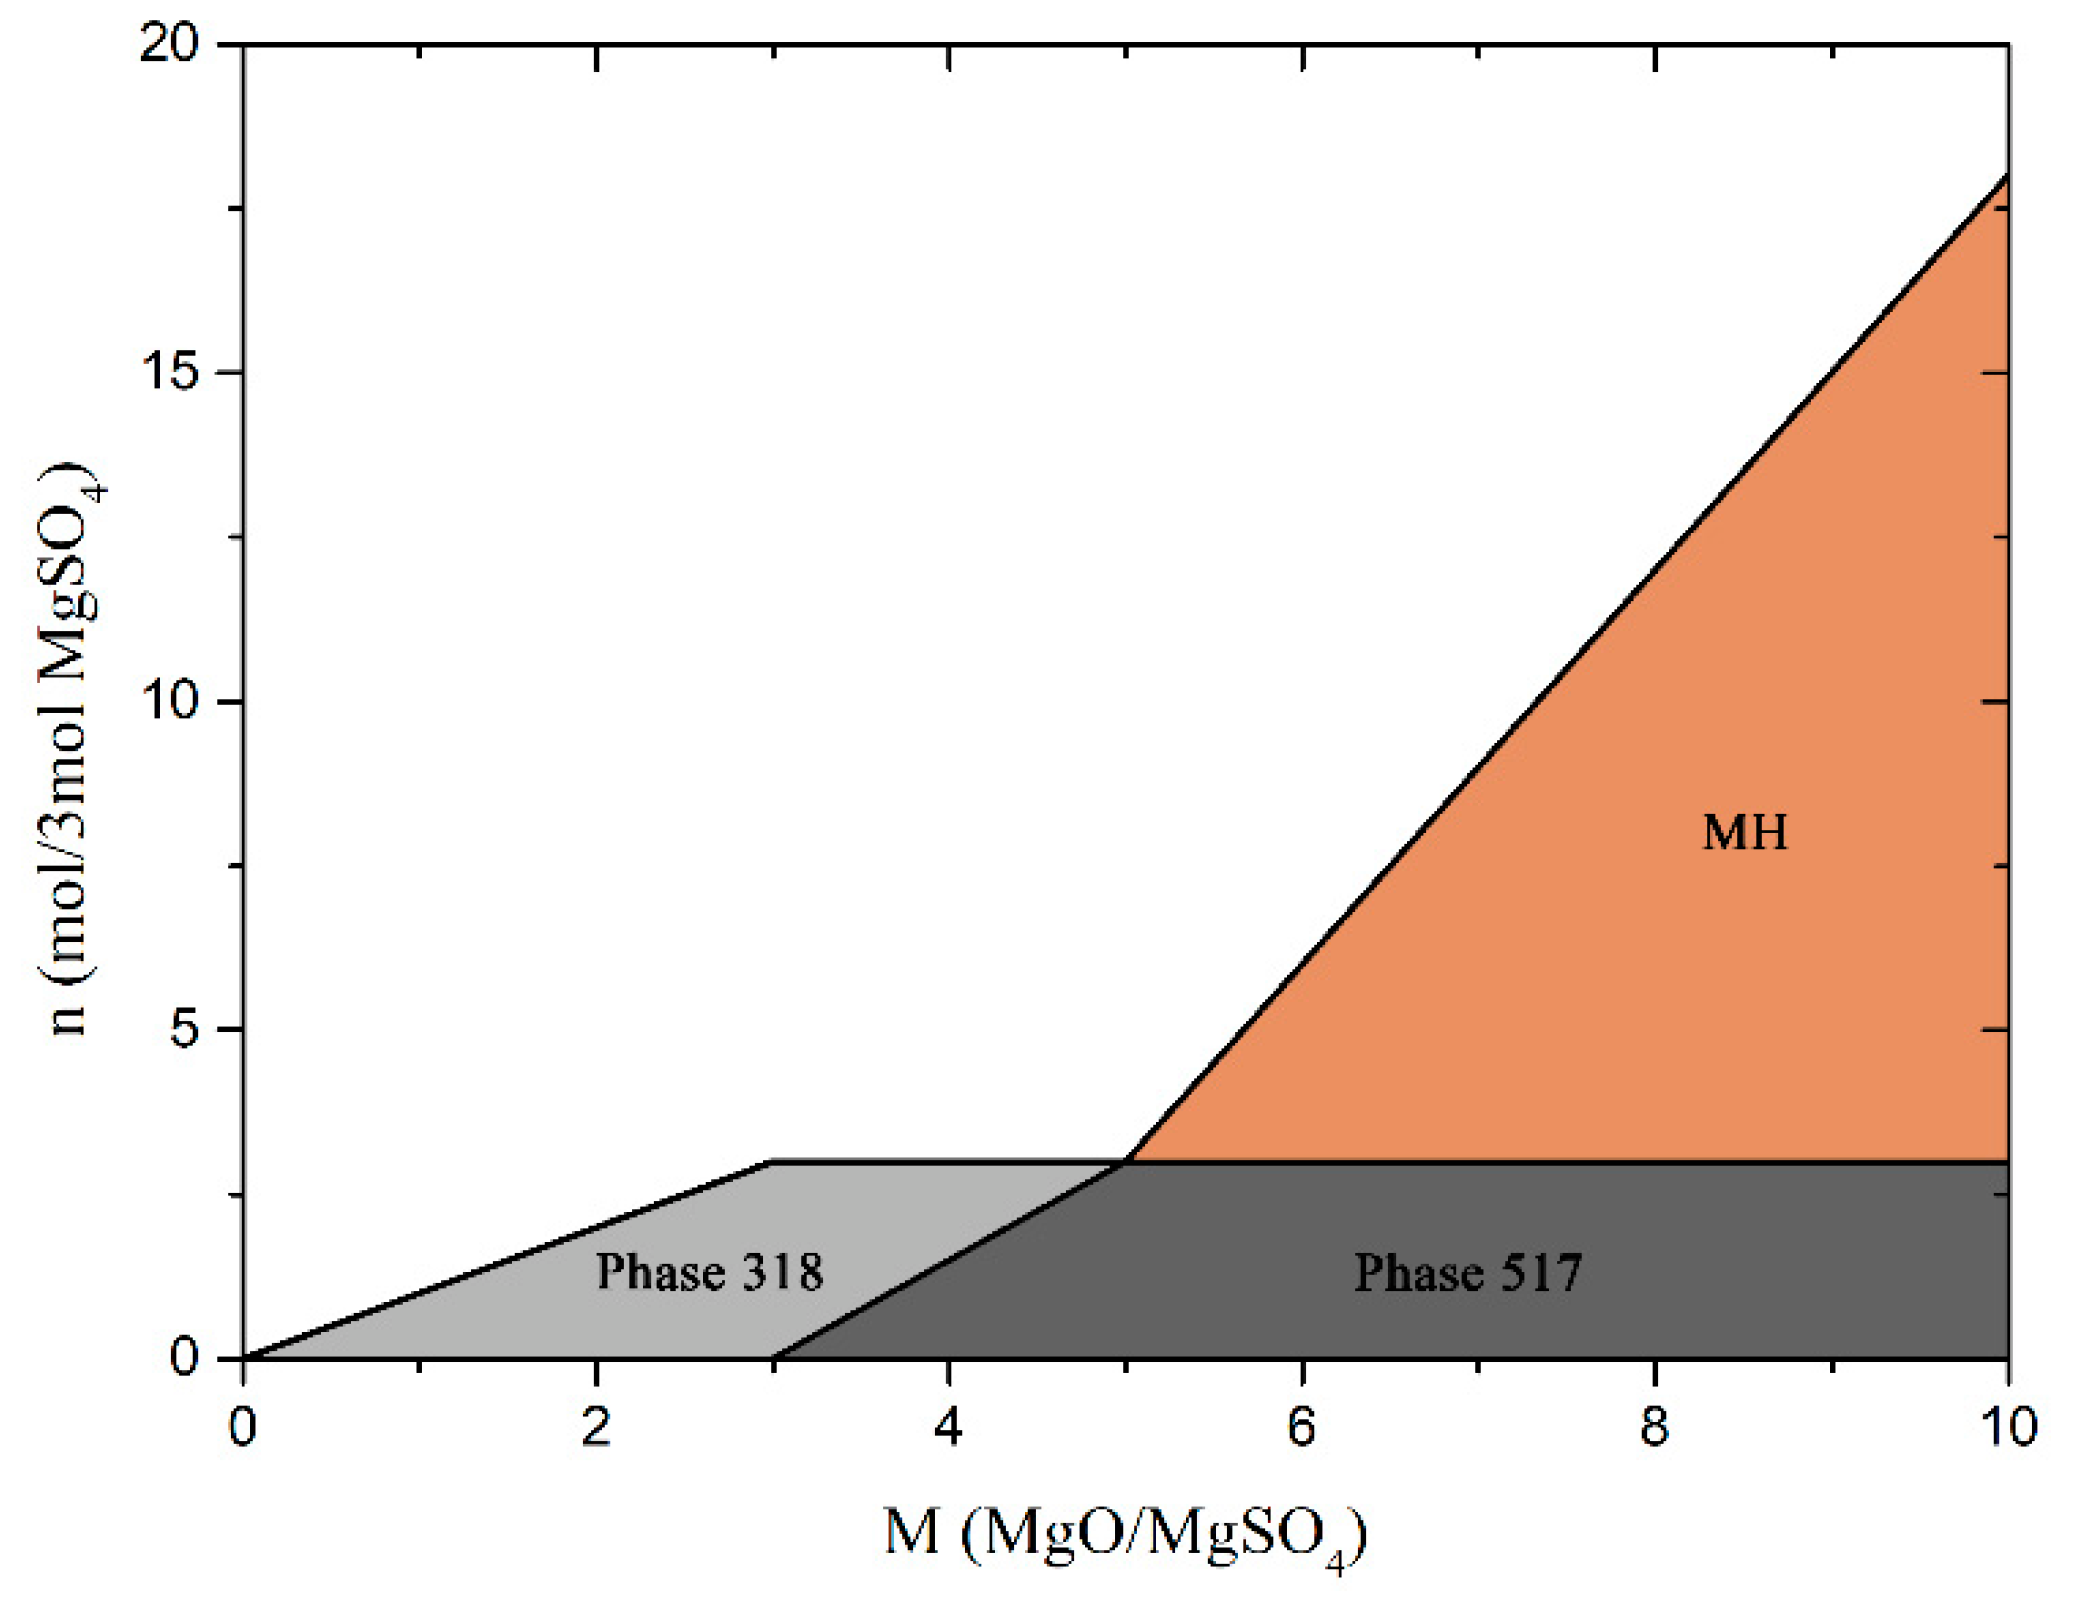
2O) and magnesium hydroxide (MH). When M increases from 3 to 9, the main hydrated products are found to be Phase 318, Phase 517, and MH [10,11]. It is believed that Phase 517 has the high strength and good water resistance [9]. However, it is noted that the low strength and chemical instability of eco-friendly MOS-based materials primarily hinder their large-scale applications to some extent.
Thermodynamics is an indispensable tool for understanding and studying chemical reactions [12]. It is generally accepted that the thermodynamic simulation can be applied to characterize the composition of hydrated products of cement pastes. Lothenbach et al. developed a model to simulate the composition of pore solution and the hydrated products in the hydration process of ordinary Portland cement based on the Parrot-Killoh hydration rate equation [13] where the influences of sulfate attacks [14], temperature [15] and additives [16] were considered. Similarly, Möschner et al. [17] explored the effect of citric acid on the composition of solid and liquid phases in the hydrating cement pastes based on thermodynamic calculations. The citric acid was found to significantly change the composition of hydrated products but had little influence on the composition of the pore solution. Recently, Zhou et al. [18] utilized a thermodynamic approach to study the formation conditions of two major hydrated products (Mg3(OH)5Cl·4H2O and Mg2(OH)3Cl·4H2O) of MOC pastes under room temperature. The results showed that the formation of hydrated products was controlled by the concentration of MgCl2, activity of H2O and pH values of the paste. The equilibrium of solid phase diagram and the solubility of different hydrated phases were consistent with those results obtained from experimental studies. Li et al. [19] developed a temperature-dependent thermodynamic model for Mg(OH)2 + MgSO4 + H2O system based on CALPHAD approach. Thermodynamic properties of several magnesium hydroxide sulfate hydrates were determined as functions of temperature. In summary, the present thermodynamic simulations have primarily been applied to simulate Portland cements and sulphoaluminate cements. The relevant thermodynamics database is only applicable for Portland cement and sulphoaluminate cements, and there is lack of report on the thermodynamic database dedicated to the MOS cement system. First principle calculation, as one powerful research tool inquiring the properties of materials from the atomic and molecular levels, has been successfully applied to investigate the thermodynamic properties of materials [20,21]. The most widely-used software based on the first principle calculation are WIEN [22], Gaussian 98 [23] and Material Studio [24]. A comparison among them is listed in Table 2. Therefore, it is very meaningful to establish a thermodynamic database that is applicable for the hydrating MOS-based materials through the first principle calculation.
Customarily, cement-based materials are considered as porous composite materials, perhaps consisting of a binding matrix and/or fragment of aggregates [25,26]. The pore structure affects the physical and chemical properties, and controls the durability of material [27,28,29]. During past few years, several microstructure-based models, such as the durability models of concrete model (DuCOM) by Chaube et al. [30], HYMOSTRUC by Van Breugel [31], and μic by Bishnoi and Scrivener [32], have been proposed to simulate the pore structure of cement paste at the micro level. Recently, a status-oriented computer model [33] has been proposed to simulate the microstructure of OPC pastes. It is assumed that four phases (unhydrated cement grains, large capillary pores, inner and outer hydrated product layers) are contained in the hydrated cement paste. The microstructure of cement paste can be simulated as a function of cement particle distribution, water to cement ratio, and degree of hydration. Compared to early developed models, HYMOSTRUC and μic only focus on the early hydration stage of cement-based materials and DuCOM is inapplicable to the poly-size particle system. Therefore, the status-oriented computer model is adopted in this work. A comparison among these microstructure-based models is illustrated in Table 3. The pores in cement-based materials are usually irregular and disordered, which show evident fractal features. The study on the fractal properties of cement-based materials is of great meaning as fractal theories enable to provide novel and effective ways to characterize of the microstructure of cement-based materials.
To address application scenarios of hydration and pore structure modeling on MOS cement paste, a preliminary research is carried out as follows: (1) the thermodynamic database relevant to MOS paste at 25 °C are collected and evaluated by the first principle calculation. (2) By using the established thermodynamic database and the geochemical speciation code PHREEQC, the influence of molar ratios on the equilibrium hydrated products assemblage is investigated. In addition, the basic relationship between the composition of hydrated products at equilibrium state and initial molar ratio is established. (3) Based on the obtained composition of equilibrium product, the visualization of microstructure is carried out based on the proposed models. A comparison among the porosities of MOS pastes with different molar ratios is given and a fractal analysis on the pore structure of MOS paste is conducted. In this work, a first principle calculation is originally adopted to evaluate the thermodynamic properties of phases in MOS cement system considering very little research on the evaluation of thermodynamic data among studies concerning MOS. The calculated thermodynamic data set the basis for the following thermodynamic analysis on the hydration products of MOS system, and thus facilitate the simulation and fractal analysis of pore structure of MOS paste.

2. Methods and Algorithms

2.1. Thermodynamic Modeling

In this work, the thermodynamic modeling is carried out using the geochemical speciation code PHREEQC since it can be used for free, and the database is open to users. In this work, the molar ratios of MgO/MgSO4/H2O in MOS cement pastes are set as 6:1:20, 8:1:18, 8:1:20, 8:1:22 and 10:1:20. The corresponding notations of pastes are taken as “MOS6120”, “MOS8118”, “MOS8120”, “MOS8122” and “MOS10120”. The implemented thermodynamic algorithm is appropriate for the MOS paste under temperature between 0 °C and 100 °C, and pressure 0.1 MPa [18]. In the thermodynamic algorithm, there is 3 mol MgSO4 dissolved in 0.972, 1.08, and 1.188 kg water respectively, and then 30 mol MgO is added into the solution in 1000 steps. The reactions and hydrated products of pastes are recorded until the equilibrium status of MOS paste reaches. Since Phase 115 and Phase 123 are metastable under room temperature and Phase 513 (512) can be stable only under steam-curing conditions [34], it is suggested that Phase 318, Phase 517 and MH should be main products considered in this work. By means of this algorithm, the evolution of Phase 318, Phase 517 and MH with different M and H under temperature 25 °C is investigated in this work [35,36,37,38].

2.2. First Principle Calculation

The thermodynamic data (such as thermodynamic equilibrium constant, K) of MH has been reported. Further, log K M g ( O H ) 2 = 17.11 is accepted by most literature so that it will be adopted in this work [36,39,40]. Unfortunately, the thermodynamic data of Phase 318 and Phase 517 are not available since the detailed structural information associated with these two phases is not clear and little literature focuses on the investigation of the thermodynamic properties of these two phases. In this work, Material Studio is adopted to carry out a first principle calculation to obtain the thermodynamic data of these two phases.
The crystal structures of Phase 318 (collection code: 425732) and Phase 517 (collection code: 425847) are available in the Inorganic Crystal Structure Database. Figure 1 and Figure 2 show crystal structures of Phase 318 and Phase 517 reconstructed using Diamond software, in which hydrogen atoms are omitted for clarity. First principle calculations are performed using CASTEP based on the density functional theory. There are two types of pseudo-potentials adopted in the CASTEP, i.e., Vanderbilt-type ultrasoft and norm pseudo-potentials. To evaluate the accuracy of two pseudo-potentials, the equilibrium constant of MH is calculated using these two pseudo-potentials to make a comparison as shown in Table 4. Although both pseudo-potentials highly evaluate the equilibrium constant of MH, ultrasoft-pseudo potential presents a better accuracy and performance. Therefore, Vanderbilt-type ultrasoft pseudo-potentials [41] and electron-ion interactions are adopted to evaluate the thermodynamic properties of Phase 318 and Phase 517.
The exchange correlation potential of Ceperley and Alder [42] parameterized by Perdew and Zunger [43] in the local density approximation is used. The self-consistent convergence of the total energy is 2 × 10⁻⁵ eV/atom and the maximal force on the atom is found to be 0.05 eV/Å. For the determination of phonon density of states, the dynamical matrix elements are calculated on the 2 × 2 × 1 grid of k-points using the finite displacement approach. The linear responses to ionic displacements and electric field are measured within the density functional perturbation theory as implemented in CASTEP code.

2.3. Hydration Algorithm

With respect to the hydration of MOS paste, the physical parameters of starting materials and hydrated phases are listed in Table 5. The computer simulation is performed based on the assumption of the growing of spheres [44,45]. The initial unhydrated MgO particles are considered to be spheres by randomly distributed in a cubic representative elementary volume (REV) with the size of 100 × 100 × 100 μm3 and periodic boundary condition. It is reported that the determination of size of REV is based on the particle size distribution (PSD) of reactive MgO, water to cement ratio and hydration degree [46,47,48,49,50]. The PSD of MgO is accessed from the data of Ref. [51], while those particles whose sizes are smaller than 0.5 μm or larger than 45 μm are not considered in this work for the purpose of reducing the burden of computational simulation. Then the specific PSD is given in REV that is discretized into 500 × 500 × 500 cubic voxels with a length resolution of 0.2 μm. The detailed information of hydration algorithm is consulted in Ref. [45].
The algorithm of calculating porosity is called as “Disk Filling Method” that is based on the ultimate hydration stage of MOS pastes. In this algorithm, a disk with an initial radius is applied to fill the pore in the paste. The radius of the disk will be constantly increased until the pores are fully filled. Therefore, the corresponding pore volume is considered to be equal to the volume of these disks. Therefore, the cumulative porosities of MOS pastes are obtained when the volume of REV is known.

2.4. Fractal Dimensions for Pore Structure

In recent years, fractal theory has been widely used in the study of cementitious materials [52,53,54,55]. According to the fractal theory, the number of pores (N(d)) whose diameters are larger than d and the probability density function of pore size distribution (f(d)) can be expressed as:
N ( d ) = ( d m a x / d ) D f
f ( d ) = D f d min D f d D f 1
where d, dmax, and dmin are the specific, maximum, minimum pore size, Df denotes the fractal dimension for pore size and varies in the range of 1–2 in 2D space.
Based on the simulated microstructure, Df can be efficiently calculated using the box-counting method [44]. This method is based on the image analysis of cross-section of a sample within a plane. In this work, the box-counting method is performed on ten representative slices of REV. At each slice, the Df is taken as the opposite number of the slope derived from the logarithmic fitting plot (Figure 3) in which N(d ≥ γ) is the cumulative account of pores and γ is the size of box. In addition, following this, ten values are averaged to obtain the final Df of MOS paste.

3. Results and Analysis

3.1. Results from First Principle Calculation

In this section, the thermodynamic data for different phases from the first principle calculation is presented. The Gibbs free energy (G) of different phases and atoms calculated based on the first principle is shown in Table 6.
To further analyze the thermodynamic properties of Phase 318 and Phase 517, the Gibbs free energy of formation ( Δ f G ) of these two phases is studied according to the following equation:
Δ f G = 1 a + b + c + d ( G t o t a l a G M g b 2 G O 2 c 2 G H 2 d G S )
where G t o t a l is the total Gibbs free energy of Phase 318 or Phase 517, G M g , G O 2 , G H 2 , and G S are Gibbs free energy of Mg, O2, H2 and S, which can be consulted in Table 6, a, b, c, d are numbers of corresponding atoms in the phase. Δ f G of Phase 318 and Phase 517 is listed in Table 7. The calculated results are comparable to the results reported from Ref. [19], in which Δ f G of Phase 318 and Phase 517 are −58.06 eV and −72.82 eV.
Once Δ f G is obtained, the Gibbs free energy change ( Δ r G m ) of different ionic reactions in the solution is deduced based on the equation below:
Δ r G m = ( i ν i Δ f G i ) p r o d u c t ( i ν i Δ f G i ) r e a c t a n t
where ν i is the stoichiometric number of different species i involved in the reaction. Equation (6) shows a difference of summation of Δ f G between products and reactants. c of different ions is shown in Table 8. Therefore, the relation between Δ r G m and K is established as:
Δ r G m = R T ln K
where R is the gas constant (8.314 J·mol−1·K−1) and T is thermodynamic temperature. The main chemical reactions and corresponding thermodynamic equilibrium constants involved in MOS paste are listed in Table 9.

3.2. Formation Conditions for Phase 318 and Phase 517

Equations (1) and (2) describe the formation of Phase 318 and Phase 517 in MOS pastes. Apparently exhibited by the chemical formations, reaction products, Phase 318 and Phase 517, are closely related to activity of Mg2+, SO42−, H2O and pH. According to the law of mass action, the formations of Phase 318 and Phase 517 in MgO-MgSO4-H2O cement system must meet the following inequalities, respectively:
log K ( 318 ) < 4 log a M g 2 + + log a S O 4 2 + 6 log a O H + 8 log a H 2 O
log K ( 517 ) < 6 log a M g 2 + + log a S O 4 2 + 10 log a O H + 7 log a H 2 O
where a represents the activity of ions. The subscripts of a represent different ions and water molecular. K ( 318 ) and K ( 517 ) are thermodynamic equilibrium constants of Phase 318 and Phase 517.

3.3. Influence of Molar Ratios on Hydrated Products

The equilibrium phase diagram in the cement system of MgO-MgSO4-H2O when H is equal to 18, is shown in Figure 4. “n” marked in the vertical axis represents the mole of hydrated product assemblage.
It can be observed that large M makes for the formation of Phase 517 and MH in Figure 4. When M is equal to 3, Phase 517 begins to appear in the MOS paste. As M is smaller than 3, the hydrated products are mainly Phase 318. With the increase of M, Phase 517 is gradually produced and coexists with Phase 318. It has been suggested by [3] that the compressive strength of MOS cement paste is primarily dependent on the contents of Phase 318 and Phase 517. As similarly reported by [10], the experimental results reveal that the compressive strength of MOS cement paste increases as M increases from 3 to 5, which can be attributed to the accumulation of Phase 318 and Phase 517. When M exceeds about 5, accompanying with the disappearance of Phase 318, Phase 517 turns to be the dominant product, indicating that the formation of Phase 517 is preferred with high MgO content. Further increase of M value to 5 can give birth to MH as there is not enough MgSO4 solution to be reacted and the amount of MgO is excessive. It is also revealed in [10] that the compressive strength of MOS cement decreases when M continuously increases from 5 to 13, giving birth to more MH, which is consistent with simulation results in this work. It is suggested that large M should not be recommended since the total volume of MH increases with the increment of M, which is unfavorable to the strength development of MOS cement pastes.
The influence of H on the phase composition is demonstrated in Figure 5 with a fixed value of M = 8. It can be observed that there is only Phase 318 in the paste when H is small. As H is equal to around 8, Phase 517 starts to appear in the system and Phase 318 gradually decomposes. MH does not emerge until H comes to 16 when Phase 517 starts to decompose. When H approaches 25, Phase 517 is totally disappeared, indicating that the initial formation of loose paste structure. Further increase of H gives accumulation of MH and gradually results in the collapse of paste structure, demonstrating the low water-resistance of MOS cement paste. Similar experimental results have been reported in [56], in which XRD results exhibits stronger peak intensity of Phase 517 and weaker peak intensity of MH when H = 20 than H = 28, indicating the decomposition of Phase 517 and generation of more MH. It is suggested that when H is around 14–16, the only equilibrium phase is Phase 517, which is favorable to the strength development for MOS cement paste. Therefore, in practical application of MOS cement, the appropriate value of H should be taken around 14 to 16 to form MOS cement paste with higher mechanical strength and better water resistance.
The phase compositions of MOS pastes obtained from this work are compared with the ones from other literature [3,9,57], as shown in Table 10. Accordingly, when M = 8, the mass fractions of Phase 517 predicted in this work are 65.82 and 44.93 for H = 20 and H = 11, respectively, while the ones are 60.24 and 48.69 obtained from the previous experimental works. Although there is slight difference among the simulated and experimental results, the consistency is clear. The mass fractions of Phase 517 are relatively consistent in Table 10 while the ones of other phases are uncertain since different minerals in experimental MgO powders and possible additives may be incorporated. Besides, the carbonation of MH and other hydrated phases are not taken into consideration in this work [3], which may lead to some discrepancies of results in Table 10.

3.4. Initial and Ultimate Hydration Stages

Slices of REV with size of 100 × 100 × 100 μm3 in Figure 6, Figure 7, Figure 8, Figure 9 and Figure 10 exhibit the initial and ultimate hydration stages of MOS pastes. Different colors in these figures stand for different phases in paste. Orange, red, blue, yellow and green represent the unhydrated MgO particle, MH crystal, pore, inner and outer hydrated products. In this work, the ultimate hydration stage corresponds to 80% hydration degree and is referred to as such stage in which the diffusion behavior is dominated in the paste. From these figures, it is expected that small MgO particles are totally hydrated due to the rapid reaction, while the hydration of large ones is partially controlled by the water diffusion in deposited hydrates covered onto the surface of MgO particles. Therefore, the interior unhydrated MgO part has the potential to hydrate again once the outer hydrates decompose and MgO particles are exposed to water. Additionally, the original pores of MOS pastes at the initial hydration stage are gradually filled by hydrated products during the hydration process. The solid skeleton of pastes is gradually formed, which contributes to the strength gain of pastes. It is noteworthy that large M is beneficial for the refinement of pore structure of MOS pastes but large H has an opposite effect, which is verified by the porosity analysis in the next section.

3.5. Pore Structure of MOS Pastes

One of the most commonly used indicators to describe the pore structure is porosity [58]. In this work, the porosities of MOS pastes with different M and H are calculated by MATLAB. The comparison of cumulative porosities in different MOS pastes is presented in Figure 11. It can be obviously seen that porosity of MOS cement paste decreases from 22.58% to 4.30% with the increase of M when H is fixed at 20. This may be attributed to the fact that increased content of MgO reacts with excessive water and the products fill in the pores, and thus, a small porosity is obtained [59]. On the contrary, large H is beneficial for the formation of MH with loose structure and leads to a large porosity when M is fixed [60].
With respect to MOS paste for the given molar ratios (M = 8 and H = 20) in the ultimate hydration stage, the total porosity in terms of the pores whose diameter is from 5 nm to 330 μm, determined by the mercury intrusion porosimetry test is claimed to be 25.07% in the work by Wu et al. [3], while the one derived from this work is approximately 13.07%. Since the pore size range considered in the calculation of porosity is from 0.2 μm to 10 μm in this work, the presented result is smaller than that of literature [3]. Besides, it is reported that porosity from the porosimetric characterization is sometimes overestimated because the cracks caused by mercury intrusion are erroneously identified as “Pores” [61]. To some extent, the simulated results are consistent with experimental ones. Other experimental results with different M and H [60,62,63] are collected in the Table 11. It should be emphasized that the exact hydration age obtained from our simulation is a bit ambiguous because the simulation is status-oriented. Sometimes, the comparison in terms of hydration age may not be achieved easily. Besides, the size of the REV is pivotal when the porosity of cement paste is examined based on microstructure methods. Herein, four different sizes of REV are adopted to evaluate the porosity of MOS cement paste and the results are presented in Table 12 and Figure 12, respectively. It can be easily observed that the porosity of MOS cement paste increases with the increase of the REV size. It is attributed to the factor that small REV may not cover all large particles, and thus, large pores are neglected, resulting in a relatively small porosity [48]. Based on affordable computational efficiency and resolution, appropriate REV contains almost all the MgO particles is massively considered when the porosity is examined.

3.6. Analysis of Fractal Features of MOS Pastes

Based on Equations (3) and (4), Df of different MOS pastes at initial and ultimate stage of hydration can be derived and the results are presented in Table 13 and Figure 13. Figure 12 illustrates that Df obtained from simulation results varies from 1–2, which is consistent with the range reported in Ref. [64]. Meanwhile, it can be noticed that Df increases with the increase of porosity, which is similar to the trend discovered by Yu et al. [65]. This also confirms the reliability of pore structure obtained from the present simulation. From Table 13, it can be also observed that Df approaches to its possible maximum value two when the porosity is around one at the initial stage. The decrease in the Df from initial stage to ultimate stage of hydration can be attributed to the evolution of microstructure of MOS paste. As MOS hydrates, the pores of cement pastes are gradually filled with hydration products, leading to a large porosity and Df.
Besides, it is noteworthy that Df obtained from this work is not only related to the porosity of cement paste but also to the value of M and H. The MOS paste with high M shows small Df while large H gives birth to high Df. This phenomenon may be explained as the complexity of pore size distribution in cement paste. With respect to different M and H, differences in pore size distribution may generate in simulations, leading to different fractal features. The MOS paste with high M has a relatively large initial pore space so that a large portion of hydration products generates with gel and small capillary pore embedded in, resulting in a small Df. While for large H, a large portion of space is occupied by water, leading to large pores and Df.

4. Conclusions and Prospects

In this work, a novel multiscale modeling strategy is proposed to evaluate the pore structure and fractals in MOS cement system. A first principle calculation is initially performed to obtain the thermodynamic data for main phases and aqueous geochemical calculations are followed to evaluate the phase composition. Finally, the hydration status is visualized using microstructure-based method and porosity and pore fractals are analyzed. Based on the findings, several conclusions can be drawn:
(1) Based on the common molar ratios of magnesium oxysulfate cement, the basic thermodynamic data of MOS cement system under the temperature of 25 °C is obtained through literature and first principle calculation. The consistency in the phase composition between simulation results using PHREEQC and experimental results demonstrates that the thermodynamic simulation is applicable to the MOS cement system.
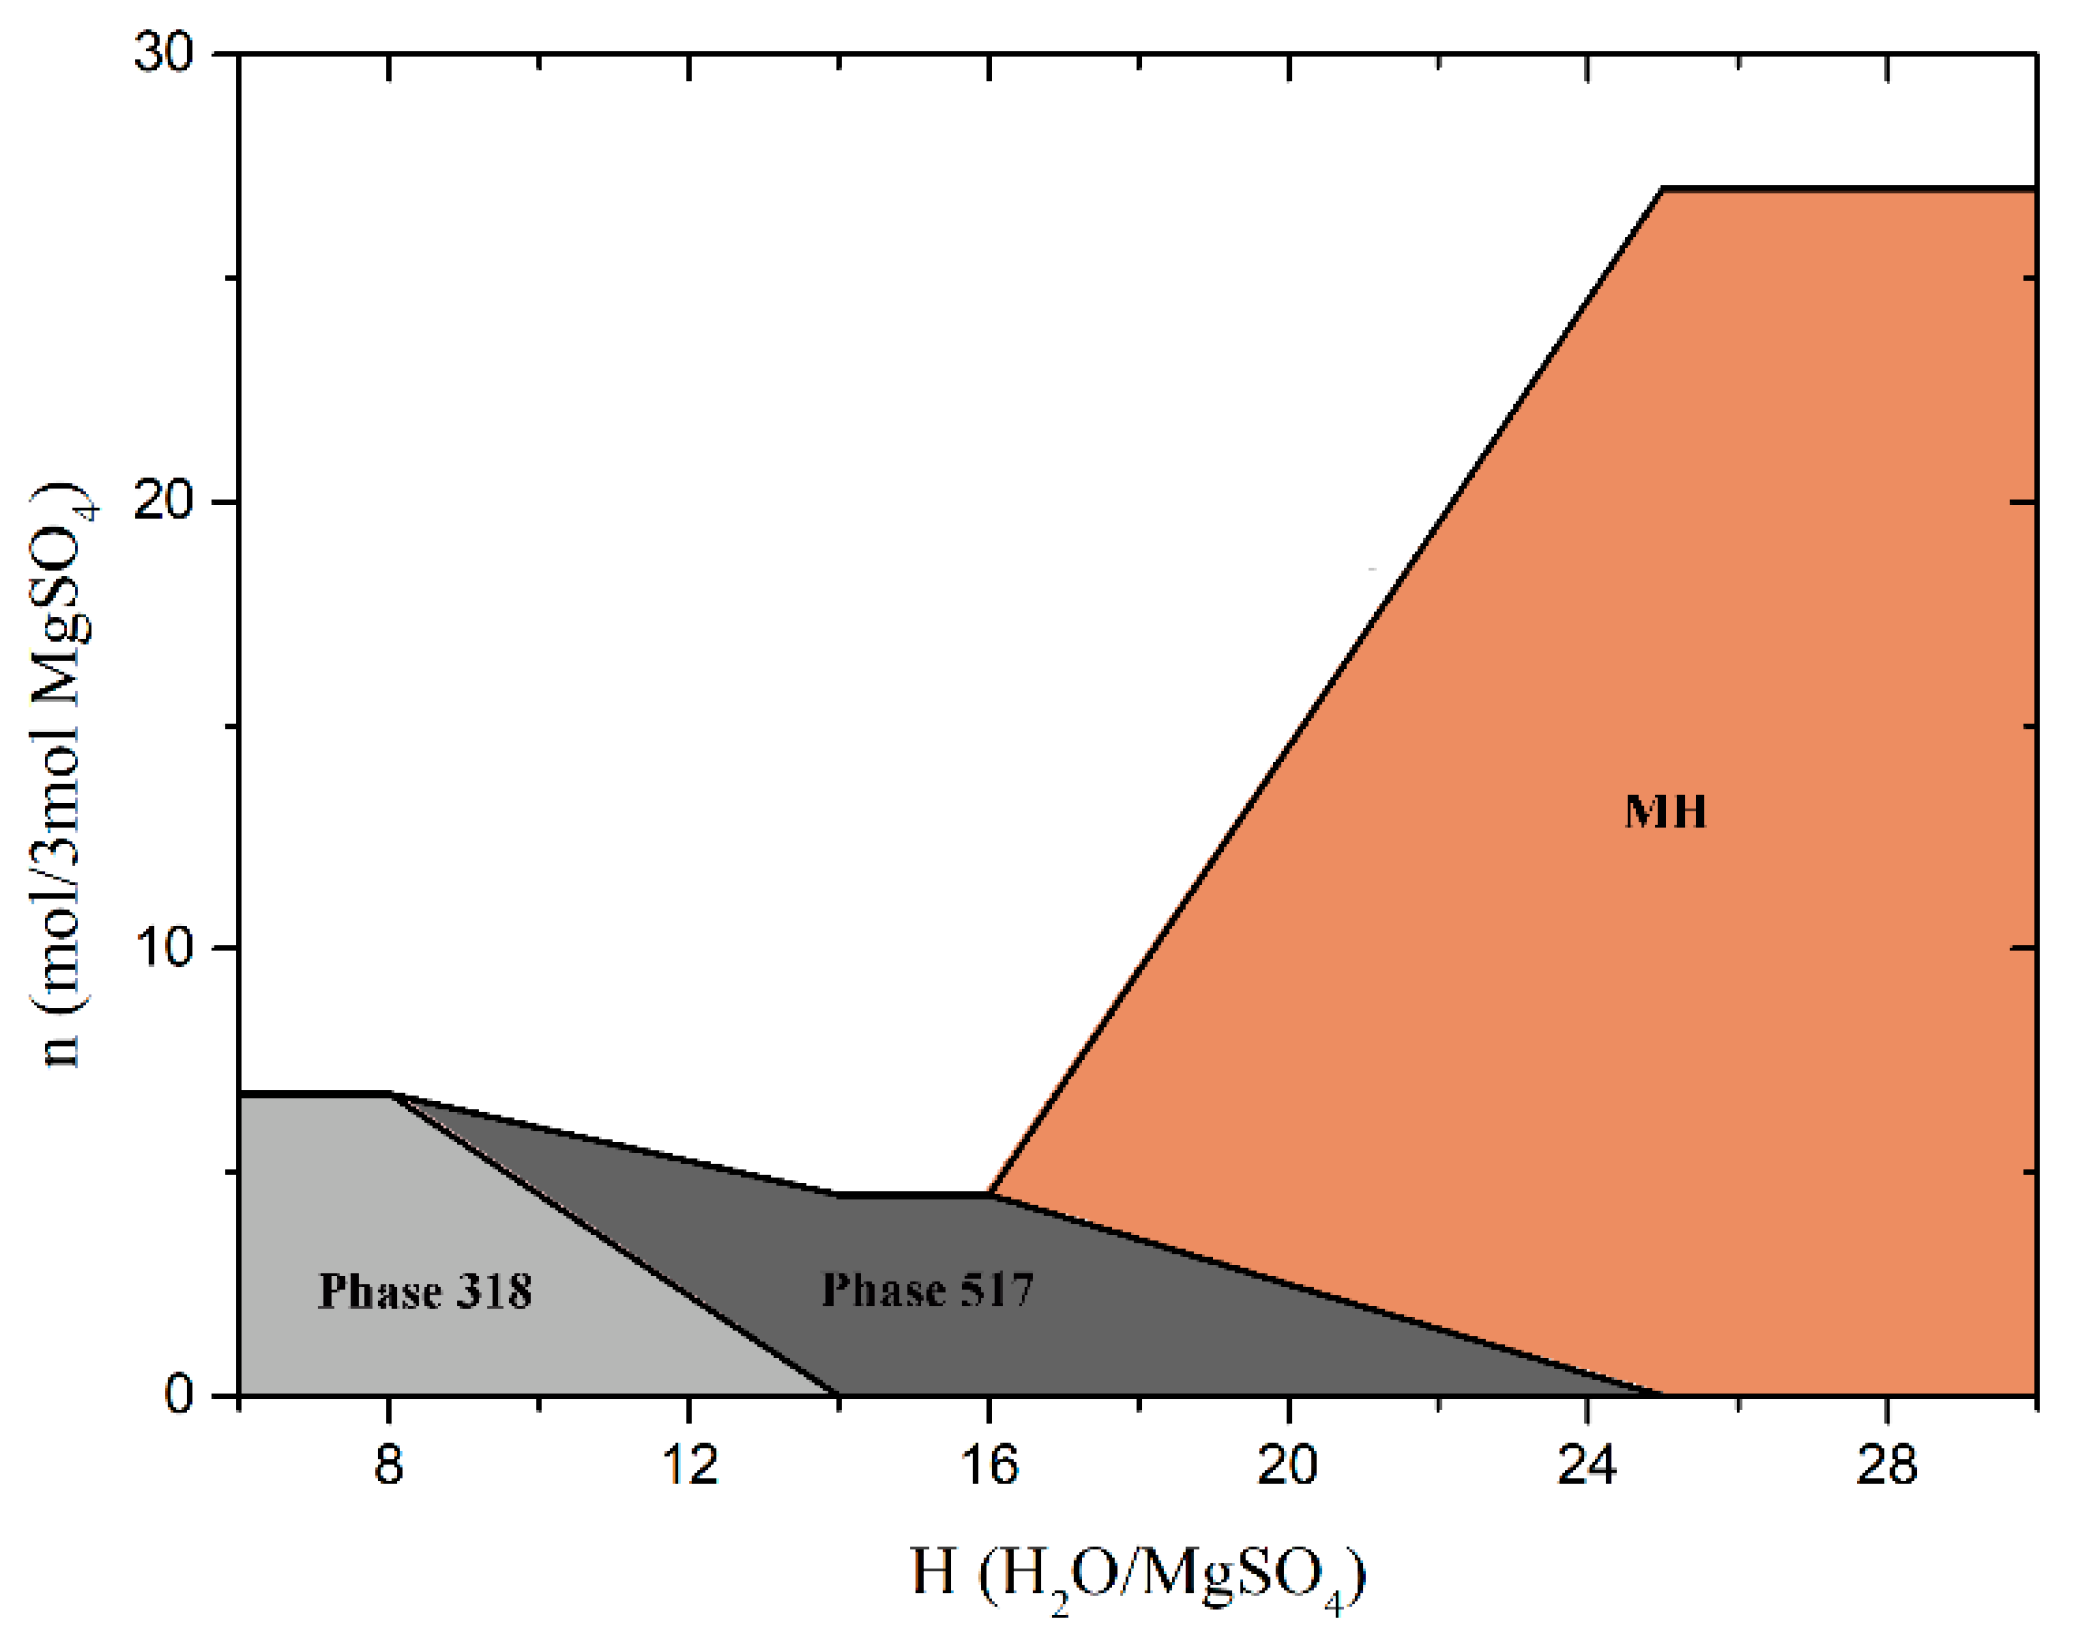
(2) Using the established thermodynamic database of MOS cement system, the hydration of MOS cement system and the stability of hydrated products under normal temperature and pressure are well studied. Results show that the composition of hydrated products in MOS cement system is sensitive to M and H. Phase 517 is precipitated with the increase of M and Phase 318 disappears gradually. When MgO is excessive, only MH will generate. Phase 318 solely exists when H is low, and Phase 517 appears gradually with increase of H. When H is large enough, MH comes to the only products, which corresponds to the low strength and water resistance of MOS pastes. It provides a certain benefit for mixture design: it is recommended that when H is equal to 18, M = 5 is beneficial to the strength and water resistance development of MOS cement pastes, meanwhile, when M is equal to 8, H = 14–16 is appropriate for mixture design.
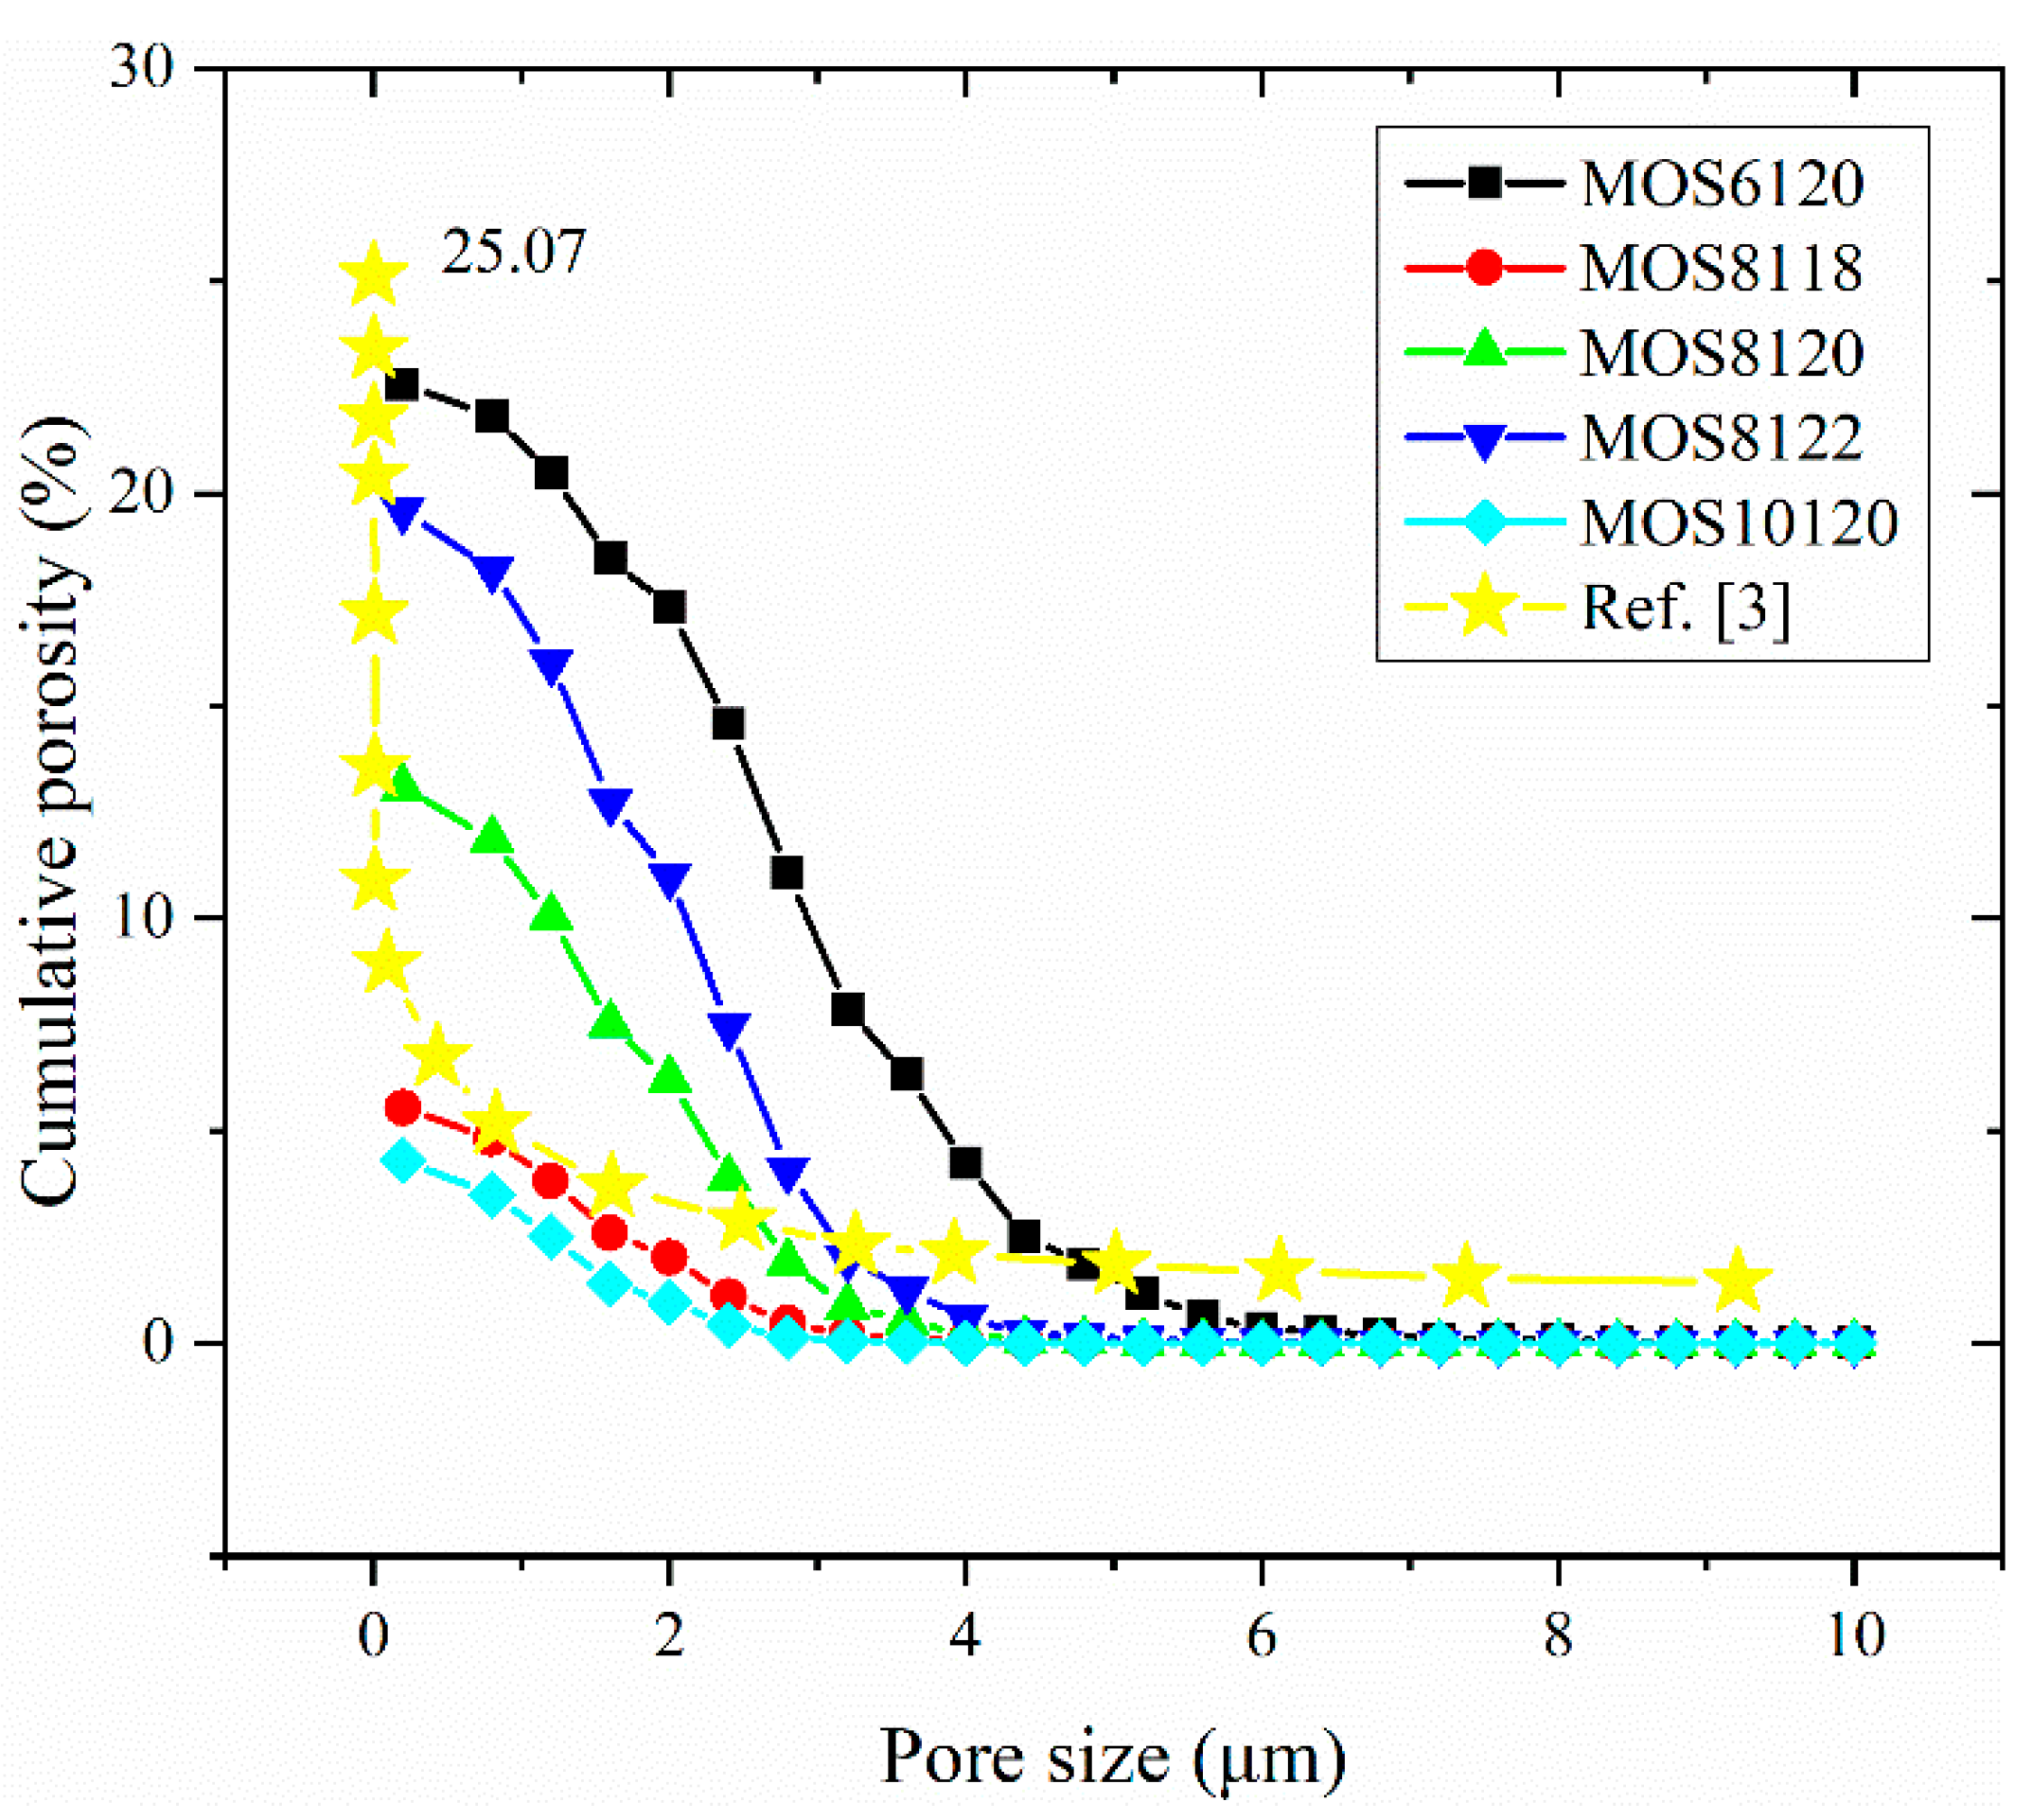
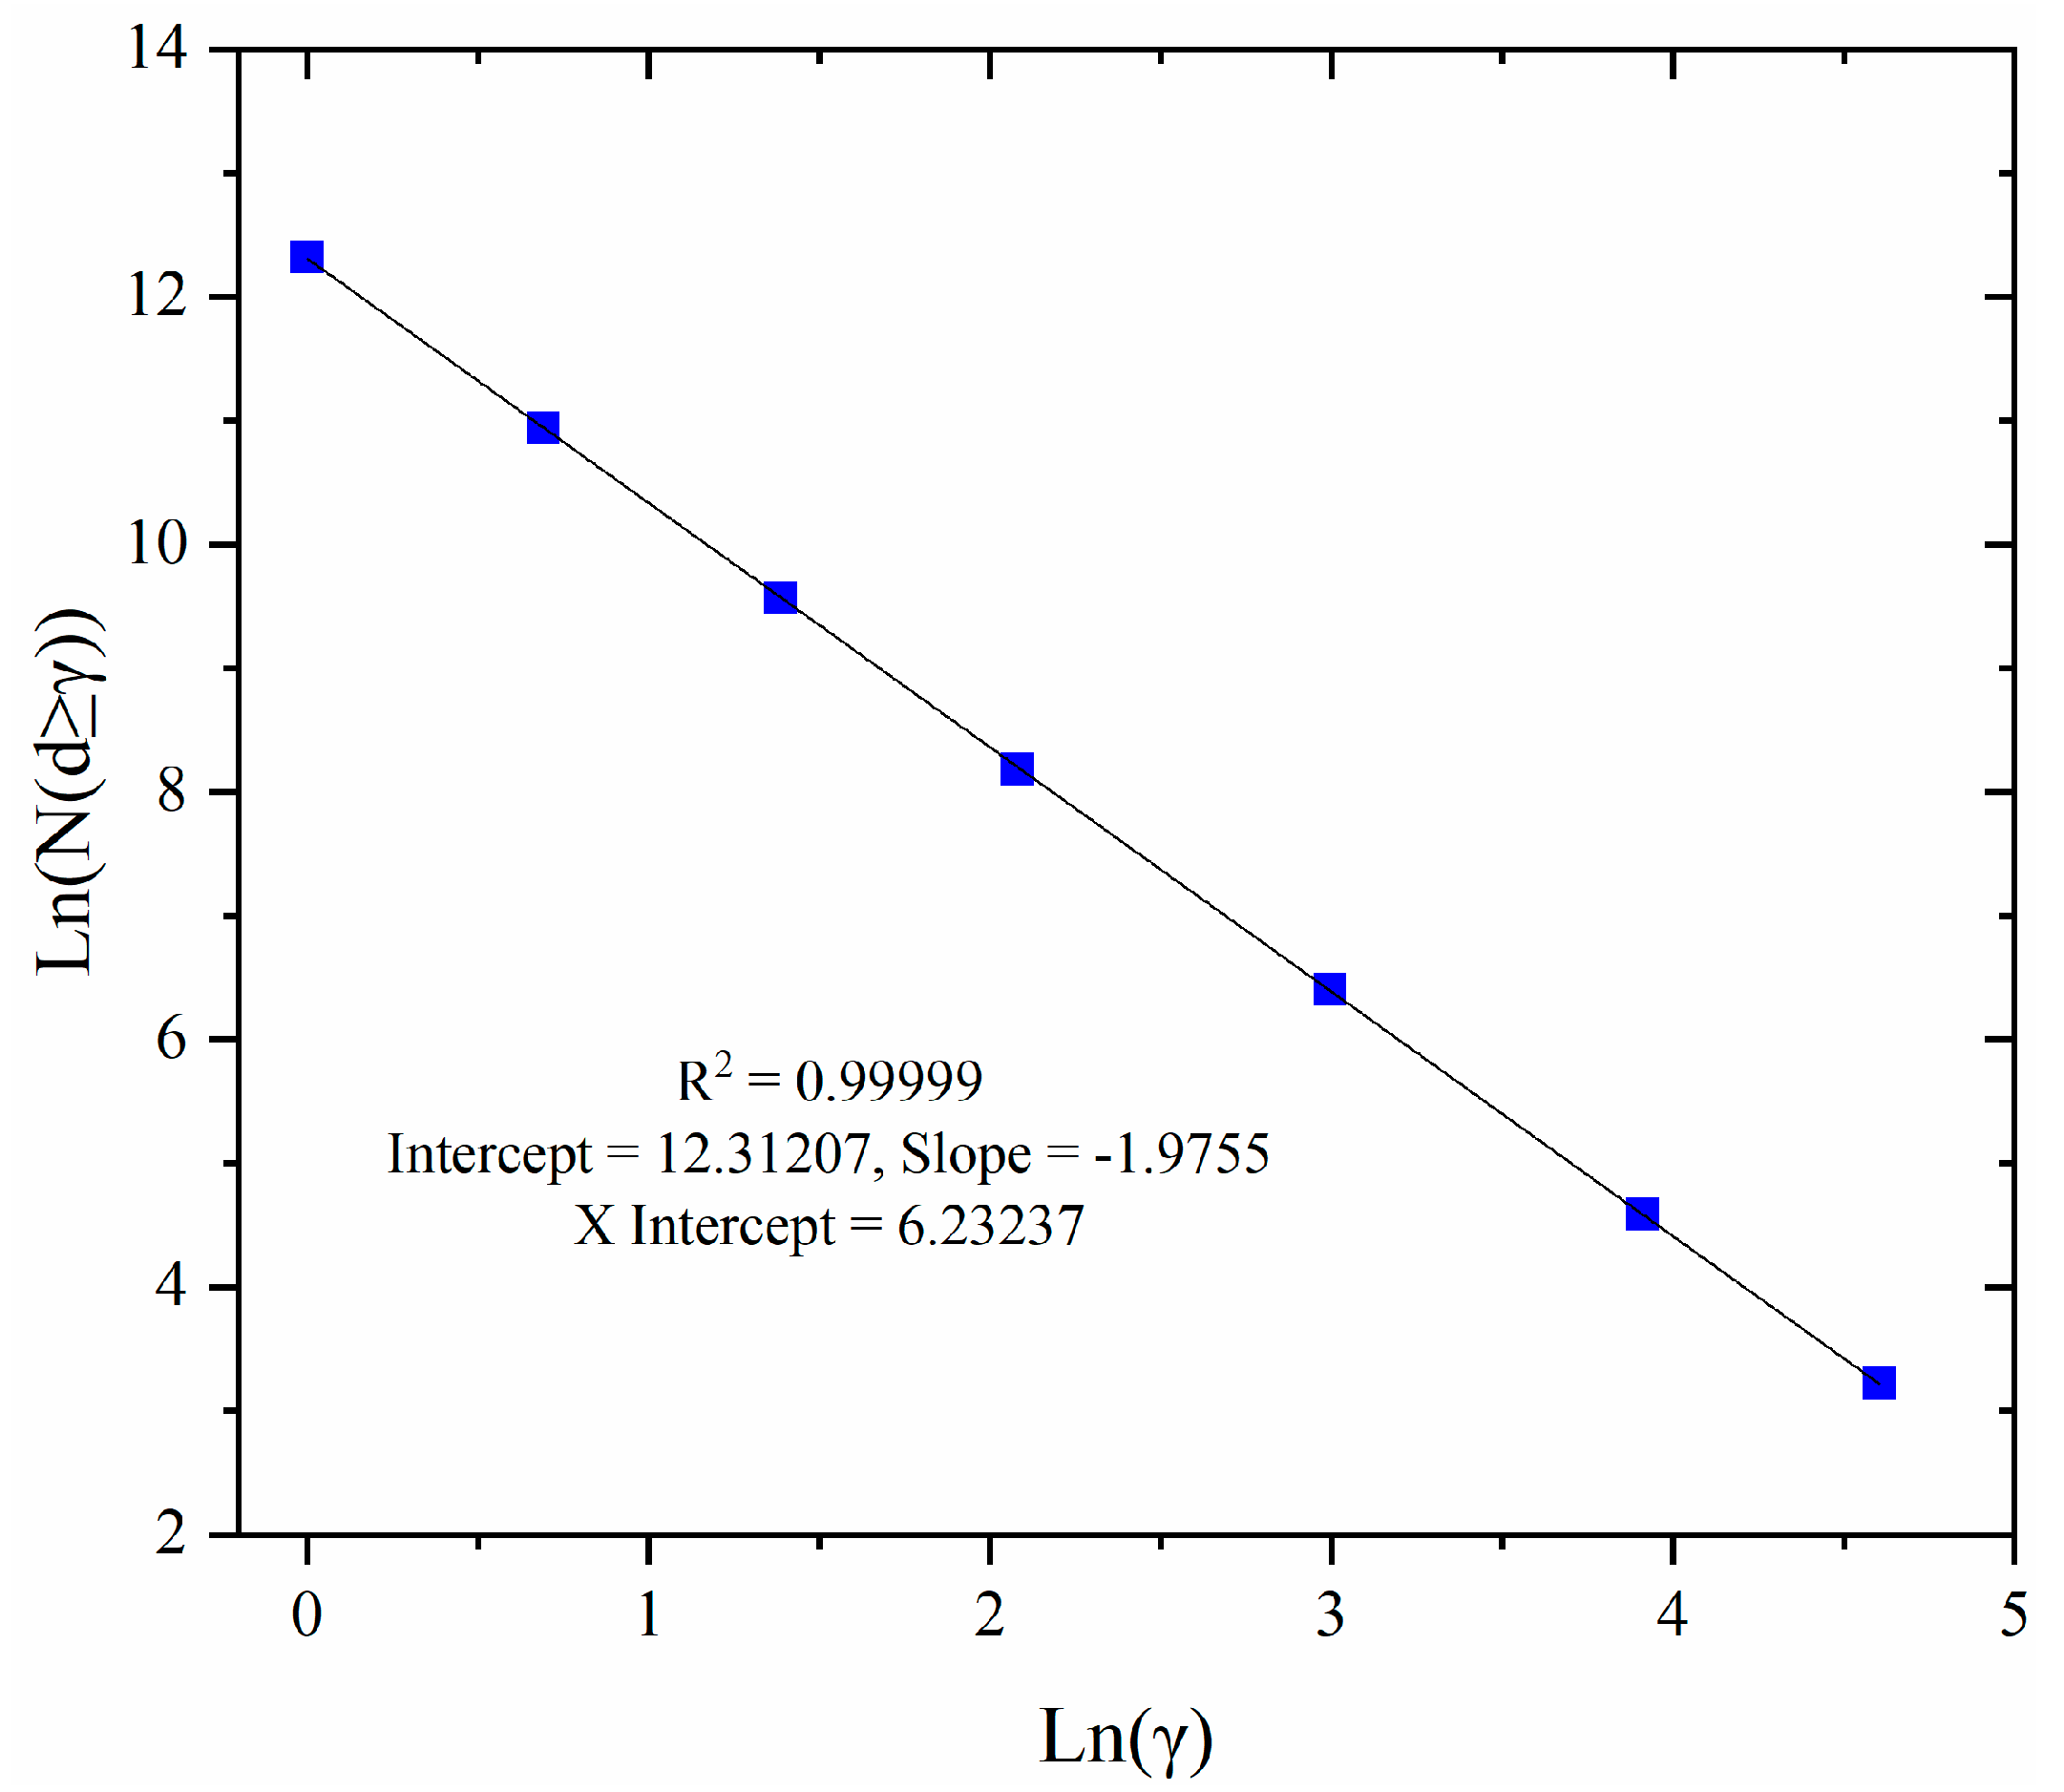
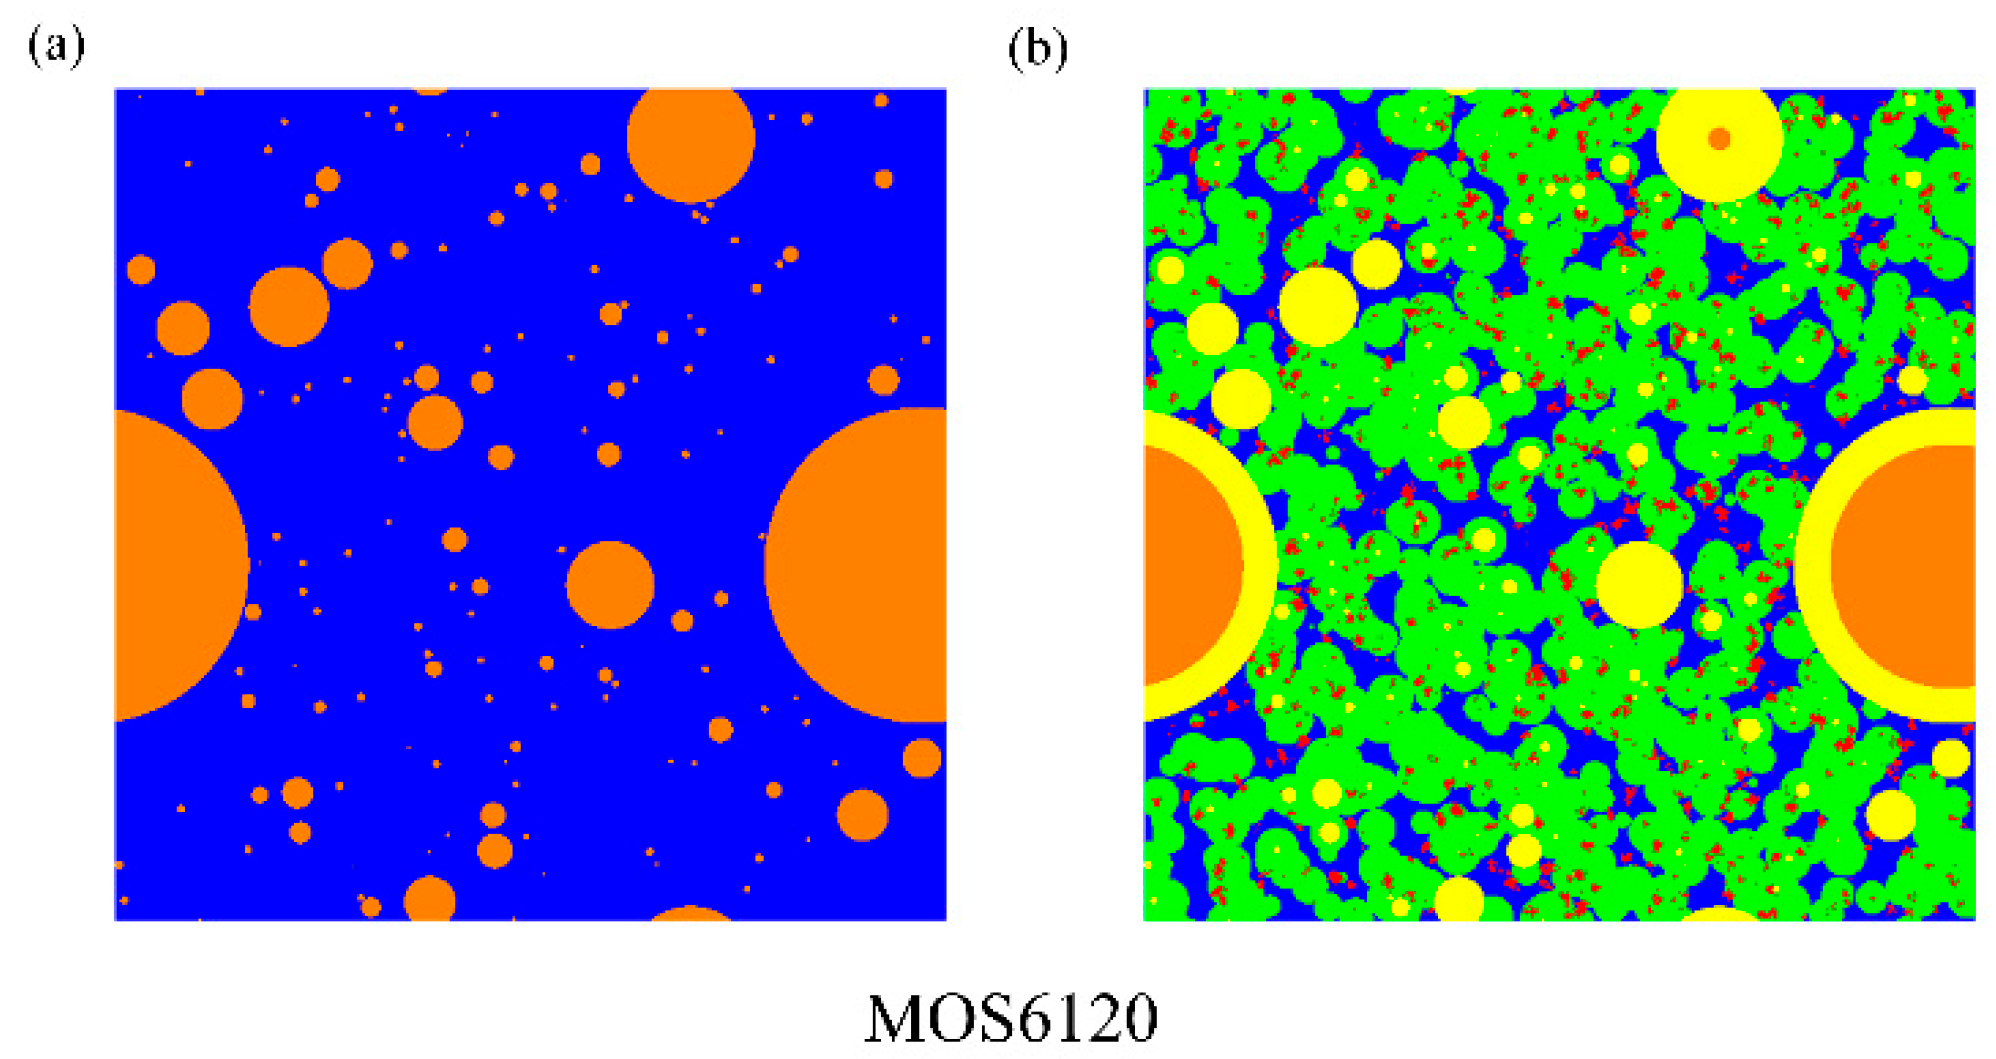
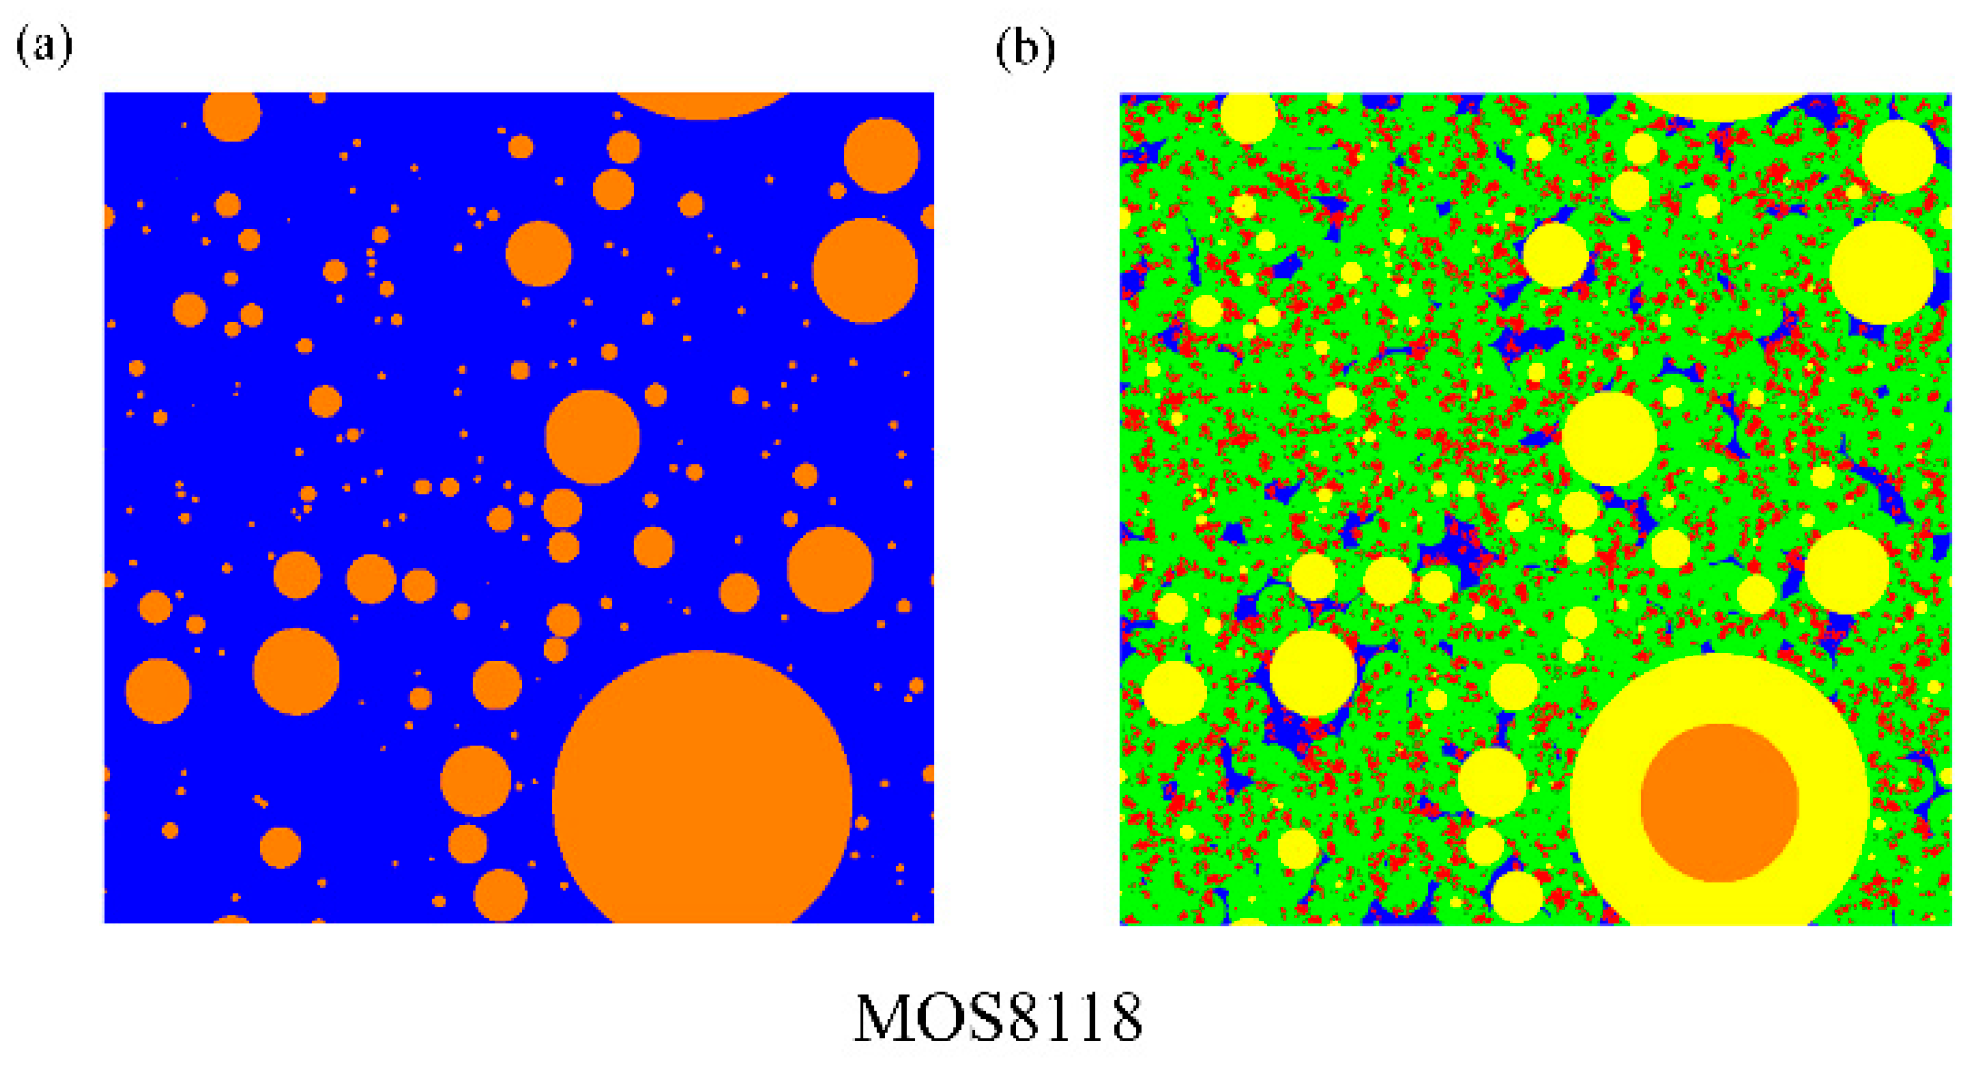
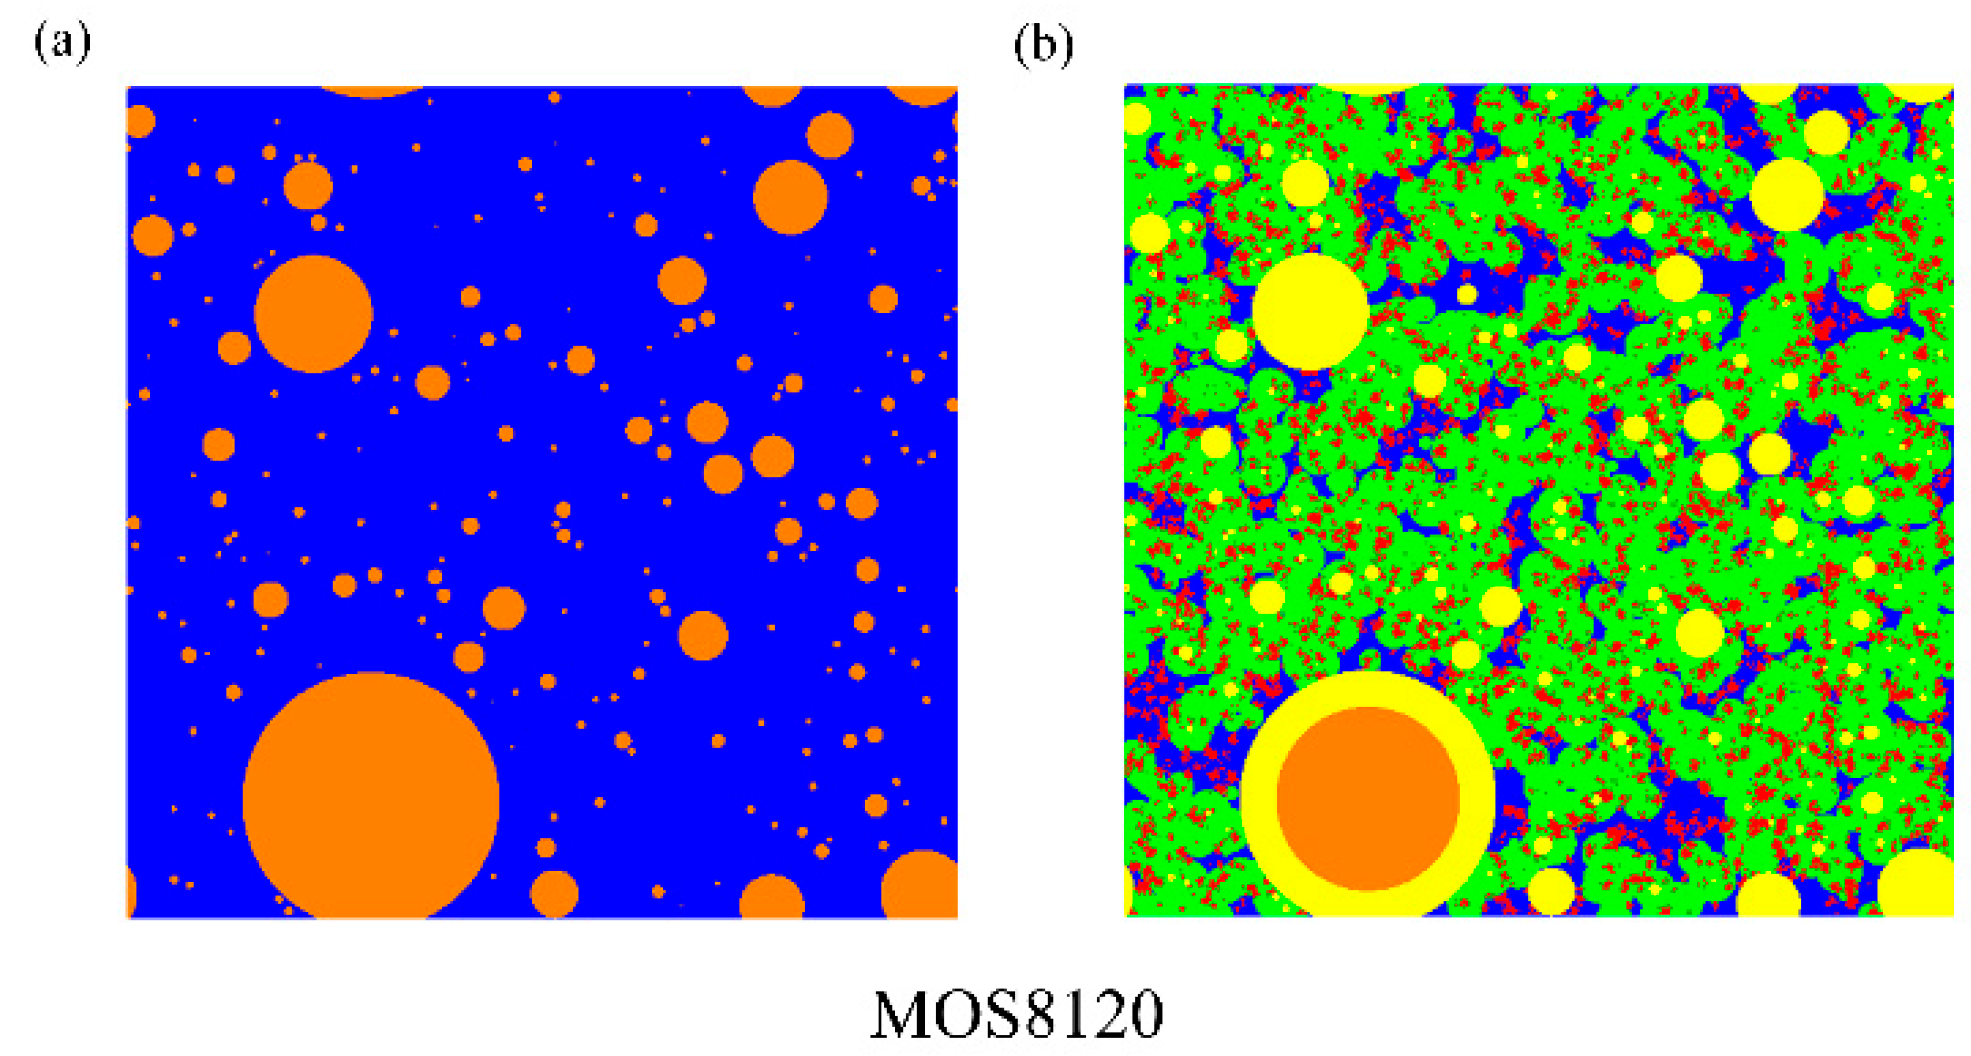
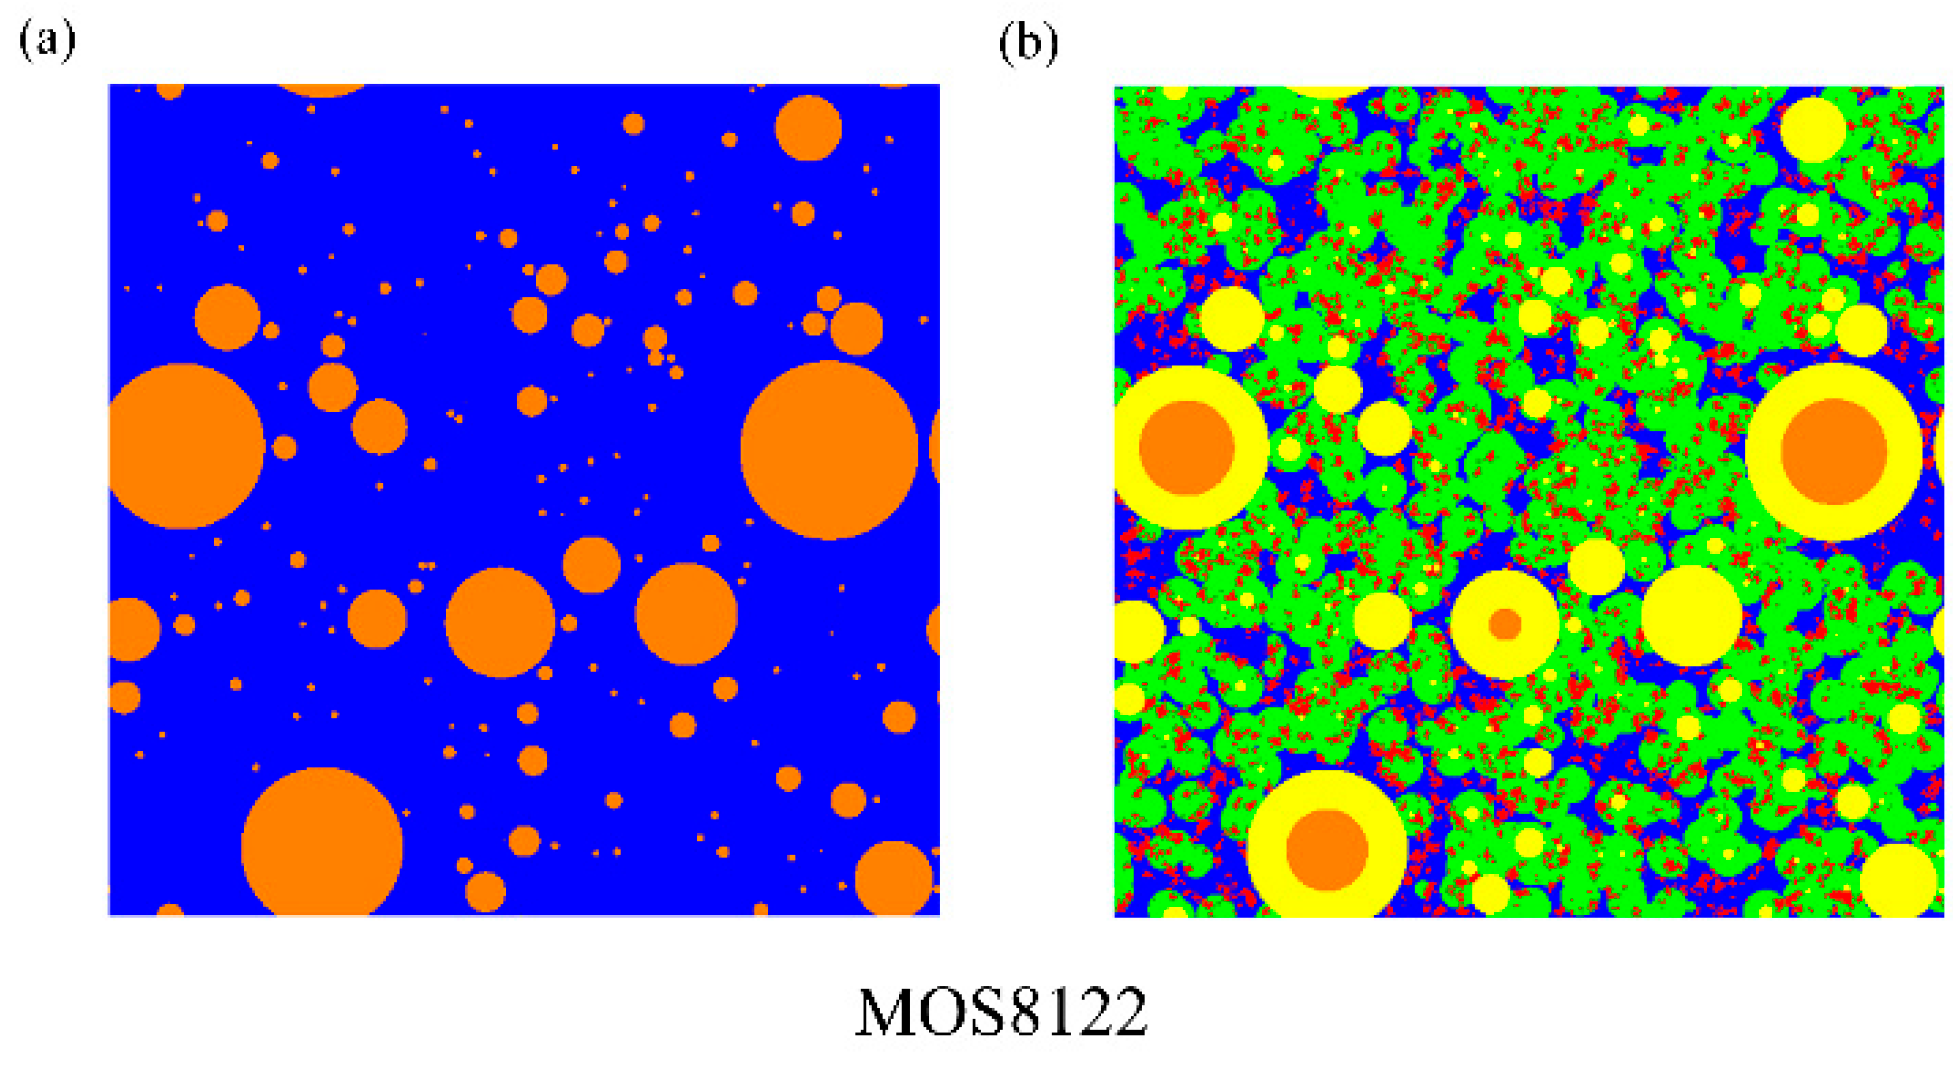
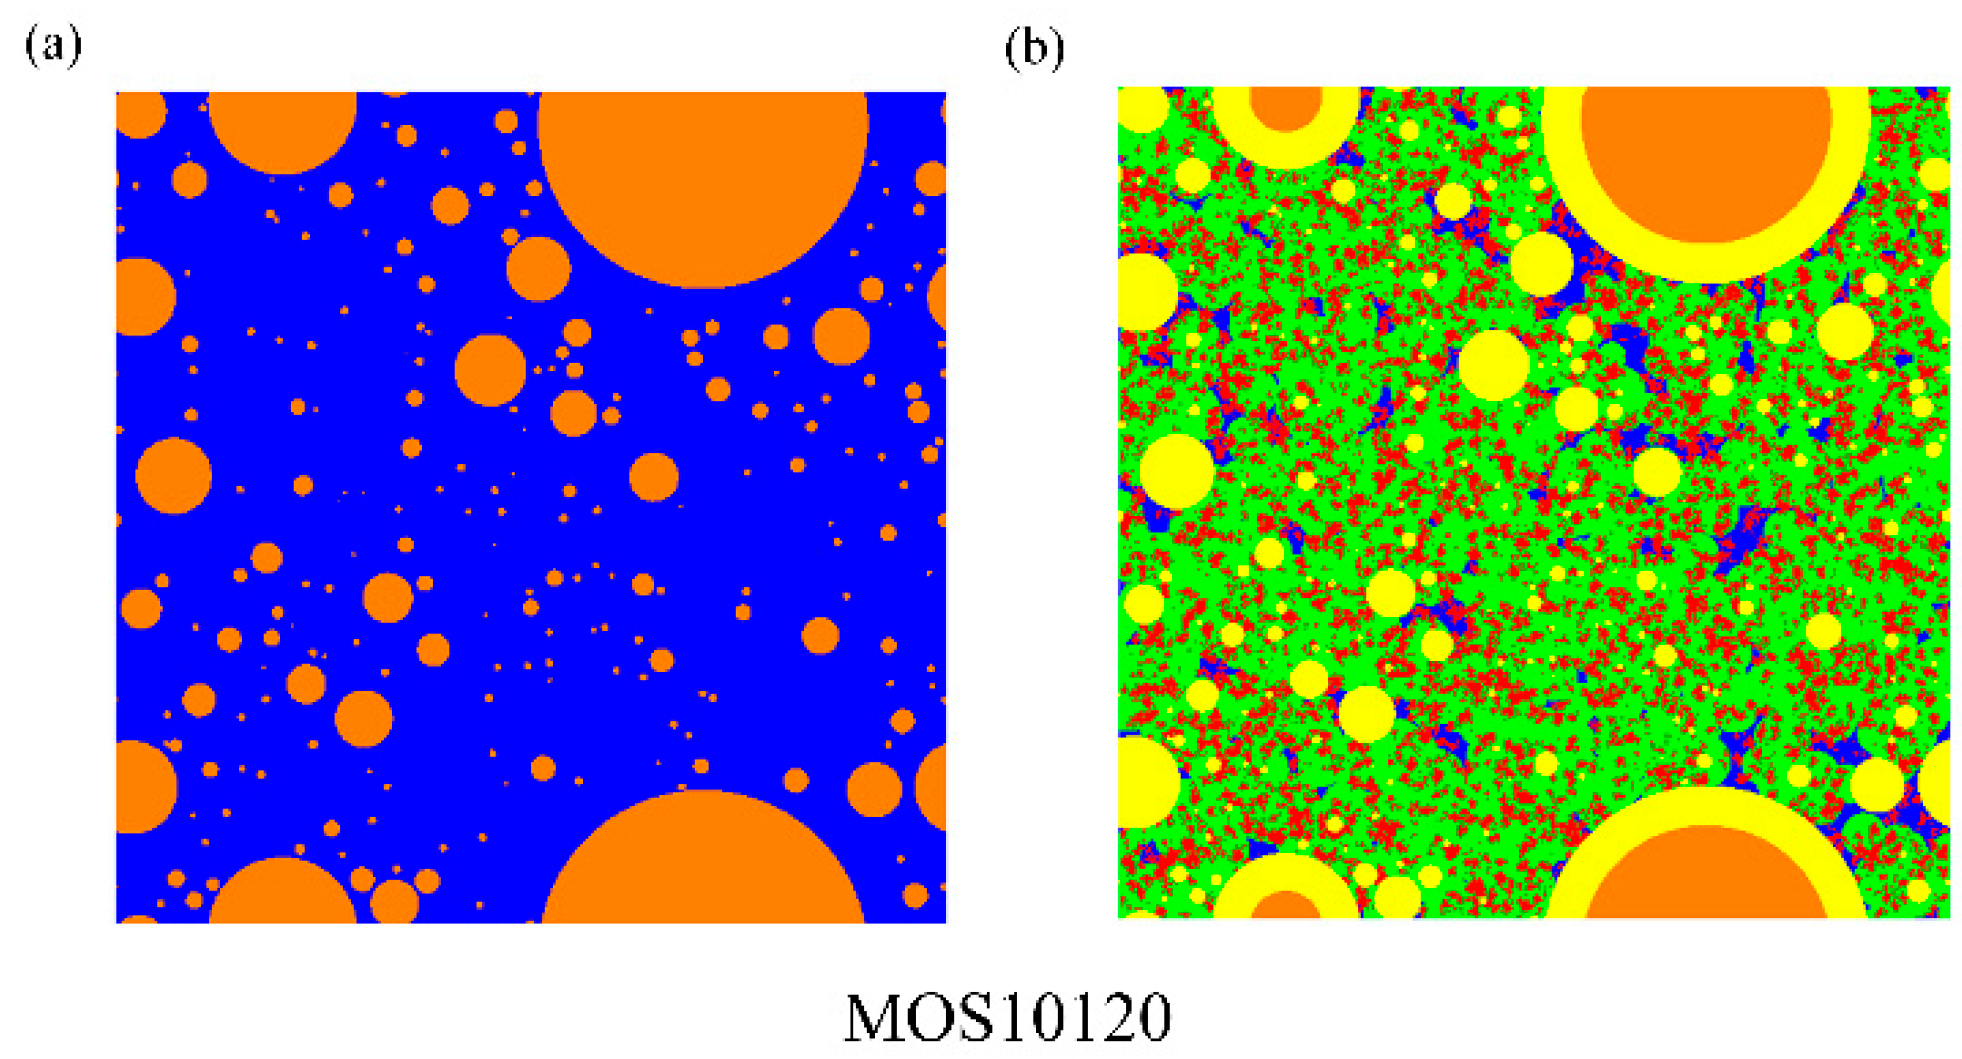
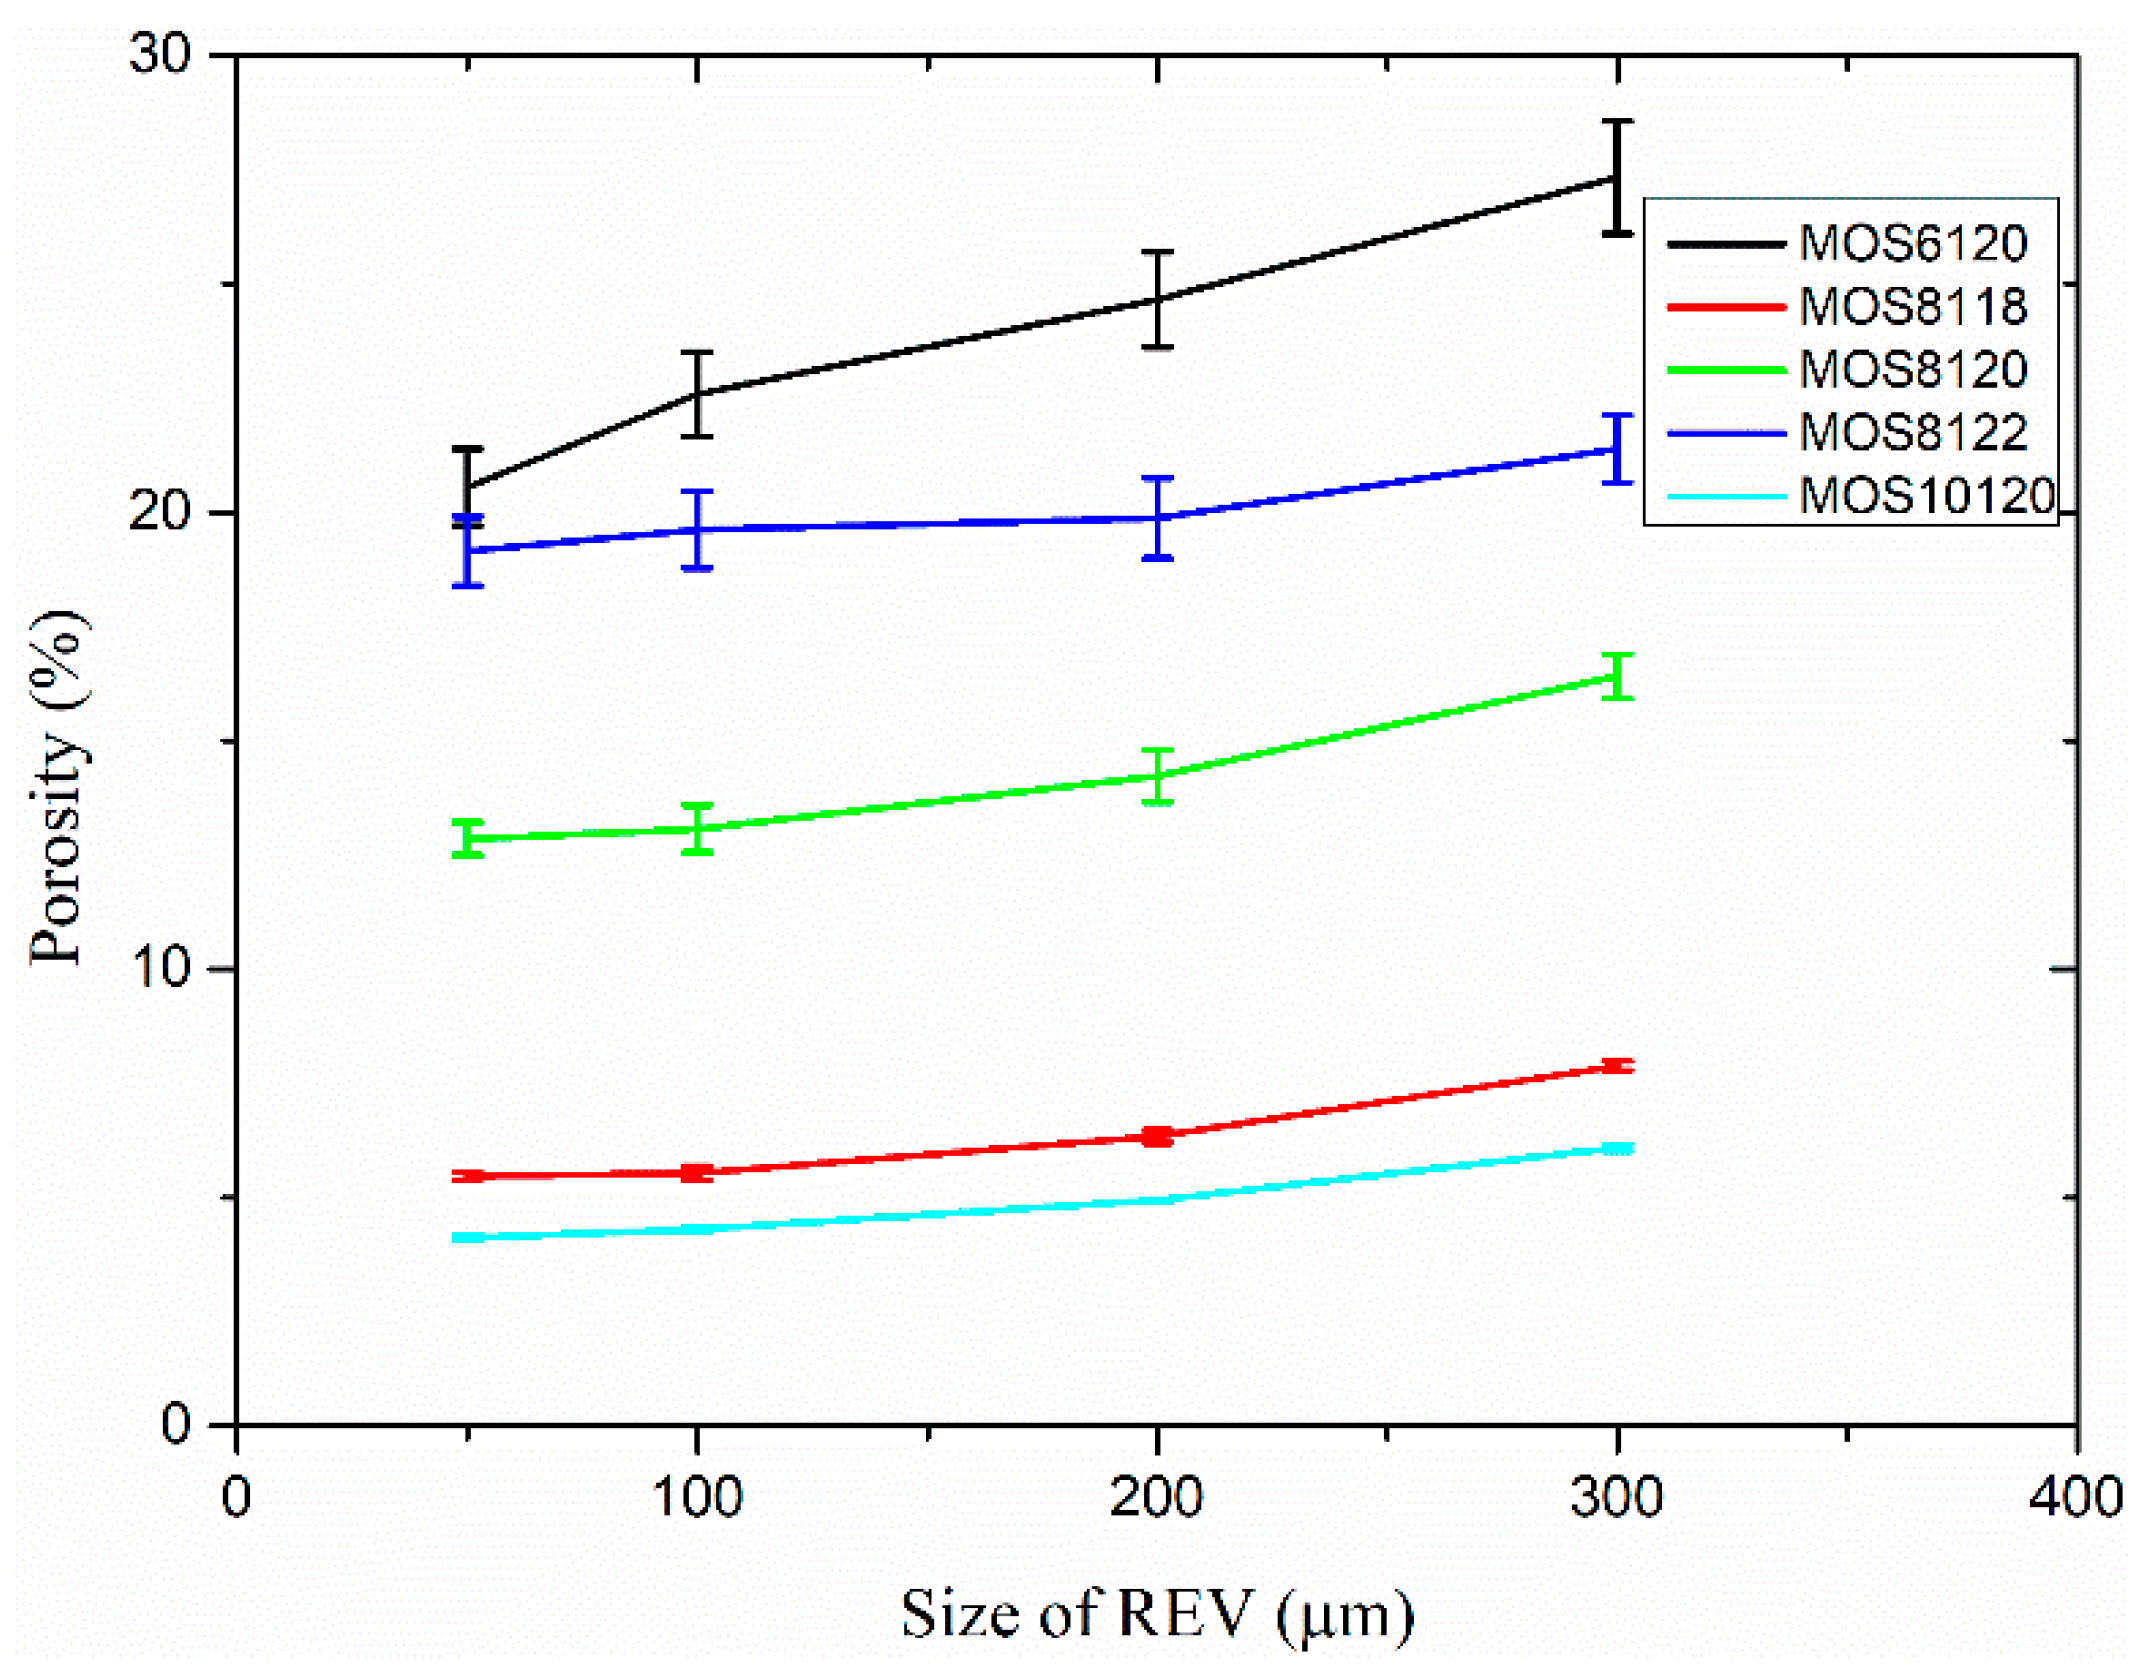
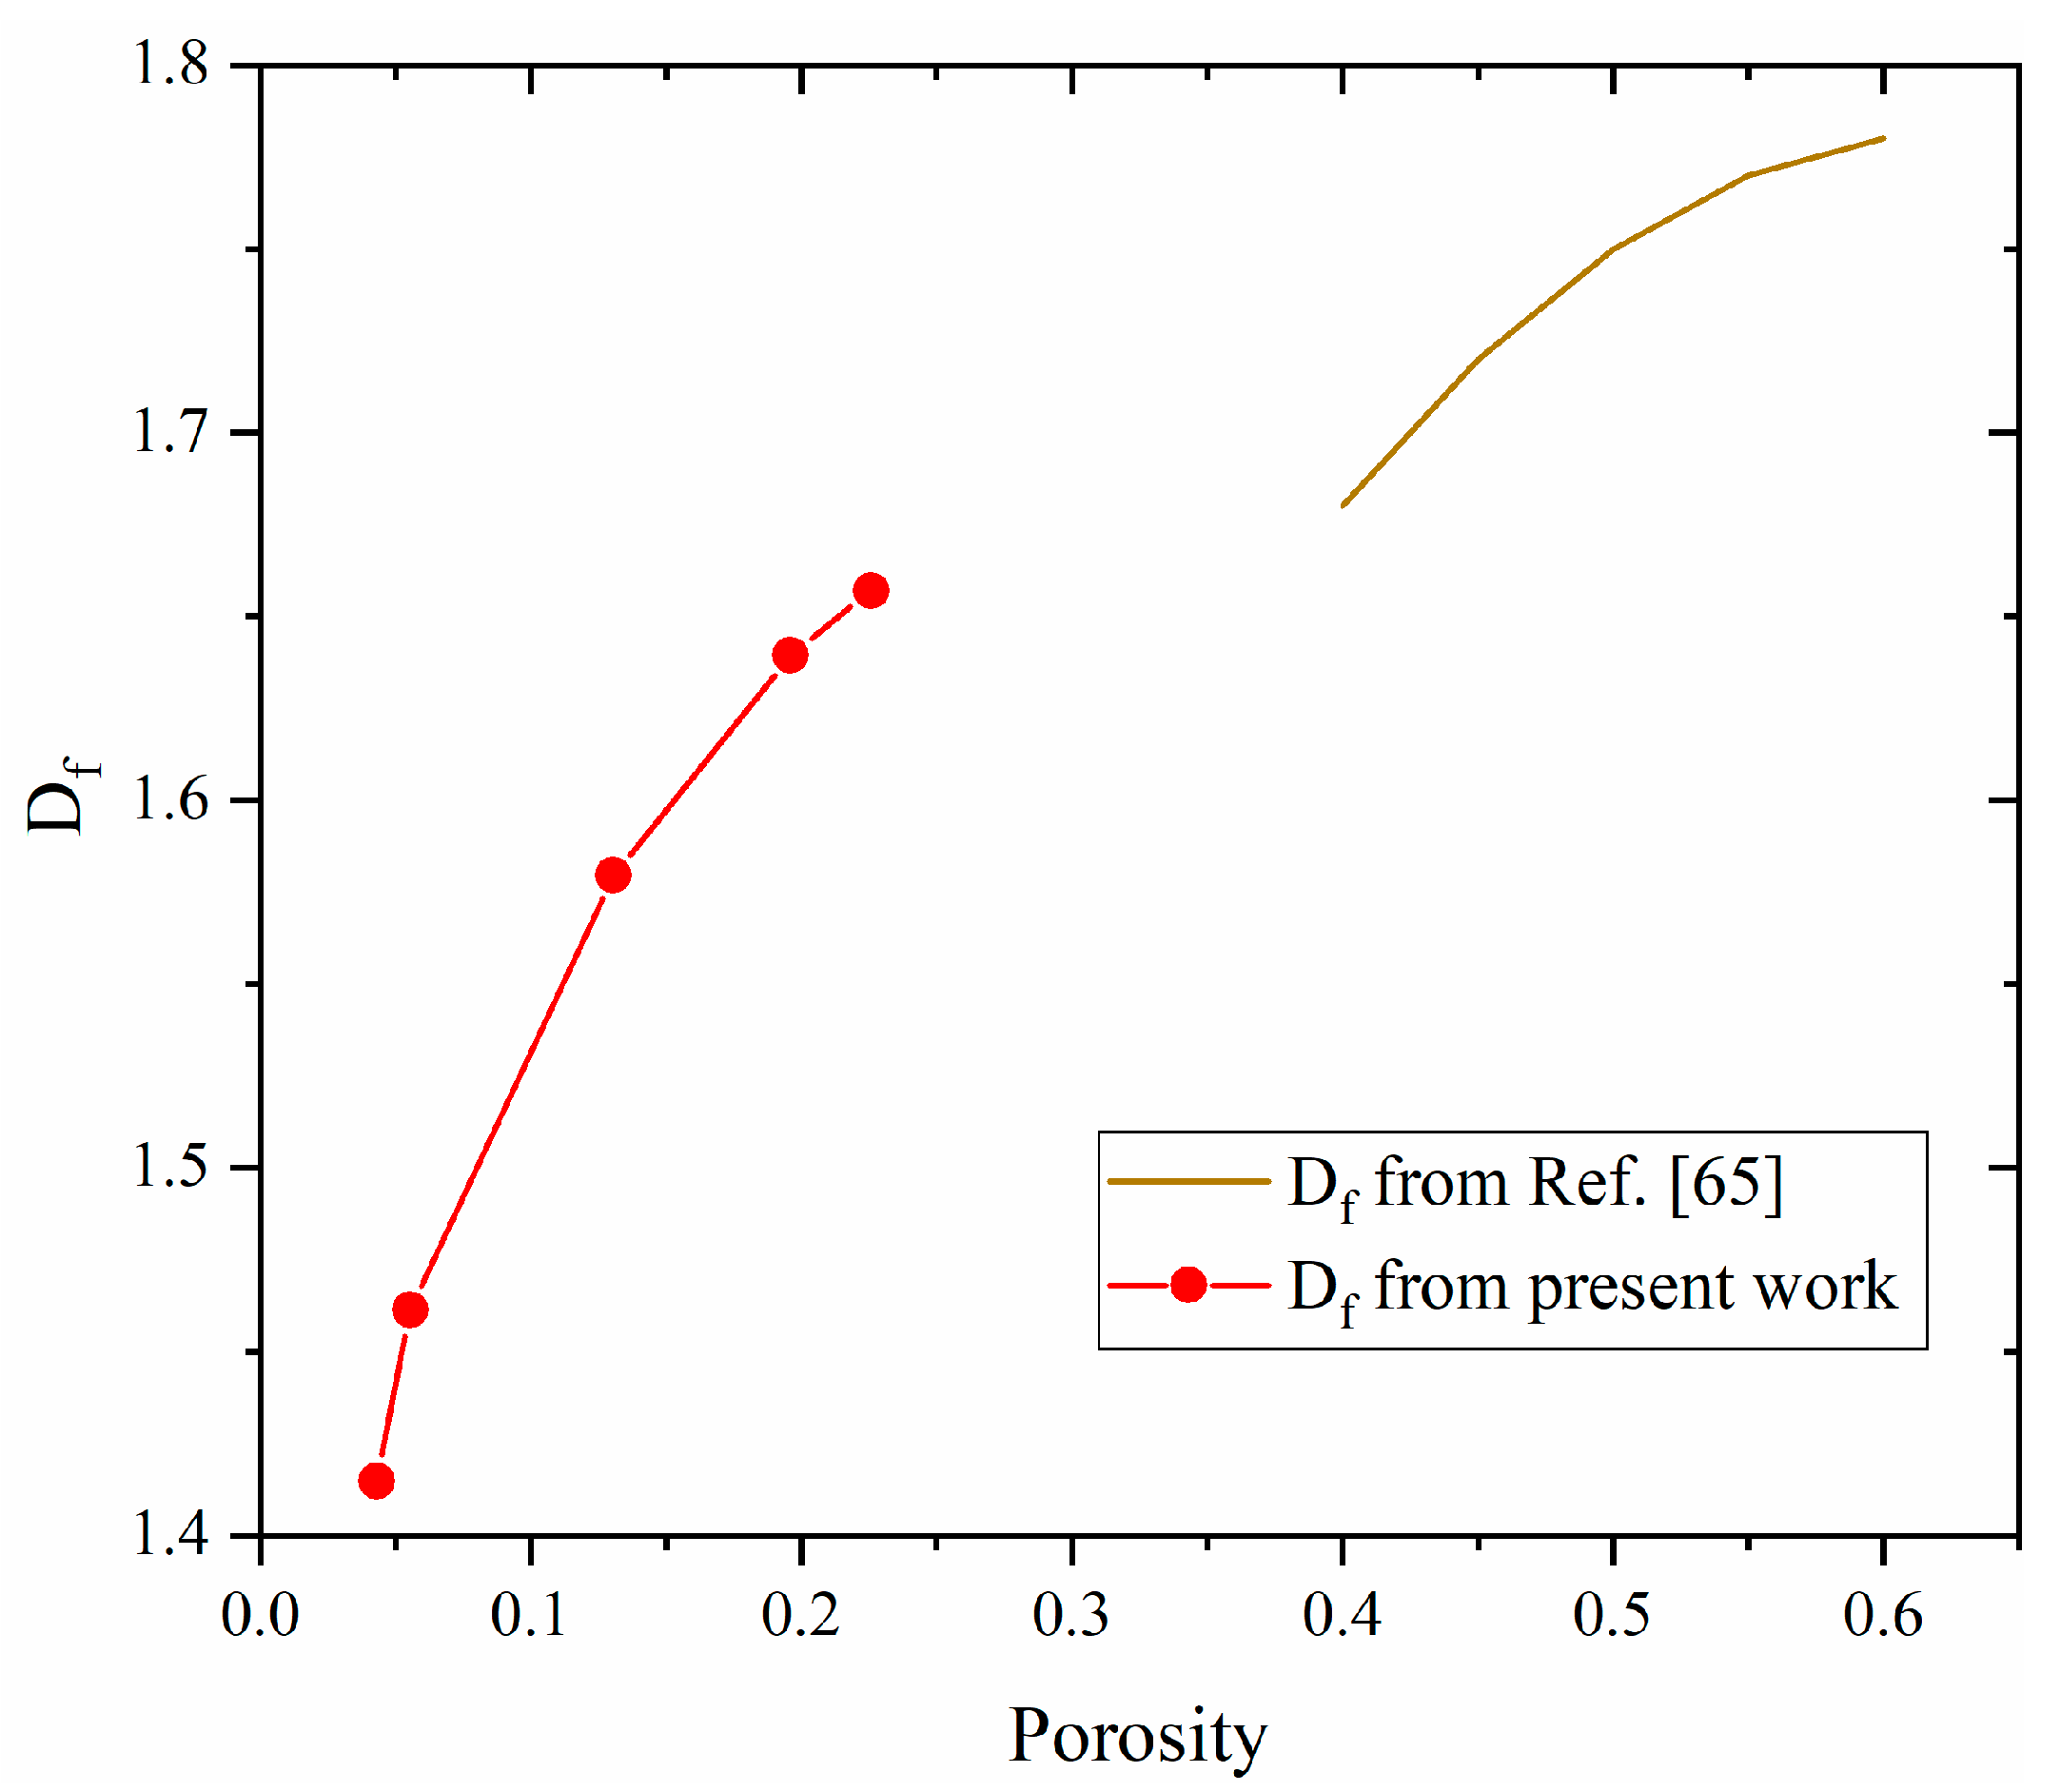
(3) The microstructure in initial and ultimate hydration stages of MOS pastes are visualized by means of MATLAB. Based on the hydration status, the evaluation of porosity and analysis of fractal feature of pore structure are conducted. The comparison of cumulative porosities in MOS pastes with different molar ratios shows that a large M is beneficial to reducing porosity and similar trend for the case of small H. Besides, fractal analysis reveals that Df of MOS paste is positively proportional to the porosity and large M, as well as small H is beneficial for the modification of microstructure of MOS paste by reducing the Df.
This work provides a novel modeling strategy for MOS cement system integrating different scales and methods. In the future, more attributes will be taken into consideration when simulating the hydration behavior of MOS cement, such as the influence of temperature, additives, etc. Besides, other important properties of MOS cement will be investigated including leaching, thermal conductivity, durability and other long-term performance of such material. In addition, the dynamic process of hydration of MOS cement system based on thermodynamics and kinetics will also be of great significance to understand the toughening mechanism for this eco-friendly construction materials.

Author Contributions

Conceptualization, J.H. and S.T.; methodology, J.H., S.T. and D.H.; software, B.W.; validation, D.H., L.W. and E.C.; formal analysis, J.H.; investigation, C.W.; resources, S.T.; writing—original draft preparation, J.H.; writing—review and editing, H.D., E.C. and S.T.; supervision, S.T.; project administration, W.L. and S.T.; funding acquisition, W.L., Y.S., Y.L. and S.T. All authors have read and agreed to the published version of the manuscript.

Funding

The authors are appreciated for the financial support provided by the National Natural Science Foundation of China [Grant Number U2040222]; Jiangsu Province Natural Science Foundation [Grant Number BK20181187]; The Opening Fund of State Key Laboratory of Green Building in Western China [Grant Number LSKF202013]; and Opening Funds of State Key Laboratory of Building Safety and Built Environment and National Engineering Research Center of Building Technology [BSBE2020-1].

Institutional Review Board Statement

This study did not involve humans.

Informed Consent Statement

This study did not involve humans.

Data Availability Statement

The data that support the findings of this study are available from the corresponding author upon reasonable request.

Acknowledgments

The authors would like to thank all the anonymous referees for their constructive comments and suggestions.

Conflicts of Interest

The authors declare no conflict of interest.

References

  1. Demediuk, T.; Cole, W. A study of mangesium oxysulphates. Aust. J. Chem. 1957, 10, 287–294. [Google Scholar] [CrossRef]
  2. Qin, L.; Gao, X.J.; Chen, T.F. Recycling of raw rice husk to manufacture magnesium oxysulfate cement based lightweight building materials. J. Clean. Prod. 2018, 191, 220–232. [Google Scholar] [CrossRef]
  3. Wu, C.; Chen, W.; Zhang, H.; Yu, H.; Zhang, W.; Jiang, N.; Liu, L. The hydration mechanism and performance of modified magnesium oxysulfate cement by tartaric acid. Constr. Build. Mater. 2017, 144, 516–524. [Google Scholar] [CrossRef]
  4. Gomes, C.E.M.; Camarini, G. Magnesium oxysulfate fibercement. Key Eng. Mater. 2014, 600, 308–318. [Google Scholar] [CrossRef]
  5. Dinnebier, R.E.; Pannach, M.; Freyer, D. 3Mg(OH)2·MgSO4·8H2O: A metastable phase in the system Mg(OH)2-MgSO4-H2O. Z. Für Anorg. Allg. Chem. 2013, 639, 1827–1833. [Google Scholar] [CrossRef]
  6. Runčevski, T.; Wu, C.Y.; Yu, H.F.; Bo, Y.; Jennings, H. Structural characterization of a new magnesium oxysulfate hydrate cement phase and its surface reactions with atmospheric carbon dioxide. J. Am. Ceram. Soc. 2013, 96, 3609–3616. [Google Scholar] [CrossRef]
  7. Keefer, K.D.; Hochella, M.; De Jong, B.H. The structure of the magnesium hydroxide sulfate hydrate MgSO4·1/3Mg (OH)2·1/3H2O. Acta Crystallogr. Sect. B Struct. Crystallogr. Cryst. Chem. 1981, 37, 1003–1006. [Google Scholar] [CrossRef]
  8. Hamada, E.; Ishizawa, N.; Marumo, F.; Ohsumi, K.; Shimizugawa, Y.; Reizen, K.; Matsunami, T. Structure of Mg6SO2 (OH)14 determined by micro single-crystal X-ray diffraction. Acta Crystallogr. Sect. B Struct. Sci. 1996, 52, 266–269. [Google Scholar] [CrossRef]
  9. Wu, C.Y.; Chen, C.; Zhang, H.F.; Tan, Y.S.; Yu, H.F. Preparation of magnesium oxysulfate cement using magnesium-rich byproducts from the production of lithium carbonate from salt lakes. Constr. Build. Mater. 2018, 172, 597–607. [Google Scholar] [CrossRef]
  10. Wu, C.; Yu, H.; Dong, J.; Zheng, L. Effects of material ration, fly ash, and citric acid on magnesium oxysulfate cement. ACI Mater. J. 2014, 111, 291. [Google Scholar] [CrossRef]
  11. Wu, C.; Yu, H.; Zhang, H.; Dong, J.; Wen, J.; Tan, Y. Effects of phosphoric acid and phosphates on magnesium oxysulfate cement. Mater. Struct. 2015, 48, 907–917. [Google Scholar] [CrossRef]
  12. Luo, S.; Ademiloye, A.; Wu, Z.; Zhang, Y. Molecular hierarchical release using hydrogenated graphene origami under electric field. Mater. Sci. Semicond. Process 2021, 131, 105844. [Google Scholar] [CrossRef]
  13. Lothenbach, B.; Winnefeld, F. Thermodynamic modelling of the hydration of Portland cement. Cem. Concr. Res. 2006, 36, 209–226. [Google Scholar] [CrossRef]
  14. Lothenbach, B.; Wieland, E. A thermodynamic approach to the hydration of sulphate-resisting Portland cement. Waste Manage. 2006, 26, 706–719. [Google Scholar] [CrossRef]
  15. Schmidt, T.; Lothenbach, B.; Romer, M.; Scrivener, K.; Rentsch, D.; Figi, R. A thermodynamic and experimental study of the conditions of thaumasite formation. Cem. Concr. Res. 2008, 38, 337–349. [Google Scholar] [CrossRef]
  16. Lothenbach, B.; Saout, G.L.; Gallucci, E.; Scrivener, K. Influence of limestone on the hydration of Portland cements. Cem. Concr. Res. 2008, 38, 339–356. [Google Scholar] [CrossRef]
  17. Möschner, G.; Lothenbach, B.; Figi, R.; Kretzschmar, R. Influence of citric acid on the hydration of Portland cement. Cem. Concr. Res. 2009, 39, 275–282. [Google Scholar] [CrossRef]
  18. Zhou, Z.; Chen, H.S.; Li, Z.J.; Li, H.J. Simulation of the properties of MgO-MgCl2-H2O system by thermodynamic method. Cem. Concr. Res. 2015, 68, 105–111. [Google Scholar] [CrossRef]
  19. Li, D.; Gao, D.; Dong, Y.; Li, W. Modeling of phase relations and thermodynamics in the Mg(OH)2+ MgSO4+ H2O system with implications on magnesium hydroxide sulfate cement. Calphad 2019, 67, 101675. [Google Scholar] [CrossRef]
  20. Zhao, Y.; Deng, S.; Liu, H.; Zhang, J.; Guo, Z.; Hou, H. First-principle investigation of pressure and temperature influence on structural, mechanical and thermodynamic properties of Ti3AC2 (A = Al and Si). Comput. Mater. Sci. 2018, 154, 365–370. [Google Scholar] [CrossRef]
  21. Pan, Y.; Guan, W. Exploring the novel structure, elastic and thermodynamic properties of W3Si silicides from first-principles calculations. Ceram. Int. 2019, 45, 15649–15653. [Google Scholar] [CrossRef]
  22. Blaha, P.; Schwarz, K.; Luitz, J. WIEN97: Full Potential Linearized Augmented Plane Wave Package for Calculating Crystal Properties; Institute of Physical and Theoretical Chemistry, Vienna University of Technology: Vienna, Austria, 1999. [Google Scholar]
  23. Frisch, M.; Trucks, G.; Schlegel, H.; Scuseria, G.; Robb, M.; Cheeseman, J.; Zakrzewski, V.; Montgomery, J., Jr.; Stratmann, R.E.; Burant, J. Gaussian 98, Revision, A. 7; Gaussian. Inc.: Pittsburgh, PA, USA, 1998. [Google Scholar]
  24. Module, F. Material Studio 6.0; Accelrys Inc.: San Diego, CA, USA, 2011. [Google Scholar]
  25. Wu, T.; Li, C.; Wang, Y.; Li, Y.; Tang, S.; Borg, R.P. Improved non-contact variable-frequency AC impedance instrument for cement hydration and pore structure based on SVM calibration method. Measurement 2021, 179, 109402. [Google Scholar] [CrossRef]
  26. Wang, L.; Guo, F.; Lin, Y.; Yang, H.; Tang, S. Comparison between the effects of phosphorous slag and fly ash on the CSH structure, long-term hydration heat and volume deformation of cement-based materials. Constr. Build. Mater. 2020, 250, 118807. [Google Scholar] [CrossRef]
  27. Tang, S.W.; Yao, Y.; Andrade, C.; Li, Z.J. Recent durability studies on concrete structure. Cem. Concr. Res. 2015, 78, 143–154. [Google Scholar] [CrossRef]
  28. Wang, L.; He, T.; Zhou, Y.; Tang, S.; Tan, J.; Liu, Z.; Su, J. The influence of fiber type and length on the cracking resistance, durability and pore structure of face slab concrete. Constr. Build. Mater. 2021, 282, 122706. [Google Scholar] [CrossRef]
  29. Wang, L.; Jin, M.; Zhou, S.; Tang, S.; Lu, X. Investigation of microstructure of C-S-H and micro-mechanics of cement pastes under NH4NO3 dissolution by 29Si MAS NMR and microhardness. Measurement 2021, 185, 185. [Google Scholar] [CrossRef]
  30. Chaube, R.; Kishi, T.; Maekawa, K. Modelling of Concrete Performance: Hydration, Microstructure and Mass Transport; CRC Press: Boca Raton, FL, USA, 2014. [Google Scholar]
  31. Van Breugel, K. Numerical simulation of hydration and microstructural development in hardening cement-based materials (I) theory. Cem. Concr. Res. 1995, 25, 319–331. [Google Scholar] [CrossRef]
  32. Bishnoi, S.; Scrivener, K.L. µic: A new platform for modelling the hydration of cements. Cem. Concr. Res. 2009, 39, 266–274. [Google Scholar] [CrossRef]
  33. Ma, H.Y.; Tang, S.W.; Li, Z.J. New pore structure assessment methods for cement paste. J. Mater. Civ. Eng. 2013, 27, A4014002. [Google Scholar] [CrossRef]
  34. Urwongse, L.; Sorrell, C.A. Phase relations in magnesium oxysulfate cements. J. Am. Ceram. Soc. 1980, 63, 523–526. [Google Scholar] [CrossRef]
  35. Xiong, Y.L.; Deng, H.R.; Nemer, M.; Johnsen, S. Experimental determination of the solubility constant for magnesium chloride hydroxide hydrate (Mg3Cl(OH)5·4H2O, phase 5) at room temperature, and its importance to nuclear waste isolation in geological repositories in salt formations. Geochim. Cosmochim. Acta 2010, 74, 4605–4611. [Google Scholar] [CrossRef]
  36. Harvie, C.E.; Møller, N.; Weare, J.H. The prediction of mineral solubilities in natural waters: The Na-K-Mg-Ca-H-Cl-SO4-OH-HCO3-CO3-CO2-H2O system to high ionic strengths at 25 °C. Geochim. Cosmochim. Acta 1984, 48, 723–751. [Google Scholar] [CrossRef]
  37. Blanc, P.; Lassin, A.; Piantone, P.; Azaroual, M.; Jacquemet, N.; Fabbri, A.; Gaucher, E.C. Thermoddem: A geochemical database focused on low temperature water/rock interactions and waste materials. Appl. Geochem. 2012, 27, 2107–2116. [Google Scholar] [CrossRef]
  38. Archer, D.G.; Rard, J.A. Isopiestic investigation of the osmotic and activity coefficients of aqueous MgSO4 and the solubility of MgSO4·7H2O(cr) at 298.15 K: Thermodynamic properties of the MgSO4+H2O system to 440 K. J. Chem. Eng. Data 1998, 43, 791–806. [Google Scholar] [CrossRef]
  39. Altmaier, M.; Metz, V.; Neck, V.; Müller, R.; Fanghänel, T. Solid-liquid equilibria of Mg(OH)2(cr) and Mg2(OH)3Cl·4H2O(cr) in the system Mg-Na-H-OH-Cl-H2O at 25 °C. Geochim. Cosmochim. Acta 2003, 67, 3595–3601. [Google Scholar] [CrossRef]
  40. Xiong, Y.L. Thermodynamic properties of brucite determined by solubility studies and their significance to nuclear waste isolation. Aquat. Geochem. 2008, 14, 223–238. [Google Scholar] [CrossRef]
  41. Vanderbilt, D. Soft self-consistent pseudopotentials in a generalized eigenvalue formalism. Phys. Rev. B 1990, 41, 7892–7895. [Google Scholar] [CrossRef] [PubMed]
  42. Ceperley, D.M.; Alder, B.J. Ground state of the electron gas by a stochastic method. Phys. Rev. Lett. 1980, 45, 566–569. [Google Scholar] [CrossRef] [Green Version]
  43. Perdew, J.P.; Zunger, A. Self-interaction correction to density-functional approximations for many-electron systems. Phys. Rev. B 1981, 23, 5048–5079. [Google Scholar] [CrossRef] [Green Version]
  44. Yu, P.; Duan, Y.H.; Chen, E.; Tang, S.W.; Wang, X.R. Microstructure-based fractal models for heat and mass transport properties of cement paste. Int. J. Heat Mass Transf. 2018, 126, 432–447. [Google Scholar] [CrossRef]
  45. Zhou, W.; Duan, L.; Tang, S.W.; Chen, E.; Hanif, A. Modeling the evolved microstructure of cement pastes governed by diffusion through barrier shells of C-S-H. J. Mater. Sci. 2019, 54, 4680–4700. [Google Scholar] [CrossRef]
  46. Ma, H.Y.; Xu, B.W.; Lu, Y.Y.; Li, Z.J. Modeling magnesia-phosphate cement paste at the micro-scale. Mater. Lett. 2014, 125, 15–18. [Google Scholar] [CrossRef]
  47. Yu, P.; Duan, Y.H.; Chen, E.; Tang, S.W.; Hanif, A.; Fan, Y.L. Microstructure-based homogenization method for early-age creep of cement paste. Constr. Build. Mater. 2018, 188, 1193–1206. [Google Scholar] [CrossRef]
  48. Ukrainczyk, N.; Koenders, E.A.B. Representative elementary volumes for 3D modeling of mass transport in cementitious materials. Model. Simul. Mater. Sci. Eng. 2014, 22, 035001. [Google Scholar] [CrossRef]
  49. Zhang, M.Z.; Ye, G.; Breugel, K.V. Multiscale lattice Boltzmann-finite element modelling of chloride diffusivity in cementitious materials. Part I: Algorithms and implementation. Mech. Res. Commun. 2014, 58, 53–63. [Google Scholar] [CrossRef]
  50. Ma, H.Y.; Hou, D.S.; Li, Z.J. Two-scale modeling of transport properties of cement paste: Formation factor, electrical conductivity and chloride diffusivity. Comput. Mater. Sci. 2015, 110, 270–280. [Google Scholar] [CrossRef]
  51. Góchez, R.; Wambaugh, J.; Rochner, B.; Kitchens, C.L. Kinetic study of the magnesium oxychloride cement cure reaction. J. Mater. Sci. 2017, 52, 7637–7646. [Google Scholar] [CrossRef]
  52. Tang, S.; Wang, Y.; Geng, Z.; Xu, X.; Yu, W.; Chen, J. Structure, fractality, mechanics and durability of calcium silicate hydrates. Fractal Fract. 2021, 5, 47. [Google Scholar] [CrossRef]
  53. Wang, L.; Jin, M.; Wu, Y.; Zhou, Y.; Tang, S. Hydration, shrinkage, pore structure and fractal dimension of silica fume modified low heat Portland cement-based materials. Constr. Build. Mater. 2021, 272, 121952. [Google Scholar] [CrossRef]
  54. Wang, L.; Guo, F.; Yang, H.; Wang, Y.; Tang, S. Comparison of fly ash, PVA fiber, MgO and shrinkage-reducing admixture on the frost resistance of face slab concrete via pore structural and fractal analysis. Fractals 2021, 29, 2140002–2140330. [Google Scholar] [CrossRef]
  55. Wang, L.; Luo, R.; Zhang, W.; Jin, M.; Tang, S. Effects of fineness and content of phosphorus slag on cement hydration, permeability, pore structure and fractal dimension of concrete. Fractals 2021, 29, 1–18. [Google Scholar]
  56. Li, Z.; Ji, Z. Effect of molar ratios on compressive strength of modified magnesium oxysulfate cement. Int. J. Hybri. Inform. Technol. 2015, 8, 87–93. [Google Scholar] [CrossRef]
  57. Zhang, N.; Yu, H.; Wang, N.; Gong, W.; Tan, Y.; Wu, C. Effects of low-and high-calcium fly ash on magnesium oxysulfate cement. Constr. Build. Mater. 2019, 215, 162–170. [Google Scholar] [CrossRef]
  58. Wang, L.; Jin, M.; Guo, F.; Wang, Y.; Tang, S. Pore structural and fractal analysis of the influence of fly ash and silica fume on the mechanical property and abrasion resistance of concrete. Fractals 2020, 29, 214003. [Google Scholar] [CrossRef]
  59. Tang, S.; Yuan, J.; Cai, R.; Wei, C.; Chen, J.; Chen, E. In situ monitoring of hydration of magnesium oxysulfate cement paste: Effect of MgO/MgSO4 ratio. Constr. Build. Mater. 2020, 251, 119003. [Google Scholar] [CrossRef]
  60. Tang, S.; Wei, C.; Cai, R.; Huang, J.; Chen, E.; Yuan, J. In situ monitoring of pore structure of magnesium oxysulfate cement paste: Effect of MgSO4/H2O ratio. J. Ind. Eng. Chem. 2020, 83, 387–400. [Google Scholar] [CrossRef]
  61. Tang, S.W.; He, Z.; Cai, X.H.; Cai, R.J.; Zhou, W.; Li, Z.J.; Shao, H.Y.; Wu, T.; Chen, E. Volume and surface fractal dimensions of pore structure by NAD and LT-DSC in calcium sulfoaluminate cement pastes. Constr. Build. Mater. 2017, 143, 395–418. [Google Scholar] [CrossRef]
  62. Ba, M.; Xue, T.; He, Z.; Wang, H.; Liu, J. Carbonation of magnesium oxysulfate cement and its influence on mechanical performance. Constr. Build. Mater. 2019, 223, 1030–1037. [Google Scholar] [CrossRef]
  63. Wang, N.; Yu, H.; Bi, W.; Tan, Y.; Zhang, N.; Wu, C.; Ma, H.; Hua, S. Effects of sodium citrate and citric acid on the properties of magnesium oxysulfate cement. Constr. Build. Mater. 2018, 169, 697–704. [Google Scholar] [CrossRef]
  64. Tang, S.; Huang, J.; Duan, L.; Yu, P.; Chen, E. A review on fractal footprint of cement-based materials. Powder Technol. 2020, 370, 237–250. [Google Scholar] [CrossRef]
  65. Yu, B.; Cheng, P. A fractal permeability model for bi-dispersed porous media. Int. J. Heat Mass Transf. 2002, 45, 2983–2993. [Google Scholar] [CrossRef]
Figure 1. Crystal structure of Phase 318. Hydrogen atoms are omitted for clarity.
Fractalfract 05 00164 g001
Figure 2. Crystal structure of Phase 517. Hydrogen atoms are omitted for clarity.
Fractalfract 05 00164 g002
Figure 3. A paradigmatic logarithmic plot of cumulative pore account versus box size.
Fractalfract 05 00164 g003
Figure 4. Equilibrium phase diagram in the MOS cement system when H = 18.
Fractalfract 05 00164 g004
Figure 5. Equilibrium phase diagram in the MOS cement system when M = 8.
Fractalfract 05 00164 g005
Figure 6. Hydration status of MOS6120 paste: (a) initial stage and (b) ultimate stage.
Fractalfract 05 00164 g006
Figure 7. Hydration status of MOS8118 paste: (a) initial stage and (b) ultimate stage.
Fractalfract 05 00164 g007
Figure 8. Hydration status of MOS8120 paste: (a) initial stage and (b) ultimate stage.
Fractalfract 05 00164 g008
Figure 9. Hydration status of MOS8122 paste: (a) initial stage and (b) ultimate stage.
Fractalfract 05 00164 g009
Figure 10. Hydration status of MOS10120 paste: (a) initial stage and (b) ultimate stage.
Fractalfract 05 00164 g010
Figure 11. Comparison of cumulative porosities in MOS pastes with different M and H.
Fractalfract 05 00164 g011
Figure 12. Porosities of MOS cement systems with different REV sizes.
Fractalfract 05 00164 g012
Figure 13. Evolution of Df with porosity from this work and literature.
Fractalfract 05 00164 g013
Table 1. Phases observed in MOS pastes.
Phase NotationChemical FormulaReferences
3183Mg(OH)2·MgSO4·8H2ODinnebier et al. [5]
513 (or 512)5Mg(OH)2·MgSO4·3H2O (5Mg(OH)2·MgSO4·2H2O)Demediuk and Cole [1]
115Mg(OH)2·MgSO4·5H2ODemediuk and Cole [1]
123Mg(OH)2·2MgSO4·3H2ODemediuk and Cole [1]
122Mg(OH)2·2MgSO4·2H2ODemediuk and Cole [1]
2512Mg(OH)2·5MgSO4·H2ODemediuk and Cole [1]
5175Mg(OH)2·MgSO4·7H2ORunčevski et al. [6]
131Mg(OH)2·3MgSO4·H2OKeefer et al. [7]
5145Mg(OH)2·MgSO4·4H2OHamada et al. [8]
Table 2. A Comparison of different software based on the first principle calculation.
SoftwareAdvantage(s)Disadvantage(s)References
WIENBase on Linux operating system; a concise user interface; Compiled using FORTRAN languageNot available in WINDOWS[22]
Gaussian 98Different calculation methods; Suitable for organic macromolecular materialNot suitable for heavy metals[23]
Material StudioEstablish model easilyTime-consuming[24]
Table 3. A comparison among these microstructure-based models.
HYMOSTRUC [31]μic [32]DuCOM [30]Proposed Model [33]
Modeling strategyDiscrete elementVector basedDiscrete elementDiscrete element
Particle size distributionPoly-sizePoly-sizeMono-sizePoly-size
Particle kineticsNoYesNoYes
Prediction ageEarly termEarly termLong termLong term
Table 4. Comparison of two pseudo-potentials by calculating equilibrium constant of MH.
Experimental ValueSimulation ValueAccuracy (%)
Ultrasoft pseudo-potentials17.1117.3898.4
Norm pseudo-potentials17.1117.5497.5
Table 5. Physical parameters of starting materials and hydrated phases.
MaterialMolar Mass (g/mol)Density (g/cm3)Molar Density (cm3/mol)
MgO403.5911.14
Phase 5175361.88285.11
Phase 3184381.875233.60
MH582.3624.58
Table 6. The Gibbs free energy of different phases and atoms calculated based on the first principle.
Phases/Atoms G (eV)
Phase 318−14,846.324
Phase 517−19,252.431
Mg−973.951
O2−856.874
H2−27.348
S−277.965
Table 7. Δ f G of Phase 318 and Phase 517.
Phases Gibbs   Free   Energy   of   Formation ,   Δ f G   ( eV / atom )
Phase 318−58.33
Phase 517−73.18
Table 8. The Gibbs free energy of formation ( Δ f G ) of different ions in the paste.
Types of Ions Δ f G   ( kJ / mol )
Mg2+−454.8
H+0
H2O−237.1
SO42-−744.5
Table 9. Main chemical reactions and corresponding thermodynamic equilibrium constants involved in MOS paste.
EquationsLog KReferences
H 2 O = H + + O H −13.99[36]
M g O + 2 H + = M g 2 + + H 2 O 21.58[37]
M g S O 4 7 H 2 O = M g 2 + + S O 4 2 + 7 H 2 O −1.88[38]
3 M g ( O H ) 2 M g S O 4 8 H 2 O + 6 H + = 4 M g 2 + + S O 4 2 + 14 H 2 O 44.70This work
5 M g ( O H ) 2 M g S O 4 7 H 2 O + 10 H + = 6 M g 2 + + S O 4 2 + 17 H 2 O 77.65This work
Table 10. Comparison of phase composition among simulated and literature results.
Molar RatioPhase 517 (%)MH (%)Other Phases (%)References
M = 10, H = 1851.1848.82-This work
M = 8, H = 2065.8234.18-This work
M = 8, H = 1148.6912.6738.64[57]
M = 8, H = 1144.93-56.07This work
M = 8, H = 2060.2424.1315.63[3]
M = 751.0531.4617.49[9]
Table 11. Comparison of porosities among simulated and experimental results.
Molar RatioPorosity (%)References
SimulationMOS612022.58
MOS81185.54
MOS812013.07This work
MOS812219.61
MOS101204.30
ExperimentsMOS812025.07[3]
MOS1411212.74[62]
MOS811118.53[57]
MOS712017.97[9]
MOS1011716.78[63]
MOS81186.69[60]
MOS812010.46[60]
MOS812213.71[60]
Table 12. Comparison of porosities with different REV sizes.
Size of REV (μm3)Porosity (%)
MOS6120MOS8118MOS8120MOS8122MOS10120
50 × 50 × 5020.54 ± 0.855.47 ± 0.0912.85 ± 0.3619.14 ± 0.764.12 ± 0.05
100 × 100 × 10022.58 ± 0.935.54 ± 0.1513.07 ± 0.5219.61 ± 0.844.30 ± 0.04
200 × 200 × 20024.65 ± 1.046.34 ± 0.1414.22 ± 0.5719.87 ± 0.884.95 ± 0.02
300 × 300 × 30027.32 ± 1.247.88 ± 0.1116.41± 0.4821.38 ± 0.746.09 ± 0.07
Table 13. Df and porosity of different MOS pastes at initial and ultimate stage of hydration.
DesignationInitial StageUltimate Stage
Porosity (%)DfPorosity (%)Df
MOS612091.541.96422.581.657
MOS811889.251.9505.541.461
MOS812088.641.95513.071.579
MOS812287.561.95419.611.640
MOS1012085.271.9464.301.415
Publisher’s Note: MDPI stays neutral with regard to jurisdictional claims in published maps and institutional affiliations.

