1. Introduction
Bioimpedance, or the electrical impedance of biological tissues, describes the passive electrical properties of these materials. The aim of collecting these measurements is to provide details regarding the electrochemical structures and processes within a tissue or material under study [
1]. These measurements are being used in a wide range of applications including: As a method to monitor hydration during hemodialysis [
2], to detect changes resulting from muscle injury [
3], assessing lympoedema [
4], and to assess neuromuscular disorders [
5]. There is also a small set of studies that have investigated the bioimpedance of skeletal muscle for changes that result from fatigue [
6,
7,
8].
Regardless of the application, after collecting an impedance dataset (which may contain hundreds of data points at different frequencies) the data needs to be analyzed using either discrete frequencies or electrical equivalent circuit representations. Using equivalent electrical circuits can reduce a dataset from the potentially hundreds of datapoints to a smaller set (dependent on the number of circuit components in the model). This reduction is aimed at decreasing the complexity of tracking changes in the measured tissues. While there are many equivalent circuits that have been used to represent bioimpedance datasets [
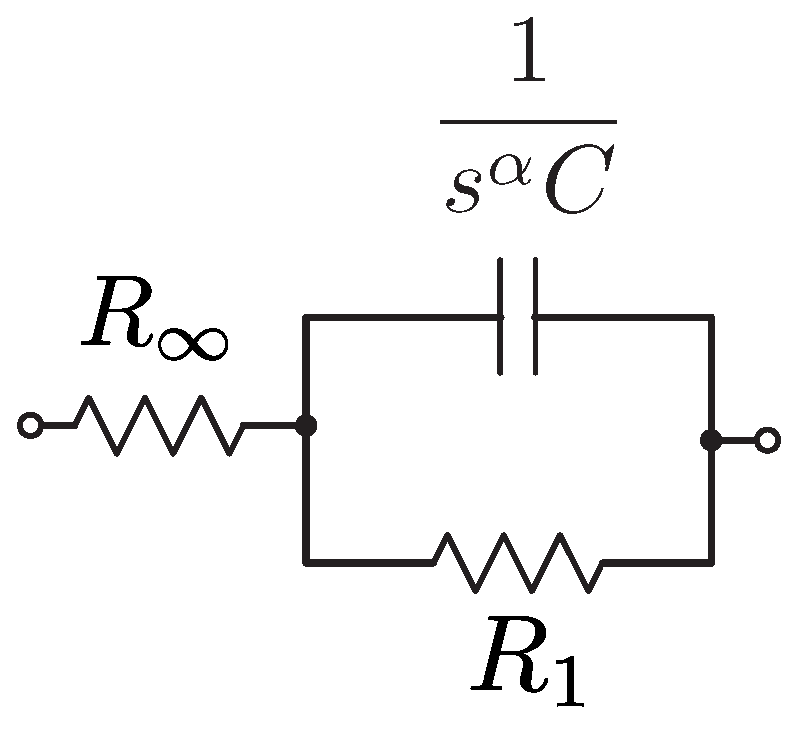
9], one of the most widely used is referred to as the Cole-impedance model [
10], given in
Figure 1. This model is composed of three hypothetical circuit elements. A high-frequency resistor
, a resistor
, and a Constant Phase Element (CPE). The impedance of a CPE is
where
. The value
C is often referred to as a pseudo-capacitance with units Farad sec
. The impedance of the Cole-model is given by:
Recent studies have utilized the Cole-impedance model in biologic applications including: Characterizing the electrical impedance of blood for potential monitoring of thrombus formation [
11], predicting myofiber size in mice [
12], modeling the electrical impedance of botanical elements [
13]. While this is not an exhaustive list, it does highlight the varied applications of the Cole-impedance model in biology. It is important to note that using a CPE (with the
term) implies a fractional derivative of order
, with the current-voltage relationship for this component defined as:
where
and
are the time-dependent current and voltage, respectively. This therefore places the Cole-impedance model within the domain of fractional-order systems. This field incorporates concepts from fractional calculus [
14,
15], the branch of mathematics concerning non-integer differentiation and integration, and is being widely explored to model biological phenomena [
9,
16,
17,
18]. One definition of a fractional derivative of order
is given by the Grünwald-Letnikov definition [
19] as
where
is the gamma function and
. Applying the Laplace transform to the fractional derivative of (
3) with zero initial conditions yields
though other definitions, such as the Riemann-Liouville and Caputo definitions, are also available. While the fractional derivative given by (
3) is not often referenced in studies of bioimpedance using the Cole-impedance model, it is still important to understand the underlying fractional-theory behind it.
When calculating (
2) using sinusoidal voltages, for it to yield sinusoids requires the fractional derivative to be defined on the whole real line, as is typical of many bioimpedance applications. Therefore, the Grünwald-Letnikov, Riemann-Liouville, and Caputo on
definitions of fractional derivatives must be used [
20]. This is important for impedance applications that are collected in experimental setups that apply a sinusoidal excitation signal and measure the corresponding sinusoidal output. For these cases, the correct definition must be used or else the fractional-order impedance model and experimental results will contradict each other. Fractional derivatives, upon which the Cole-impedance model is built, capture phenomena across multiple time scales overcoming the need to define tissue properties at the cellular level. Instead, these models assume that the behaviour is captured in the fractal structure of the tissue [
16,
17]. Recent research has shown the relationship between fractals and fractional calculus, based on physical and geometric considerations [
21]. It was noted in [
17] that muscle fibers, tendon, and nerve fibers exhibit patterns that support the dynamics of these multiscale structures expressed by fractional-order models. While these fractional-models fail to describe the underlying physiological mechanisms at the unit or cellular level that contribute to the impedance behavior of a tissue, recent works using fractional-order models to represent three-dimensional resistor-capacitor (
) networks [
22] support their application to model biological tissues; which are complex 3D structures of cells with both resistive and capacitive behaviour. Often, the bioimpedance of a tissue is described as being related to the extracellular fluid and intracellular fluid, with measurements at low frequency dependent on the extracellular fluids (attributed to low excitation frequencies failing to penetrate the cellular membranes of cells in the tissue) and high frequency measurements dependent on both intracellular and extracellular fluids (at frequencies where the excitation is able to penetrate the cellular membranes). Based on this interpretation, the model parameters
and
of the Cole-impedance model are associated with the tissue fluids and
C,
are associated with the cellular membranes of the tissues.
While it has been previously shown that the bioimpedance at discrete frequencies (10 kHz, 50 kHz, and 100 kHz) of the biceps tissue does change due to exercise-induced fatigue [
8] and that the biceps tissue bioimpedance can be well represented by the Cole-impedance model [
23]; the changes in the Cole-impedance parameters that result from fatigue have not been deeply investigated. This study evaluates the parameters of the Cole-model equivalent electrical circuit that can represent bioimpedance datasets collected from the biceps tissues of participants immediately prior to and immediately post completion of a fatiguing exercise protocol; expanding on those analyses presented in [
8,
23]. In this work, the Cole-impedance parameters (
,
,
C,
) that represent the tissue bioimpedance of the left and right arms of 18 participants, separated into two different exercise intensity groups, are determined using numerical least squares optimization routines. These results of these optimization analyses are presented with statistical tests comparing the pre and post-fatigue measures executed to evaluate those changes that were statistically significant with discussions of these results and their implications.
3. Results
The complete set of Cole-impedance parameters extracted from the pre- and post-fatigue measurements of participants in the
and
exercise-intensity groups are given in
Table 1 and
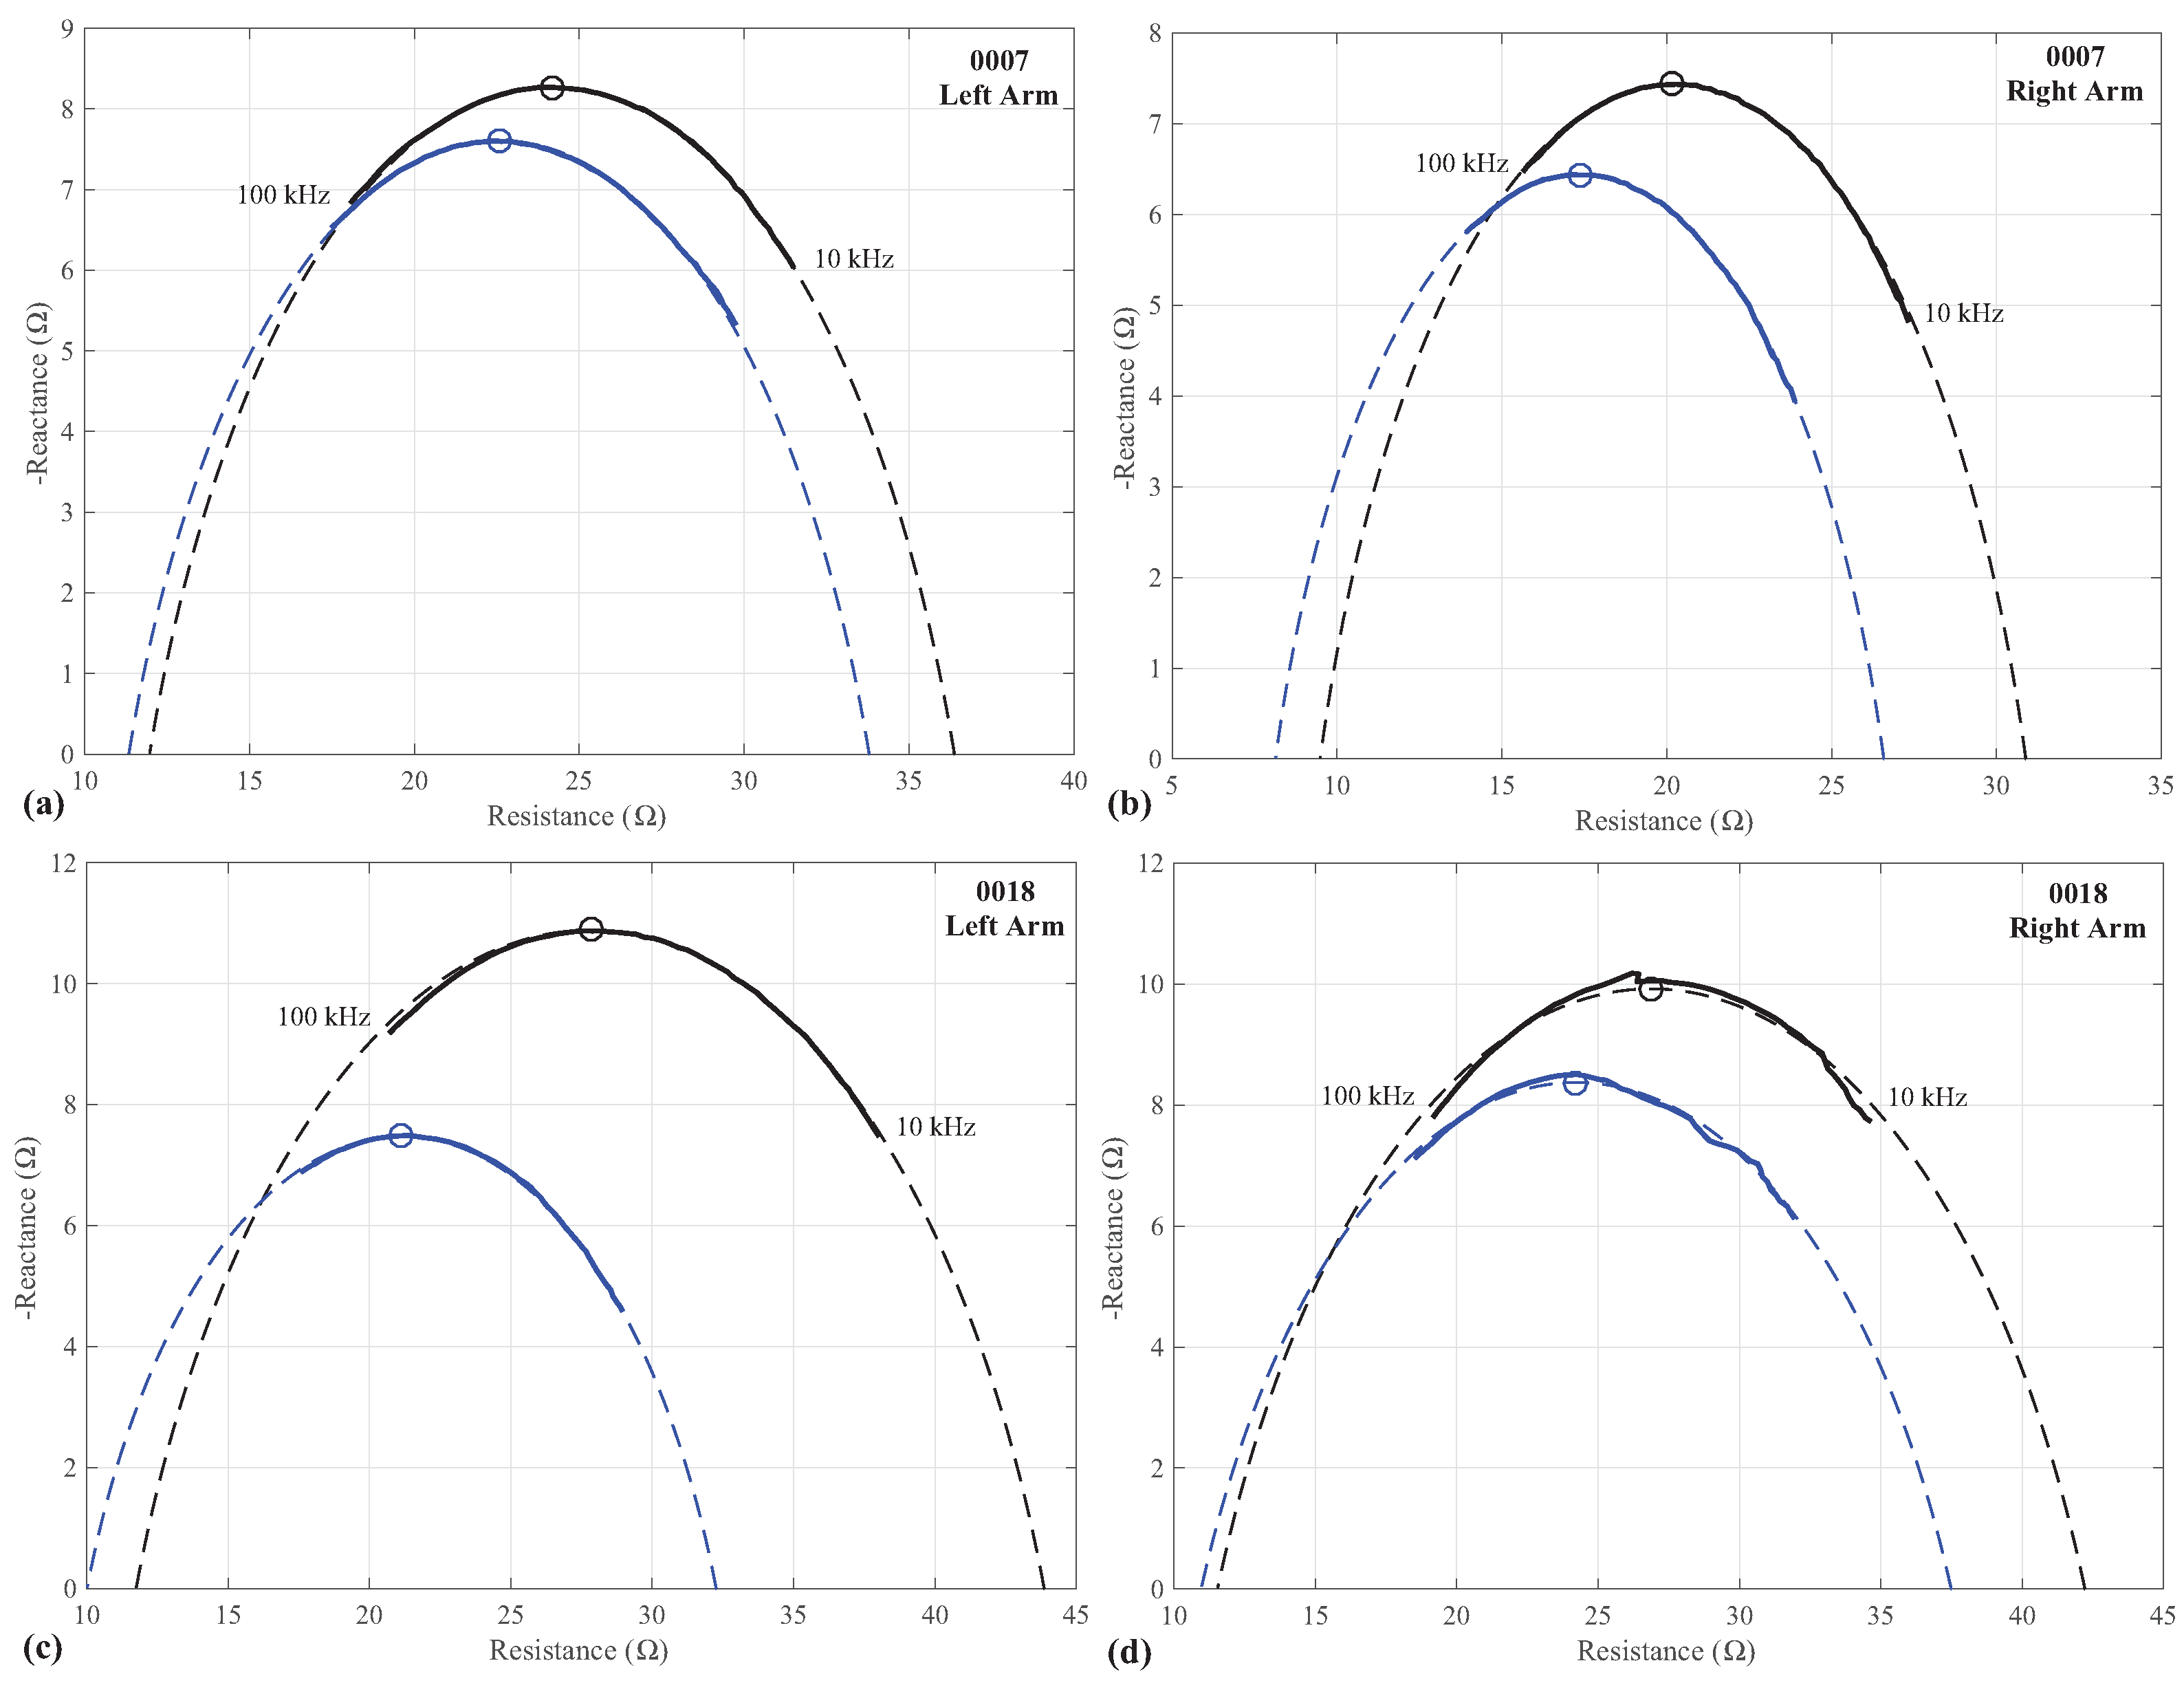
Table 2, respectively. To visualize the agreement between simulations using the extracted parameters and the measured impedance, two representative cases are provided in
Figure 3 for participants 0007 and 0018. These particular datasets were selected because they represent the best and worst fittings, as evaluated by the average absolute error of the simulations compared to the experimental data. The simulations using the Cole-impedance parameters are presented in
Figure 3 as dashed lines, with the experimental data presented as solid lines. The Cole-impedance model was simulated from 1 mHz to 100 MHz to highlight the impedance-arc which is not fully captured in the experimental data frequency range of 10 kHz to 100 kHz. This visualizes how using the Cole-impedance model parameters supports extrapolating the theoretical low and high frequency impedance values.
Additionally, the frequency at which the reactance reaches its peak value (
) was determined using the extracted Cole-impedance model parameters for the left and right arms of each participant. These values are also given in
Table 1 and
Table 2. Samples of these calculated peak reactances using the values in
Table 1 and
Table 2 are given in
Figure 3 as (o) symbols.
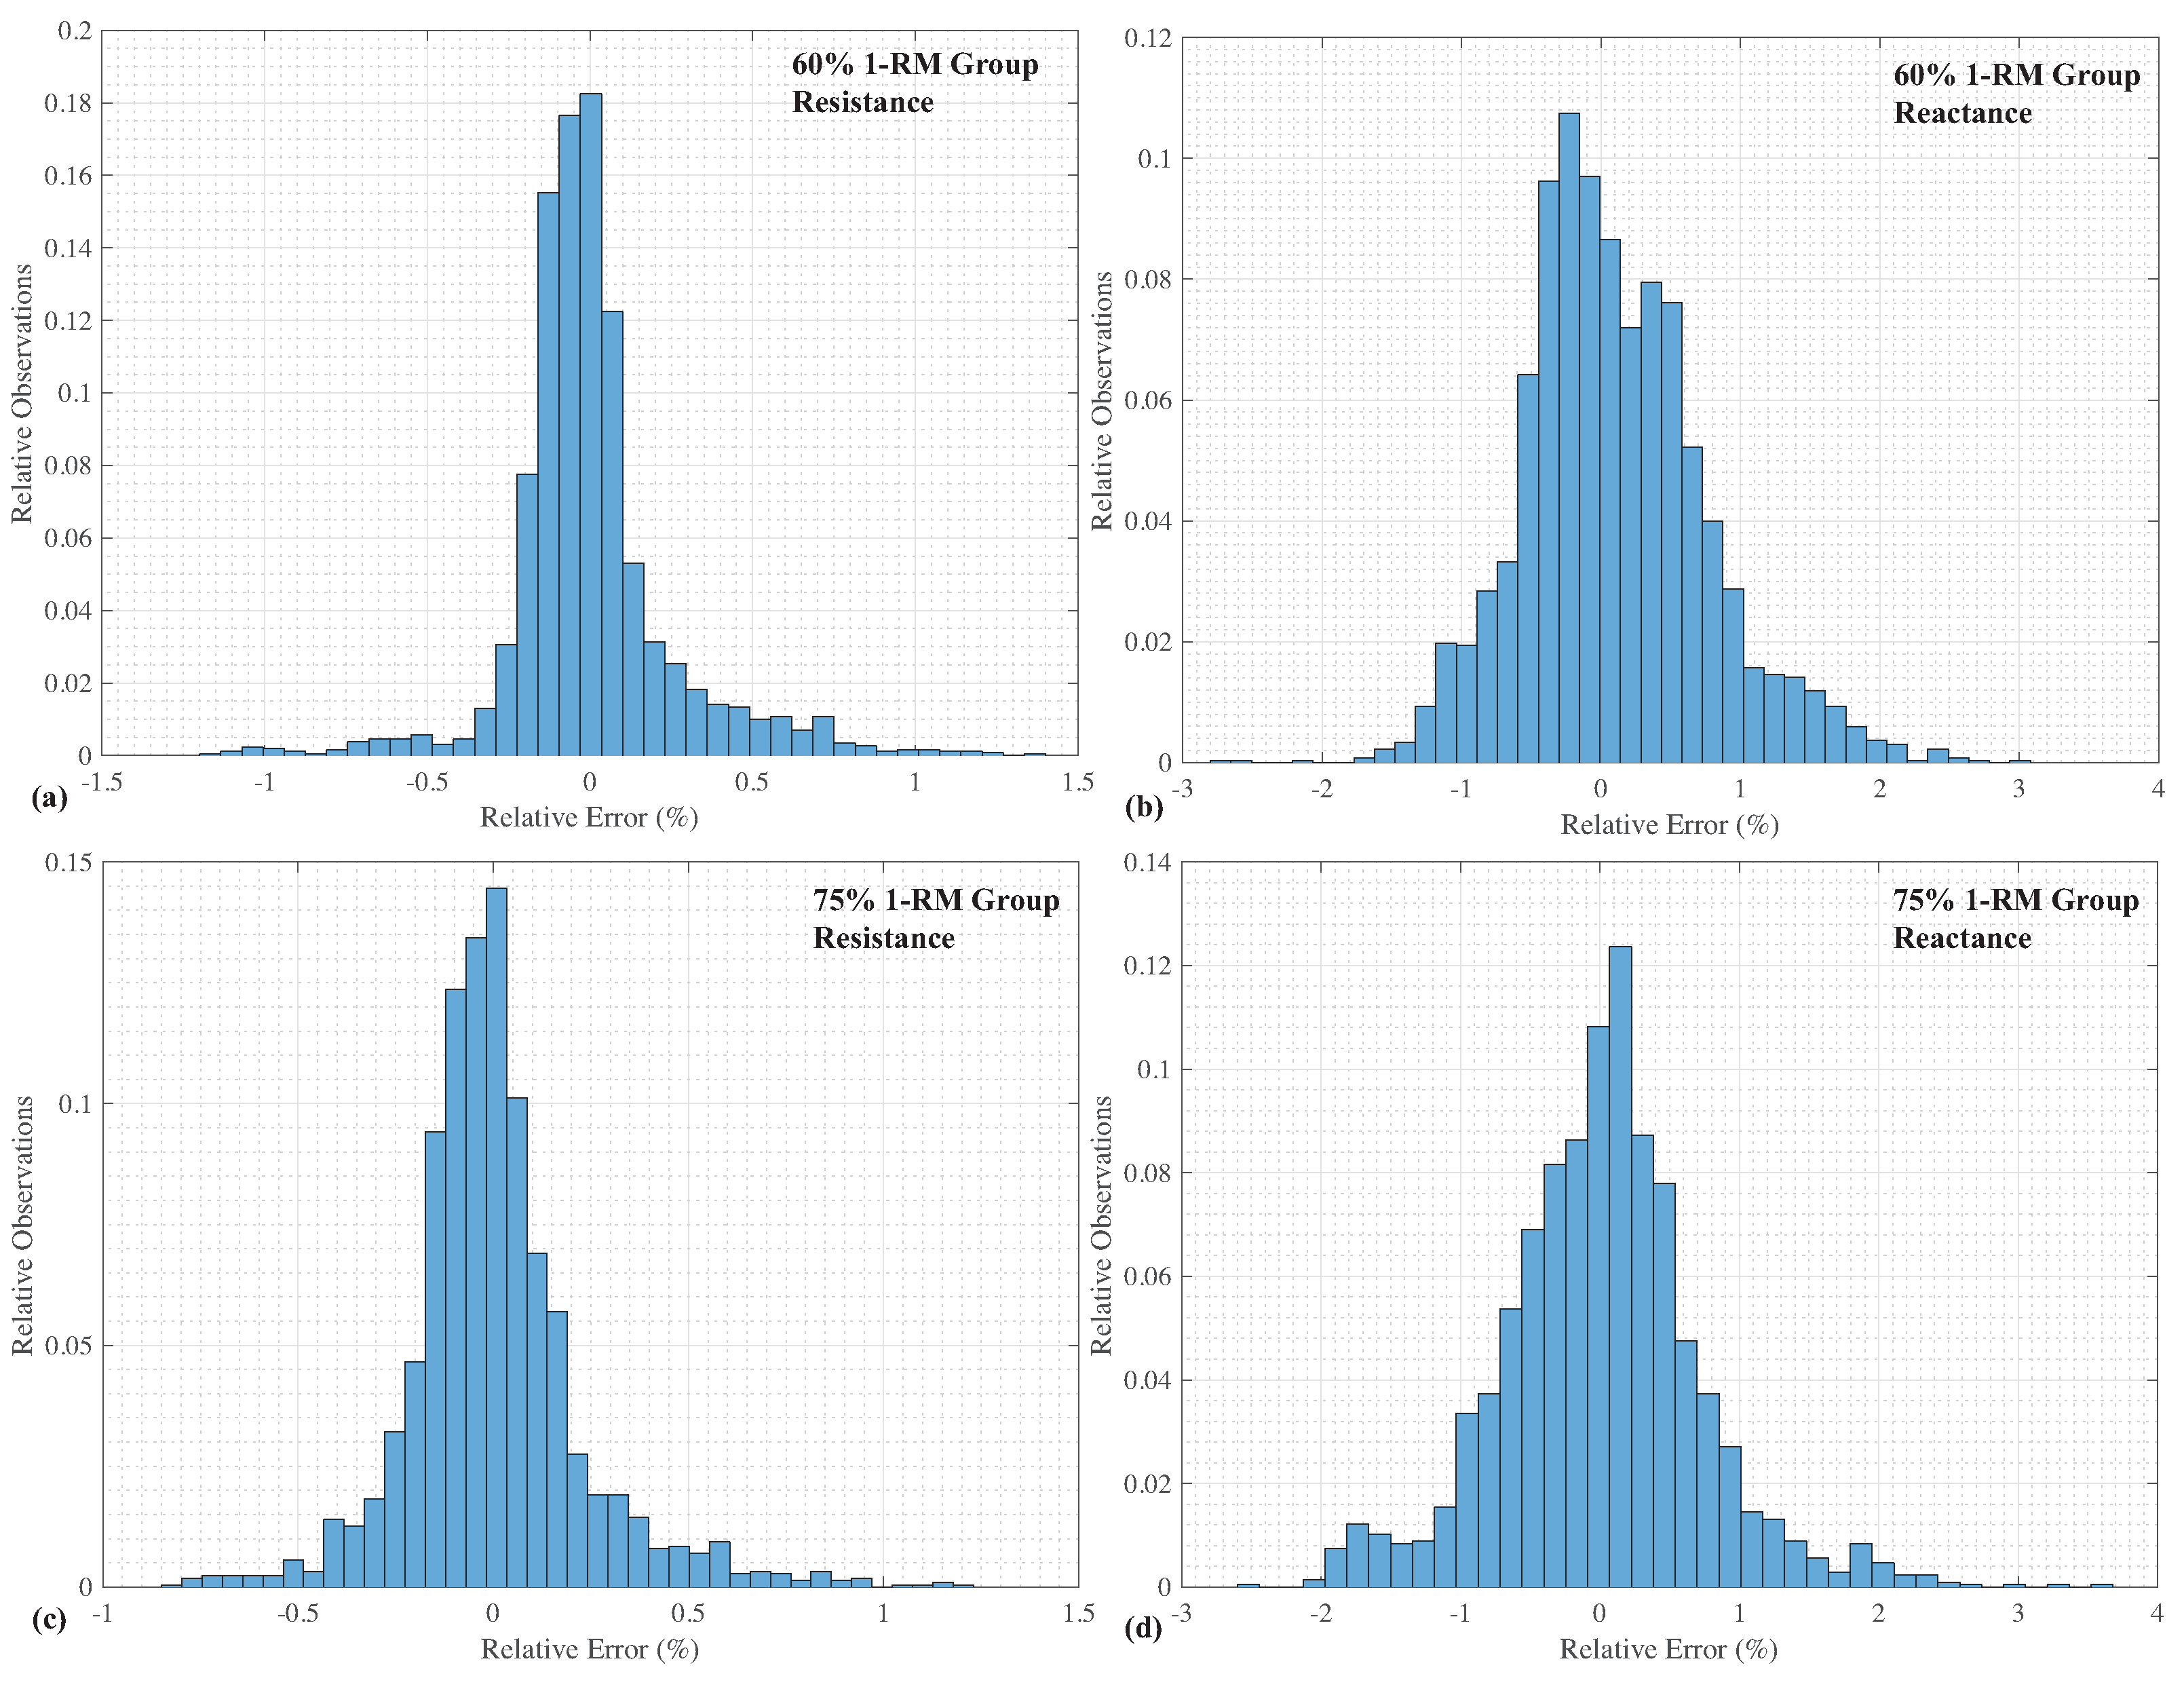
To fully detail the agreement between the experimental data and simulations using the extracted circuit parameters, relative error distributions of the resistance and reactance of both groups of participants are given in
Figure 4. From these distributions, the relative errors of the resistances (given in
Figure 4a,c) are predominately grouped between
, while the reactances (given in
Figure 4b,d) show a wider grouping between
. This supports that the fitting process achieves better agreement with the resistance data than the reactance data, but both still show very good agreement with the experimental data.
Statistical Tests
Paired-samples t-tests (SPSS, IBM Inc.) were used to determine whether there was a statistically significant () difference between the mean values of the Cole-impedance model parameters extracted from the pre-fatigue and post-fatigue datasets for both the and groups of participants. These tests were applied to those datasets that did not violate the assumption of normality as assessed by the Shapiro-Wilk’s test. Based on these tests, there were statistically significant differences between the pre/post fatigue (), (), and () means for both the and groups. There were no statistically significant differences between the pre/post fatigue means of C () and () for the group.
It should be noted that the
C and
datasets for the
1-RM group violated the assumption of normality as assessed by the Shapiro-Wilk’s test with
and
, respectively. Due to these violations of normality, the statistical comparisons of the pre- and post-fatigue values were tested using a Wilcoxon signed-rank test. Using this test it was determined that there were no statistically significant differences in the median values of both
C (
) and
(
) in this group, similar to the testing of the
group. All post-fatigue means that show a statistically significant difference are denoted using the (
) symbol in
Table 1 and
Table 2.
4. Discussion
In this work, a total of 72 impedance datasets (18 participants with two biceps each and two measurements per biceps) were fit to the Cole-model given by (
Figure 1), expanding on the preliminary fitting of five datasets in [
23]. The low errors of both resistance and reactance between the Cole-impedance model using the extracted parameters and the experimental measurements, observed in the relative error distribution of
Figure 4, continues to support that this model is a very good choice for representing biological tissue impedance in this frequency range (1 kHz to 100 kHz). This highlights that this fractional-order model can accurately represent the frequency-dependent impedance behaviour of these tissues. The range of extracted values of
,
support that these tissues are well represented by a fractional-order, as these values are far from the integer order case of
that would occur otherwise.
From the experimental measurements, there are changes in resistance and reactance comparing the pre and post fatigue measurements of the participants biceps tissues. Samples of these changes were given in
Figure 3 for participants 0007 and 0018. These changes result in differences of the Cole-impedance parameters that represent these impedance datasets in the pre and post fatigue states. Based on the statistical testing of the extracted model parameters, only
,
, and
show a statistically significant (
) difference between the pre-fatigue and post-fatigue states for both groups of participants. The resistance parameters of the
group had mean decreases of
and
for
and
, respectively, with the
group having mean decreases of
and
. The decrease in resistance parameters is consistent with the previous studies investigating skeletal muscle fatigue using bioimpedance measurements [
6,
7]. These studies hypothesized that the decreases in resistance may be the result of mechanisms that include: (i) increased blood flow to the muscle due to the hemodynamic response to exercise [
7], (ii) heat dissipation in the tissue increasing cutaneous blood flow and vasodilation [
7], and (iii) an increase in metabolites in the tissue increasing its electrical conductivity [
6]. An increase in muscle edema paired with a decrease in muscle quality has been hypothesized as the reason for decreased muscular strength following exercise [
28]. Localized edema is expected to increase the available charge carriers in the region resulting in the decreased tissue resistance observed after the participants completed the exercise protocol. However, a limitation of this study is that the circumference of each participants biceps pre and post fatigue were not measured to quantify the association between the resistance parameters in the Cole-impedance model and swelling.
It is interesting to note that the
C and
parameters did not have a statistically significant change between the immediately pre and immediately post exercise data in either of the groups measured in this study. While the discrete 10 kHz, 50 kHz, and 100 kHz reactance measurements did show a statistically significant difference between pre and post-fatigue measurements in the study participants [
8], this may be an effect of the interactions between the resistive and capacitive components contributing to the overall real and imaginary components of the impedance. To highlight the complex interactions between components, the real and imaginary components of the Cole-impedance given by (
1) have been separated to yield the expression:
Note that the imaginary term in (
7) has contributions from
,
C, and
, so that changes in the measured reactance are not a result of only changes in
C and
. Therefore, changes in
will result reactance changes without changes in
C or
, which could explain the significant changes in reactance reported in [
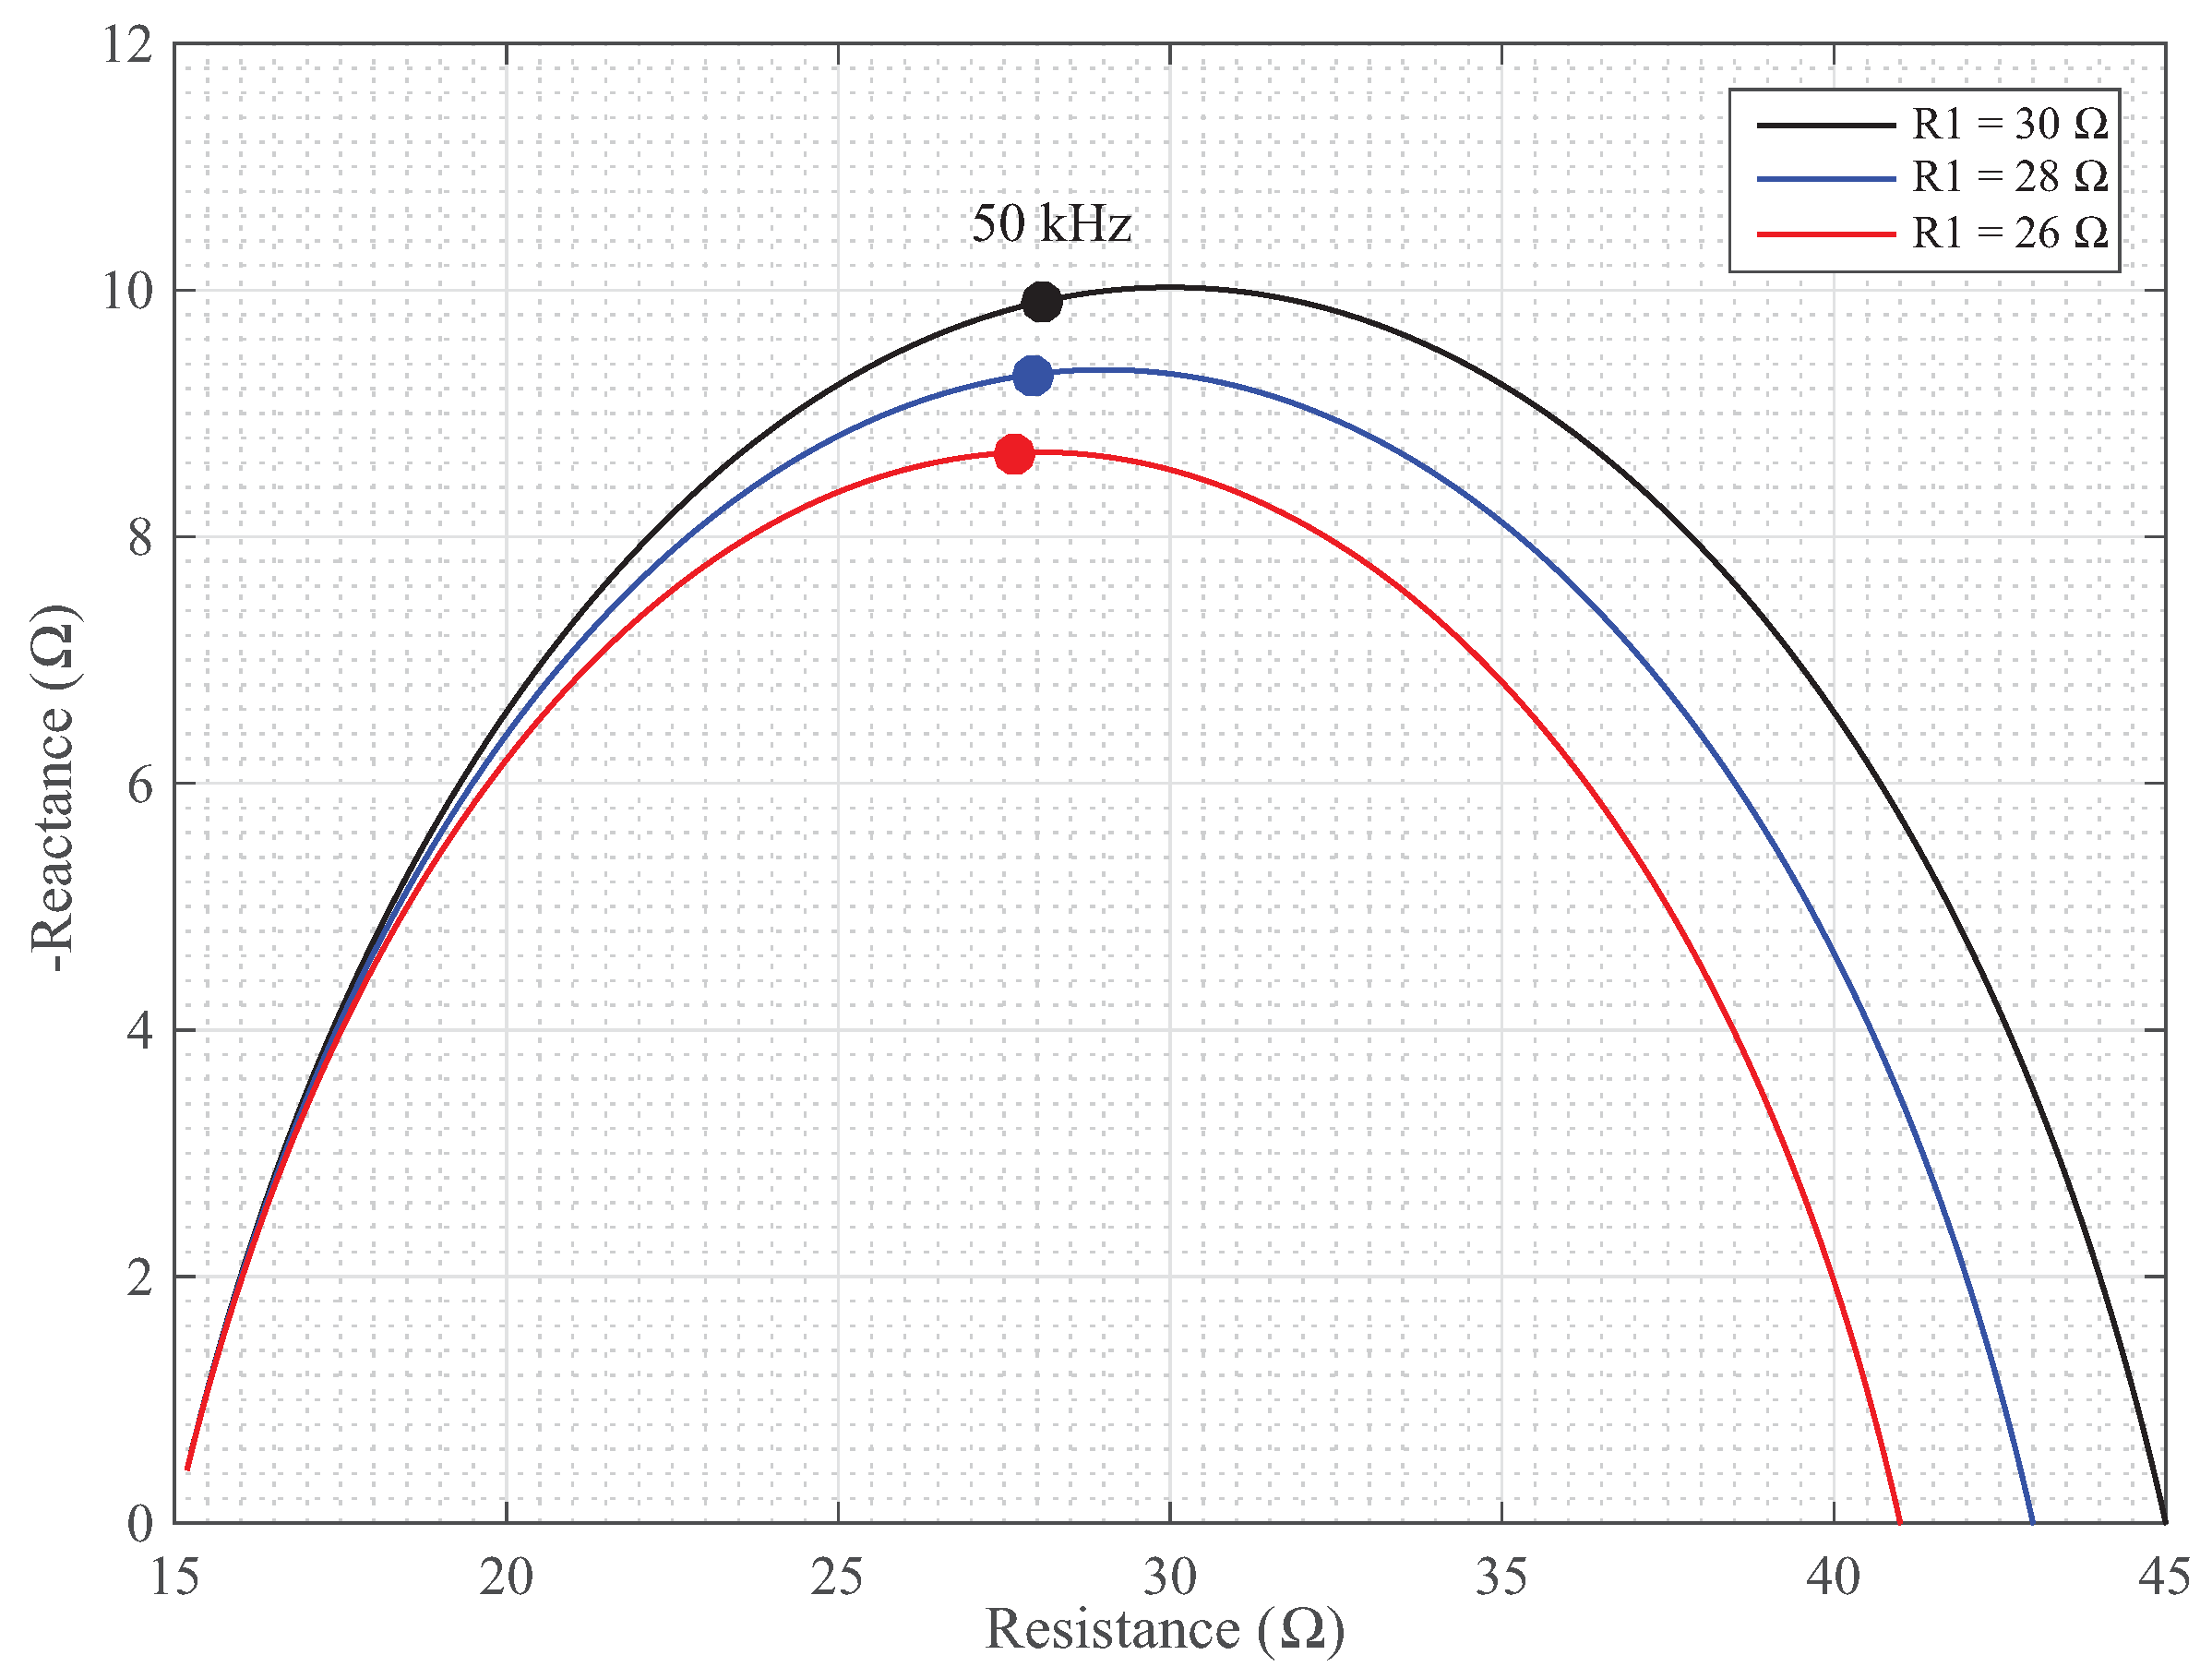
8] without the significant changes in this analysis. To highlight this, a simulation of (
7) with
,
F sec
,
and
, 28
, and 26
are given in
Figure 5. Each of these simulations have different reactances even though only the
value is varied. Further, the impedances at 50 kHz are given on each simulation case as a solid (·), which show a decrease with the decreasing
values.
This also raises questions about which component of measured bioimpedance is the most appropriate marker to monitor changes that are a result of muscle damage, discrete reactances or capacitive components of electrical circuit representations. Previous work by Sanchez et al. investigating the bioimpedance changes in mice after injury supports that the capacitive component of the Cole-model is sensitive to changes from injury [
29], which could indicate that the exercise protocol in this study, while fatiguing the participants, did not induce detectable levels of skeletal muscle damage. However, since this work did not collect markers to assess the localized tissue damage in participants it cannot be determined and will require follow-up investigations that collect further markers of tissue damage in addition to the participant bioimpedance measures. While the
C and
changes in this study were not significant, the trend of decreasing resistance components and increases in the peak reactance frequency are consistent with changes that were observed in [
29].
It is important to note that electrode positioning has a significant impact on the measured electrical impedance of localized tissues [
30] yet there is no widely adopted process to standardize electrode placement for localized bio-impedance measurements; though recent guidelines have been proposed [
31]. A limitation of this work is that the use of only a single-electrode configuration on the study participants fails to provide the data necessary to evaluate the optimum configuration to detect changes in the localized tissues due to exercise and fatigue.
Referring to the distortions that are observed in the impedance measures of the right arm of participant 0018, given in
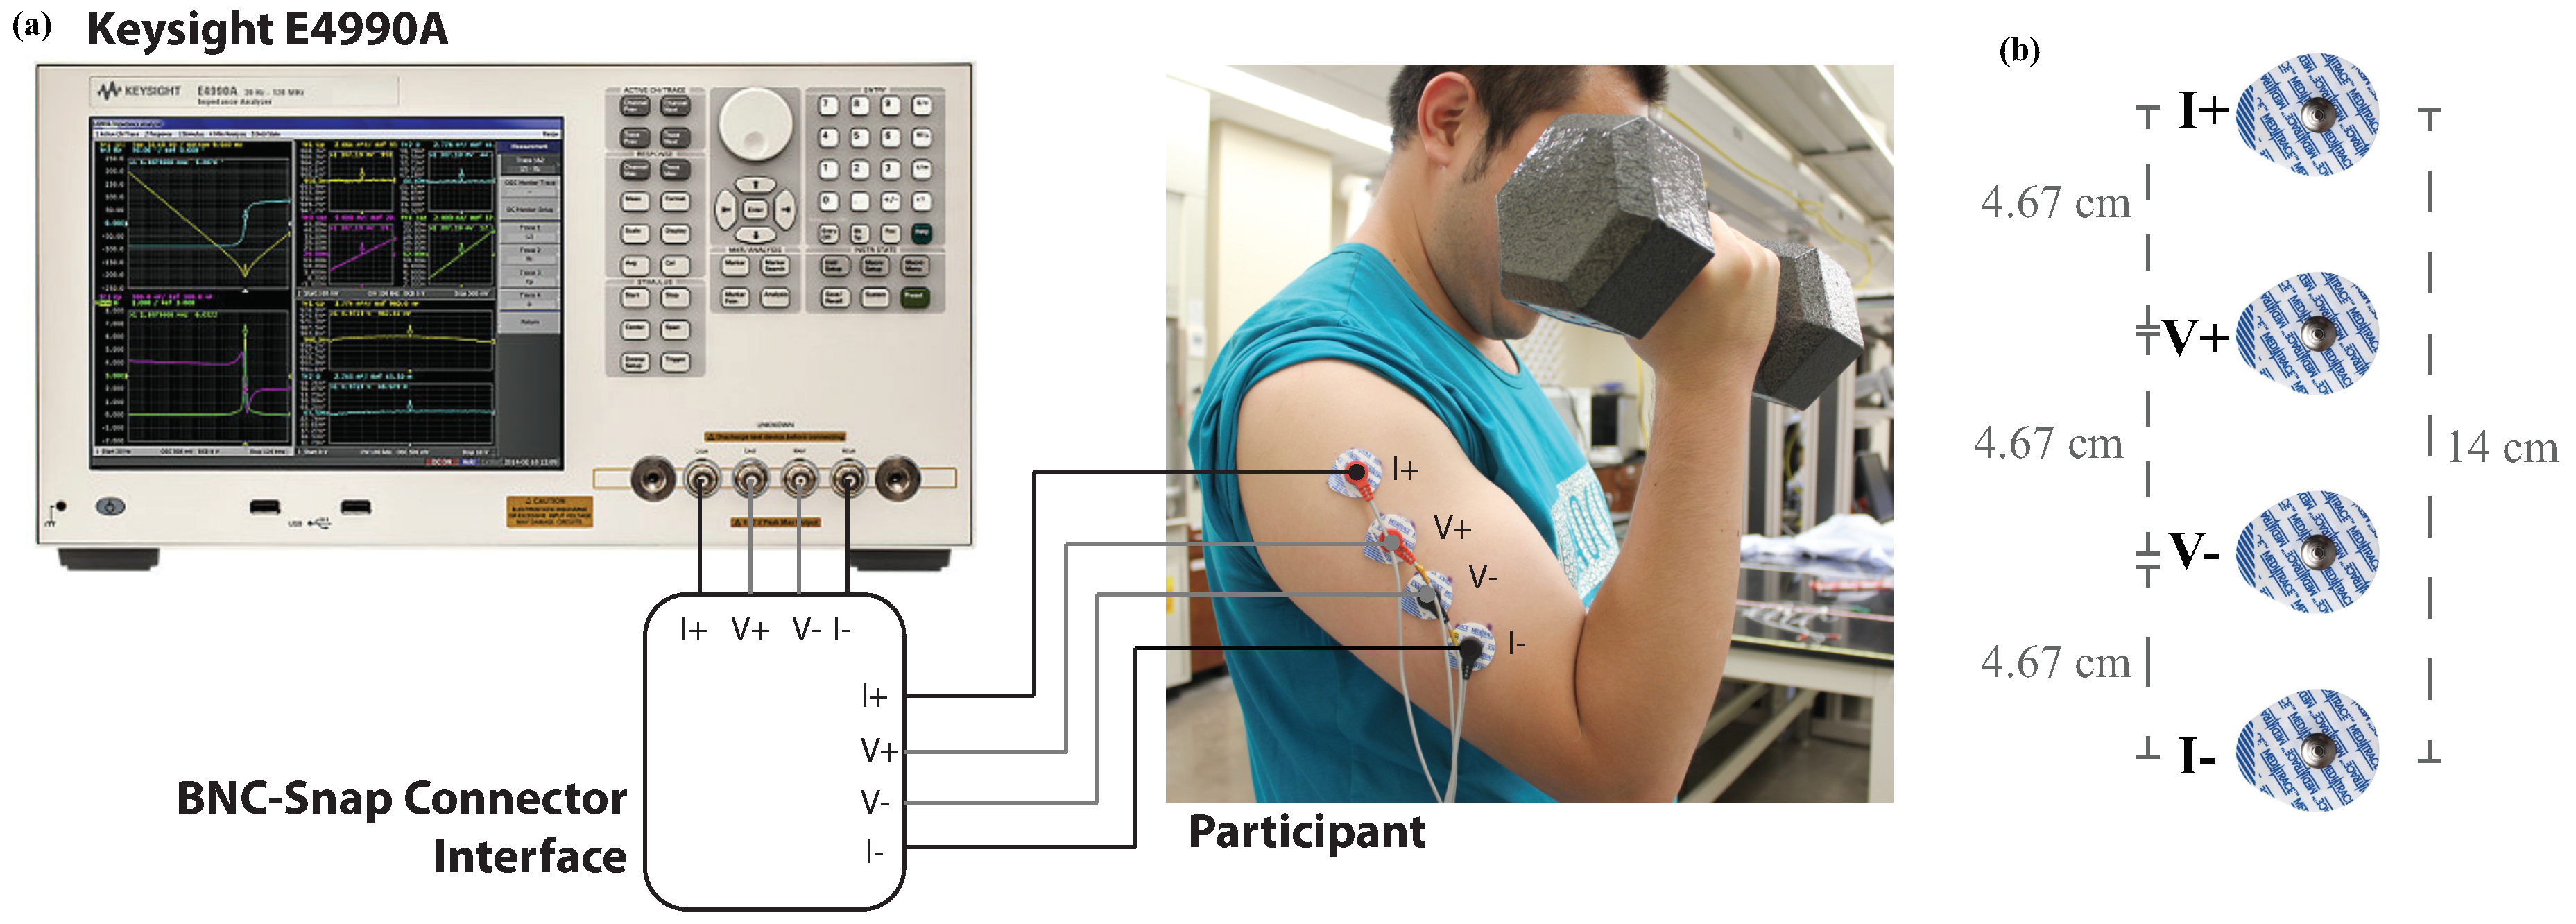
Figure 3d, these distortions may be an artifact of the measurement setup, specifically, resulting from the time required to apply the stepped-sine excitations to collect the measurements from 10 kHz to 100 kHz. For this series of tests, the Keysight E4990A was configured to measure at its highest accuracy setting, which required
s per measured frequency for a total of
s for the measurement from 10 kHz to 100 kHz. Even though participants were asked to relax their arms and remain motionless, there could have been variations in arm position and changes in the contraction of muscles which could have altered the electrical impedance of the tissue at each instant. This is a known limitation of the measurement of impedances using stepped sines for time-invariant impedances [
32]. To reduce the potential impact of the time variant measures for future studies using the Keysight E4990A for bioimpedance studies, the measurement time could be reduced. However, this will reduce the accuracy of collected measurements and needs to be investigated to determine the correct balance of measurement time/accuracy for these applications. Also, additional sensor data could be collected during bioimpedance measures to assess motion and posture to evaluate windows during which movement artifacts will not be impacting the bioimpedance data; with this approach having been implemented for wearable systems to assess knee joint health [
33].
