Article

Topological–Multifractal Characterization of Adaxial–Abaxial Leaf Surface Asymmetry in Theobroma grandiflorum via Minkowski Functionals and Confocal Profilometry


by
Ricardo Cruz de Souza, Filho
1,
Adriana de Souza Fontes
1,
Emanuel Félix Andrade Ramos
1,
Glenda Quaresma Ramos
1,2,3,
Robert Saraiva Matos
4,
Mariane Peres Pereira
5,
Carlos Alberto Rodrigues Costa
5 and
Henrique Duarte da Fonseca, Filho
1,*
1
Laboratório de Desenvolvimento e Aplicações de Nanomateriais da Amazônia (LADENA), Departamento de Física de Materiais, Universidade Federal do Amazonas, Manaus 69067-005, AM, Brazil
2
Centro Multiusuário para Análise de Fenômenos Biomédicos (CMABio), Universidade do Estado do Amazonas—UEA, Manaus 69065-001, AM, Brazil
3
Programa de Pós-Graduação em Ciências Biológicas–Biofísica, Instituto de Biofísica Carlos Chagas Filho, Universidade Federal do Rio de Janeiro, Rio de Janeiro 21941-170, RJ, Brazil
4
Grupo de Materiais Amazônicos, Departamento de Física, Universidade Federal do Amapá, Macapá 68903-419, AP, Brazil
5
Laboratório Nacional de Nanotecnologia (LNNano), Centro Brasileiro de Pesquisa em Energia e Materiais (CNPEM), Campinas 13083-100, SP, Brazil
*
Author to whom correspondence should be addressed.
Fractal Fract. 2026, 10(8), 535; https://doi.org/10.3390/fractalfract10080535
Submission received: 23 May 2026 / Revised: 31 July 2026 / Accepted: 3 August 2026 / Published: 5 August 2026
(This article belongs to the Special Issue Applications of Fractal Geometry in Surface Science)

Abstract

This study presents a unified topological and multifractal framework for the characterization of leaf surface complexity in Theobroma grandiflorum. By combining laser scanning confocal microscopy (LSCM)-derived three-dimensional profilometry with Minkowski functionals and multifractal analysis, we quantitatively distinguished the structural organization of adaxial and abaxial surfaces beyond conventional morphological descriptions. The analysis of the Minkowski functionals revealed distinct connectivity regimes and threshold-dependent transitions, indicating differences in surface topology and percolation behavior. These findings were further supported by multifractal spectra, which exhibited a broader distribution of singularities for the abaxial surface, reflecting increased heterogeneity and structural complexity. The introduction of the normalized differential parameter ΔP proved to be an effective strategy for directly quantifying morphological asymmetry, while radar plots enabled an integrated visualization of multivariate descriptors. From a physical perspective, the observed differences are consistent with the functional specialization of leaf surfaces, where the abaxial side exhibits greater structural complexity associated with gas exchange and environmental interaction, while the adaxial surface remains more compact and protective. Overall, the proposed approach advances the application of fractal and topological methods to biological systems, offering a scalable and transferable framework for the analysis of complex natural surfaces. This methodology opens new perspectives for studies in plant morphology, taxonomy, and environmental adaptation, aligning with the broader scope of fractal and fractional analysis in complex systems.

1. Introduction

The Amazon region hosts a vast diversity of plant species with ecological, cultural, and economic relevance, among which Theobroma grandiflorum stands out as a key native fruit tree. Belonging to the Malvaceae family, this species is widely cultivated in northern and northeastern Brazil and plays a fundamental role in the subsistence and income of local communities [1,2]. Its fruits are extensively used in the production of juices, pulps, sweets, and derivatives such as “cupulate”, contributing to a growing agro-industrial interest [3,4,5,6]. Beyond its economic importance, T. grandiflorum is deeply rooted in the cultural and nutritional practices of Amazonian populations, reflecting the broader relevance of the genus Theobroma, whose name derives from the Greek expression meaning “food of the gods” [7].
The genus Theobroma comprises approximately 22 species distributed across tropical regions of Central and South America, with several taxa producing edible fruits and exhibiting significant morphological similarities [7]. Among them, Theobroma cacao and Theobroma grandiflorum are particularly prominent due to their commercial value and widespread cultivation [8]. Despite their importance, the morphological characterization of these species—especially at the microscale—remains challenging, as conventional descriptors often fail to capture the intrinsic structural heterogeneity of leaf surfaces. This limitation becomes critical when subtle morphological differences must be quantified for taxonomic, physiological, or environmental studies.
In this context, the quantitative description of surface complexity has emerged as a relevant problem in plant science, particularly when dealing with irregular and multiscale structures. Fractal geometry offers a robust mathematical framework to address this issue, enabling the characterization of complex patterns beyond classical Euclidean descriptors. While monofractal approaches provide a single scaling exponent, multifractal analysis extends this framework by capturing the distribution of local singularities through a spectrum of fractal dimensions, thus offering a more comprehensive representation of structural heterogeneity [9,10].
Beyond the classical concept of a single fractal dimension, multifractal theory was developed to describe systems whose scaling behavior cannot be represented by a unique exponent. Instead, multifractal formalism characterizes a hierarchy of local singularities through generalized dimensions, mass exponents, and singularity spectra, providing a richer mathematical description of heterogeneous structures distributed across multiple spatial scales. In this framework, the generalized dimensions (Dq) quantify the scaling properties of different subsets of the measure, whereas the singularity spectrum ( f ( α ) ) describes the distribution of local scaling exponents, allowing the identification of dominant and rare structural features. These descriptors have become fundamental tools for investigating complex systems exhibiting spatial intermittency, heterogeneous organization, and nonuniform scaling behavior.
Over the past decades, multifractal theory has evolved considerably, extending its mathematical foundations to generalized measures, relative multifractal analysis, projections, and density-based formulations. These developments have considerably broadened the applicability of multifractal methods, providing more rigorous tools for the characterization of complex natural systems and heterogeneous spatial patterns. Recent advances have further reinforced the mathematical framework of multifractal analysis and demonstrated its versatility across different scientific disciplines, including biological, environmental, and material systems, where conventional Euclidean or monofractal descriptors are often insufficient to capture the intrinsic complexity of the analyzed structures [11,12].
Based on these mathematical developments, multifractal and fractal-based methods have been successfully applied to a wide range of biological systems, including vascular networks, species classification, plant development, and stress detection [13,14,15,16,17,18,19,20,21]. These approaches provide insights into the organization of complex systems by revealing scaling behaviors and hidden structural patterns that are not accessible through conventional morphological analysis. In particular, the multifractal spectrum enables the identification of heterogeneity regimes and the spatial distribution of complexity, which are directly linked to functional and environmental adaptations.
Complementarily, Minkowski functionals provide a topological and geometrical framework for characterizing surfaces through measures such as volume, surface area, and Euler–Poincaré characteristic, allowing the investigation of morphological transitions as a function of a threshold parameter. When applied to height maps, these descriptors encode information about connectivity, percolation, and structural organization, establishing a direct link between geometry and topology [22,23,24]. The combined use of Minkowski functionals and multifractal analysis thus constitutes a powerful approach for probing multiscale complexity in natural surfaces, particularly in biological systems where irregularity and heterogeneity are intrinsic features.
Despite these advances, important limitations remain in the quantitative characterization of complex biological surfaces. Most previous studies have employed either conventional roughness descriptors, fractal or multifractal analyses, or topological descriptors independently. Consequently, the relationship between surface geometry, connectivity, and multiscale heterogeneity is rarely investigated within a unified mathematical framework. Furthermore, most studies on plant leaf morphology have relied on two-dimensional imaging or single-scale descriptors, limiting the quantitative description of hierarchical surface organization. The use of laser scanning confocal microscopy (LSCM) as a source of high-resolution three-dimensional topographical data for the combined application of Minkowski functionals and multifractal analysis remains largely unexplored, particularly for Amazonian plant species such as Theobroma grandiflorum.
In this work, we propose an integrated framework for the quantitative characterization of biological surface complexity by combining optical microscopy, scanning electron microscopy, laser scanning confocal microscopy, Minkowski functionals, and multifractal analysis. Unlike conventional surface characterization, which is primarily based on average roughness parameters, the proposed methodology simultaneously quantifies geometrical, topological, and scale-dependent properties from the same three-dimensional dataset. This integration enables the investigation of connectivity transitions, interfacial organization, and hierarchical heterogeneity, providing complementary information that cannot be extracted from conventional stereometric parameters alone. Although demonstrated here using Theobroma grandiflorum leaves as a model biological system, the proposed framework is readily transferable to other natural and engineered surfaces, including biomaterials, bioinspired interfaces, porous media, thin films, and functional coatings.

2. Materials and Methods

2.1. Leaf Sampling

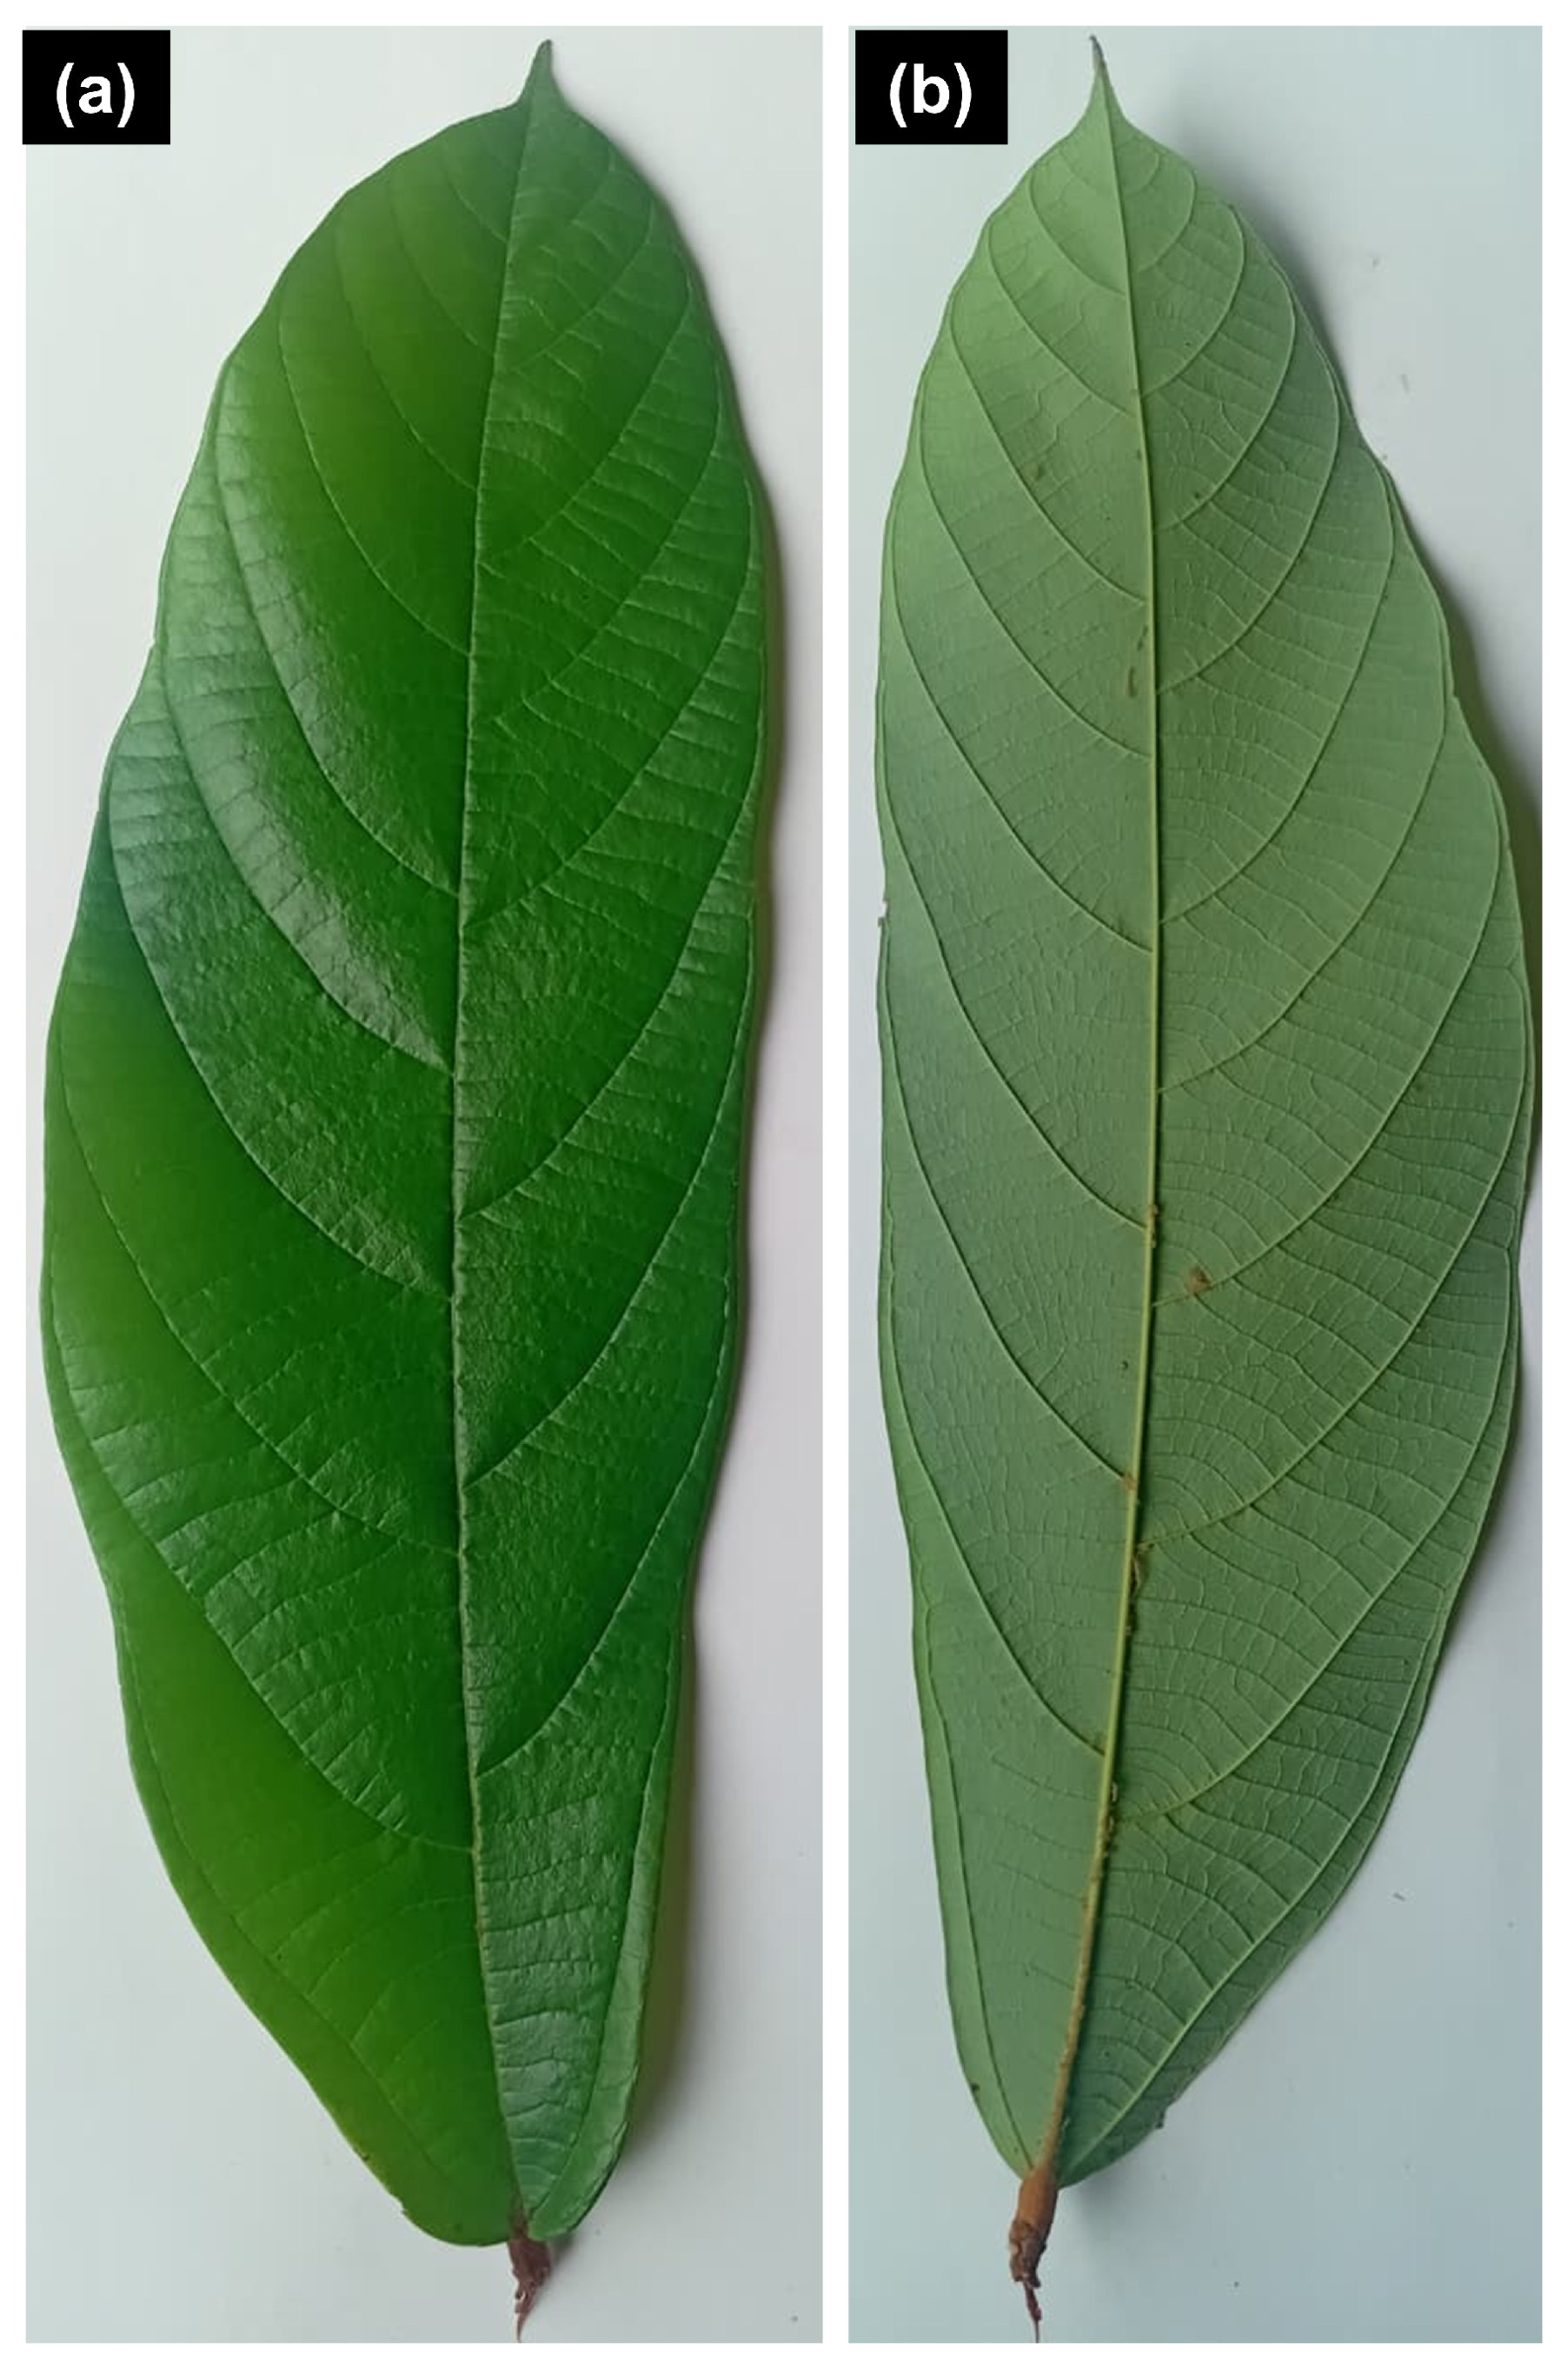
Leaf samples of Theobroma grandiflorum were collected from a mature tree located in Manacapuru, Amazonas, Brazil (geographic coordinates: 3.3397° S, 60.6443° W; altitude: 32.39 m), near Estrada Manoel Urbano, 330–Centro, in the northern region of Brazil. To remove surface contaminants, both sides of the leaves were gently washed under running water for 30 s, followed by rinsing with deionized water to eliminate residual impurities. The samples were then air-dried under ambient conditions prior to analysis. As illustrated in Figure 1, the leaves of Theobroma grandiflorum exhibit a marked morphological distinction between their adaxial and abaxial surfaces. The adaxial surface is typically smoother and more compact, reflecting the presence of a well-developed cuticular layer, whereas the abaxial surface exhibits a more irregular and heterogeneous texture, often associated with structural features such as trichomes and stomatal complexes. These inherent differences make T. grandiflorum leaves an excellent model system for investigating multiscale surface complexity and topological heterogeneity.

2.2. Topographical and Morphological Analysis

Both adaxial and abaxial surfaces were investigated. Leaf sections of approximately 5 × 5 mm2 were prepared for morphological characterization. For scanning electron microscopy (SEM), the samples were mounted on aluminum stubs (10 mm diameter) using double-sided conductive carbon tape, followed by gold sputter coating to ensure electrical conductivity. Imaging was performed using a JEOL JSM-6390LV microscope (JEOL Ltd., Tokyo, Japan) operating at an accelerating voltage of 5 kV. Secondary electron (SE) images were acquired at a magnification of 500× with a resolution of 2560 × 2048 pixels and 8-bit grayscale depth. Optical microscopy images were obtained at 50× magnification with the same spatial resolution (2560 × 2048 pixels), providing complementary morphological information at the microscale.
For three-dimensional topographical characterization, leaf samples were mounted on glass slides in a configuration that allowed simultaneous exposure of both adaxial and abaxial surfaces. The specimens were fixed onto the sample holder using double-sided adhesive tape and labeled as Cupu_Ad (adaxial) and Cupu_Ab (abaxial). Three independent specimens were analyzed for each surface.
Three-dimensional surface maps were obtained using laser scanning confocal microscopy (LSCM—Keyence, Osaka, Japan), which enables non-contact profilometry through optical sectioning and height reconstruction. The system combines conventional optical microscopy with laser illumination (wavelength λ = 408 nm), allowing high-resolution topographical acquisition based on the intensity of reflected light. During image acquisition, a sequence of optical sections is recorded along the vertical (z) axis, covering the complete height range of the scanned region. The acquired optical sections are subsequently combined to reconstruct the full three-dimensional surface topography.
Topographical measurements were performed using a VK-X200 LSCM system (Keyence, Osaka, Japan), operating at a fixed wavelength of 408 nm. All measurements were performed in an ISO 7 cleanroom environment to minimize contamination and external interference. For each leaf specimen, four regions measuring 220 μm × 200 μm were scanned at a resolution of 512 × 512 pixels under controlled environmental conditions (296 ± 1 K and relative humidity of 40 ± 1%). The resulting height maps were processed using Gwyddion 2.56 software [25], following the ISO 25178–2 [26] standard for areal surface texture analysis [26,27].

2.3. Minkowski Functionals Parameters

In the present study, the Minkowski functionals were computed using the Gwyddion 2.56 software [25,28], based on the thresholding of the height field z(x, y) and the subsequent binarization of the surface into excursion sets. For a given threshold level z0, the surface is partitioned into regions above and below the threshold, allowing the definition of the following normalized Minkowski functionals:
V z 0 = N w h i t e N
S z 0 = N bound N
χ z 0 = C white C black N
where Nwhite denotes the number of pixels with height values above the threshold z0, and N is the total number of pixels in the image. The term Nbound denotes the number of boundary elements separating white and black regions, thus providing a measure of interfacial complexity. The quantities Cwhite and Cblack represent the number of connected clusters in the excursion set and its complement, respectively.

2.4. Multifractal Mathematics

The multifractal characterization of the surface topographies was performed using the box-counting formalism, which provides a robust framework for quantifying scale-dependent heterogeneity in complex spatial structures. This method evaluates how a measure distributed over a domain scales with the observation scale ε, allowing the identification of nonuniform scaling behavior associated with multifractal systems.
For a given discretized surface, the domain is partitioned into a grid of boxes of linear size ε. In the monofractal limit, the number of occupied boxes N(ε) follows a power law scaling relation:
N ε ε D 0
where D0 denotes the capacity dimension, corresponding to the classical fractal dimension of the set. However, natural surfaces rarely exhibit uniform scaling properties, requiring a probabilistic description based on the distribution of mass or intensity across the boxes.
Let Pj (ε) represent the normalized measure associated with the j-th box at scale ε. The multifractal formalism introduces the partition function:
Z ( q , ε ) = j P j ( ε ) q
from which the generalized dimensions D q are defined as:
D q = 1 q 1 l i m ε 0 l n   Z ( q , ε ) ln ε , ( q 1 )
For the particular case q = 1 , the definition is obtained through the limit:
D 1 = l i m ε 0 j P j ( ε ) l n   P j ( ε ) ln ε
which corresponds to the information dimension.
The scaling behavior of the partition function is further described by the mass exponent τ ( q ) , defined as:
τ ( q ) = ( q 1 ) D q
which encodes the dependence of the scaling law on the statistical moment q . A linear dependence of τ ( q ) indicates monofractal behavior, whereas deviations from linearity reveal multifractal structure.
For each moment order q , the scaling behavior of the partition function was evaluated by plotting l n Z ( q , ε ) as a function of ln ε . Under multifractal scaling, the partition function follows a power law relationship,
Z q , ε   α   ε τ ( q )
where the mass exponent τ q is obtained from the slope of the corresponding double-logarithmic regression:
τ q = d ln Z q , ε d ln ε
The linearity of these regressions over the analyzed scale interval was used as an internal criterion to verify the applicability of the multifractal formalism.
A more detailed description of the scaling properties is provided by the singularity spectrum f ( α ) , which characterizes the fractal dimension of subsets associated with a given singularity strength α . Within the Legendre transform formalism [29,30], these quantities are related by:
α ( q ) = d τ ( q ) d q ,   f ( α ) = q α τ ( q )
Alternatively, the singularity spectrum can be directly estimated using the approach proposed by Chhabra and Jensen [31], based on coarse-grained probability measures. In this formulation, both α ( q ) and f ( q ) are computed directly from weighted distributions, avoiding numerical differentiation.
The generalized dimensions D 0 , D 1 , and D 2 provide complementary physical interpretations of the surface structure. The capacity dimension D 0 quantifies the space-filling properties of the surface, the information dimension D 1 is associated with the entropy of the distribution, and the correlation dimension D 2 reflects spatial correlations between structural elements. The corresponding singularity strengths α0, α1, and α2, reported in Table 1, represent the values of the singularity exponent associated with the generalized dimensions D0, D1, and D2 (i.e., q = 0, 1, and 2), respectively. These parameters provide complementary information on the local scaling behavior of the surface and are commonly used to characterize the distribution of singularities in multifractal systems. The generalized dimensions and singularity descriptors have been related in previous studies to physical properties such as porosity [32], permeability [33], and spatial organization in heterogeneous systems [34].
The heterogeneity of the surface is commonly quantified by the width of the singularity spectrum:
Δ α = α m a x α m i n
which represents the width of the distribution of local scaling exponents. Larger values of Δ α indicate stronger multiscale variability and higher morphological complexity, whereas Δ α 0 corresponds to a homogeneous, monofractal structure [35,36].
Additional geometric information can be extracted from the asymmetry of the spectrum. The horizontal skewness is defined as:
H = ( α 0 α m a x ) ( α m i n α 0 )
where α 0 denotes the most probable singularity. This parameter reflects the relative dominance of high- or low-intensity regions. The vertical asymmetry is given by:
Δ f = f ( α m i n ) f ( α m a x )
which quantifies the imbalance between the two branches of the spectrum and provides further insight into the distribution of extreme singularities.
To provide a direct quantitative comparison between the adaxial and abaxial surfaces, a normalized differential parameter Δ P was defined for each descriptor P , allowing the relative contrast between surfaces to be expressed in a dimensionless and scale-independent form. This parameter is given by:
Δ P = P A b P A d P A b + P A d
where P A b and P A d correspond to the values of a given morphological, topological, or multifractal descriptor for the abaxial and adaxial surfaces, respectively. This formulation ensures that Δ P ( 1 , 1 ) , with positive values indicating dominance of the abaxial surface and negative values indicating dominance of the adaxial surface. To complement this pairwise comparison and enable multidimensional visualization, each parameter was also normalized using min–max scaling:
P n o r m = P P m i n P m a x P m i n
where P m i n and P m a x are the minimum and maximum values of the parameter across the two surfaces. This normalization constrains all descriptors to the interval 0 1 , facilitating their representation in radar plots and enabling a consistent comparison across parameters with different physical units and magnitudes.

2.5. Statistical Analysis

For each leaf surface, three independent leaf specimens were analyzed, and four LSCM topographical maps were acquired from different regions of each specimen, resulting in twelve analyzed maps for the adaxial surface and twelve analyzed maps for the abaxial surface. The multifractal descriptors were extracted individually from each LSCM map using the MULTIFRAC plugin for ImageJ 1.52a software. The results are presented as mean ± standard deviation (SD).
Statistical comparisons between adaxial and abaxial surfaces were performed using Student’s t-test for the main multifractal descriptors. Statistical significance was established at p < 0.05. This analysis was used to evaluate whether the quantitative differences observed between the two leaf surfaces were statistically significant.

3. Results and Discussion

3.1. Multiscale Morphological Characterization

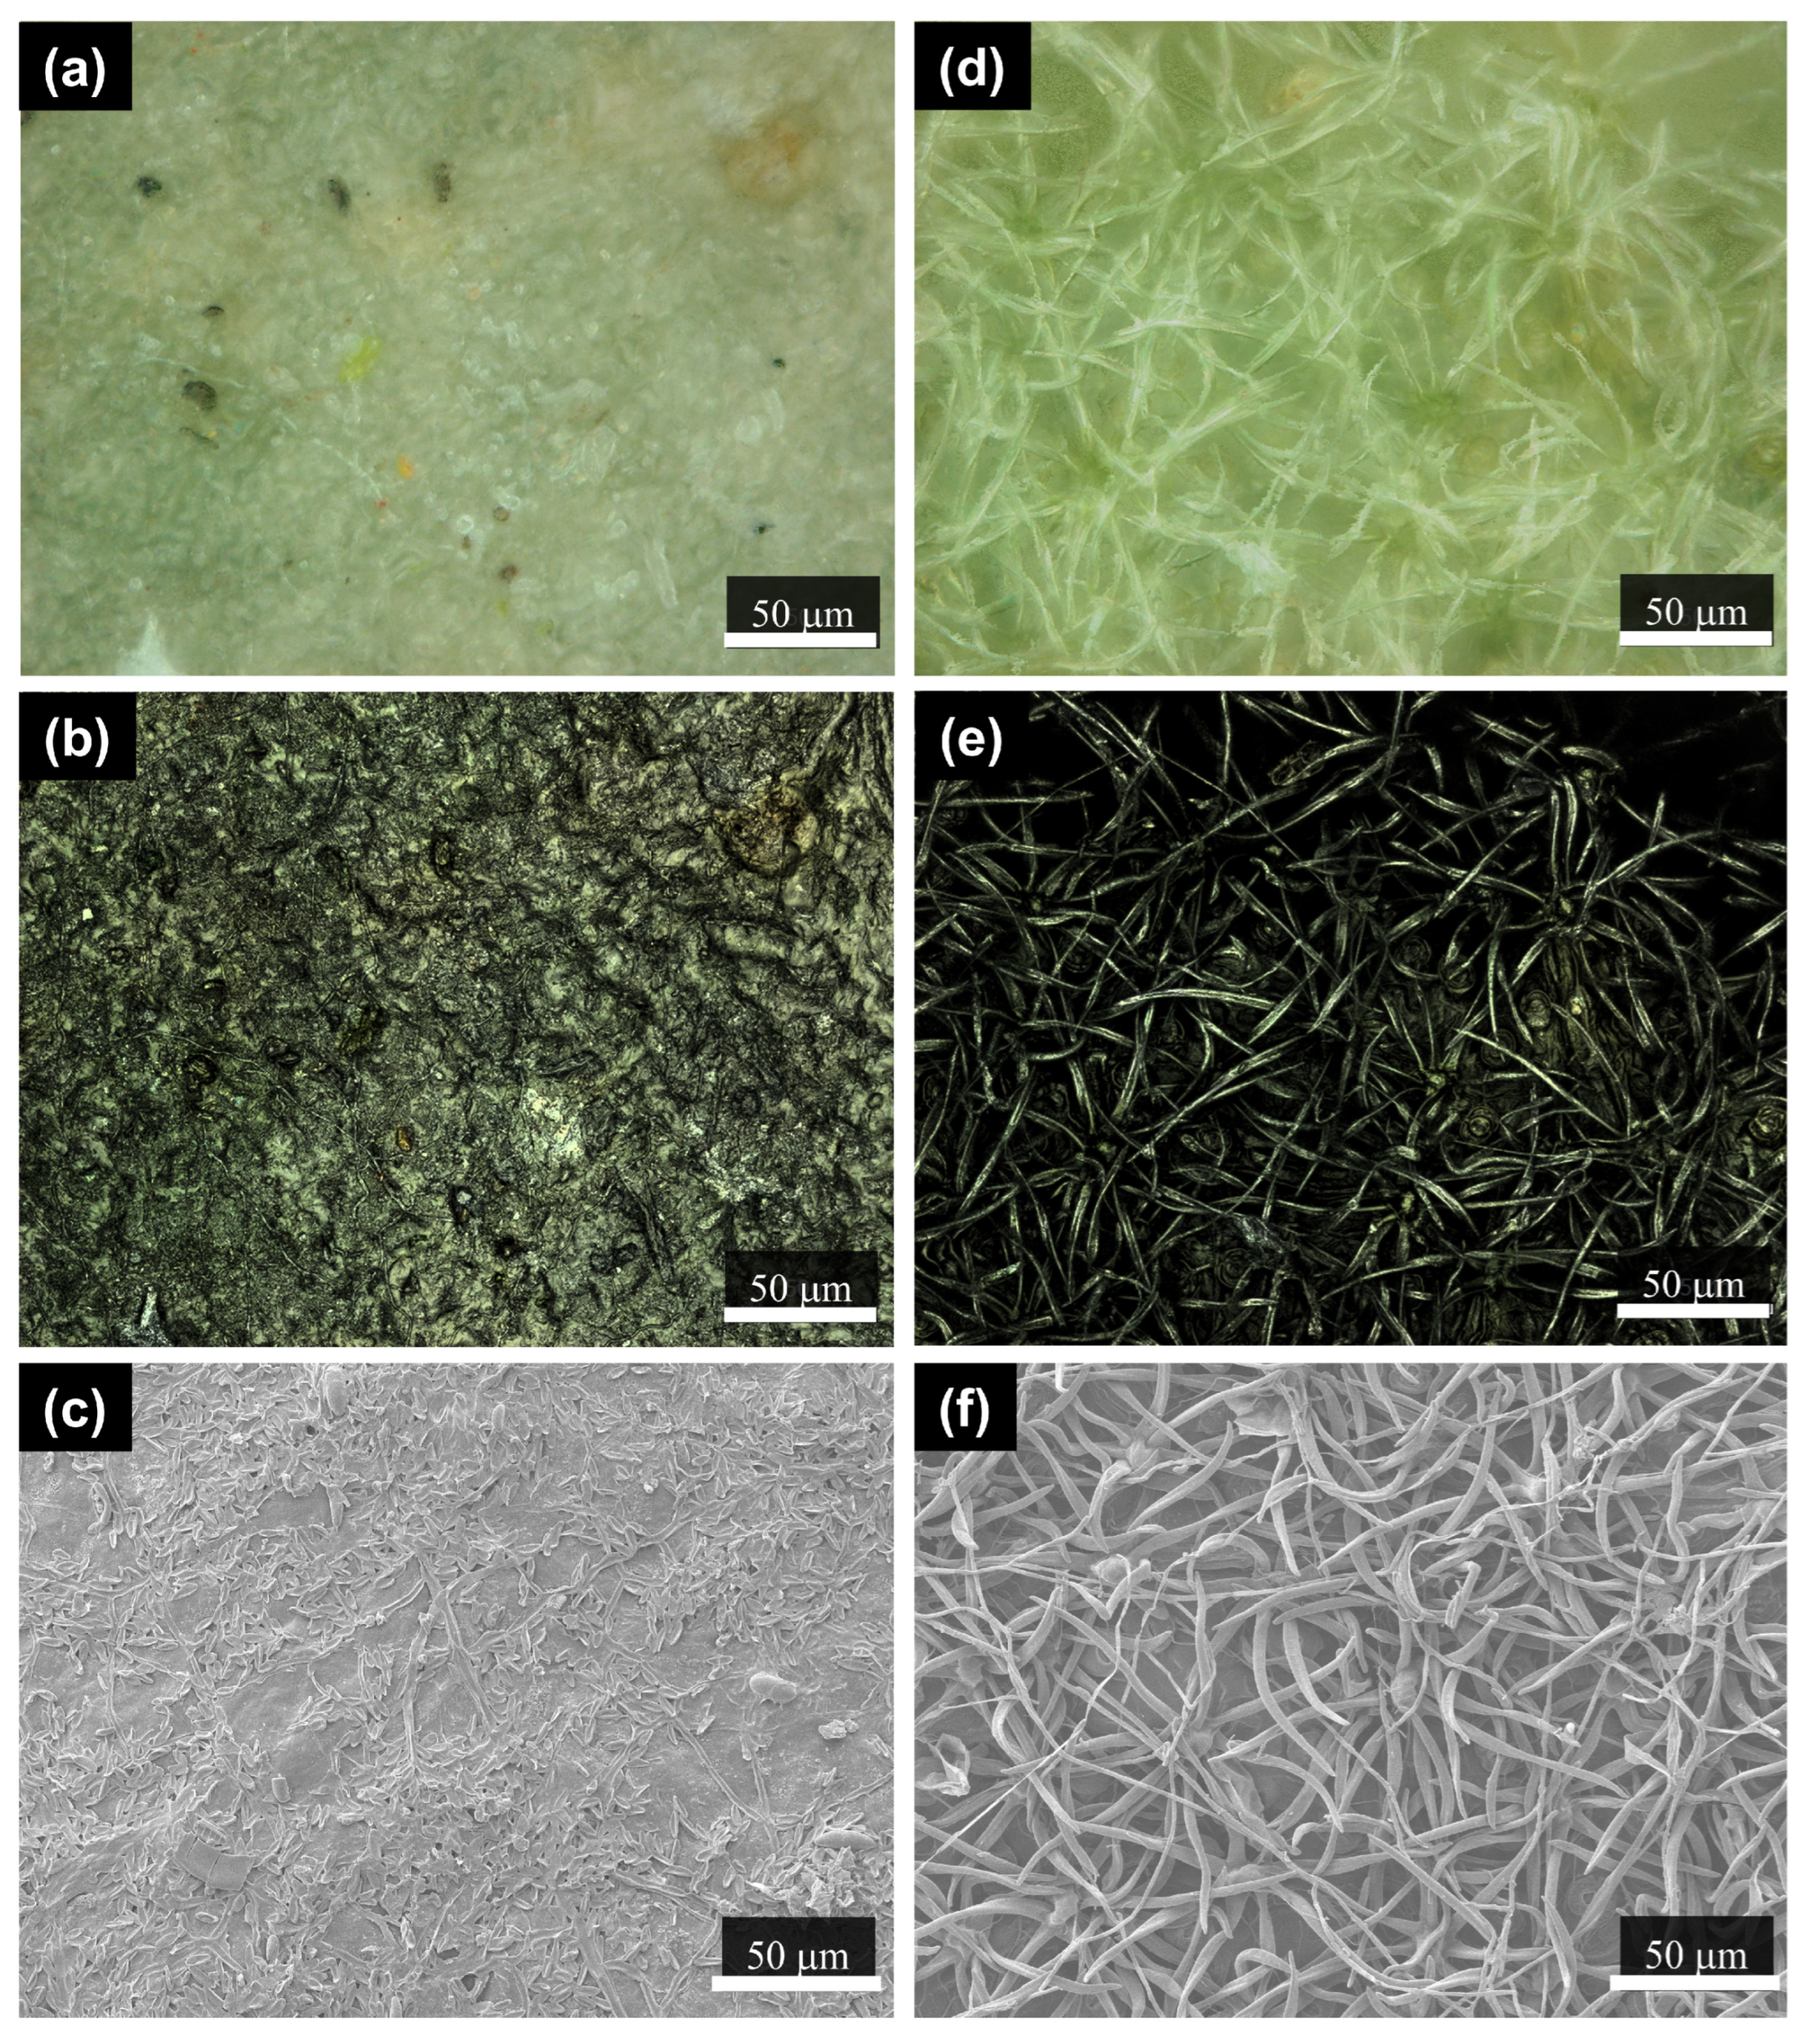
The morphological characterization of Theobroma grandiflorum leaves was performed through a multiscale approach combining optical microscopy (OM), laser-assisted optical imaging, and scanning electron microscopy (SEM), as shown in Figure 2. The adaxial surface (Cupu_Ad) (Figure 2a–c) exhibits a relatively smooth and continuous morphology, with well-defined epidermal organization at lower magnifications (OM), while higher-resolution observations (SEM) reveal a compact and homogeneous surface, consistent with the presence of a well-developed cuticular layer [37,38]. This type of structural organization is commonly associated with protective functions, including a reduction in water loss and shielding against environmental stressors [37,39,40].
In contrast, the abaxial surface (Cupu_Ab) (Figure 2d–f) displays a markedly heterogeneous and irregular morphology across all imaging modalities. Optical and laser-enhanced images indicate increased textural complexity, while SEM micrographs reveal pronounced surface corrugations, protrusions, and features associated with stomatal complexes and possible trichome structures. Such morphological characteristics are directly related to physiological processes such as gas exchange and transpiration, reflecting the functional specialization of the abaxial leaf surface [37,39].
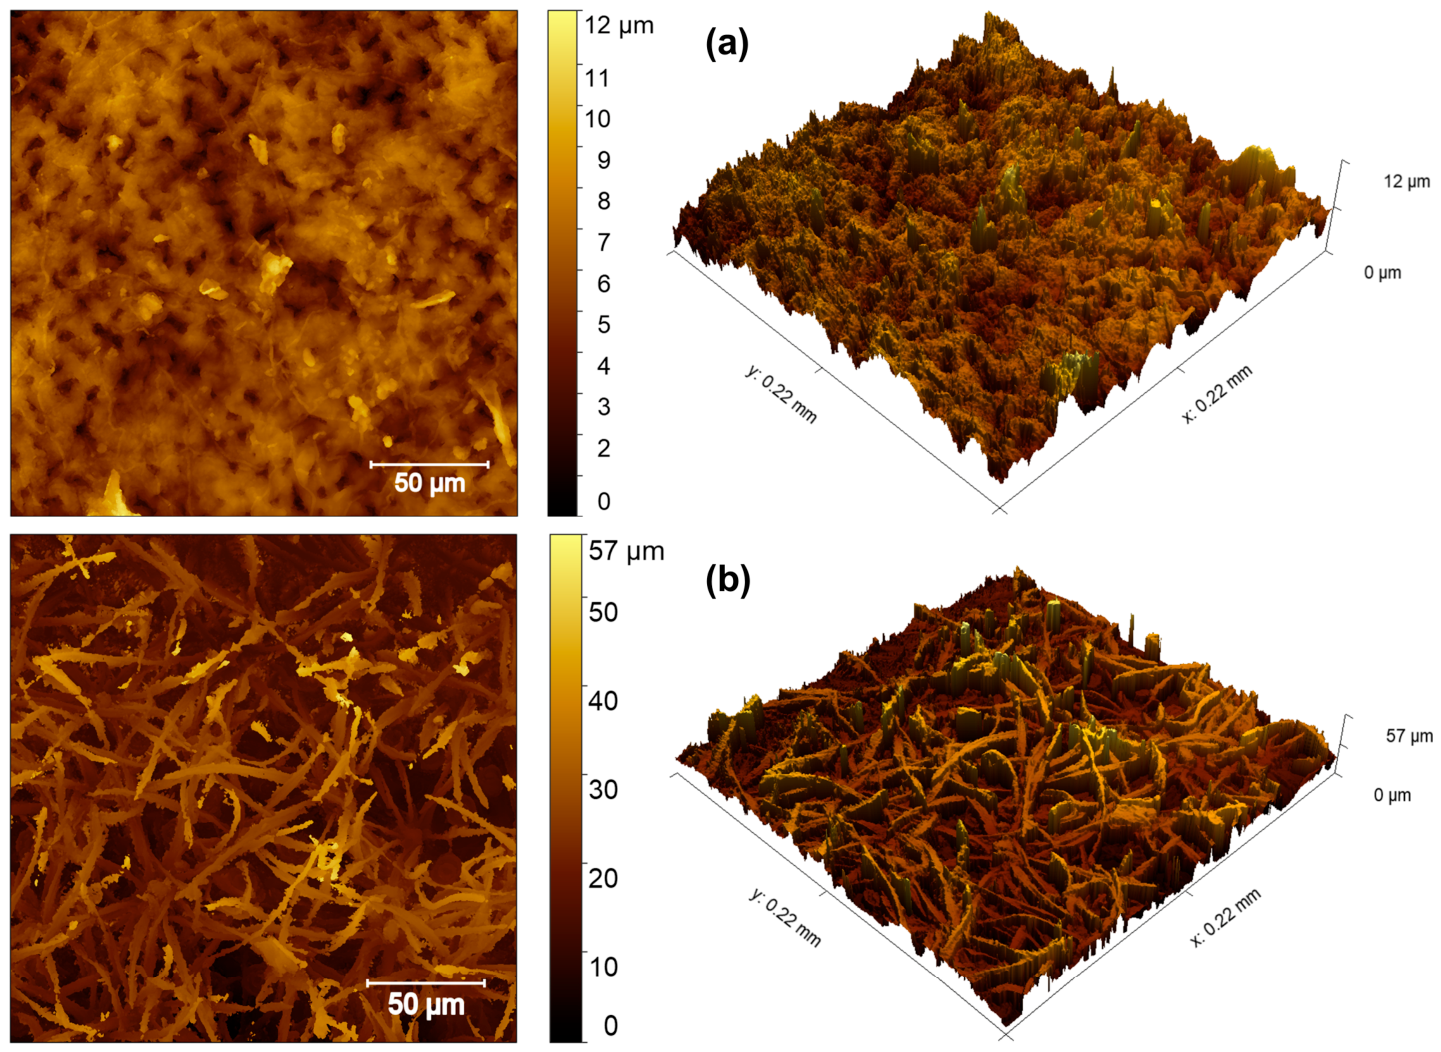
The three-dimensional topographical maps obtained by laser scanning confocal microscopy (LSCM) (Figure 3) provide complementary quantitative insight into these morphological differences. The adaxial surface (Figure 3a) exhibits a narrower height distribution and smoother spatial gradients, indicating lower roughness amplitude and reduced vertical variability. Conversely, the abaxial surface (Figure 3b) presents larger height fluctuations and a more complex spatial organization, characterized by pronounced peaks and valleys distributed over multiple length scales. These features suggest a higher degree of structural heterogeneity and multiscale complexity, which are further explored through topological descriptors and multifractal analysis in the subsequent sections.

3.2. Minkowski Functionals

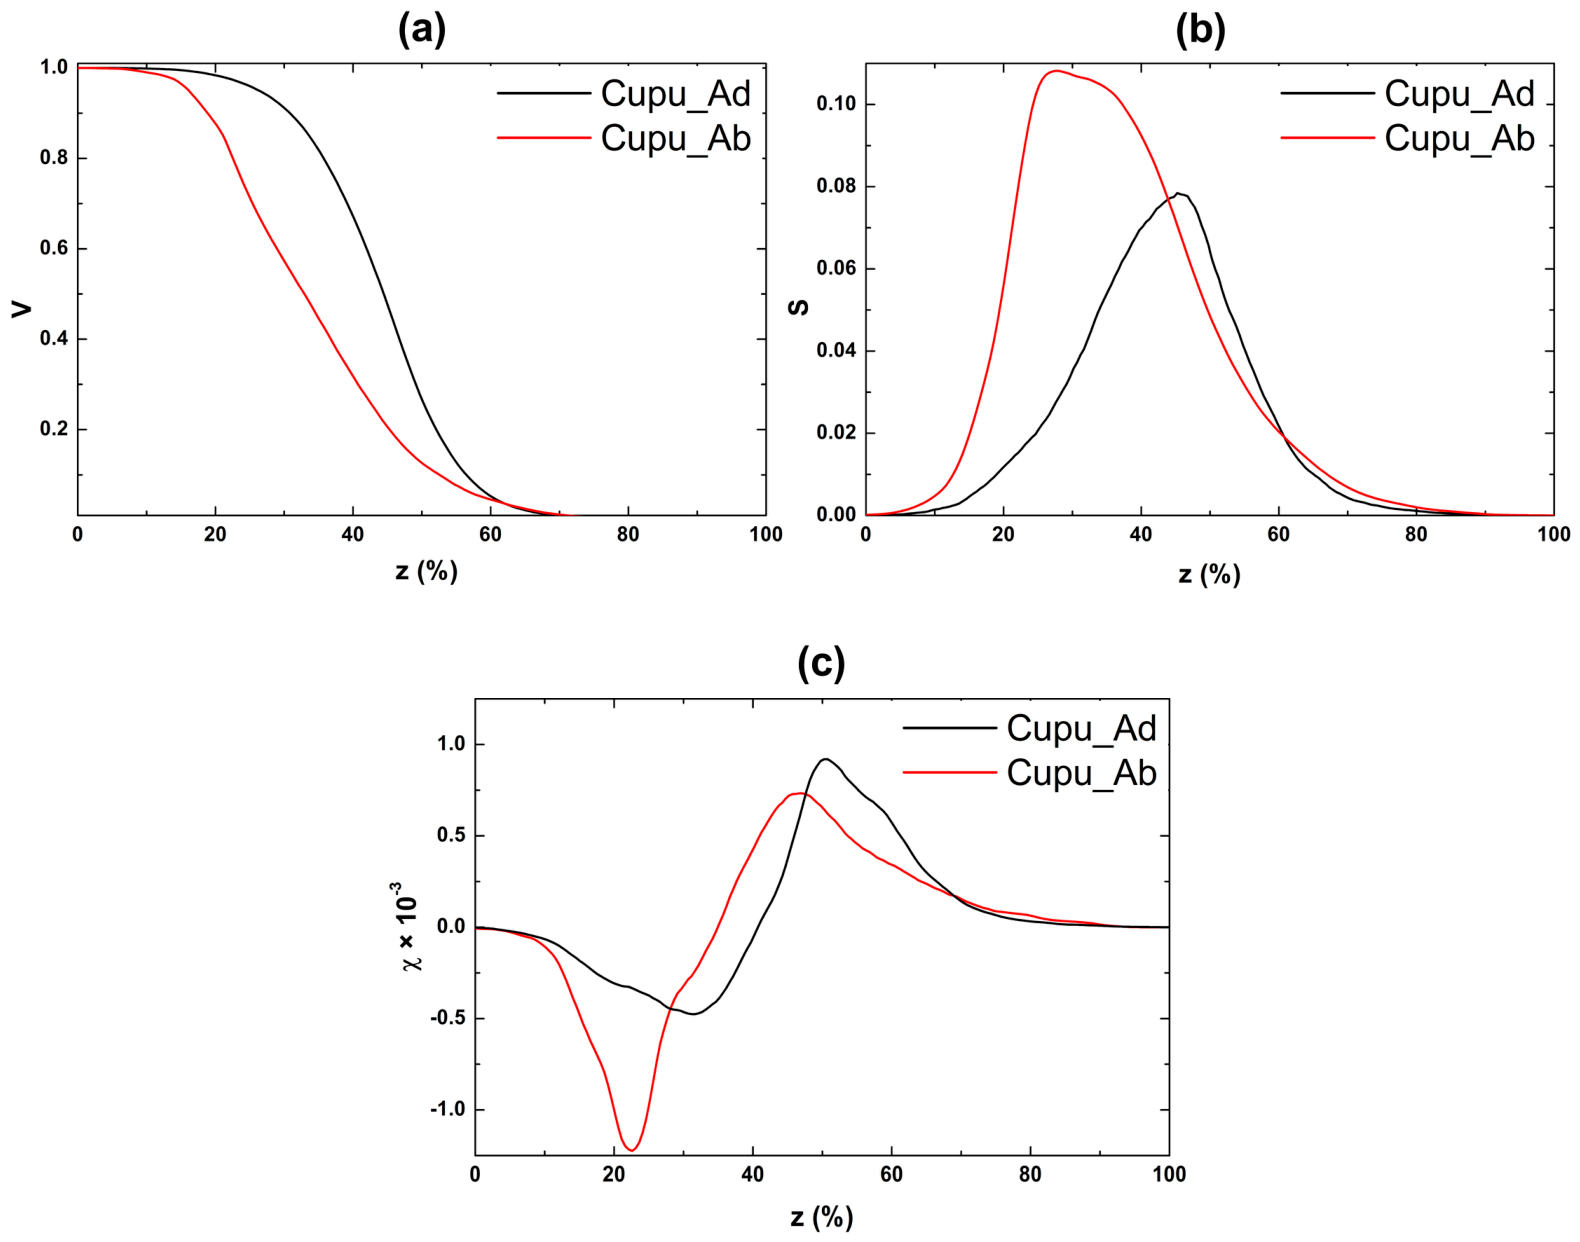
The results, depicted in Figure 4, illustrate the evolution of the Minkowski functionals—volume V ( z 0 ) , boundary S ( z 0 ) , and connectivity χ ( z 0 ) —as a function of the normalized threshold level z 0 , revealing clear differences in the morphological organization of the analyzed surfaces. These variations reflect the intrinsic heterogeneity of the surface textures and provide a multiscale characterization of their geometrical and topological complexity. This analytical approach is based on converting three-dimensional surface reconstructions obtained from LSCM into binary images, segmenting the surface into excursion sets composed of elevated regions (plateaus) and depressed regions (valleys), as previously proposed by Salerno and Banzato [41].
The quantitative characterization of complex surfaces can be rigorously addressed within the framework of integral geometry through Minkowski functionals (MFs), which form a complete set of additive, motion-invariant, and conditionally continuous descriptors. These Functionals are particularly suitable for stochastic and heterogeneous spatial structures, as they simultaneously encode geometrical and topological information of random fields in a unified formalism [42,43,44].
In discretized representations, converting three-dimensional surface reconstructions obtained from LSCM into binary images, the excursion set Q ( z 0 ) = { ( x , y ) z ( x , y ) z 0 } defines a family of binary domains parameterized by the threshold θ . The Minkowski functionals computed over these sets provide a continuous morphological signature of the surface as a function of scale.
From a geometrical standpoint, V z 0 corresponds to the fractional area of the excursion set and is directly related to the cumulative height distribution. The observed sigmoidal behavior of V ( z 0 ) in Figure 4a indicates a gradual transition between dominant plateau and valley regions. Notably, the broader transition observed for the abaxial surface reflects a wider distribution of heights, consistent with increased vertical heterogeneity and roughness dispersion.
The functional S ( z 0 ) , shown in Figure 4b, quantifies the total boundary length between regions above and below the threshold, acting as a measure of interfacial complexity. The presence of a pronounced maximum in S ( z 0 ) indicates the threshold level at which the surface exhibits maximal morphological fragmentation. The higher peak observed for the abaxial surface suggests a greater density of interfaces, consistent with a more intricate arrangement of microstructural features.
The Euler–Poincaré characteristic χ ( z 0 ) , illustrated in Figure 4c, provides a topological descriptor of the excursion set by measuring the difference between the number of connected components and holes. This functional captures the connectivity transitions of the surface structure and is highly sensitive to topological rearrangements [45,46]. The χ ( z 0 ) curves exhibit multiple sign changes, reflecting successive transitions between regimes dominated by isolated peaks ( χ > 0 ) and interconnected valleys ( χ < 0 ). In particular, the larger amplitude of χ ( z 0 ) observed for the abaxial surface indicates enhanced topological fluctuations, corresponding to a higher degree of fragmentation and structural complexity. This behavior is consistent with the broader V(z0) transition and the increased S(z0) peak, further supporting the interpretation of greater morphological heterogeneity and topological complexity in the abaxial surface.
The combined analysis of V ( z 0 ) , S ( z 0 ) , and χ ( z 0 ) thus provides a comprehensive multiscale description of the surface, linking height distribution, interfacial complexity, and topological organization. This framework enables a rigorous quantification of morphological heterogeneity and reveals distinct structural signatures between the analyzed surfaces, bridging geometrical descriptors with statistical and topological measures within a unified mathematical formalism.

3.3. Multifractal Analysis

The leaf surfaces also exhibit pronounced spatial irregularity over multiple length scales, with local height fluctuations and texture organization varying significantly between the adaxial and abaxial regions. In such cases, conventional roughness descriptors are often insufficient, since they reduce the surface to a limited set of average quantities and do not explicitly capture the scale dependence of morphological heterogeneity. Within this context, multifractal analysis provides a mathematically consistent framework for quantifying nonuniform scaling behavior and spatial intermittency in complex biological surfaces [47]. In contrast to monofractal approaches, which assume a single scaling exponent for the entire structure, the multifractal formalism allows different subsets of the surface to be characterized by distinct local singularity exponents, thus accounting for the coexistence of geometrically dissimilar regions across multiple spatial resolutions [48]. By computing the generalized dimensions, mass exponents, and singularity spectrum, this method yields a scale-dependent description of both dominant and rare topographic features [49]. In the present study, three-dimensional LSCM surface maps were analyzed using the Multifrac plugin for ImageJ [50,51], and the generalized multifractal dimensions D q were calculated over the interval q 10 , 10 using box-counting formalism.
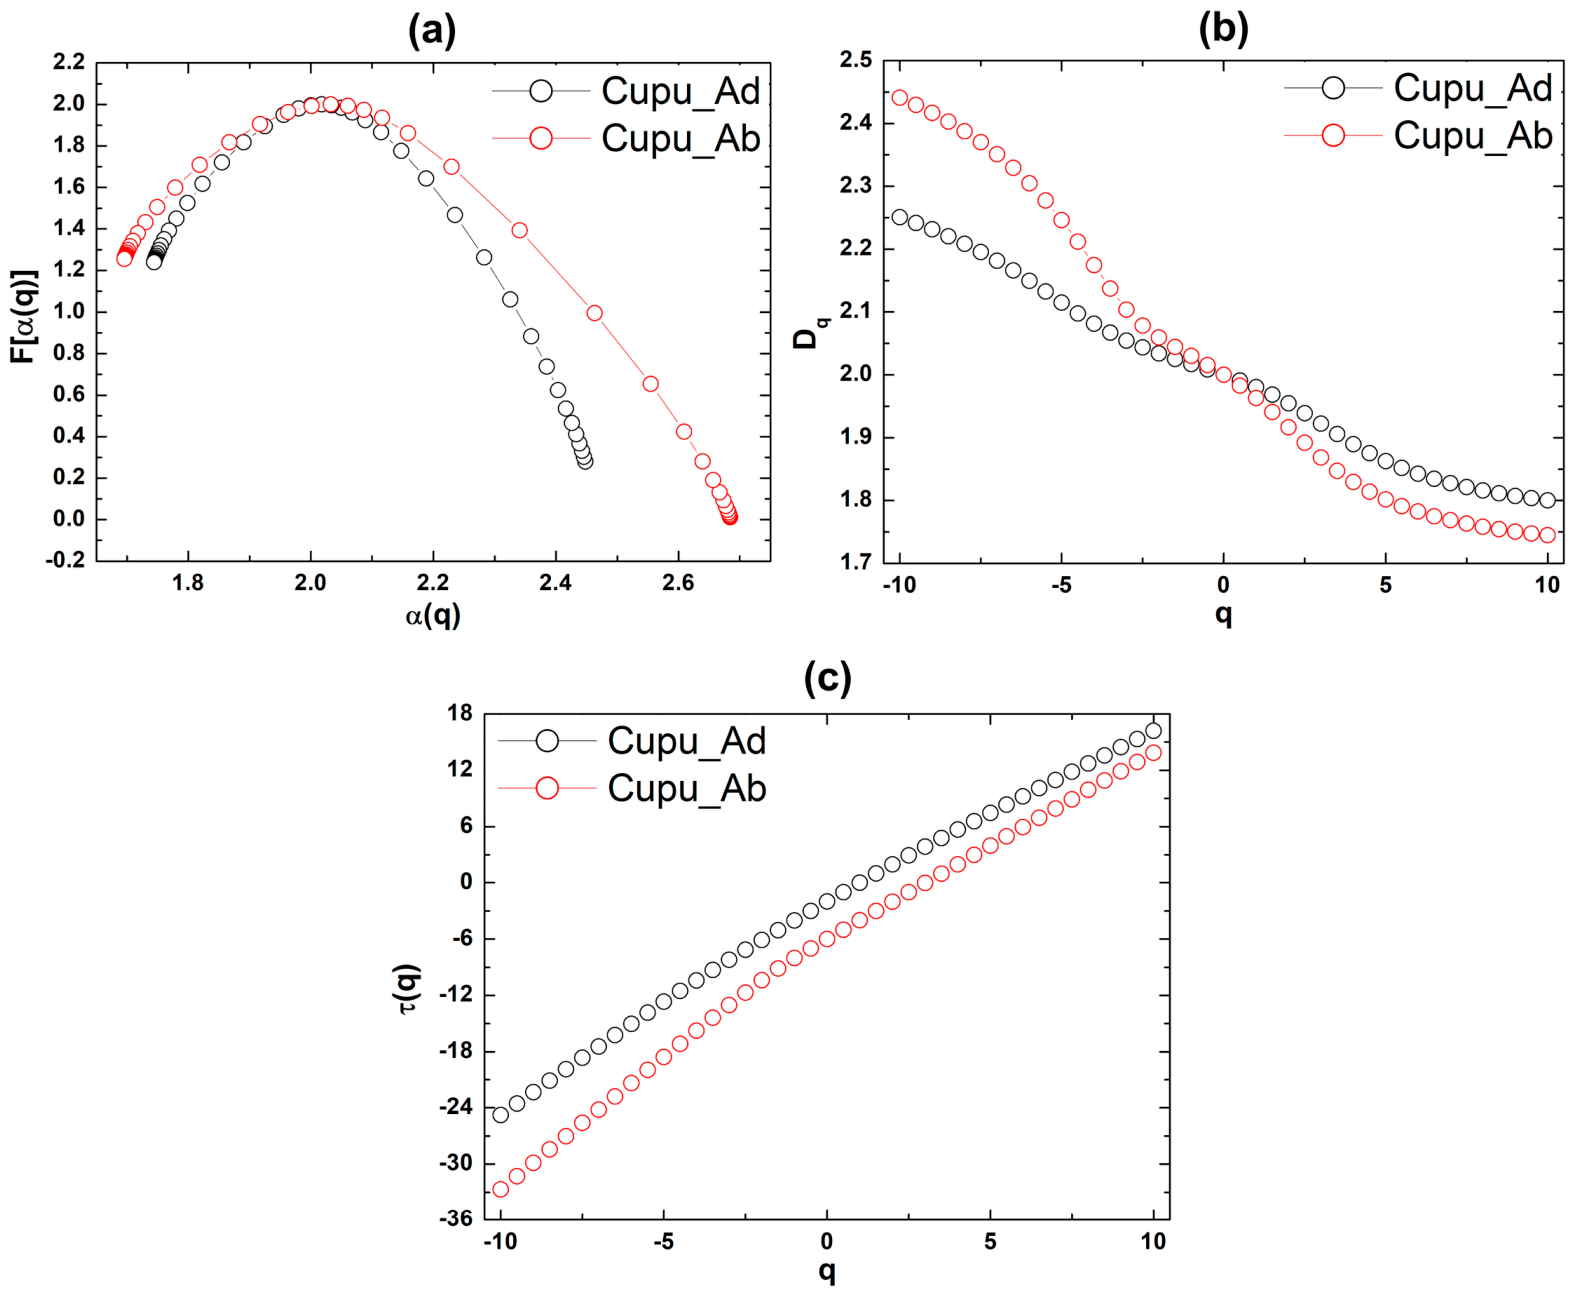
Figure 5 summarizes the multifractal response of the adaxial and abaxial surfaces. The singularity spectra f ( α ) , shown in Figure 5a, exhibit the expected concave profile, which is a necessary signature of multifractality. In Legendre formalism, the function f ( α ) represents the fractal dimension of the subset of points sharing the same local singularity strength α ; consequently, the spectral width provides a direct measure of the dispersion of local scaling exponents. The broader spectrum observed for the abaxial surface indicates a wider distribution of singularities and, therefore, a higher degree of multiscale heterogeneity. This result is consistent with the larger value of Δ α reported in Table 2, indicating that the abaxial morphology exhibits greater multifractal heterogeneity and lower structural uniformity than the adaxial one.
Figure 5b presents the generalized dimension spectra D q . As expected for multifractal systems, D q decreases as q increases, reflecting the unequal contribution of sparse and dense subsets of the measure. For negative q , the formalism emphasizes low-density or weakly occupied regions, whereas for positive q , it weights the densest topographic regions more strongly. Therefore, the nonconstant behavior of D q demonstrates that the LSCM topographies cannot be described by a single scaling exponent. It is important, however, to interpret the comparison between samples carefully. Rather than focusing only on whether one curve lies above the other at a given q , the more meaningful descriptor is the spread of the spectrum across the q -interval. In this sense, the abaxial surface exhibits a larger D q range in magnitude, indicating stronger variation between sparse and dense morphological subsets and, hence, higher multifractal richness. This interpretation corrects a possible ambiguity in the raw sign convention of Table 2: since the reported D q range is written as D q m a x D q m i n , the resulting values are negative by construction; therefore, its absolute magnitude should be used as the relevant measure of spectral spread. Under this criterion, the abaxial surface is clearly more heterogeneous than the adaxial one.
The nonlinear behavior of the mass exponent τ ( q ) , shown in Figure 5c, provides a further confirmation of multifractality. In a monofractal system, τ ( q ) would vary linearly with q , whereas the observed curvature reflects a hierarchy of scaling exponents associated with different subsets of the surface. Mathematically, τ ( q ) is related to the generalized dimensions by τ ( q ) = ( q 1 ) D q , and its derivative defines the singularity strength α ( q ) . Thus, the nonlinearity of τ ( q ) implies that the local scaling properties vary continuously across the surface. The steeper and more curved response found for the abaxial region indicates stronger contrast between low-occupation and high-occupation subsets, consistent with a more intermittent height distribution and a more pronounced multiscale organization. These descriptors jointly provide a rigorous quantitative basis for comparing the structural complexity of leaf surfaces through the lens of scale invariance and singularity theory [52,53].
The quantitative parameters reported in Table 1 and Table 2 reinforce the graphical trends observed in Figure 5. The spectral width Δ α , one of the most widely used descriptors of multifractal heterogeneity, is larger for the abaxial surface, indicating a broader interval of singularity strengths and, therefore, more pronounced spatial variability. A similar conclusion is obtained from the magnitude of the D q range, which is also greater for the abaxial region and reflects stronger scale-dependent differentiation between dominant and rare topographic events. The horizontal asymmetry index H is negative for both surfaces, indicating left-skewed spectra. In multifractal terms, this means that the spectra are more extended toward lower α -values, which is generally associated with the predominance of sharper or more intense singularities. Since the abaxial surface exhibits a more negative H , its topography shows a greater contribution from intense local singularities, consistent with a rougher and more fragmented height field. Likewise, the vertical asymmetry Δ f is more pronounced in the abaxial surface, revealing a stronger imbalance between the two branches of the singularity spectrum and, therefore, a larger disparity between the least and most singular subsets. Altogether, these parameters indicate that the abaxial face displays a more heterogeneous and more complex multifractal structure than the adaxial one.
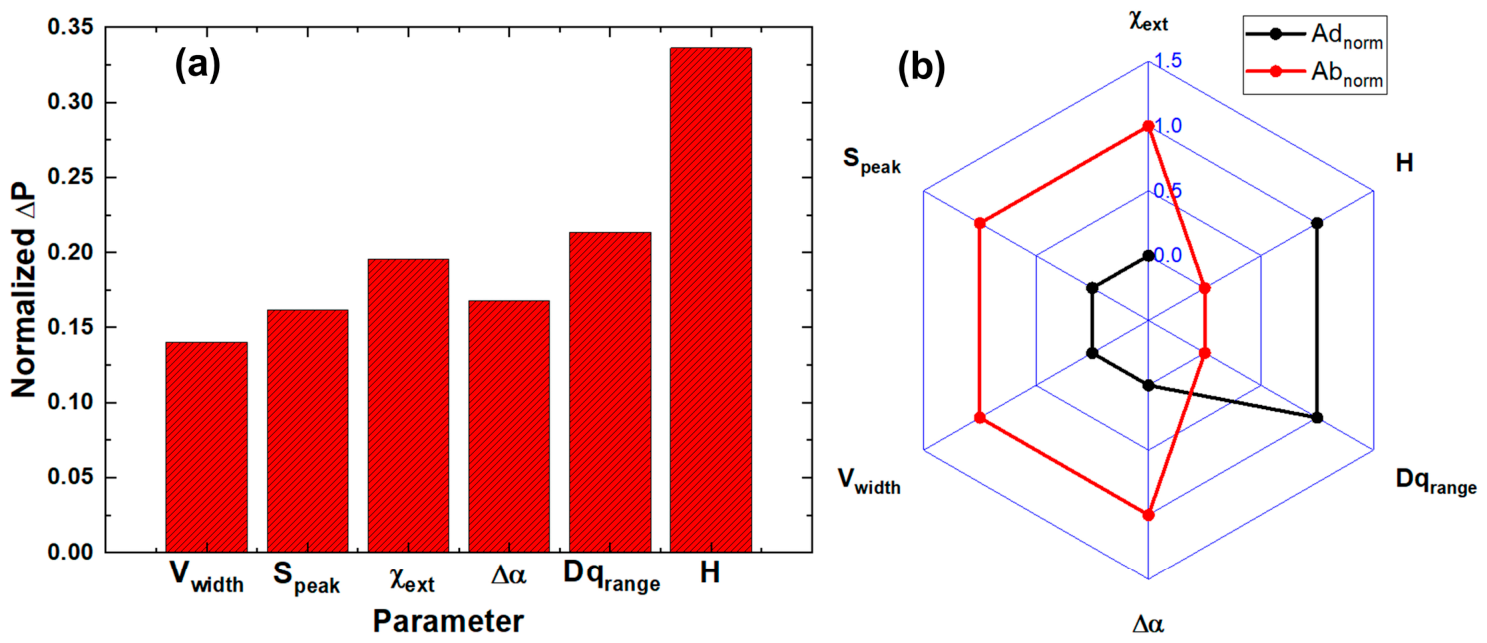
To synthesize these descriptors into a more compact comparative framework, the main multifractal parameters were integrated with topological descriptors derived from the Minkowski analysis, as shown in Figure 6. In Figure 6a, the normalized differential parameter Δ P provides a direct pairwise comparison between the two surfaces. Positive values indicate descriptors for which the abaxial surface exceeds the adaxial one. The uniformly positive values obtained for V w i d t h , S p e a k , χ e x t , and Δ α demonstrate that the abaxial side simultaneously exhibits broader height dispersion, higher interfacial complexity, stronger topological fluctuations, and greater multifractal heterogeneity. The larger normalized contrast associated with D q range further supports the interpretation that the abaxial topography is more hierarchically organized across scales. By contrast, the radar representation in Figure 6b highlights the multidimensional signature of each surface. The abaxial profile expands preferentially along the axes associated with topological fragmentation and heterogeneity, whereas the adaxial surface is relatively more expressed in correlation-related descriptors, consistent with a comparatively smoother and more spatially organized morphology. Together, these two panels c integrate the geometric, topological, and multifractal descriptors into a unified complexity, indicating that the abaxial surface is characterized by greater structural complexity within the multidimensional descriptor space.
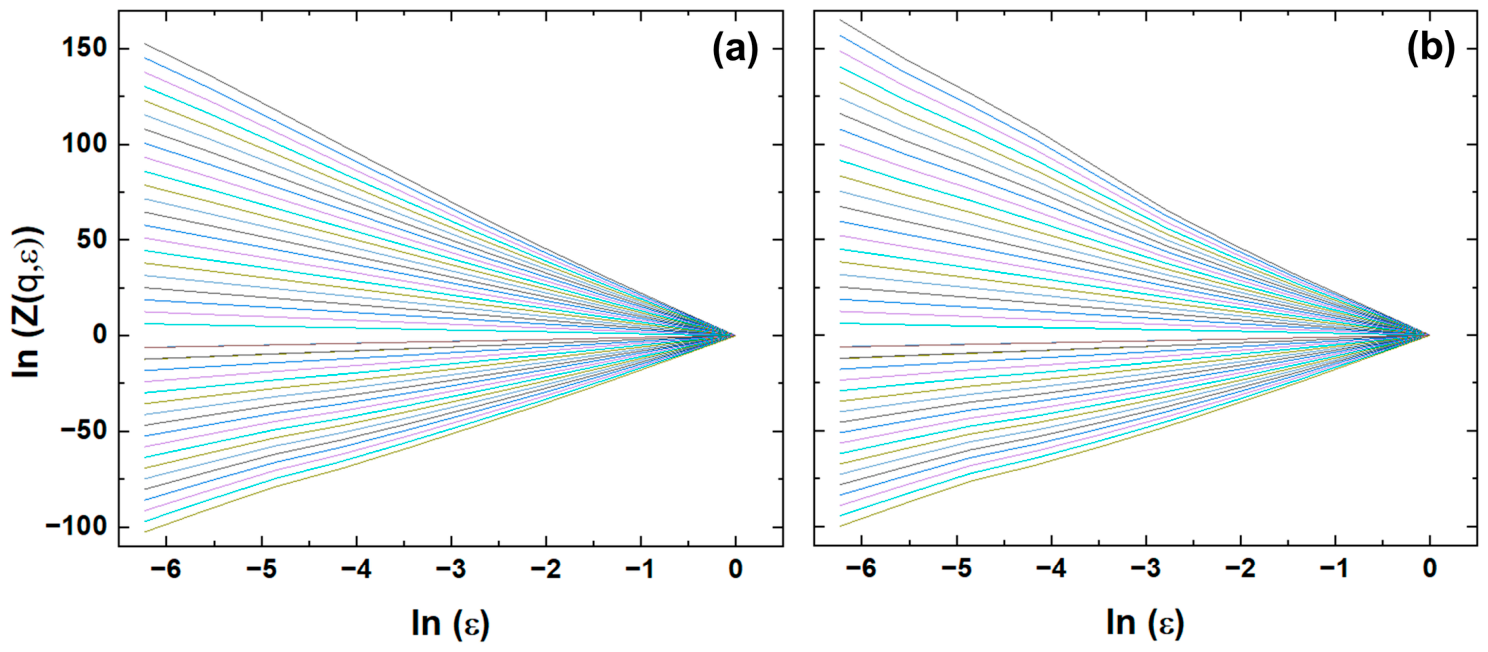
Figure 7 presents the scaling behavior of the partition function Z q ε as ln Z q ε versus ln ε for different moment orders q . The approximately linear behavior observed over the analyzed scale interval confirms the existence of robust power law scaling, supporting the applicability of the multifractal formalism to the LSCM topographies [54]. Positive q -values produce steeper positive slopes because they emphasize regions with higher local measure, whereas negative q -values assign greater weight to sparse or weakly occupied subsets, resulting in negative slopes.
The separation between curves corresponding to different moment orders is slightly more pronounced for the abaxial surface, consistent with its broader singularity spectrum and larger D q range. This agreement between the partition-function scaling, the mass exponent, and the singularity spectrum demonstrates the internal consistency of the multifractal analysis and further supports the interpretation that the abaxial leaf surface exhibits greater scale-dependent morphological heterogeneity.

4. Conclusions

This study presents a unified topological and multifractal framework for the characterization of leaf surface complexity in Theobroma grandiflorum. By combining LSCM-derived three-dimensional profilometry with Minkowski functionals and multifractal analysis, it was possible to quantitatively distinguish the structural organization of adaxial and abaxial surfaces beyond conventional morphological descriptions. The analysis of Minkowski functionals revealed distinct connectivity regimes and threshold-dependent transitions, indicating differences in surface topology and percolation behavior. These findings were further supported by multifractal spectra, which demonstrated a broader distribution of singularities for the abaxial surface, reflecting increased heterogeneity and structural richness. Quantitatively, the abaxial surface exhibited a substantially larger singularity spectrum width (Δα = 0.988 ± 0.067) than the adaxial surface (Δα = 0.704 ± 0.041), together with a greater generalized dimension range (|Dq range| = 0.696 ± 0.052 versus 0.451 ± 0.030), confirming its higher multiscale heterogeneity and structural complexity. The introduction of the normalized differential parameter ΔP proved to be an effective strategy for directly quantifying morphological asymmetry, while radar plots enabled an integrated visualization of multivariate descriptors. From a physical perspective, the observed differences are consistent with the functional specialization commonly attributed to adaxial and abaxial leaf surfaces in the literature. The greater structural complexity observed for the abaxial surface may contribute to processes such as gas exchange and environmental interaction, whereas the comparatively smoother morphology of the adaxial surface is compatible with its protective role proposed in previous studies. Overall, the proposed approach advances the application of fractal and topological methods to biological systems, offering a scalable and transferable framework for quantitative studies in plant morphology and providing a transferable framework that may support future investigations of taxonomy, environmental adaptation, and structure–function relationships in complex biological surfaces.

Author Contributions

G.Q.R., R.S.M., H.D.d.F.F.: conceptualization, methodology, resources, validation, visualization, writing—review and editing. R.C.d.S.F., A.d.S.F., E.F.A.R., M.P.P., C.A.R.C.: data curation, formal analysis, investigation, writing—original draft preparation. G.Q.R., R.S.M., H.D.d.F.F.: writing—original draft preparation, writing—review, project administration. All authors have read and agreed to the published version of the manuscript.

Funding

GQR acknowledges funding support from CNPq Processo 100740/2023-5 and FAPEAM (Edital 011/2025-PRODOC). H.D.d.F.F. acknowledges funding support from CNPq Processo 306210/2022-3 and FAPEAM (EDITAL N. 013/2024-PROIN SOCIAL/FAPEAM (01.02.016301.02128/2025-08)). R.S.M. acknowledges the financial support from the Conselho Nacional de Desenvolvimento Científico e Tecnológico (CNPq), Processo 303365/2024-2.

Data Availability Statement

The data used to support the findings of this study are available from the corresponding author upon request.

Acknowledgments

The authors thank CAPES (Coordenação de Aperfeiçoamento de Pessoal de Nível Superior–Código financeiro 001) for their financial support, as well as the use of the infrastructure of the Analytical Center of Universidade Federal do Amazonas (UFAM) and the infrastructure of Centro Multiusuário para Análise de Fenômenos Biomédicos of Universidade do Estado do Amazonas (CMABio-UEA).

Conflicts of Interest

The authors declare no conflicts of interest.

References

  1. Galvão, J.R.; Oliveira, C.A.M.M.; Viégas, I.J.M.; da Silva Junior, L.E.F.; Tavares, V.H.; Paraense, A.D.L.; Nagase, A.M.M.; Dias, E.L.R. Nutritional Contents of Young Cupuaçu (Theobroma grandiflorum) Plants Subjected to Increasing Copper Doses. Comun. Sci. 2025, 16, e4366. [Google Scholar] [CrossRef]
  2. Pereira, A.L.F.; Abreu, V.K.G.; Rodrigues, S. Cupuassu—Theobroma grandiflorum. In Exotic Fruits; Rodrigues, S., Silva, E.O., de Brito, E.S., Eds.; Academic Press: London, UK, 2018; pp. 159–162. [Google Scholar] [CrossRef]
  3. de Araújo Bezerra, J.; Corrêa, R.F.; Sanches, E.A.; Lamarão, C.V.; Stringheta, P.C.; Martins, E.; Campelo, P.H. “Cupuaçu” (Theobroma grandiflorum): A Brief Review on Chemical and Technological Potential of this Amazonian Fruit. Food Chem. Adv. 2024, 5, 100747. [Google Scholar] [CrossRef]
  4. Acosta-Vega, L.; Martínez-Suárez, J.F.; Sánchez-Garzón, F.S.; Hernández-Carrión, M.; Nerio, L.S. Optimization of the Encapsulation Process of Cupuassu (Theobroma grandiflorum) Pulp by Spray Drying as an Alternative for the Valorization of Amazonian Fruits. LWT 2023, 184, 114994. [Google Scholar] [CrossRef]
  5. Alves, J.L.F.; da Silva, J.C.G.; Mumbach, G.D.; Di Domenico, M.; Bolzan, A.; Machado, R.A.F.; Marangoni, C. Evaluating the Bioenergy Potential of Cupuassu Shell through Pyrolysis Kinetics, Thermodynamic Parameters of Activation, and Evolved Gas Analysis with TG/FTIR Technique. Thermochim. Acta 2022, 711, 179187. [Google Scholar] [CrossRef]
  6. Mendonça, I.M.; Machado, F.L.; Silva, C.C.; Duvoisin Junior, S.; Takeno, M.L.; de Sousa Maia, P.J.; Manzato, L.; de Freitas, F.A. Application of Calcined Waste Cupuaçu (Theobroma grandiflorum) Seeds as a Low-Cost Solid Catalyst in Soybean Oil Ethanolysis: Statistical Optimization. Energy Convers. Manag. 2019, 200, 112095. [Google Scholar] [CrossRef]
  7. da Silva, C.V.A.; Salimo, Z.M.; de Souza, T.A.; Reyes, D.E.; Bassicheto, M.C.; de Medeiros, L.S.; Sartim, M.A.; de Carvalho, J.C.; Gonçalves, J.F.C.; Monteiro, W.M.; et al. Cupuaçu (Theobroma grandiflorum): A Multifunctional Amazonian Fruit with Extensive Benefits. Food Res. Int. 2024, 192, 114729. [Google Scholar] [CrossRef] [PubMed]
  8. de Oliveira, T.B.; Genovese, M.I. Chemical Composition of Cupuassu (Theobroma grandiflorum) and Cocoa (Theobroma cacao) Liquors and Their Effects on Streptozotocin-Induced Diabetic Rats. Food Res. Int. 2013, 51, 929–935. [Google Scholar] [CrossRef]
  9. Ramos, G.Q.; Matos, R.S.; Das, A.; Kumar, S.; Țălu, Ș.; da Fonseca Filho, H.D. Correlating Morphology and Multifractal Spatial Patterns of the Leaf Surface Architecture of Anacardium occidentale L. Fractal Fract. 2022, 6, 320. [Google Scholar] [CrossRef]
  10. Banerjee, S.; He, Y.; Guo, X.; Si, B.C. Spatial Relationships between Leaf Area Index and Topographic Factors in a Semiarid Grassland: Joint Multifractal Analysis. Aust. J. Crop Sci. 2011, 5, 756–763. [Google Scholar]
  11. Selmi, B. The Relative Multifractal Densities: A Review and Application. J. Interdiscip. Math. 2021, 24, 1627–1644. [Google Scholar] [CrossRef]
  12. Douzi, Z.; Selmi, B. A Relative Multifractal Analysis: Box-Dimensions, Densities, and Projections. Quaest. Math. 2022, 45, 1243–1296. [Google Scholar] [CrossRef]
  13. Chen, H.; Chen, H. Parameters of Multifractal Spectrum for Describing Growth State of Soybean Leaves. Fractals 2018, 26, 1850090. [Google Scholar] [CrossRef]
  14. Grasman, J.; Brascamp, J.W.; van Leeuwen, J.L.; van Putten, B. The Multifractal Structure of Arterial Trees. J. Theor. Biol. 2003, 220, 75–82. [Google Scholar] [CrossRef] [PubMed]
  15. Wang, F.; Liao, D.-W.; Li, J.-W.; Liao, G.-P. Two-Dimensional Multifractal Detrended Fluctuation Analysis for Plant Identification. Plant Methods 2015, 11, 12. [Google Scholar] [CrossRef] [PubMed]
  16. Wang, F.; Zou, R.-B.; Liao, G.-P.; Li, J.-W.; Liu, Z.-Q. Local Multifractal Detrended Fluctuation Analysis for Tea Breeds Identification. Int. J. Biomath. 2014, 7, 1450048. [Google Scholar] [CrossRef]
  17. Li, J.-H.; Wang, F.; Li, J.-W.; Zou, R.-B.; Liao, G.-P. Multifractal Methods for Rapeseed Nitrogen Nutrition Qualitative Diagnosis Modeling. Int. J. Biomath. 2016, 9, 1650064. [Google Scholar] [CrossRef]
  18. Li, L.; Chang, L.; Ke, S.; Huang, D. Multifractal Analysis and Lacunarity Analysis: A Promising Method for the Automated Assessment of Muskmelon (Cucumis melo L.) Epidermis Netting. Comput. Electron. Agric. 2012, 88, 72–84. [Google Scholar] [CrossRef]
  19. Li, Y.; Xia, C.; Lee, J. Detection of Small-Sized Insect Pest in Greenhouses Based on Multifractal Analysis. Optik 2015, 126, 2138–2143. [Google Scholar] [CrossRef]
  20. Zafar, Z.U.A.; Shah, Z.; Ali, N.; Alzahrani, E.O.; Shutaywi, M. Mathematical and Stability Analysis of Fractional Order Model for Spread of Pests in Tea Plants. Fractals 2021, 29, 2150008. [Google Scholar] [CrossRef]
  21. Chávez, P.; Yarlequé, C.; Piro, O.; Posadas, A.; Mares, V.; Loayza, H.; Chuquillanqui, C.; Zorogastúa, P.; Flexas, J.; Quiroz, R. Applying Multifractal Analysis to Remotely Sensed Data for Assessing PYVV Infection in Potato (Solanum tuberosum L.) Crops. Remote Sens. 2010, 2, 1197–1216. [Google Scholar] [CrossRef]
  22. Boelens, A.M.P.; Tchelepi, H.A. QuantImPy: Minkowski Functionals and Functions with Python. SoftwareX 2021, 16, 100823. [Google Scholar] [CrossRef]
  23. Ghaderi, A.; Sabbaghzadeh, J.; Dejam, L.; Behzadi Pour, G.; Moghimi, E.; Matos, R.S.; da Fonseca Filho, H.D.; Țălu, Ș.; Salehi Shayegan, A.; Fekri Aval, L.; et al. Nanoscale Morphology, Optical Dynamics and Gas Sensor of Porous Silicon. Sci. Rep. 2024, 14, 3677. [Google Scholar] [CrossRef] [PubMed]
  24. Pinto, L.C.C.; Ramos, G.Q.; Matos, R.S.; Santana, R.A.G.; Justiniano, S.C.B.; da Fonseca Filho, H.D. Wing Morphology Analysis of Anopheles Mosquitoes Using Scanning Electron Microscopy and Minkowski Functionals for Species Distinction. J. Basic Appl. Zool. 2025, 86, 75. [Google Scholar] [CrossRef]
  25. Nečas, D.; Klapetek, P. Gwyddion: An Open-Source Software for SPM Data Analysis. Cent. Eur. J. Phys. 2012, 10, 181–188. [Google Scholar] [CrossRef]
  26. ISO 25178-2:2021; Geometrical Product Specifications (GPS)—Surface Texture: Areal—Part 2: Terms, Definitions and Surface Texture Parameters. ISO: Geneva, Switzerland, 2021. Available online: https://www.iso.org/standard/74591.html (accessed on 10 May 2026).
  27. Leach, R. (Ed.) Characterisation of Areal Surface Texture; Springer: Berlin/Heidelberg, Germany, 2013. [Google Scholar] [CrossRef]
  28. Țălu, Ș.; Stach, S.; Ghodselahi, T.; Ghaderi, A.; Solaymani, S.; Boochani, A.; Garczyk, Ż. Topographic Characterization of Cu–Ni NPs @ a-C:H Films by AFM and Multifractal Analysis. J. Phys. Chem. B 2015, 119, 5662–5670. [Google Scholar] [CrossRef] [PubMed]
  29. Salat, H.; Murcio, R.; Arcaute, E. Multifractal Methodology. Phys. A 2017, 473, 467–487. [Google Scholar] [CrossRef]
  30. Barabási, A.-L.; Vicsek, T. Multifractality of Self-Affine Fractals. Phys. Rev. A 1991, 44, 2730–2733. [Google Scholar] [CrossRef] [PubMed]
  31. Chhabra, A.; Jensen, R.V. Direct Determination of the f(α) Singularity Spectrum. Phys. Rev. Lett. 1989, 62, 1327–1330. [Google Scholar] [CrossRef] [PubMed]
  32. Hentschel, H.G.E.; Procaccia, I. The Infinite Number of Generalized Dimensions of Fractals and Strange Attractors. Phys. D 1983, 8, 435–444. [Google Scholar] [CrossRef]
  33. Muller, J.; McCauley, J.L. Implication of Fractal Geometry for Fluid Flow Properties of Sedimentary Rocks. Transp. Porous Media 1992, 8, 133–147. [Google Scholar] [CrossRef]
  34. Posadas, A.N.D.; Giménez, D.; Quiroz, R.; Protz, R. Multifractal Characterization of Soil Pore Systems. Soil Sci. Soc. Am. J. 2003, 67, 1361–1369. [Google Scholar] [CrossRef]
  35. Guan, M.; Liu, X.; Jin, Z.; Lai, J. The Heterogeneity of Pore Structure in Lacustrine Shales: Insights from Multifractal Analysis Using N2 Adsorption and Mercury Intrusion. Mar. Pet. Geol. 2020, 114, 104150. [Google Scholar] [CrossRef]
  36. San José Martínez, F.; Martín, M.A.; Caniego, F.J.; Tuller, M.; Guber, A.; Pachepsky, Y.; García-Gutiérrez, C. Multifractal Analysis of Discretized X-Ray CT Images for the Characterization of Soil Macropore Structures. Geoderma 2010, 156, 32–42. [Google Scholar] [CrossRef]
  37. Heredia, A.; Benítez, J.J.; González Moreno, A.; Domínguez, E. Revisiting Plant Cuticle Biophysics. New Phytol. 2024, 244, 65–73. [Google Scholar] [CrossRef] [PubMed]
  38. González-Valenzuela, L.; Renard, J.; Depège-Fargeix, N.; Ingram, G. The Plant Cuticle. Curr. Biol. 2023, 33, R210–R214. [Google Scholar] [CrossRef] [PubMed]
  39. Ossola, R.; Farmer, D.K. The Chemical Landscape of Leaf Surfaces and Its Interaction with the Atmosphere. Chem. Rev. 2024, 124, 5764–5794. [Google Scholar] [CrossRef] [PubMed]
  40. Victório, C.P.; Alves, G.T.; Simas, N.K.; de Oliveira Arruda, R.D.C. Epicuticular Wax of Red Mangrove Leaves from an Urban Bay: Chemical Composition and Micromorphology. Biochem. Syst. Ecol. 2025, 119, 104942. [Google Scholar] [CrossRef]
  41. Salerno, M.; Banzato, M. Minkowski Measures for Image Analysis in Scanning Probe Microscopy. Microsc. Anal. 2005, 19, 13–15. [Google Scholar]
  42. da Conceição, W.S.; Țălu, Ș.; Matos, R.S.; Ramos, G.Q.; Zayas, F.G.; da Fonseca Filho, H.D. Stereometric Characterization of Dinizia excelsa Ducke Wood from Amazon Rainforest Using Atomic Force Microscopy. Microsc. Res. Tech. 2021, 84, 1431–1441. [Google Scholar] [CrossRef] [PubMed]
  43. Ramos, G.Q.; da Costa Melo, I.; Matos, R.S.; Pinto, E.P.; Pires, M.A.; Sanches, E.A.; da Fonseca Filho, H.D. SEM-Imaging-Based Mapping of Monofractal and Multifractal Patterns of the Piper krukoffii Yunck Leaf Surface Architecture. Flora 2023, 306, 152355. [Google Scholar] [CrossRef]
  44. Ramos, G.Q.; de Souza, C.C.; Lira, V.C.C.; de Souza-Cavalcante, L.; Matos, R.S.; Zayas, F.G.; da Fonseca Filho, H.D. Elucidating the Fractality of Amazon Dinizia excelsa Ducke Wood Surfaces by Scanning Electron Microscopy. J. Indian Acad. Wood Sci. 2025, 22, 205–217. [Google Scholar] [CrossRef]
  45. Sadeghi, M.; Zelati, A.; Rezaee, S.; Luna, C.; Matos, R.; Pires, M.; Ferreira, N.; da Fonseca Filho, H.; Ahmadpourian, A.; Țălu, Ș. Evaluating the Topological Surface Properties of Cu/Cr Thin Films Using 3D Atomic Force Microscopy Topographical Maps. Coatings 2022, 12, 1364. [Google Scholar] [CrossRef]
  46. Vasconcelos, H.C.; Eleutério, T.; Meirelles, M.; Özmenteş, R. When a Surface Becomes a Network: SEM Reveals Hidden Scaling Laws and a Percolation-like Transition in Thin Films. Surfaces 2026, 9, 14. [Google Scholar] [CrossRef]
  47. Yadav, R.P.; Dwivedi, S.; Mittal, A.K.; Kumar, M.; Pandey, A.C. Fractal and Multifractal Analysis of LiF Thin Film Surface. Appl. Surf. Sci. 2012, 261, 547–553. [Google Scholar] [CrossRef]
  48. Paz-Ferreiro, J.; Vázquez, E.V.; Miranda, J.G.V. Assessing Soil Particle-Size Distribution on Experimental Plots with Similar Texture under Different Management Systems Using Multifractal Parameters. Geoderma 2010, 160, 47–56. [Google Scholar] [CrossRef]
  49. Ramazanov, S.; Orudzhev, F.; Gajiev, G.; Holcman, V.; Matos, R.S.; da Fonseca Filho, H.D.; Țălu, Ș.; Selimov, D. Local Electrical Characteristic of Memristor Structure in a High-Resistance State Obtained Using Electrostatic Force Microscopy: Fractal and Multifractal Dynamics of Surface. Appl. Surf. Sci. 2024, 647, 158863. [Google Scholar] [CrossRef]
  50. Torre, I.G.; Heck, R.J.; Tarquis, A.M. MULTIFRAC: An ImageJ Plugin for Multiscale Characterization of 2D and 3D Stack Images. SoftwareX 2020, 12, 100574. [Google Scholar] [CrossRef]
  51. Rueden, C.T.; Schindelin, J.; Hiner, M.C.; DeZonia, B.E.; Walter, A.E.; Arena, E.T.; Eliceiri, K.W. ImageJ2: ImageJ for the Next Generation of Scientific Image Data. BMC Bioinform. 2017, 18, 529. [Google Scholar] [CrossRef] [PubMed]
  52. Grayeli, A.; Sadeghi, M.; Shakoury, R.; Matos, R.S.; da Fonseca Filho, H.D.; Arman, A. Structural, Morphological, and Optical Bandgap Properties of ZnS Thin Films: A Case Study on Thickness Dependence. Opt. Quantum Electron. 2024, 56, 1142. [Google Scholar] [CrossRef]
  53. Matos, R.S.; Pinto, E.P.; Pires, M.A.; Ramos, G.Q.; Țălu, Ș.; Lima, L.S.; da Fonseca Filho, H.D. Evaluating the Roughness Dynamics of Kefir Biofilms Grown on Amazon Cupuaçu Juice: A Monofractal and Multifractal Approach. Microscopy 2024, 73, 55–65. [Google Scholar] [CrossRef] [PubMed]
  54. Ghosh, K.; Pandey, R.K. Fractal and Multifractal Analysis of In-Doped ZnO Thin Films Deposited on Glass, ITO, and Silicon Substrates. Appl. Phys. A Mater. Sci. Process. 2019, 125, 98. [Google Scholar] [CrossRef]
Figure 1. Representative photographs of Theobroma grandiflorum leaves showing the two analyzed surfaces: (a) adaxial surface (Cupu_Ad) and (b) abaxial surface (Cupu_Ab). The evident macroscopic morphological differences between these surfaces provide the biological basis for the quantitative multiscale characterization performed using laser scanning confocal microscopy (LSCM), Minkowski functionals, and multifractal analysis.
Fractalfract 10 00535 g001
Figure 2. Multiscale morphology of Theobroma grandiflorum leaf surfaces. Left panels (ac): adaxial surface (Cupu_Ad). (a) OM, (b) OM + laser, (c) SEM. Right panels (df): abaxial surface (Cupu_Ab). (d) OM, (e) OM + laser, (f) SEM. The adaxial surface appears smoother and more homogeneous, whereas the abaxial surface shows higher roughness and structural heterogeneity.
Fractalfract 10 00535 g002
Figure 3. Two-dimensional (2D) and three-dimensional (3D) surface topography of Theobroma grandiflorum leaves obtained by laser scanning confocal microscopy: (a) adaxial surface (Cupu_Ad) and (b) abaxial surface (Cupu_Ab). The color scale represents height variations, highlighting the smoother and more uniform topography of the adaxial surface in contrast to the higher roughness amplitude and spatial heterogeneity observed on the abaxial surface.
Fractalfract 10 00535 g003
Figure 4. The MFs of three-dimensional LSCM surface maps on adaxial and abaxial surfaces for (a) Minkowski volume, (b) Minkowski boundary, and (c) Minkowski connectivity.
Fractalfract 10 00535 g004
Figure 5. Multifractal characterization of adaxial and abaxial leaf surfaces obtained from LSCM topographical maps: (a) singularity spectrum f(α), (b) generalized dimensions Dq, and (c) mass exponent τ(q).
Fractalfract 10 00535 g005
Figure 6. (a) Normalized differential parameters (ΔP) between adaxial and abaxial surfaces. (b) Radar plot of normalized descriptors highlighting the multidimensional structural differences.
Fractalfract 10 00535 g006
Figure 7. Double-logarithmic plots of the partition function Z ( q , ε ) for different moment orders q , calculated from the three-dimensional LSCM topographies of (a) Cupu_Ad and (b) Cupu_Ab. Linear scaling behavior supports the applicability of multifractal formalism and the extraction of the mass exponent τ ( q ) .
Fractalfract 10 00535 g007
Table 1. Multifractal parameters extracted from LSCM three-dimensional surface topographies of adaxial and abaxial surfaces. Parameters include the most probable singularity (α0), generalized dimensions (D0, D1, D2), vertical asymmetry (Δf), and singularity strengths (αmin, αmax).
Samples
ParametersCupu_AdCupu_Ab
α0 *2.018 ± 0.0012.033 ± 0.002
α1 *1.980 ± 0.0021.963 ± 0.004
α2 *1.925 ± 0.0081.867 ± 0.016
αmax *1.744 ± 0.0201.696 ± 0.028
αmin *2.448 ± 0.0362.684 ± 0.061
f02.000 ± 0.0002.000 ± 0.000
f1 *1.980 ± 0.0021.963 ± 0.004
f2 *1.895 ± 0.0121.818 ± 0.023
f(αmax)1.240 ± 0.0831.256 ± 0.059
f(αmin) 0.279 ± 0.1190.011 ± 0.152
Δf * −0.961 ± 0.145−1.521 ± 0.175
D02.000 ± 0.0002.000 ± 0.000
D1 *1.980 ± 0.0041.963 ± 0.004
D2 *1.954 ± 0.0051.917 ± 0.010
Values are expressed as mean ± standard deviation (SD). (*) indicates a statistically significant difference between the adaxial and abaxial surfaces according to Student’s t-test (p < 0.05).
Table 2. Summary of morphological and spectrum width (Δα), horizontal skewness (H), and generalized dimension range (Dqmax–Dqmin) multifractal descriptors for the adaxial and abaxial leaf surfaces.
Surface Morphology (SEM/Perfilometry)Δα *HDq Range *Assigned Complexity
Cupu_AdRelatively smooth, compact, and peak-dominated surface with moderate roughness amplitude and higher spatial correlation0.704 ± 0.041−0.156 ± 0.237−0.451 ± 0.030Moderately complex, with higher structural correlation and lower multiscale heterogeneity
Cupu_AbHeterogeneous and irregular surface with broader height distribution, increased roughness amplitude, and pronounced topological fragmentation0.988 ± 0.067−0.314 ± 0.299−0.696 ± 0.052Highly complex, characterized by enhanced multiscale heterogeneity and topological fragmentation
Values are expressed as mean ± standard deviation (SD). (*) indicates a statistically significant difference between the adaxial and abaxial surfaces according to Student’s t-test (p < 0.05).
Disclaimer/Publisher’s Note: The statements, opinions and data contained in all publications are solely those of the individual author(s) and contributor(s) and not of MDPI and/or the editor(s). MDPI and/or the editor(s) disclaim responsibility for any injury to people or property resulting from any ideas, methods, instructions or products referred to in the content.