Article

Asymmetric Multifractal Efficiency in Global Trade-Related Markets: Evidence from Oil, Freight and Exchange Rate Dynamics


1
School of Business Administration, Wuhan Business University, Wuhan 430056, China
2
School of Public Administration, Zhongnan University of Economics and Law, Wuhan 430073, China
*
Author to whom correspondence should be addressed.
Fractal Fract. 2026, 10(7), 463; https://doi.org/10.3390/fractalfract10070463
Submission received: 25 May 2026 / Revised: 30 June 2026 / Accepted: 7 July 2026 / Published: 10 July 2026

Abstract

The paper examines the multifractal and asymmetric behavior of oil, freight and exchange rate markets in the global trade system with the help of the Asymmetric Multifractal Detrended Fluctuation Analysis (AMF-DFA) technique. Based on daily data of West Texas Intermediate (WTI) crude oil, the Baltic Dry Index (BDI), and the exchange rate between the RMB/USD over the period of post-COVID-19 (2021–2024), the analysis focuses on whether efficiency in the markets varies across time scales and directional regimes. The findings show that there is strong evidence of multifractality in all markets, which implies that the scaling behavior is heterogeneous, and that it is long-range-dependent. Notable directional persistence is found between up and down movements with oil and exchange rate markets showing stronger directional persistence, especially at longer horizons with the freight markets displaying relatively weaker directional persistence. Additional results imply that temporal dependence and nonlinearity are the main drivers of multifractality in oil and exchange rate markets, and short-term fluctuations are prevalent factors in the dynamics of the freight market. These findings not only refute the classical Efficient Market Hypothesis but also provide empirical evidence in support of the Adaptive Market Hypothesis, and how efficiency is dynamic, dependent on scale, and directionally asymmetric. The study contributes by examining asymmetric multifractal efficiency across three trading markets during the post-COVID period, while recognizing that formal cross-market spillover analysis remains a direction for future research.

1. Introduction

Interaction of energy markets, trade networks and currency systems increases the dependency of the functioning of the global economy. Oil prices, freight rates and exchange rates are some of these which play a central role in the transmission mechanism through which shocks are transmitted across countries and sectors. The cost of production and transportation, the price changes in real time due to the global supply chains, the cost of the trade in terms of its competitiveness and price adjustments are determined by exchange rates. These markets do not develop in isolation, but instead, they are a complex network where vibrations in one part are passed, increased or decreased through others. Recent world events, such as post-pandemic disruptions in supply chains, geopolitical tensions, and nonlinear, delayed, and often asymmetric adjustment processes, have increased these linkages and exposed adjustment processes that are nonlinear, delayed, and often asymmetric.
Conventional ways of observing market behavior are based on the Efficient Market Hypothesis (EMH) that assumes that market prices are instantaneously and fully informed. In this model, the returns are randomly distributed, and there cannot be any systematic dependence and predictability. But there is an increasing amount of empirical data that proves this assumption wrong by reporting long-memory, volatility clustering, and nonlinear dependence structures in the financial and commodity market (Cont, 2001; Di Matteo, 2007) [1,2]. These idealized features refer to the reality that information is not implemented in a single fell swoop but there are distortions that may be made as far as the strict concept of efficiency is concerned.
Therefore, to avoid these constraints, the Adaptive Market Hypothesis (AMH) is used, and as per this model market efficiency is not a fixed state, or a fixed process, but is rather a dynamic process that will vary with the changing market environments, institutional structures and behavioral factors (Lo, 2004) [3]. Under AMH, the markets can be characterized by alternation between the period of relative efficiency and inefficiency, depending on the competition, learning and the external shocks. Notably, this framework suggests that there are no consistent levels of efficiency existing or not, but instead efficiency could vary across time scales and market conditions. Persistence, asymmetry and nonlinear dependence are not exceptions to the rule, but natural consequences of an adaptive system that is in response to changes in information flows.
The latter point of view is more applicable when it comes to examining markets that are structurally interconnected, because of global trade. The market of oil, freight and exchange rates constitute a circular transmission system where the shocks are in a constant flow of transmission and transformation. Oil price changes have impacts on transportation costs, which spread the impacts of changes across economies, and which are mediated by exchange rates. The effects of feedback are typical where changes in trade flows, as well as currency values, can then induce changes in the energy demand and shipping markets. Therefore, efficiency cannot be evaluated just on the level of single markets but rather the way the information is processed in this interconnected system. Hence with adaptive markets they are supposed to be efficient not only over time but also when the magnitude of fluctuations is varied as well as the directional regimes.
This perspective is supported by recent empirical works which have reported time-varying relationships and asymmetries in the correlation between energy and financial markets. As an example, Reboredo (2012) demonstrates that the nonlinear and time-varying dependence between oil prices and exchange rates exists especially during stress periods [4]. Mensi et al. (2017) and Tiwari et al. (2016) also prove that financial and commodity markets are more likely to be more persistent and less efficient during turbulent times [5,6]. Bakshi et al. (2010) point out in the context of freight markets that they are sensitive to changes in the global economies implying that shipping indices are forward-looking in terms of information on the dynamics of trade [7]. More recent studies in multifractal finance suggest that such markets have heterogeneous scaling behavior, which implies that dependence structures vary across time horizons and sizes of the fluctuations (Barunik and Kristoufek, 2010; Jiang et al., 2019; Wan et al., 2025) [8,9,10].
Although these developments have taken place, there are two crucial limitations. First, a lot of the literature still considers the efficiency of being measured using linear or single-scale methods, which do not reflect the heterogeneous and scale-dependent nature of real-world market dynamics. Second, although asymmetry is becoming a widely recognized characteristic of financial markets, to date there are relatively few studies that explicitly introduce the aspect of directional differences into the analysis of scaling behavior. This is especially applicable when it comes to the markets associated with global trade where both positive and negative shocks can have fundamentally different economic effects due to factors such as the rigidity of demand, constraints on supply and policy interventions.
To solve these problems, this paper will use Asymmetric Multifractal Detrended Fluctuation Analysis to test the scaling properties and efficiency of oil, freight and exchange rate markets. In contrast to common multifractal methods, AMF-DFA can be used to separate positive and negative fluctuations in persistence and complexity, thus making it possible to measure directional asymmetry in persistence and complexity. This is especially crucial to test the implications of the Adaptive Market Hypothesis as it allows determining time-varying and regime-dependent efficiency across the varying magnitudes of fluctuations.
Therefore, using AMF-DFA daily data of WTI crude oil, the Baltic Dry Index and the RMB/USD exchange rate over the post-COVID-19 period, this work presents an in-depth analysis of multifractality, asymmetry, and scale-dependent efficiency. The analysis is based on the three following aspects: (i) existence of multifractal scaling behavior, (ii) the degree of asymmetry between upward and downward swings, and (iii) the sources of multifractality, such as long-range dependence and nonlinear structures. Further, by doing so, the study directly relates empirical evidence to the adaptive perspective of market efficiency, and how persistence and asymmetry become endogenous features of the changing market systems.
This study has three main contributions. First, it provides evidence on the multifractal and asymmetric characteristics of three trading markets under a comparable AMF-DFA framework, highlighting the importance of scale-dependent efficiency. Second, it provides an empirical confirmation of the Adaptive Market Hypothesis, showing that efficiency is variable across the level of fluctuations, and across the regime of directional fluctuations. Third, it helps to add to the expanding literature on complex financial systems by demonstrating that oil, freight, and exchange rate markets exhibit persistence and asymmetry in their dynamic behavior that is reflective of their interconnectedness in the global economy.

2. Literature Review and Supporting Theory

2.1. Literature Review

The empirical characterization of financial markets and commodity markets has been gradually moving away from a linear stochastic framework towards approaches which are able to capture complex scaling behavior, long-range dependence, nonlinear dynamics and time-varying efficiency. The classical Efficient Market Hypothesis postulates that the price of an asset reflects the readily available information, and the price of the asset swiftly and completely includes that information (Fama, 1970) [11]. However, there is a substantial body of empirical evidence indicating that financial and commodity returns exhibit excessive kurtosis, volatility clustering and long memory (Cont, 2001; Lo, 2004) [1,3]. In reaction, the Adaptive Market Hypothesis suggests that efficiency changes over time as a function of the changing market conditions, the institutional structures, and behavioral adaptation (Lo, 2004; Urquhart and Hudson, 2013; Noda, 2016) [3,12,13]. In globally interconnected markets like oil, freight and exchange rates this adaptive perspective is more applicable, where information transmission is influenced by geopolitical risks, trade imbalances and macroeconomic shocks.
In this respect, the concept of multifractal analysis has become the focus of methodological approaches in the reassessment of market efficiency. In contrast to the traditional models, which require uniform homogeneous behavior over time horizons, multifractal models permit heterogeneous scaling behavior, which is reflective of the concomitant existence of multiple processes operating in parallel over time. This view is consistent with the conceptualization of financial markets as complex adaptive systems that are characterized by self-similarity, hierarchical organization and changing dependence structures (Mandelbrot, 1997; Kantelhardt et al., 2002) [14,15]. A more common method of identifying long-range dependence and multifractality in the nonstationary time series is Multifractal Detrended Fluctuation Analysis (MF-DFA), introduced by Kantelhardt et al. (2002) [15].
A large amount of literature utilizing the MF-DFA method exists, and this method tests the existence of multifractality in financial, commodity and energy markets. Initial studies have revealed that multifractal behavior occurs due to a combination of long-range temporal correlations and the heavy-tailed distribution of returns (Di Matteo, 2007; Barunik and Krištoufek, 2010) [2,8]. The findings in stock markets and exchange rates and energy markets show that financial systems exhibit scale-dependent inefficiencies, especially during periods of market turbulence (Jiang et al., 2019; Kristoufek, 2012) [9,16]. Multifractality in crude oil markets has been well documented with the literature showing that oil prices are long-memory and nonlinear dependence structures which vary with time horizons (Tabak and Cajueiro, 2007; He and Chen, 2010) [17,18]. These results imply that the information about market inefficiency is intrinsic in the data-generating process, as opposed to being fully irregular.
Recent research also suggests an increase in multifractality at times of crisis, structural change and increased uncertainty. Market dynamics have changed quite significantly due to the COVID-19 pandemic, geopolitical conflicts and supply chain disruptions (Mensi et al., 2017; Mensi et al., 2020; Kumeka et al., 2022) [5,19,20]. In the same line, the impact of inflationary pressures in the world and shocks in shipping costs have also contributed to greater volatility and structural instability in the financial and commodity markets (Carriere-Swallow et al., 2022) [21]. These results support the Adaptive Market Hypothesis by indicating that market efficiency is time- and economy-dependent.
A significant development in this literature would be the contribution of asymmetry to multifractal dynamics. Normal MF-DFA is a scaling behavior that is symmetric about both negative and positive shocks. But financial and commodity markets tend to have different responses to negative and positive shocks. It is common to find that downward movements are usually linked to stronger volatility, increased persistence and more complex dependence structures due to behavioral factors like loss aversion and liquidity constraints. Therefore, to address this limitation, an asymmetric extension of MF-DFA model has been used. This model permits scaling behavior to be assessed distinctly when placed under downwards and upwards trends. It has been observed from some past empirical literature that any change either positive or negative has multifractal properties which are scale-dependent and time-varying (Alvarez-Ramirez et al., 2008; Cajueiro and Tabak, 2004, Jiang et al., 2019; Mensi et al., 2020) [9,19,22,23]. It has links with different markets such as exchange rates and oil prices where the economic impact of price increment is different from drops in price.
Price movements in energy markets are influenced by the key factor which is asymmetrical. The increases in oil prices are likely to be strongly propagated through the cost of production, the cost of transportation and inflation. But the decrease in oil prices does not necessarily propagate symmetrically through the cost of production, the cost of transportation and inflation. Empirical evidence indicates that crude oil markets vary efficiently with time, and are multifractal and nonlinear in response to supply and demand shocks (Tabak and Cajueiro, 2007; He and Chen, 2010; Mensi et al., 2020) [17,18,19]. More current evidence also suggests that geopolitical uncertainty and structural disturbances increase inefficiencies and persistence in oil markets (Xu et al., 2026) [24]. Such results indicate that asymmetric multifractal models are more suitable to understand the dynamics of oil prices compared to traditional symmetric models.
Another relationship that has been given much focus in the literature is that of oil prices and exchange rates. Oil prices have an impact on exchange rates via balance of trade, inflationary effects, capital movements and monetary policy linkages and exchange rates have an impact on the purchasing power of the economies that import oil. Evidence suggests that oil prices and exchange rates have nonlinear and time-varying dependence, especially during periods of stress in the market (Reboredo, 2012) [4]. Additional studies show that oil prices can be used to forecast exchange rate movements, particularly in the short term (Ferraro et al., 2015) [25], and dynamic dependence and extreme risk spillovers between oil and currency markets as well have been reported (Ji et al., 2019) [26]. These results suggest that exchange rates are highly correlated with the energy market and are to be analyzed within a more macro-financial context.
Freight markets can be seen to offer another aspect of the global trade system. The Baltic Dry Index is a popular proxy of world shipping demand and trade. As empirical evidence indicates, freight rates are indicative of cyclical and capacity-related adjustments of global trade. They may be used to give forward-looking information about economic conditions (Bakshi et al., 2010) [7]. Recent literature also indicates that freight rates relate to exchange rate dynamics and global financial markets, which means that shipping costs are also an important factor in the transmission of economic shocks (Han et al., 2020) [27]. The COVID-19 pandemic also highlighted the importance of freight markets since disruptions in supply chains and congestion at ports sharply increased the shipping costs and had extensive spillovers to inflation and trade processes (UNCTAD, 2021; Carrière-Swallow et al., 2023) [21,28].
Even more recent studies support the intertwined nature of oil, freight and exchange rate markets. It has been found that disruptions in global trade, energy price shocks and shipping restrictions interact in complex ways to generate nonlinear and time-varying relationships across these markets (Pulido, 2023; Khan et al., 2025) [29,30]. Such interactions confirm the need to have analytical frameworks that can capture the complexity as well as the directional dependency of market dynamics. Multifractal and asymmetric methods are more specifically adapted to this aim, as they can be used to analyze heterogeneous scaling behavior over different time scales and magnitudes of fluctuations.
Although these have been developed, there are some gaps in the literature. First, although multifractal techniques have been extensively used to analyze individual markets, there has been a relative lack of interest in trading markets as an interconnected system comprising oil, freight and exchange rates. Second, there is still a lot of research that follows symmetric modeling structures and therefore such studies might not capture the key differences between upward and downward dynamics. Third, the post-pandemic period is not yet explored in terms of asymmetric multifractal analysis, although there have been significant structural changes in global markets. These gaps are what point to an integrated framework that can capture scale-dependent efficiency, directional asymmetry and cross-market complexity.
This paper fills these gaps by using Asymmetric Multifractal Detrended Fluctuation Analysis to analyze the scaling characteristics of oil, freight and exchange rate markets. The study offers new perspectives on the nature of market efficiency in the changing global environment by concentrating on asymmetric and multifractal properties. This way, it adds to the body of literature in that it shows that efficiency is dynamic in nature, scale-dependent and directionally asymmetric, because of the complex interaction of forces of demand and supply in the world trade systems.

2.2. Supporting Theory

This section develops the theoretical foundation for the empirical analysis by linking the behavior of oil prices, freight rates and exchange rates to the asymmetric multifractal framework used in this study. The objective is not to repeat the literature review, but to clarify the theoretical mechanisms through which these markets may exhibit scale dependence, nonlinear adjustment, persistence and directional asymmetry. These mechanisms provide the basis for applying AMF-DFA to examine whether market efficiency varies across time scales and upward/downward market regimes.

2.2.1. Oil Market Dynamics Model

Oil price dynamics can be explained through a combination of supply–demand theory, storage-based commodity pricing, geopolitical risk transmission and financial market behavior. In conventional commodity market theory, oil prices respond to changes in production, inventories, spare capacity, transportation demand and global economic activity. Since oil is both a physical input and a financialized commodity, its price is also affected by expectations, exchange rate movements, interest rates, speculative demand and risk sentiment. This means that oil price behavior is unlikely to follow a purely linear adjustment path.
From the perspective of market efficiency, the Efficient Market Hypothesis suggests that oil prices should rapidly incorporate available information, leaving little scope for systematic predictability (Fama, 1970) [11]. However, commodity and financial returns often display volatility clustering, fat tails, persistence and nonlinear dependence, which contradict the assumptions of simple random-walk behavior (Cont, 2001; Di Matteo, 2007) [1,2]. The Adaptive Market Hypothesis provides a more flexible explanation by suggesting that efficiency changes across market conditions as traders, institutions and information flows adapt over time (Lo, 2004) [3]. This is particularly relevant for oil markets, where supply shocks, geopolitical tensions and demand uncertainty may create periods of temporary inefficiency and long-memory behavior.
The main variables in oil market modeling include crude oil prices, supply conditions, inventory levels, global demand, industrial activity, exchange rates, inflationary pressure, geopolitical risk and financial market uncertainty. In this study, WTI crude oil is used as the proxy for the oil market because it is a widely used benchmark for global crude oil pricing. Theoretically, WTI is relevant because changes in oil prices influence production costs, transportation costs, inflation, trade balances and currency market expectations. Therefore, if oil markets process information asymmetrically, positive and negative oil price movements may generate different degrees of persistence and scaling behavior.
Oil price behavior has often been examined through linear time-series models, vector autoregressive models, volatility models and structural supply–demand frameworks. These approaches are useful for identifying average relationships and short-run responses, but they may be limited when the underlying process is nonlinear, scale-dependent or asymmetric. Multifractal methods provide an alternative framework by allowing different fluctuation sizes and time horizons to follow different scaling laws. AMF-DFA is especially suitable because it separates upward and downward market movements and therefore allows the study to examine whether oil price increases and decreases have different persistence structures.

2.2.2. Theory and Model of Freight Market Dynamics

Freight markets are theoretically driven by the interaction between shipping demand, vessel supply, commodity trade and global business cycles. Freight rates increase when the demand for transporting commodities rises faster than available shipping capacity, and they fall when vessel supply exceeds trade demand. The Baltic Dry Index is commonly used as a proxy for dry-bulk freight market conditions because it reflects the cost of transporting key commodities such as coal, iron ore and grain. It therefore captures information about global trade activity and shipping market tightness.
Unlike financial markets, freight markets are partly constrained by physical capacity. Vessel supply cannot adjust instantly because shipbuilding, port capacity, congestion and route availability involve time lags. This creates cyclical and delayed adjustment mechanisms. Freight markets may therefore exhibit persistence and nonlinear dynamics, particularly during periods of supply chain disruption, port congestion and trade uncertainty. Bakshi et al. (2010) show that shipping market indicators can provide forward-looking information about global economic activity, while later studies also link freight market fluctuations with trade and financial market shocks [7]. These theoretical features justify the use of a scale-dependent approach, because short-term freight volatility and long-term capacity adjustment may follow different dynamic patterns.
In this study, the Baltic Dry Index is included to represent the freight market component of the global trade system. Its theoretical role is different from WTI and RMB/USD: oil prices reflect energy input costs, exchange rates reflect price competitiveness and currency adjustment, while freight rates reflect the physical cost and capacity constraints of global trade. If freight market efficiency is adaptive, then the BDI should display different degrees of multifractality across time scales and may respond differently to upward and downward market regimes.

2.2.3. Theory and Model of Exchange Rate Movements

Exchange rate theory explains currency movements through macroeconomic fundamentals, monetary policy, interest rate differentials, inflation expectations, capital flows and trade balances. Traditional models such as purchasing power parity and interest rate parity imply that exchange rates should adjust to changes in relative prices and returns. However, empirical exchange rate behavior often departs from these linear theoretical predictions because of delayed adjustment, policy intervention, heterogeneous expectations and changing risk preferences.
The RMB/USD exchange rate is especially relevant in this study because China plays a central role in global manufacturing, trade and maritime logistics. Movements in RMB/USD affect import costs, commodity demand, export competitiveness and the transmission of oil and freight shocks. Exchange rate dynamics may also be asymmetric because appreciation and depreciation pressures are not always processed in the same way. In managed or policy-influenced currency markets, downward and upward movements may have different persistence due to central-bank intervention, capital-flow management and trade-balance pressures.
This theoretical logic supports the use of AMF-DFA. If RMB/USD follows a purely efficient random walk, the generalized Hurst exponent should remain close to the benchmark associated with weak-form efficiency. If, however, exchange rate adjustment is persistent, asymmetric or scale-dependent, then h(q), the multifractal spectrum and the asymmetric multifractal degree measure should reveal deviations from efficiency. This links exchange rate theory directly with the empirical testing strategy used in the paper.

2.2.4. Theory and Model of Multifractality in Financial Markets

The theoretical basis for multifractal analysis comes from the recognition that financial markets are complex systems rather than homogeneous linear processes. The Efficient Market Hypothesis assumes that available information is reflected in prices and that returns should not display systematic dependence (Fama, 1970) [11]. However, empirical financial data frequently show volatility clustering, fat-tailed distributions, long memory and nonlinear dependence (Cont, 2001; Di Matteo, 2007) [1,2]. These features suggest that information is not always incorporated instantly or symmetrically.
Multifractal theory provides a framework for examining this complexity by allowing market behavior to vary across time scales and fluctuation magnitudes. Mandelbrot (1997) argues that financial markets often display irregular scaling behavior [14], while Kantelhardt et al. (2002) provide the MF-DFA method for detecting multifractality in nonstationary time series [15]. In this framework, the generalized Hurst exponent h(q) captures how small and large fluctuations scale differently. A dependence of h(q) on q indicates multifractality, while deviations from the random-walk benchmark suggest departures from weak-form efficiency.
The asymmetric extension of MF-DFA strengthens this theoretical framework by distinguishing between upward and downward market trends. This is important because oil, freight and exchange rate markets may react differently to positive and negative shocks. For example, oil price increases may transmit more persistently into transport and production costs than oil price decreases; freight rate increases may reflect capacity constraints more strongly than freight rate declines; and RMB/USD movements may be influenced by policy management and trade pressures. Recent AMF-DFA studies show that asymmetric multifractal scaling can reveal market inefficiency that would be hidden under symmetric modeling assumptions (Wan et al., 2025; Shahzad et al., 2020) [10,31].
Accordingly, the theoretical foundation of this study combines the EMH, the AMH and multifractal market theory. The EMH provides the benchmark of weak-form efficiency; the AMH explains why efficiency may change under different market conditions; and AMF-DFA provides the empirical framework for testing whether efficiency varies across time scales, fluctuation sizes and upward/downward regimes. This theoretical structure supports the empirical focus of the study on asymmetric multifractal efficiency in oil, freight and exchange rate markets.

3. Data and Methodology

This study focuses on the efficiency and multifractal characteristics of three markets, i.e., the oil, freight and exchange rate market, using daily data over the period post-COVID-19. The data were obtained from Refinitiv/LSEG Datastream through LSEG Workspace. The study uses daily observations for WTI crude oil, the Baltic Dry Index and the RMB/USD exchange rate from 1 January 2021 to 31 December 2024, which contains 4 years of daily observations. The series were extracted on a five-day trading-week basis, with weekends and market-holiday observations excluded before calculating logarithmic returns to maintain a consistent trading calendar across WTI crude oil, the Baltic Dry Index and RMB/USD. The period is particularly timely to the current analysis because it constitutes not only the post-pandemic recovery phase but also incidents of increased uncertainty due to bottlenecks in the supply chains, inflationary pressures, geopolitical tensions, and commodity price shocks. Accordingly, the analysis is framed as a post-COVID-focused investigation rather than a pre/post-COVID comparative study.
The behavior of the oil market is proxied by the price of the West Texas Intermediate (WTI) crude oil which is commonly used as a benchmark to the global crude oil markets. The Baltic Dry Index (BDI) represents conditions in the freight market indicators of the cost of transporting bulk commodities of prime size in the freight market. The dynamics of the exchange rates are represented by the RMB/USD exchange rate to reflect the significance of China in global production, trade and marine logistics. These variables are chosen since they reflect three interrelated aspects of the global trade system: the cost of energy input, shipping conditions, and the price competitiveness in the global market.
All data are received in the form of the existing financial databases, such as Refinitiv DataStream, which makes data consistent and reliable across the variables. The analysis is performed on logarithmic returns and not price levels to concentrate on the relative changes and to overcome nonstationary levels. The calculations of returns are done as
r t = l n ( P t ) l n ( P t 1 )
in which P t denotes the price or index value at time t . This transformation is typical in financial time-series analysis because it makes the variance stable and the movement of the prices absolute.
Early screening of the return series shows well-documented stylized facts of financial data, such as excess kurtosis, non-normality and volatility clustering (Cont, 2001) [1]. The latter are especially strong in market conditions in the post-COVID-19 periods, when repeated global shocks, supply chain shocks, and geopolitical uncertainty injected structural instability into the financial and commodity markets. These properties suggest that standard linear models do not have the features to realize the underlying dependence structure of the data. Particularly, the fact that long-memory and heterogeneous scaling behavior are present suggests that market efficiency is not fixed but instead varies between different time scales and different magnitudes of fluctuations, which is consistent with the Adaptive Market Hypothesis (Lo, 2004) [3]. This leads to the application of multifractal techniques that are specifically constructed to capture persistence, nonlinearity and scale-related deviations of weak-form efficiency.
To attain the objectives, the study uses Asymmetric Multifractal Detrended Fluctuation Analysis (AMF-DFA), which is an extension of the MF-DFA methodology which was originally proposed by Kantelhardt et al. (2002) [15]. Although MF-DFA has been extensively utilized to determine long-range dependence and multifractality of nonstationary financial time series, its asymmetric extension can be used to provide a more sophisticated analysis, identifying upward and downward market movement.
This difference is crucial since the responsiveness to positive and negative shocks has been known to vary between the financial and commodity markets. Standard MF-DFA assumes symmetric scaling behavior which can obscure important directional variations in persistence and complexity. But AMF-DFA allows the scaling properties of market dynamics to be done separately under an upward and downward trend, and gives a more realistic representation of market dynamics, especially when there is an element of uncertainty and structural change. Empirical studies in multifractal finance in recent years have offered strong support to the idea of asymmetric scaling behavior in financial and energy markets, especially in the case of increased uncertainty. As an example, AMF-DFA is used to show that there is some asymmetric multifractality in financial time series (Shahzad et al., 2020; Wan et al., 2025) [10,31]. The AMF-DFA estimation was implemented using moment orders ranging from ( q = −5) to ( q = +5) in unit increments, scale sizes ranging from ( s = 8 ) to ( s = N / 4 ), where ( N ) denotes the length of the return series, and first-order polynomial detrending ( m = 1 ). For each market, shuffled and surrogate series were generated to examine whether multifractality was driven by temporal dependence, distributional features or nonlinear dependence. The AMF-DFA algorithm starts with a conversion of the return series r t into a cumulative profile
Y ( i ) = t = 1 i [ r t r ˉ ] , i = 1,2 , , N
where r ˉ is the average return and N is the sample size. This profile is then subdivided into N s = [ N / S ] non-overlapping segments of equal length s, which is the time scale. The process is repeated with the opposite end to make sure that all parts are covered, thus the process will have 2 N s segments.
In all the segments, the local polynomial trends are estimated and eliminated to reveal fluctuations around the trend. The detrending variance is calculated as
F 2 ( v , s ) = 1 s i = 1 s [ Y ( ( v 1 ) s + i ) Y v ( i ) ] 2
To apply asymmetry, segments are categorized, depending on the direction of local trends. Particularly, the upward and the downward fluctuation are studied separately and distinctive functions of fluctuation F q + ( s ) and F q ( s ) can be estimated. Then the q t h order fluctuation function is defined as
F q ( s ) = { 1 2 N s v = 1 2 N s [ F 2 ( v , s ) ] q / 2 } 1 / q , q 0
in which the parameter q is used to control sensitivity to different magnitudes of variation. The positive values of q emphasize large-scale variation whereas the negative values emphasize small-scale variation across the distribution.
For the scaling behavior, the fluctuation function is a power-law
F q ( s ) s h ( q )
where h ( q ) is the generalized Hurst exponent. Multifractality is justified by the dependence of h ( q ) on q because multifractality is evidence of the existence of multiple scaling exponents. When h ( q ) is near 0.5, it corresponds to the behavior of the random walk, and when there is a deviation of 0.5, it shows persistence ( h ( q ) > 0.5 ) or anti-persistence ( h ( q ) < 0.5 ) ; both indicate a departure from weak-form efficiency.
To measure the level of multifractality, the research calculates
Δ h = h ( q m i n ) h ( q m a x )
A larger Δ h indicates greater multifractality and greater heterogeneity in scaling behavior. Moreover, the multifractal spectrum is obtained with the help of the Legendre transform:
α = h ( q ) + q h ( q ) , f ( α ) = q [ α h ( q ) ] + 1
The spectrum width is calculated as
Δ α = α m a x α m i n
It has a similar measure of complexity (with broader spectra representing richer and more heterogeneous dynamics).
To further explore the origins of multifractality, the analysis compares the original series with shuffled series and surrogate series. Shuffling eliminates relationships in time, but does not remove the distribution, whereas the surrogate series preserves the linear structure but eliminates the nonlinear dependence. The strong decrease in multifractality after shuffling indicates that the first factor is the long-range dependence, and the latter indicates that the heavy tails or nonlinear effects contribute. Differences are helpful to indicate whether inefficiencies are due to distributional properties of returns of memory effects.
This empirical strategy operates in three steps. Therefore, the application of AMF-DFA is useful in each market to approximate Hurst exponents and indicate scaling behavior. Second, the level of multifractality is determined based on Δ h and Δ α . Third, the shuffled analysis and surrogate analysis are performed to determine the sources of multifractality. This structure offers a very effective and extensive framework of assessing scale-dependent and asymmetric market efficiency. To triangulate the AMF-DFA findings, the variance-ratio test was also applied as a conventional robustness check for weak-form market efficiency.

4. Results and Discussion

The empirical findings of the asymmetric multifractal analysis of the oil, freight and exchange rate markets are presented in this section. The aim is to test the hypothesis on whether these markets show scale-dependent efficiency and asymmetric dynamics across various regimes of fluctuation. The study has conducted a thorough evaluation of information processing in the interconnected global trade system by analyzing scaling behavior, asymmetry, and multifractal properties.
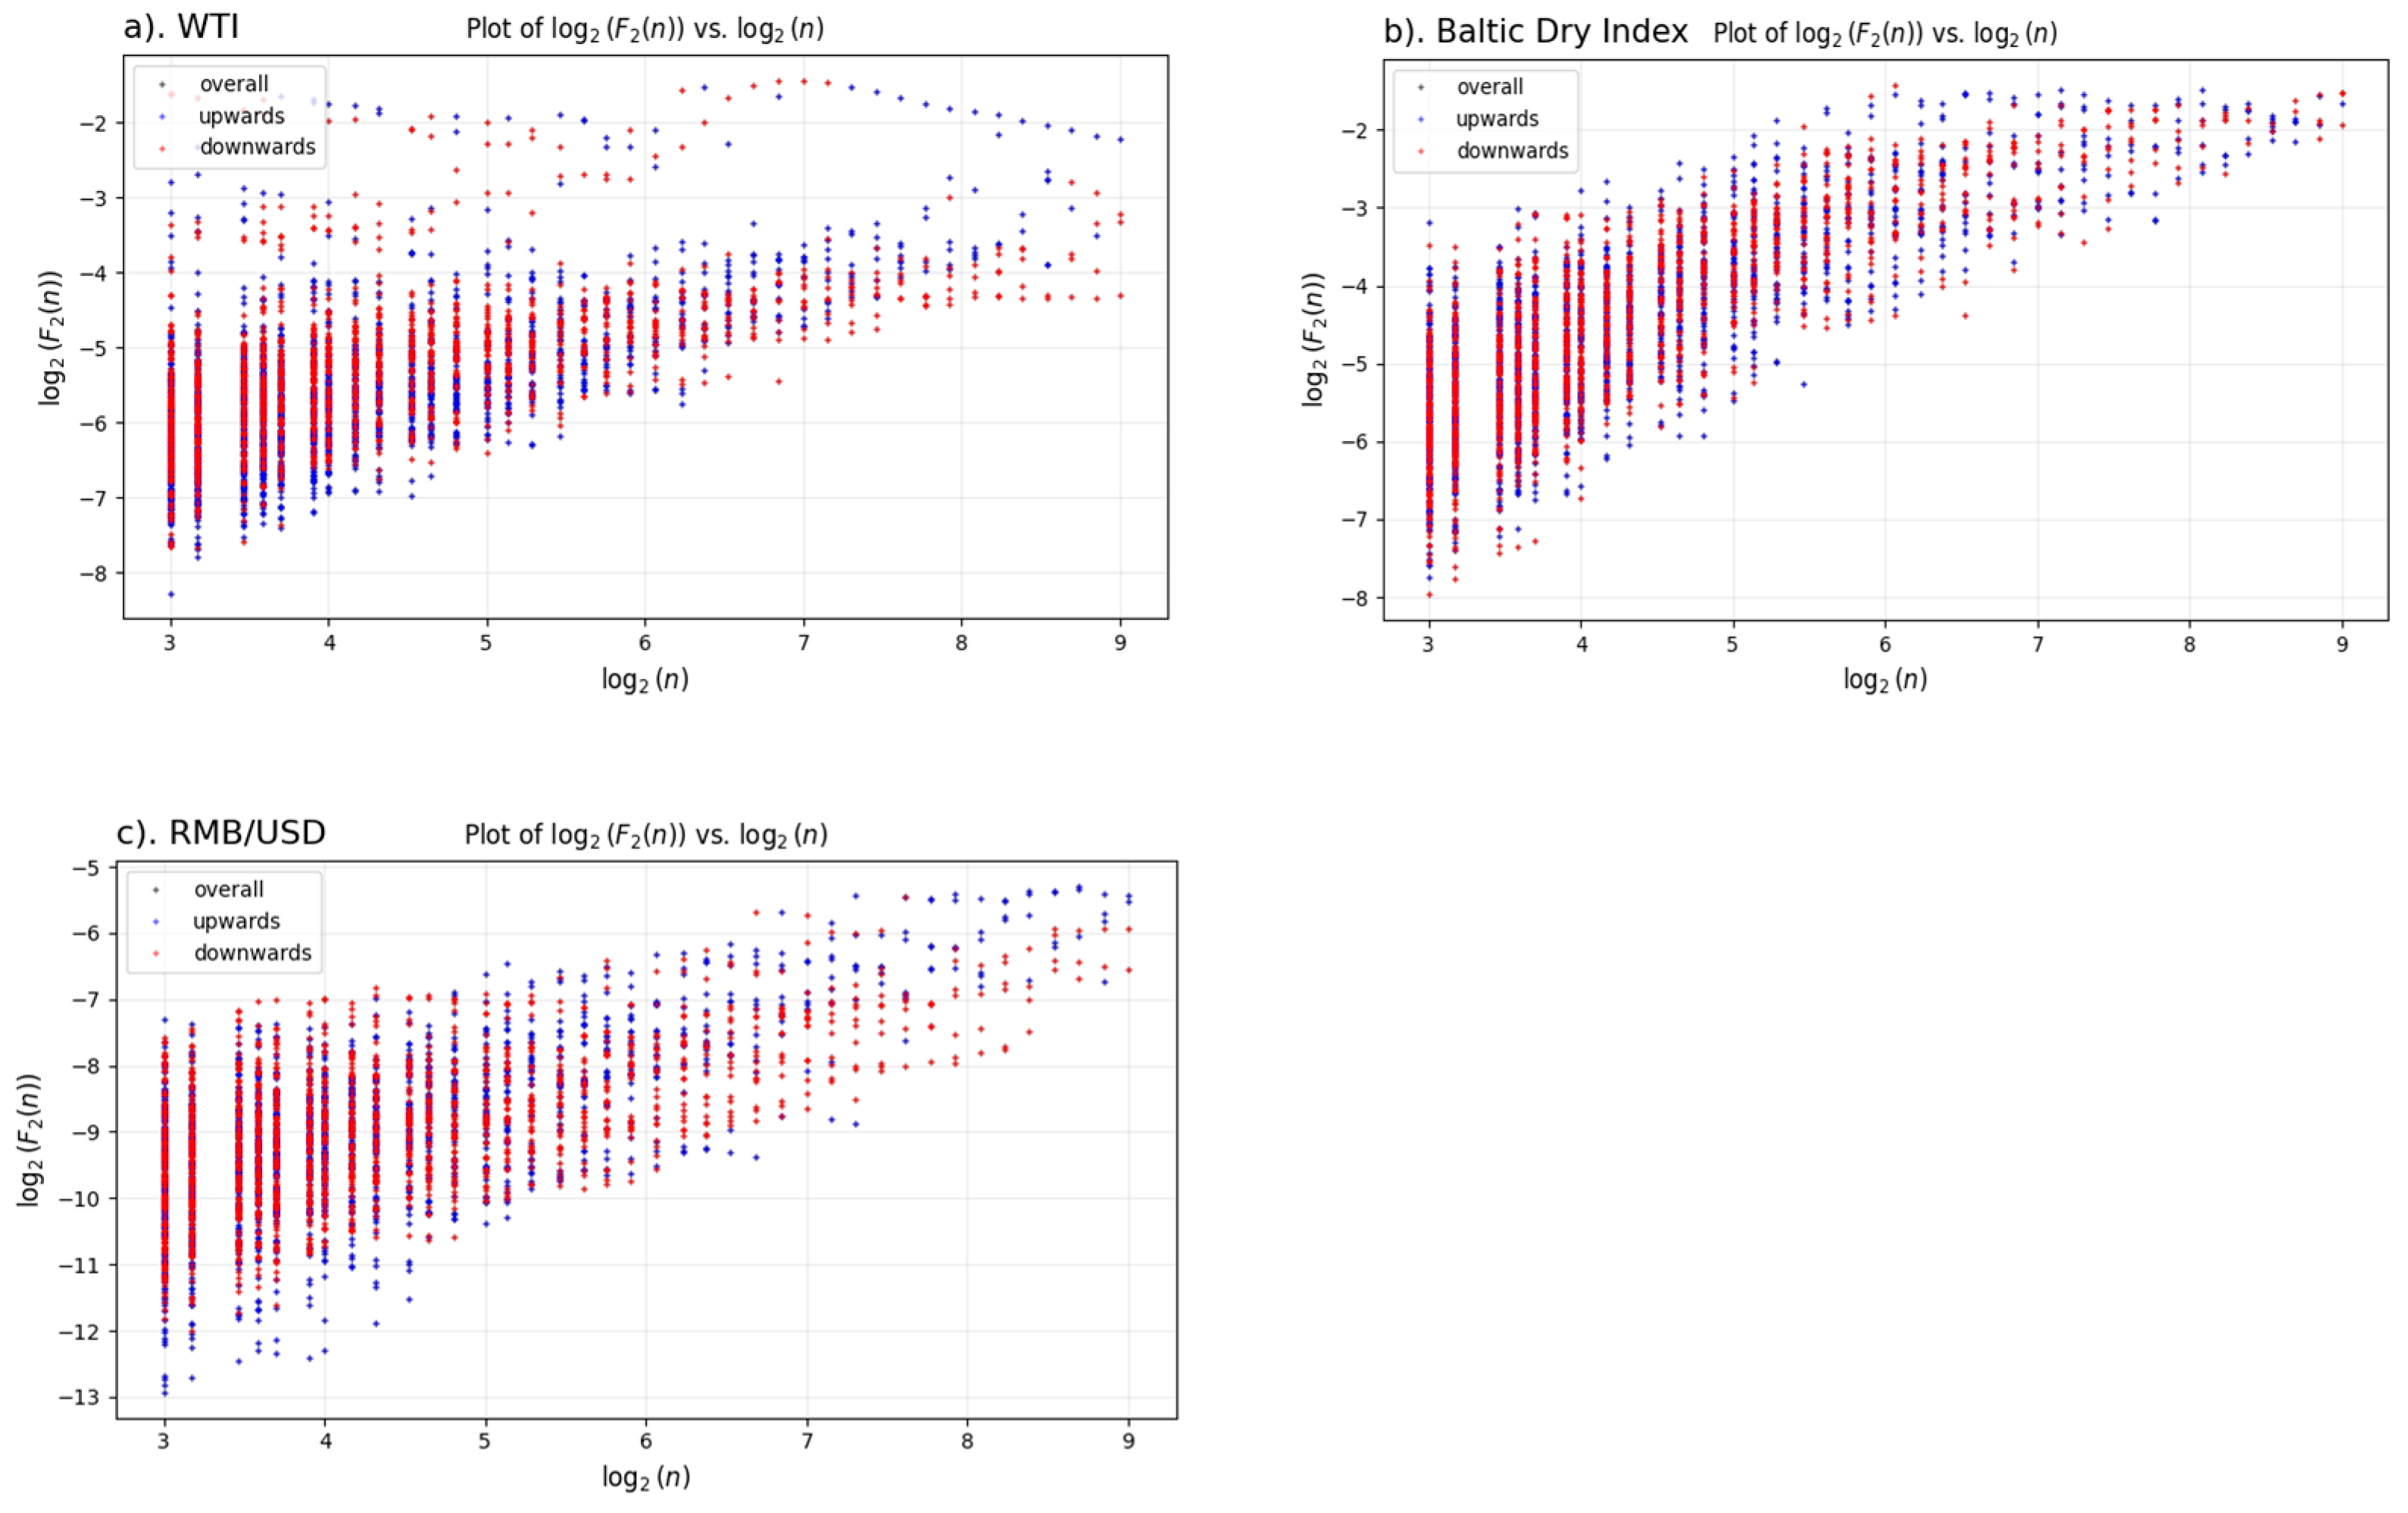
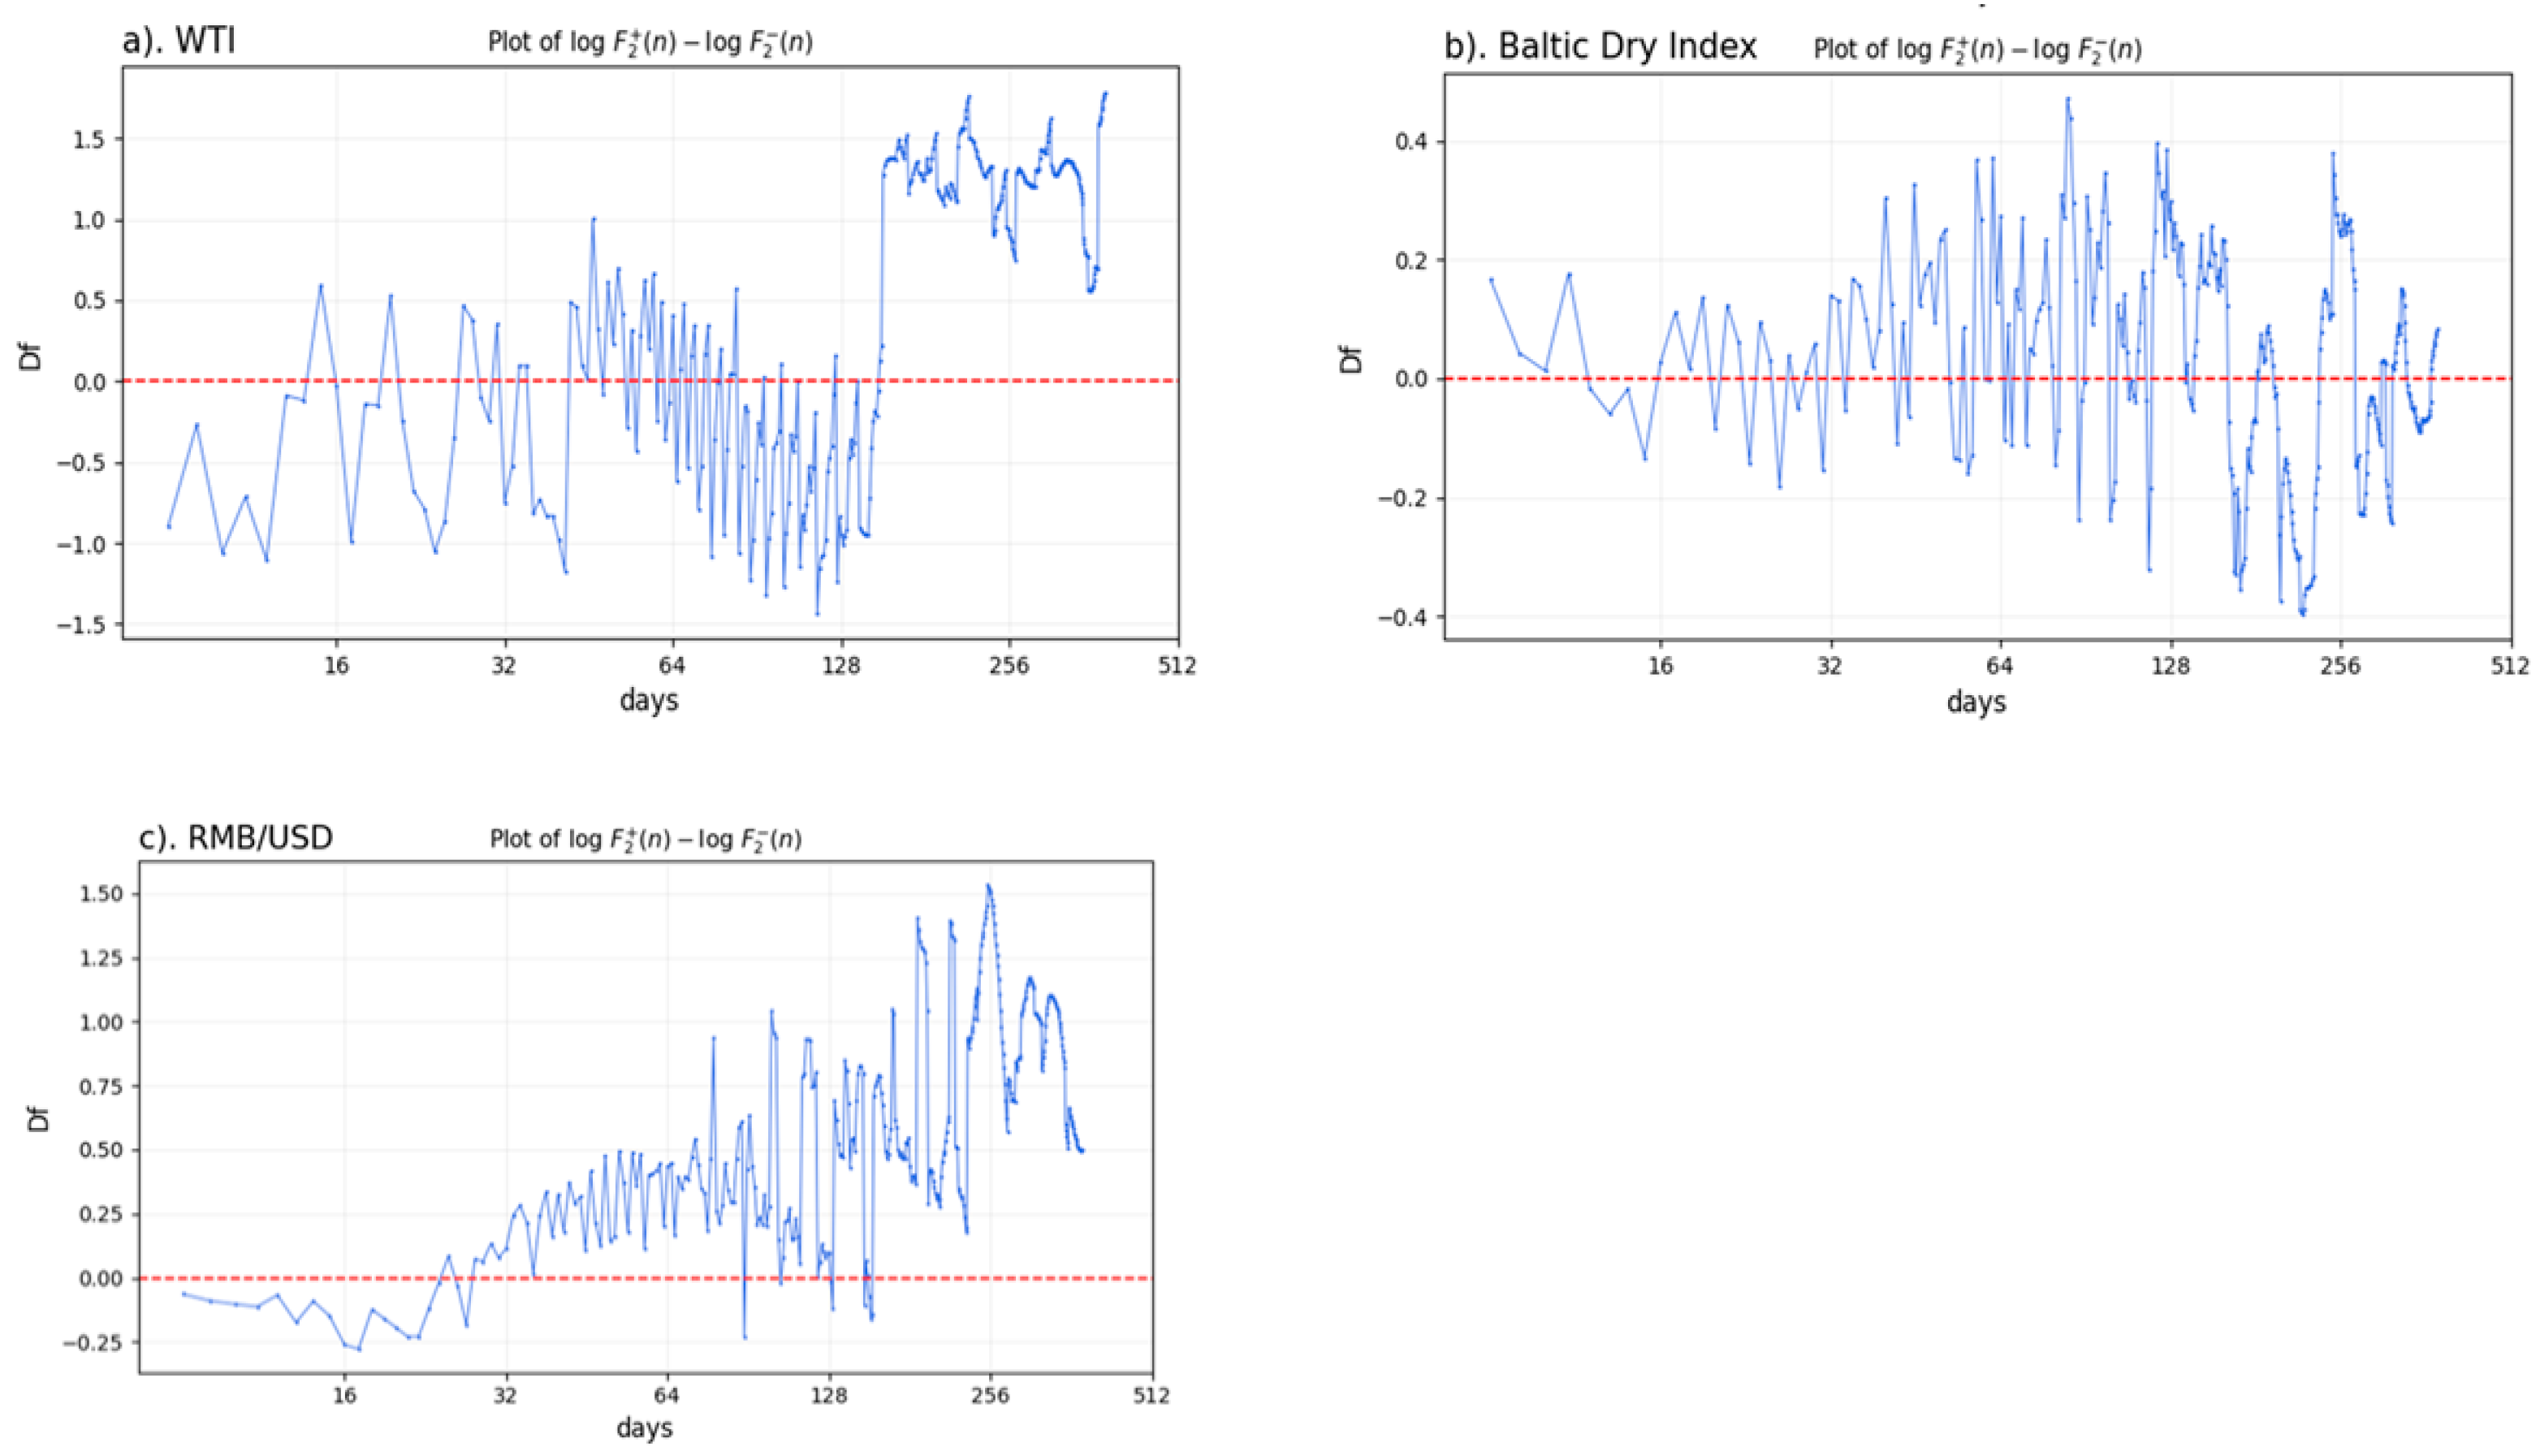
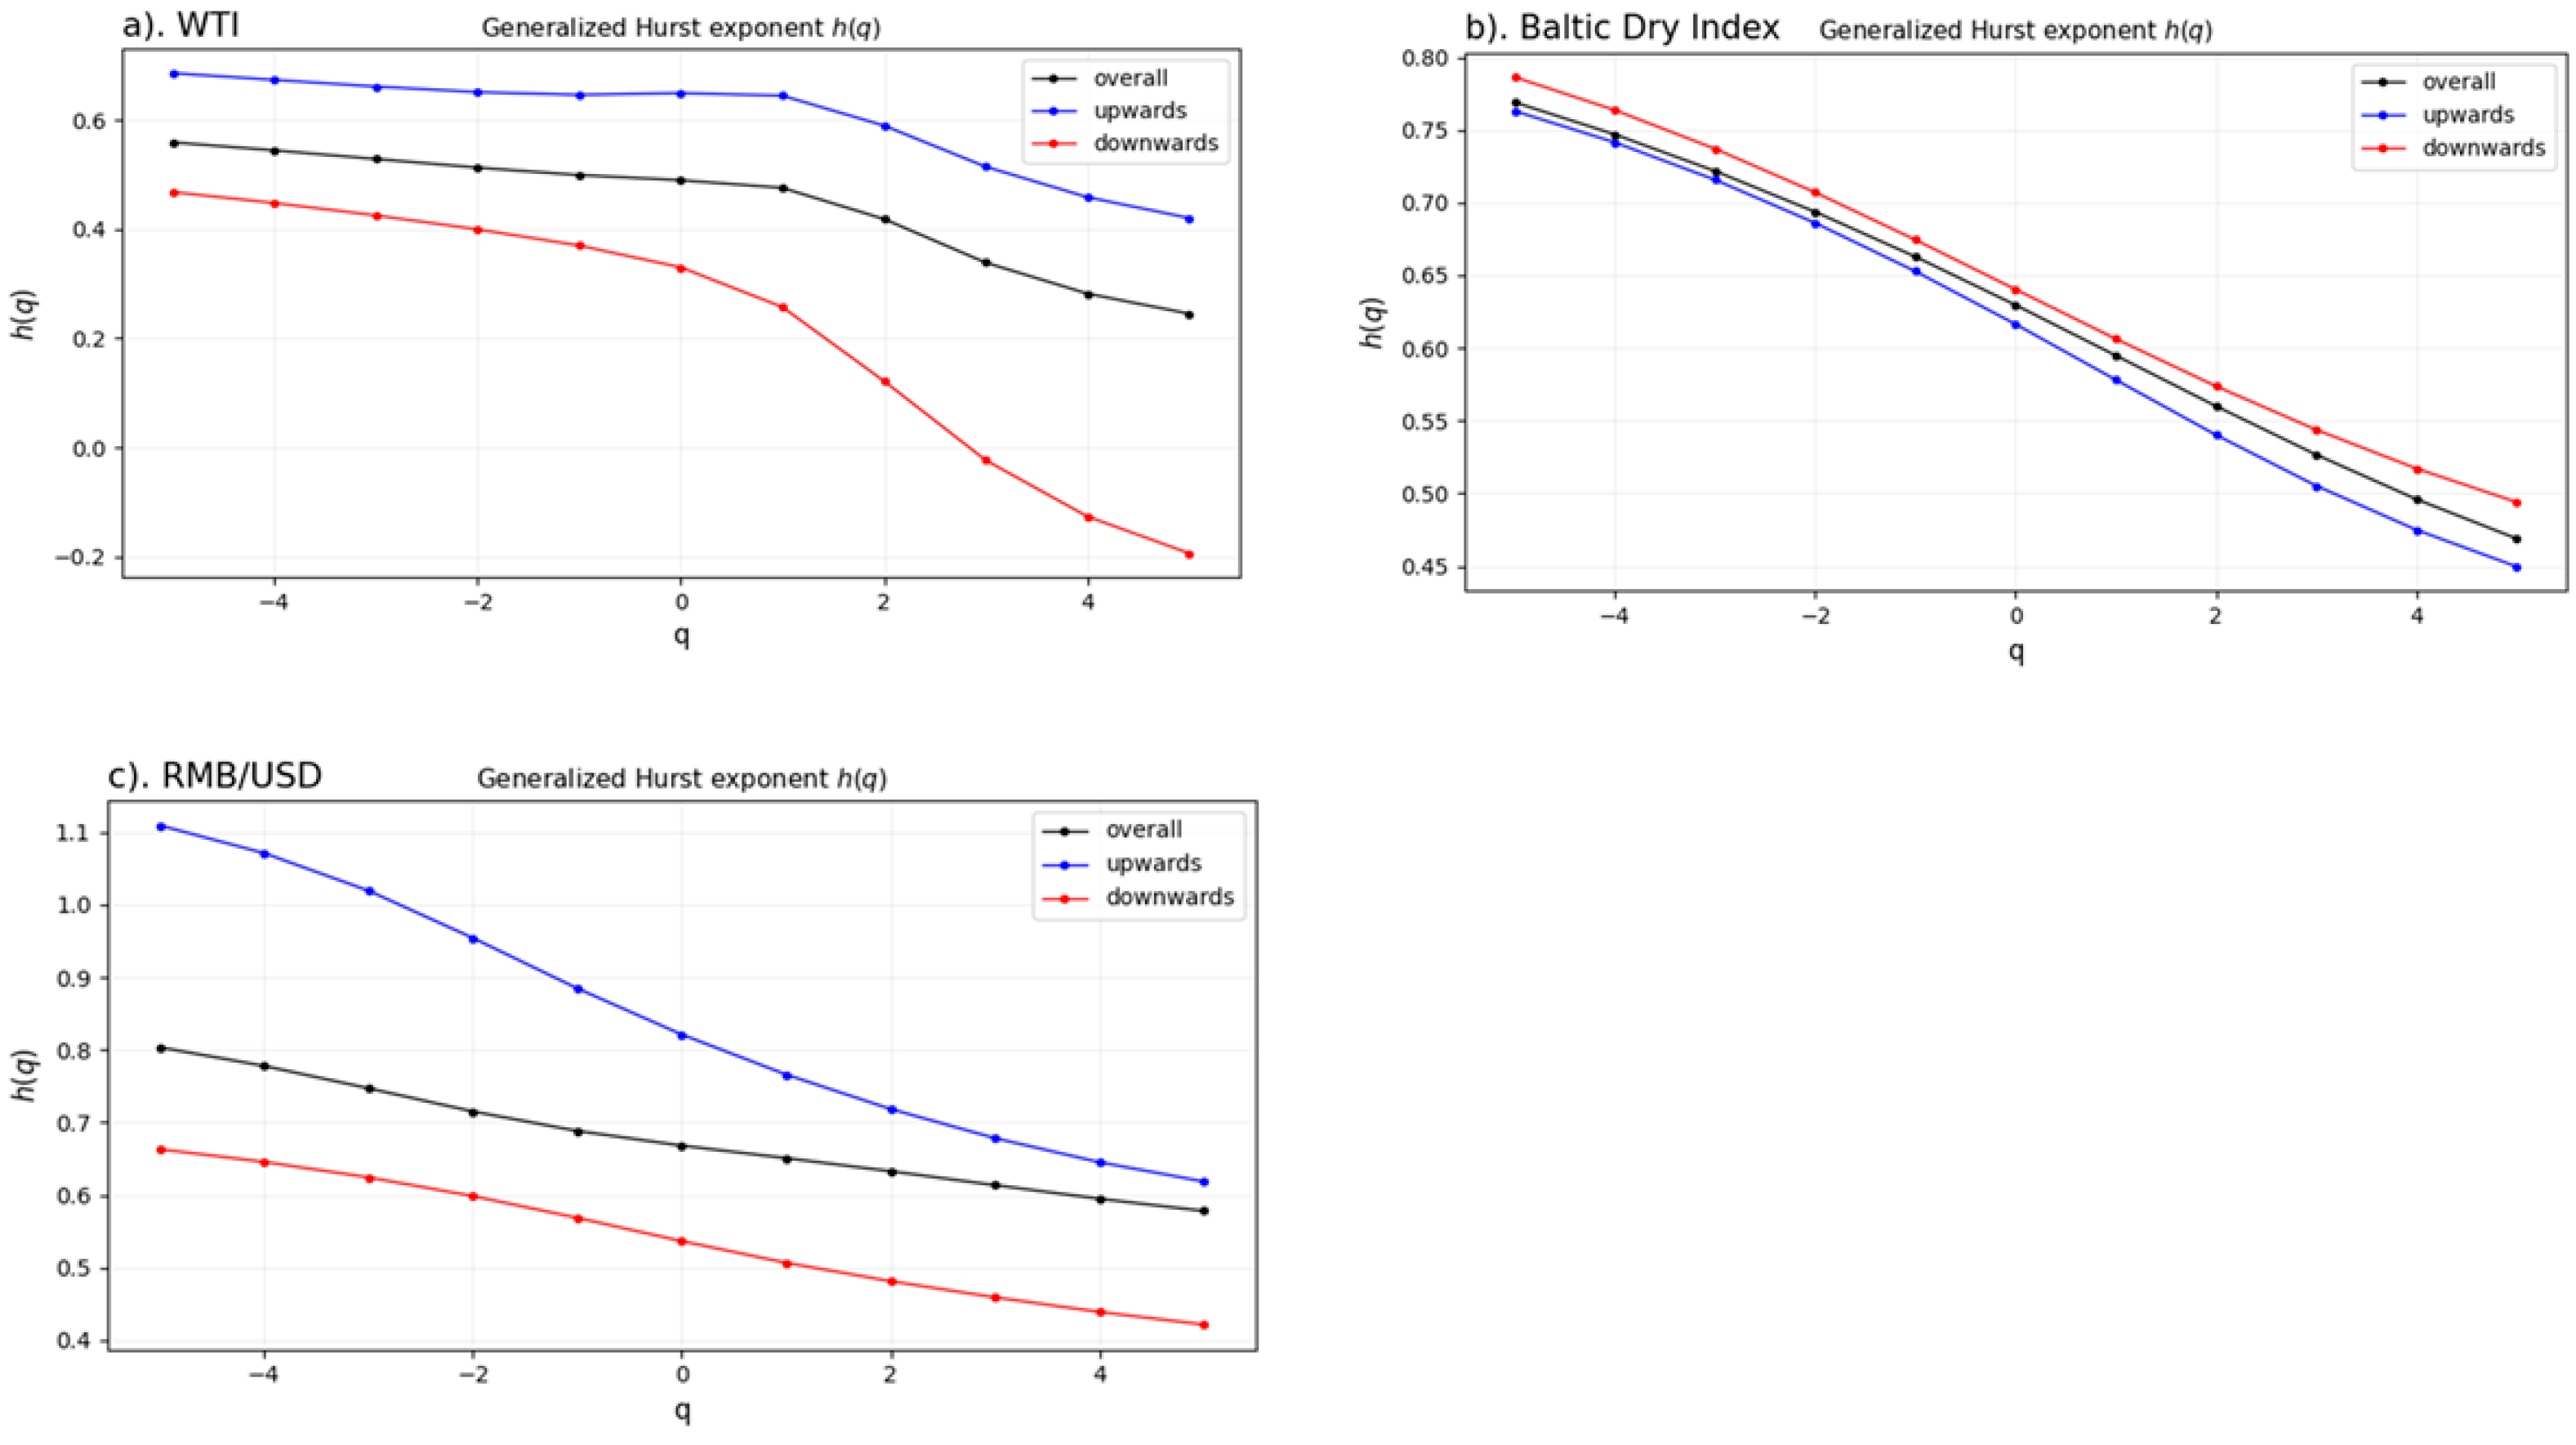
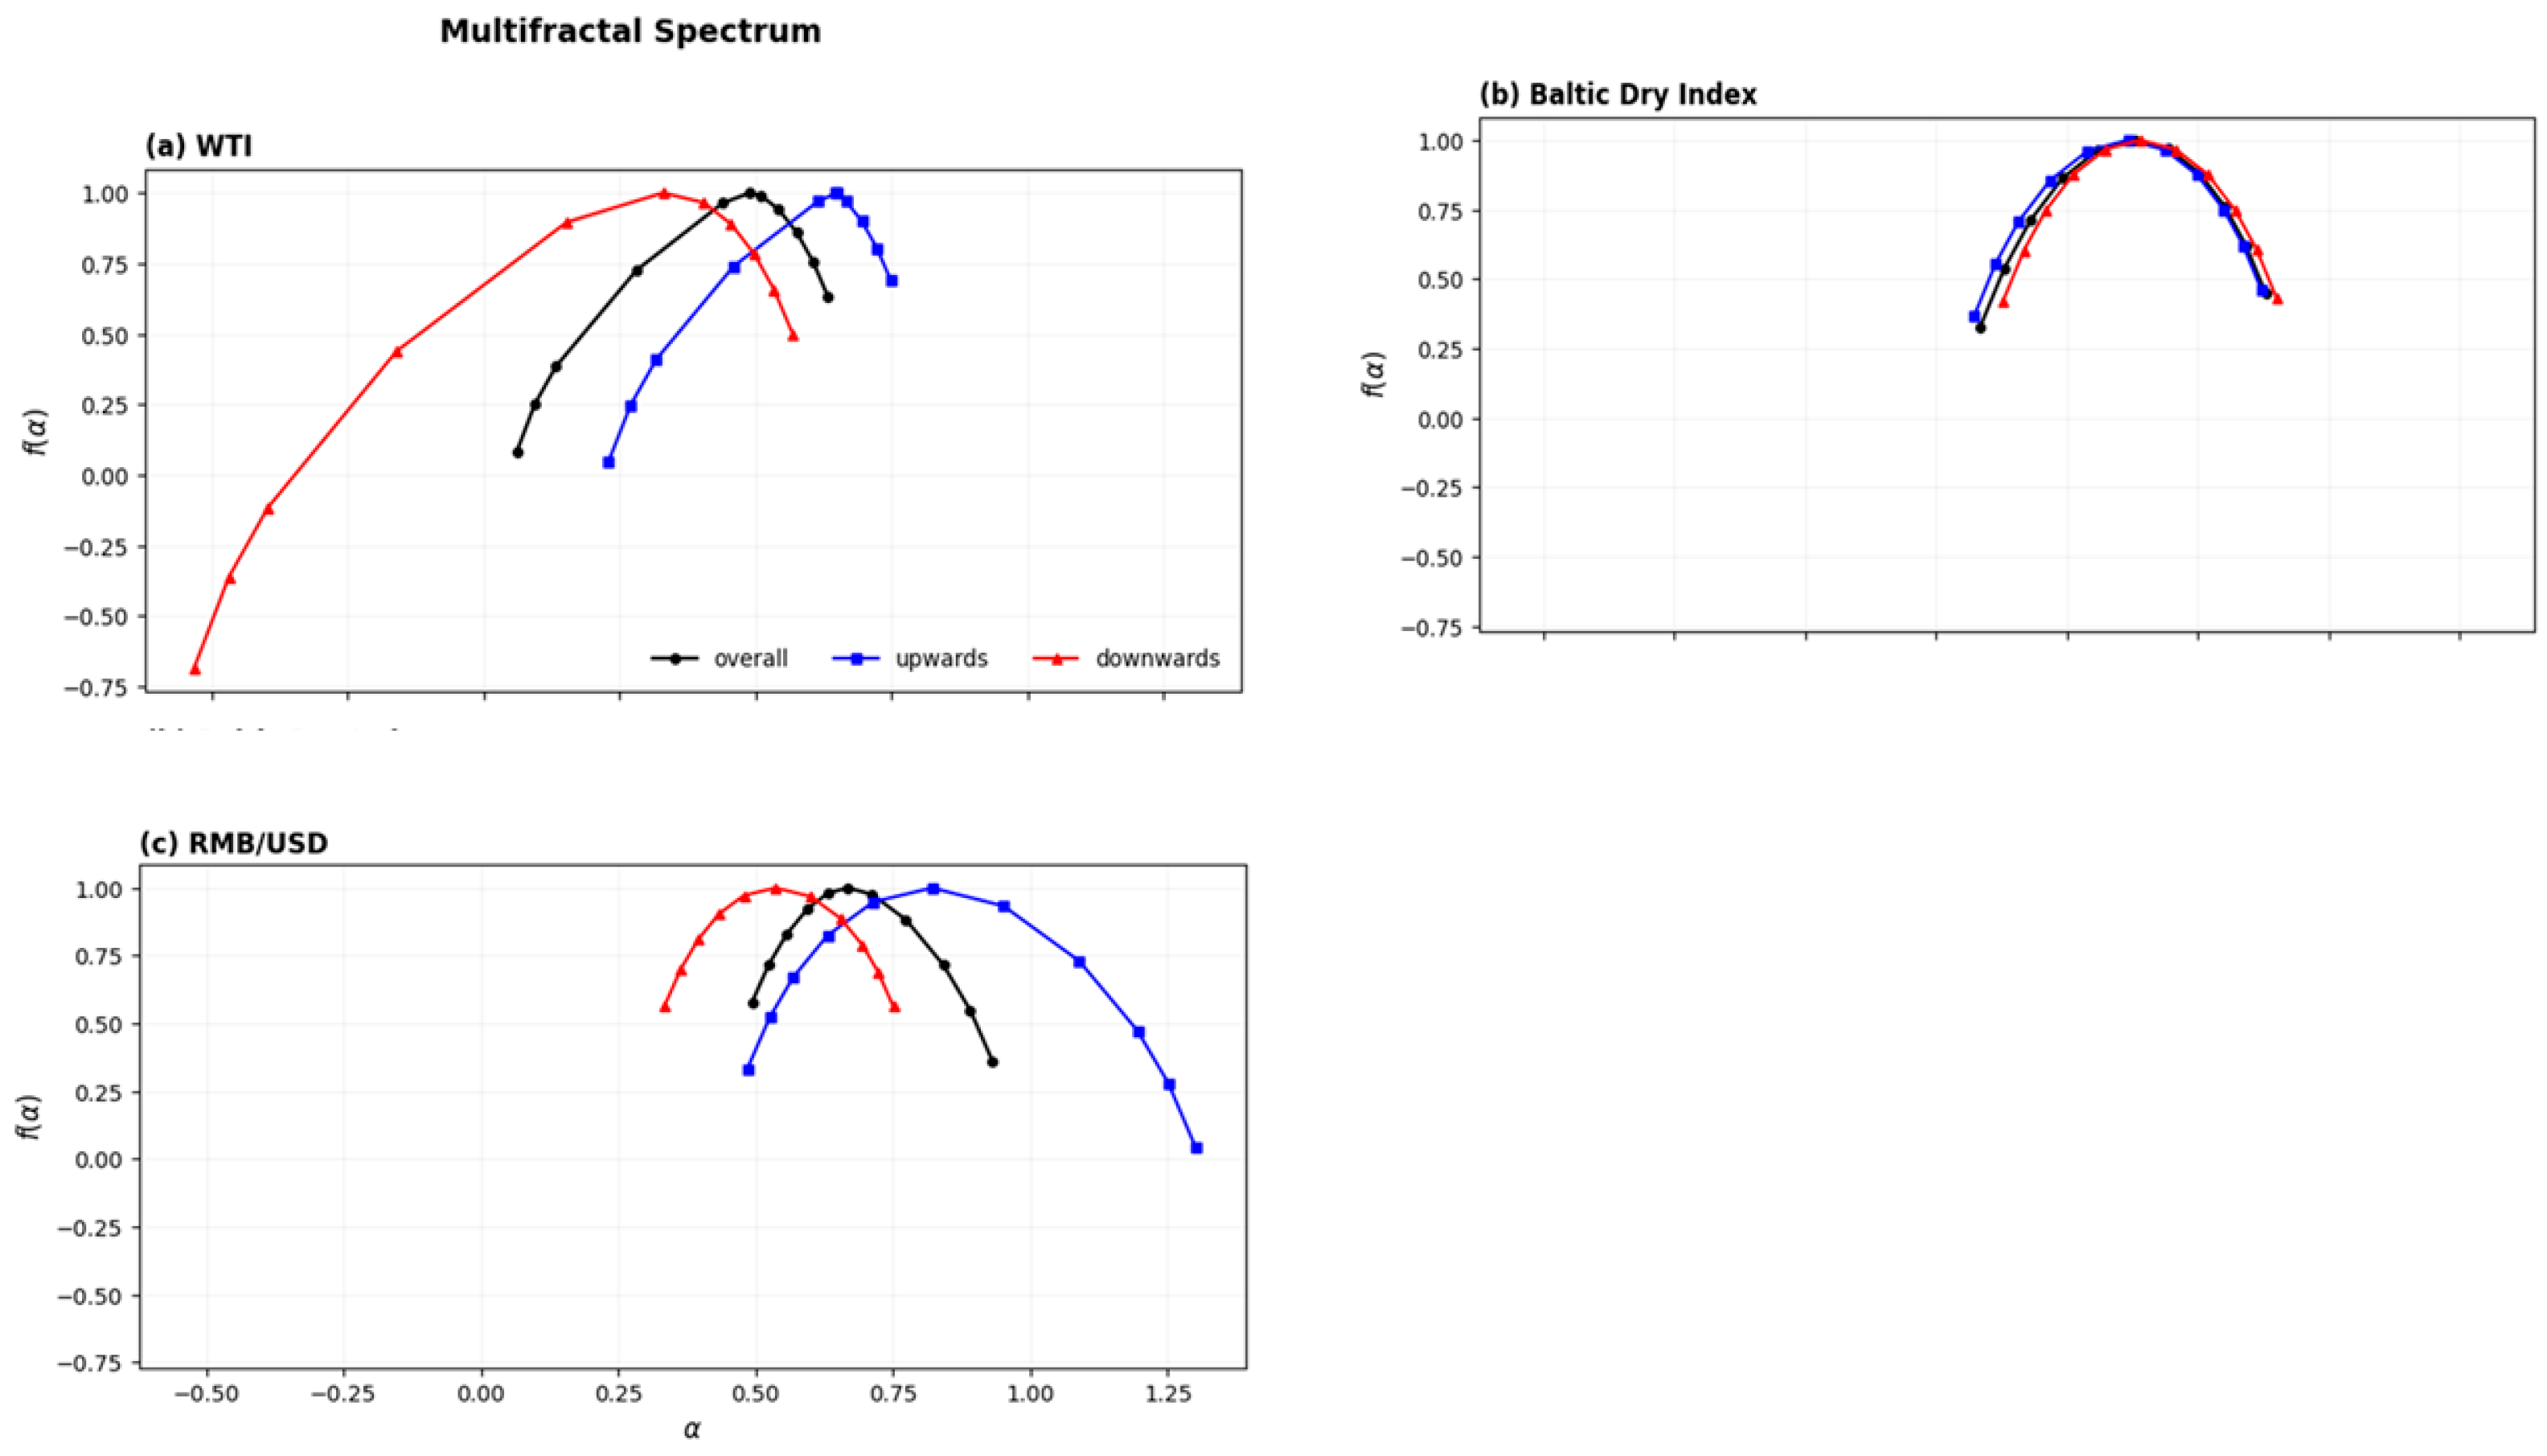
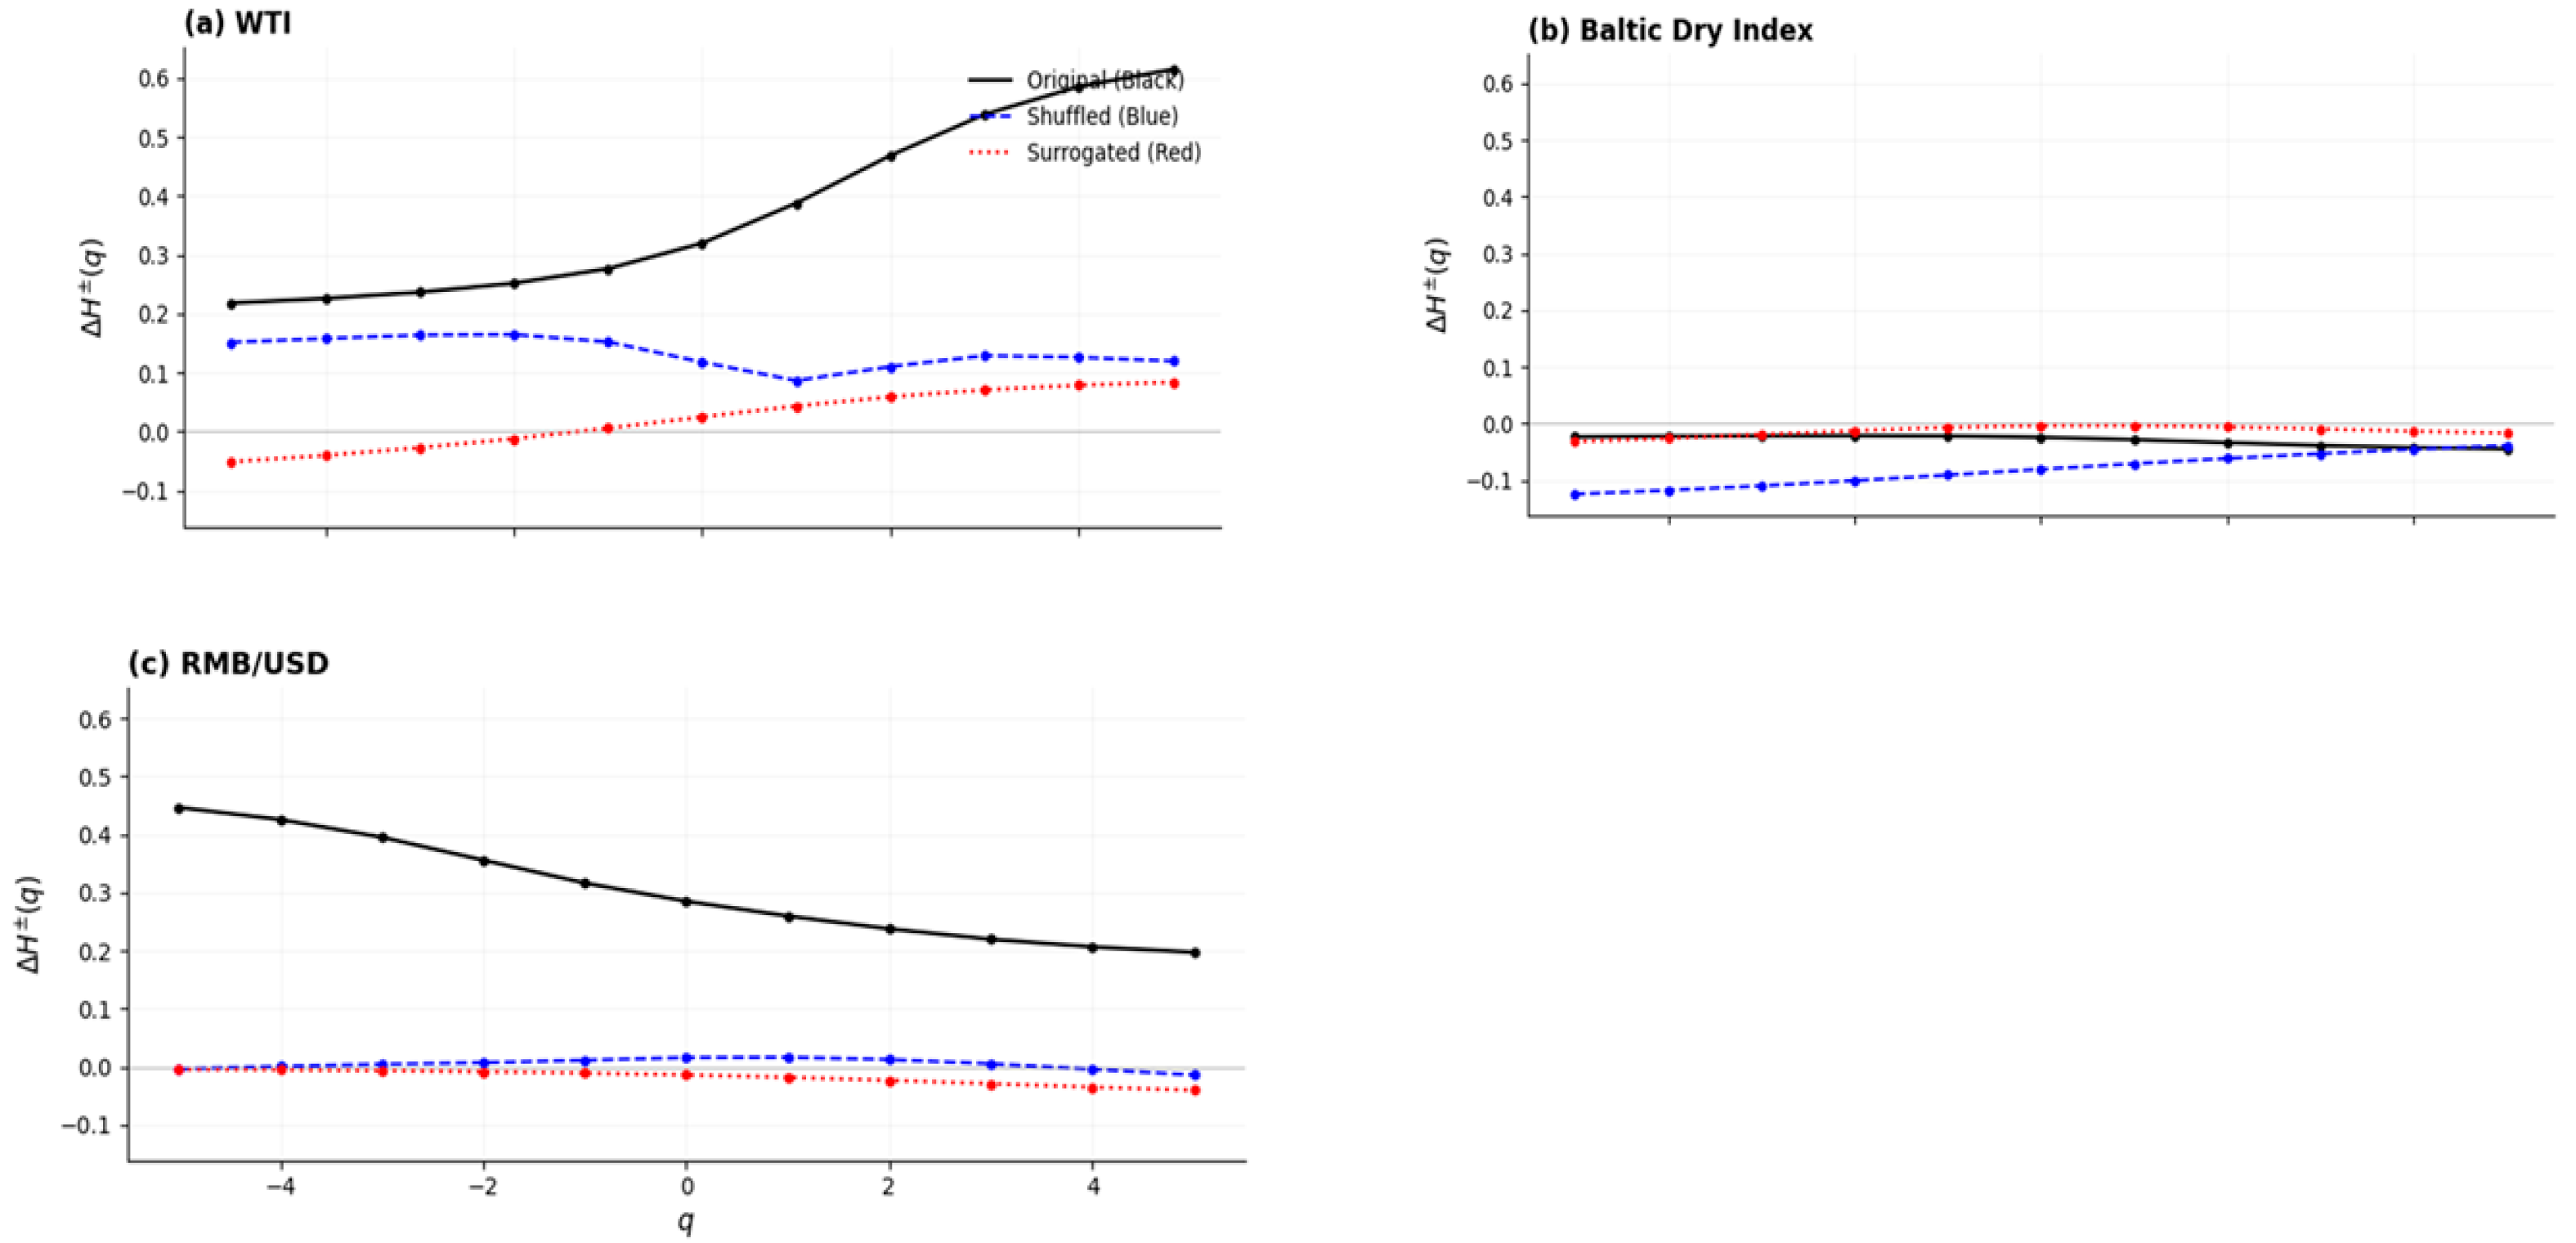
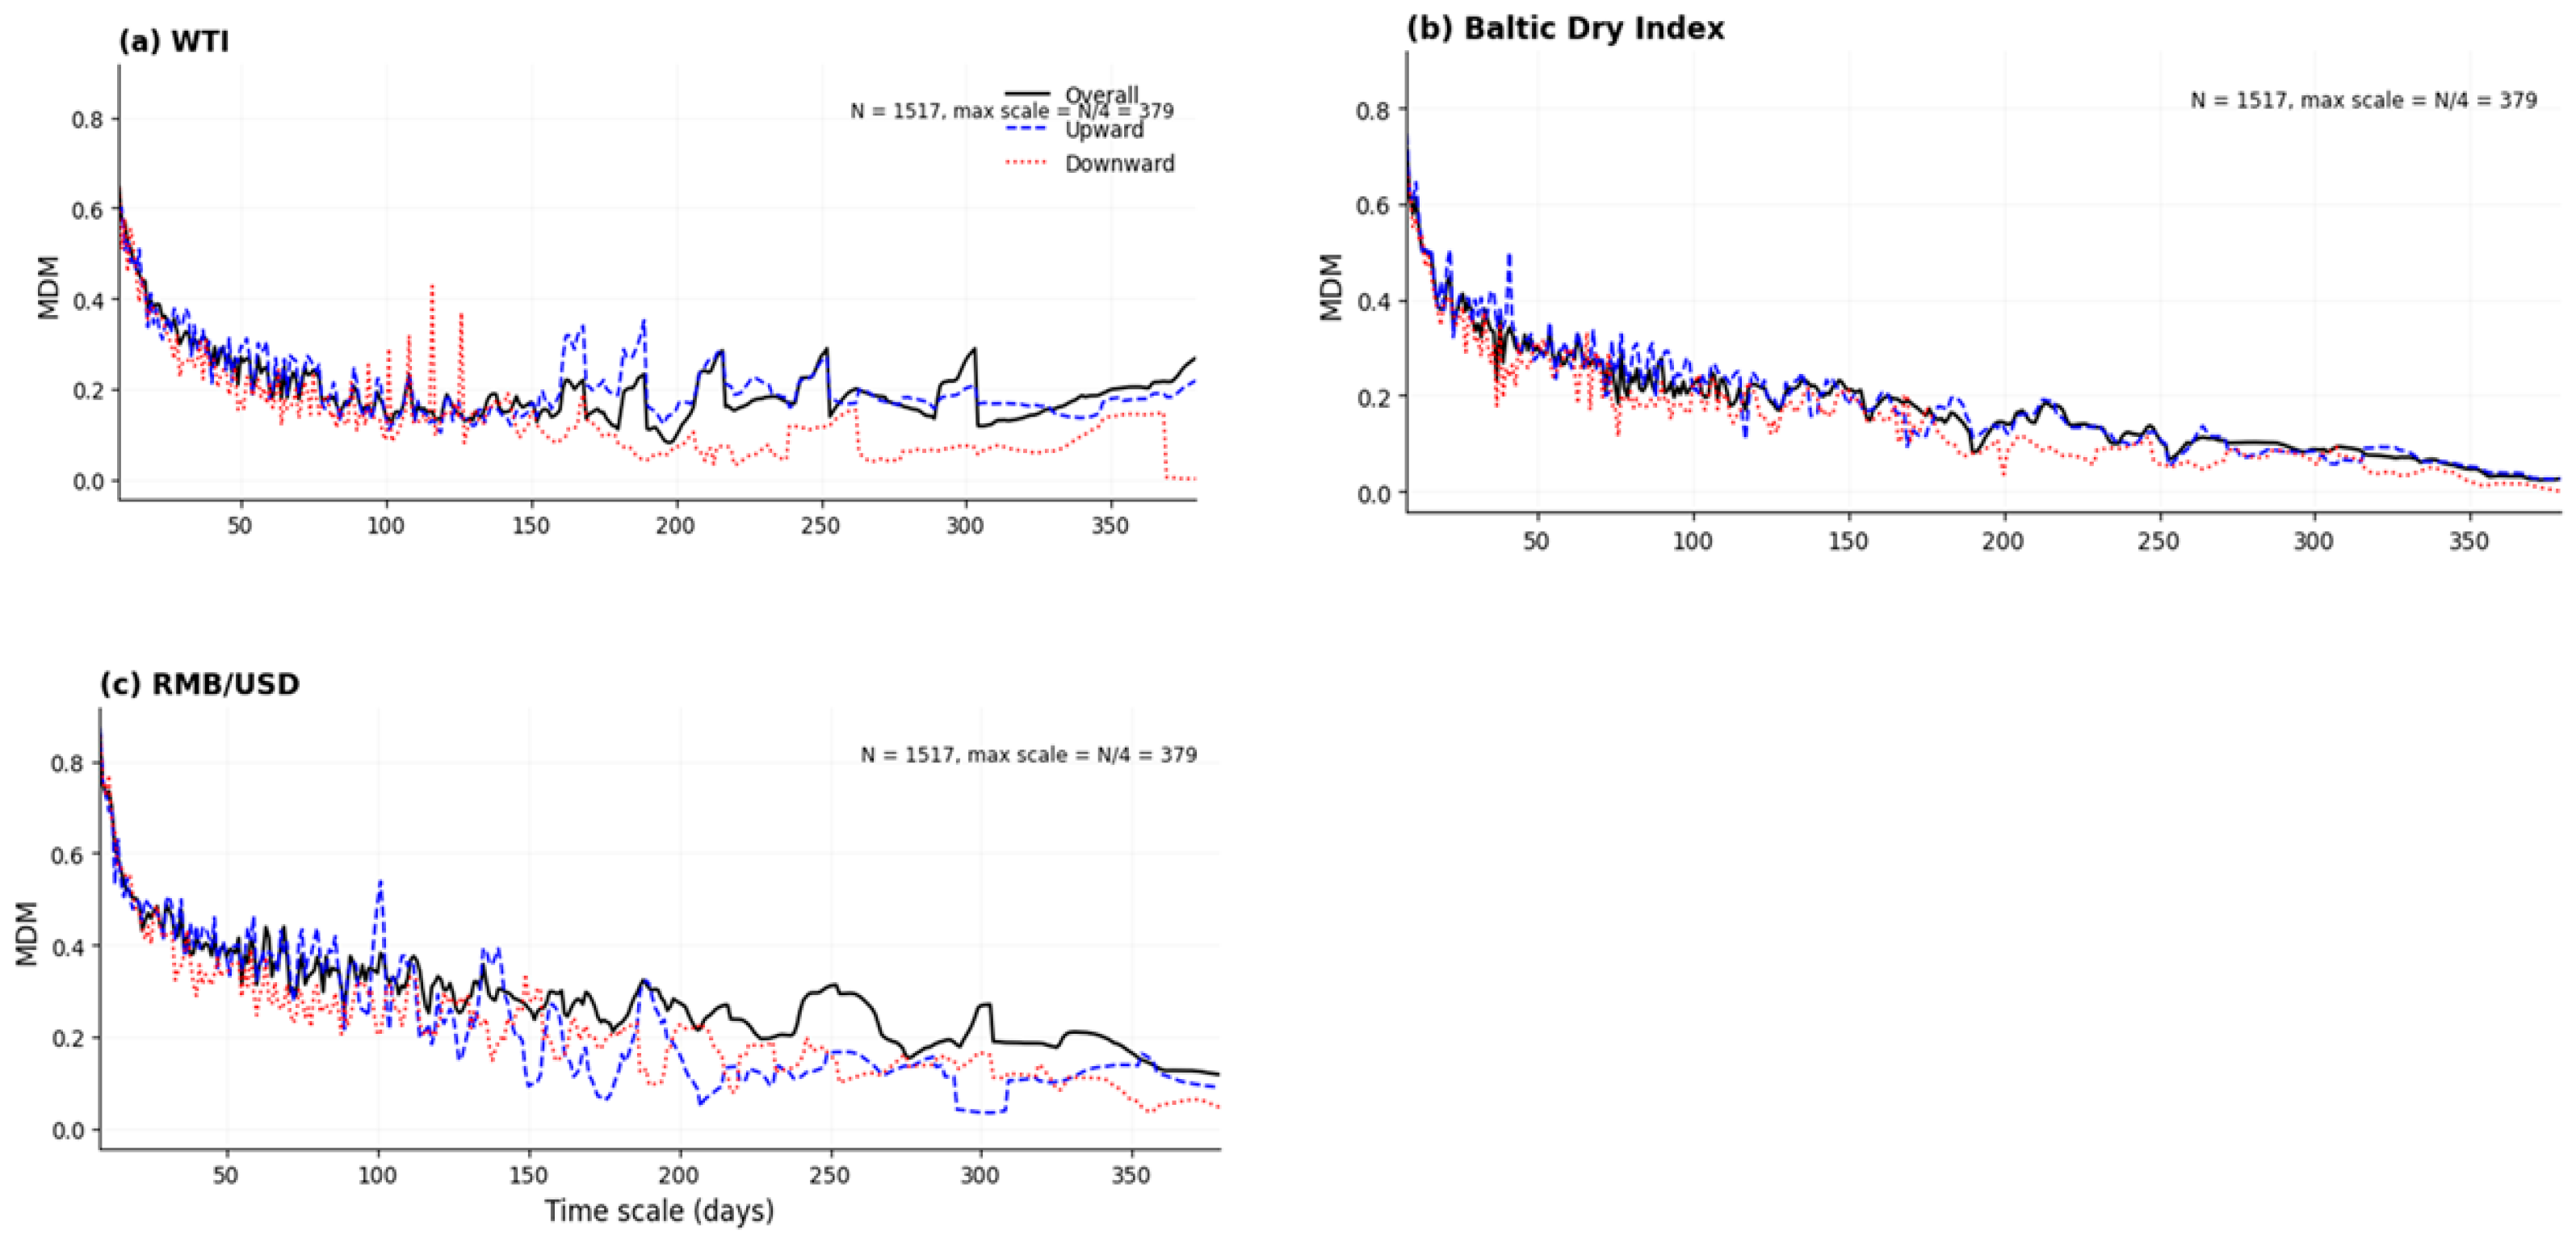
To improve the clarity of the empirical presentation, the results are reported by linking each figure to the corresponding AMF-DFA calculation and market efficiency interpretation. The figures presented in this section are not descriptive illustrations; rather, they are graphical representations of the main computational output obtained from the asymmetric MF-DFA procedure. Figure 1 reports the AMF-DFA fluctuation functions derived from the scaling relationship in Equations (2)–(5). Figure 2 presents the scale-dependent excess asymmetry between upward and downward fluctuations. Figure 3 reports the generalized Hurst exponents, which are used to assess persistence, anti-persistence and deviations from weak-form efficiency. Figure 4 presents the multifractal spectra derived from the Legendre transformation in Equations (7) and (8). Figure 5 compares the original, shuffled and surrogate series to identify the sources of multifractality and to provide robustness evidence. Figure 6 reports the asymmetric multifractal degree measure across time scales and directional regimes. Table 1 summarizes the connection between each empirical output, its computational basis, and its interpretation.

4.1. Results

Figure 1 is based on the AMF-DFA profile construction, detrended fluctuation functions and scaling relationship defined in Equations (2)–(5). The interpretation follows the multifractal framework of Kantelhardt et al. [15] and the adaptive view of market efficiency, where deviations from homogeneous scaling indicate time-varying efficiency across market conditions [3]. The AMF-DFA scaling plots show the relationship between l o g 2 ( F 2 ( n ) ) and l o g 2 ( n ) of WTI, Baltic Dry Index and RMB/USD. The general direction of the trend is observed to be generally increasing in all panels, which confirms the presence of scaling behavior; however, the relationship is not strictly linear but has a wide dispersion. At lower time scales (or l o g 2 ( n ) 3   t o   5 ) ), the points are quite tightly clustered, indicating more stable and homogeneous short-run dynamics. With a larger time scale ( l o g 2 ( n ) > 6 ) , dispersion is wide, which implies that long-horizon behavior is more heterogeneous and responsive to structural variation. In addition to this, the up (blue) and down (red) fluctuation clouds are not in the same scaling structure as the overall pattern, especially at medium-to-large scales, indicating that positive and negative trends follow different scaling structures than the overall structure, not a symmetric process.
Figure 1. Asymmetric scaling behavior of WTI, Baltic Dry Index, and RMB/USD.
Fractalfract 10 00463 g001
This divergence is more evident at higher time scales ( l o g 2 ( n ) 6   t o   9 ) where the upward fluctuations are more likely to have relatively higher values of fluctuations compared to the downward fluctuations in some regions, and the opposite of this in other regions, showing the instability of directional dominance. This behavior implies that the persistence of shocks is not the same in all directions or horizons. This suggests that in the short run, market movements are more regulated and adjusted quickly as compared to the long-term dynamics that are governed by aggregate shocks and structural processes. In WTI, this measures the slow adjustment of the supply side and geopolitical shocks. In the Baltic Dry Index, it measures the slow adjustment of the shipping capacity and trading demand, and in RMB/USD, it is a degree of gradual and policy-influenced adjustments of the exchange rate. The result that negative and positive shocks are asymmetrically processed at larger scales supports the fact that nonlinear and inefficient dynamics occur across these interconnected markets.
Figure 2 is based on the upward and downward fluctuation functions in Equations (3)–(5), capturing asymmetric market adjustment across positive and negative regimes. The excess asymmetry plots show the difference between upward and downward fluctuation functions, D f ( n ) = l o g F 2 + ( n ) l o g F 2 ( n ) , between time scales of WTI, Baltic Dry Index and RMB/USD. In the low time scales (about 8–32 days), the values of all the three markets vary in very close relation to zero, which means that the up and down movements are almost equalized in the short term. The behavior, however, is more volatile and directional as the time scale goes up. In the WTI panel, it is observed that beyond an approximate of 128 days, there is an obvious shift where D f ( n ) becomes continually positive, indicating that upward fluctuations dominate at longer horizons. Conversely the Baltic Dry Index has frequent oscillations about zero even at higher scales, suggesting unstable and switching asymmetry. In the case of RMB/USD, the trend changes at short scales, which are slightly negative, to consistently positive values at longer scales, i.e., after around 64–128 days.
Figure 2. Scale-dependent asymmetry in WTI, Baltic Dry Index, and RMB/USD.
Fractalfract 10 00463 g002
The growing size and fluctuation of D f ( n ) in larger time scales implies that the asymmetry is not constant but increases with horizon, especially in WTI and RMB/USD. Economically, positive scaling in the case of upward movements in the price of oil at longer scales is persistent. It suggests that the upward movements in the price of oil at longer scales are more strongly felt and persistent compared to the downward corrections. Hence it implies they are more strongly and persistently transmitted into production and transport costs. In the case with the Baltic Dry Index, the lack of a constant pattern of asymmetry can be explained by the cyclical and demand-driven nature of shipping markets, where freight rates are not subject to regular asymmetry. The patterns in transition of near symmetry into positive asymmetry at longer horizons in the case of RMB/USD suggest that adjustments to the currency are gradual and directionally skewed and may represent policy management and trade imbalances. The general scale-dependent break of zero, in general, confirms the existence of asymmetric adjustment and nonlinear adjustment mechanisms across the interconnected markets.
Figure 3 reports the generalized Hurst exponent ( h ( q ) ) from Equation (5), which is used to assess persistence, anti-persistence and deviations from weak-form efficiency. It is clear in the generalized Hurst exponent h ( q ) plots that there is a clear dependence across the three markets on q across all the three markets, which supports the existence of multifractality as opposed to a single scaling behavior. The behavior of large fluctuations (right side of the plot) is different than the behavior of small fluctuations (left side), which is a characteristic property of multifractal processes. The extent and trend of decline, however, differ significantly among markets. In WTI, the overall curve declines between about 0.55 at q = 5 to almost 0.25 at q = 5 , with the downward component decreasing sharply to negative values beyond q > 2 , exhibiting strong anti-persistence of large negative fluctuations. Conversely, the Baltic Dry Index presents a more linear and smooth decline of all three curves and lines are parallel, indicating less significant asymmetry. In the case of RMB/USD, the distance between upward and downward curves is large in all q and upward fluctuations are always greater than one at low q and downward fluctuations are always less than 0.7 indicating strong directional heterogeneity.
Figure 3. Asymmetric multifractal generalized Hurst exponents across market conditions.
Fractalfract 10 00463 g003
The level and dispersion of h ( q ) give valuable information about the dynamics and efficiency of the market. The sharp divergence between upward and downward components especially the transition of the downward curve to anti-persistent behavior at higher q occurs in WTI, where positive shocks are more persistent than negative ones. This is an indication of asymmetric adjustment in oil markets, with a decline in prices possibly followed by quick corrections, whilst an increase in prices due to supply constraints or geopolitical risk tends to persist. In the case of the Baltic Dry Index, the comparatively small difference between the upward and downward curves implies that scaling behavior is more symmetric, which is in line with the idea that freight markets are being driven by cyclical but less directionally biased trade dynamics. The ever-increasing upward h ( q ) in relation to downward values in RMB/USD is evidence of the slow and policy-based process of exchange rate adjustment. Overall, the observation that h ( q ) through q varies and that there is an obvious distinction of directional components validates that these markets are not only multifractal, but also asymmetric in processing information, whose implications are relative to predictability, risk asymmetry and market efficiency.
Figure 4 is derived from the multifractal spectrum and spectrum-width calculations in Equations (7) and (8), capturing nonlinear complexity and scaling heterogeneity. A detailed description of the distribution of the scaling exponents across the various levels of fluctuation of WTI, Baltic Dry Index and RMB/USD are given by the multifractal spectra f(α). These three shapes are concave and inverted-U-shaped, and at this stage it can be established that there is multifractality. It has been shown that symmetry and width of spectra are different across markets. WTI’s spectrum indicates a relatively wide and skewed direction. Further downward, the (red) curve is extended to lower α values, and it is an indication of a broader range of scaling behavior of negative fluctuations in the series. The upward (blue) spectrum on the other hand is less wide and located at higher alpha which means that the dynamics are more stable in the upward movements. The spectrums of overall, up and down components are closely aligned and comparatively narrow in the spectra indicating more homogeneous scaling structure with a relatively little amount of asymmetry. In the case of RMB/USD, the range is wide but highly skewed to the right, with the upwards component extending further to larger values of alpha, and the downwards component being more compressed.
Figure 4. Comparative multifractal spectra across overall, upward, and downward trends.
Fractalfract 10 00463 g004
These disparities in width and directional behavior give valuable information on the underlying complexity and directional behavior of the markets. The broader and left-extended spectrum in WTI means that when the market shows downswing, the negative shocks are associated with greater heterogeneity and variability in scaling behavior. The downturns in oil markets are more structurally complex and less predictable than the upward movements. Conversely, the relatively small and symmetric spectrum of the Baltic Dry Index suggests that freight market dynamics are more uniform across the size of fluctuations in response to the gradual and capacity-driven changes in shipping markets. In the case of RMB/USD, the right-skewed spectrum and elongated upward branch indicates that positive movements are smoother and more enduring than negative movements, which is consistent with the dynamics of managed or gradual appreciation of the currency and adjustments of the adjustment policy. In general, the asymmetry of the spectrum supports the existence of nonlinear and asymmetric information processing in these interconnected markets.
Figure 5 applies the AMF-DFA procedure in Equations (2)–(8) to original, shuffled and surrogate series to test the sources and robustness of multifractality. The Δ H ± ( q ) plots compare the asymmetric multifractal strength of the original, shuffled, and surrogate series at different fluctuation orders q, and allow the source of multifractality to be determined. In the WTI panel, the original series (black) exhibits an obvious upwards trend, starting around 0.2 at q = 5 , up to a value of over 0.6 at q = 5 , showing strong and scale-dependent asymmetry. By comparison, the shuffled (blue) and surrogate (red) series are much lower and comparatively flat, indicating that elimination of time dependence results in multifractal strength that is significantly lower and more flattened. In the case of the Baltic Dry Index, all three curves are near zero throughout the entire range of q , with little variation between original, shuffled and surrogate series, which suggest weak multifractality and weak asymmetry. In the RMB/USD panel, the original series begins with a relatively large value (around 0.45 at q = 5 ) and decreases steadily towards 0.2 as q increases, whereas both shuffled and surrogate series have values near zero throughout, which is a strong indication of a significant difference between the original dynamics and the transformed series.
Figure 5. Δ H   ±   ( q ) of the original, shuffled, and surrogated data for WTI, Baltic Dry Index, and RMB/USD.
Fractalfract 10 00463 g005
These trends give a positive indication as to the driving forces behind multifractality. The large disparity between the original and the shuffled and surrogate series in WTI suggests that long-range temporal correlations are the primary source of multifractality, as opposed to effects purely of distribution. This implies that enduring information flows, like supply shocks and geopolitical uncertainty, are driving forces of oil market dynamics, which exhibit long-term asymmetric scaling behavior. In the case of the Baltic Dry Index, the fact that the behavior of all three series near-overlaps suggests that the multifractality is not strong and is instead predominantly due to short-term fluctuations rather than underlying structure, which is consistent with the cyclical and demand-driven nature of freight markets. The pronounced difference between the original and the transformed series in RMB/USD indicates that both the memory and nonlinear structure are contributory to multifractality with the declining pattern across q indicating that asymmetry of small changes is stronger than asymmetry of large changes. This means that adjustments in the exchange rate are more limited to persistent policy and trade-related factors and extreme movements are more constrained, as reflected in the managed currency dynamics and intervention mechanisms.
Figure 6 is based on the multifractal degree measure in Equation (6), using ( h ( q ) ) from Equation (5), to assess scale-dependent market inefficiency. The plots of asymmetric multifractal degree measure (MDM) demonstrate the changing strength of multifractality across time scales of overall, upward and downward fluctuations of WTI, Baltic Dry Index and RMB/USD. In all three markets, the MDM values are the largest at the short time scales (smaller than about 50 days). This suggests the presence of strong multifractal behavior that is caused by short-term market volatility and effects of market microstructure. Increases in the time scale tended to decrease MDM and this indicates that market processes can become less heterogeneous at higher time scales. Nevertheless, the rate and the pattern of this decline vary in different markets. In WTI, past a certain point, say 150–250 days, MDM stabilizes and shows intermittent increases beyond this point. However, the Baltic Dry Index exhibits a monotonic and smooth decrease in all its components, and there is little distance between upward, downward, and overall curves. In the case of RMB/USD, the decrease is less sharp, yet clear partitioning between components, especially at medium scales (around 50–200 days), remains in place with upward fluctuations still being relatively more significant.
Figure 6. Asymmetric multifractal degree measure across time scales.
Fractalfract 10 00463 g006
Such patterns provide valuable information about the dynamic organization of the complexity of the market. The presence of persistence and fluctuations of WTI MDM at longer time scales are indicative of the fact that even at longer time scales, oil markets continue to exhibit structural complexity. This is likely due to the ongoing adjustment of oil markets to supply shocks, geopolitical risks, and demand conditions in energy markets. The increase in the upward and downward MDM indicates that both positive and negative shocks do not contribute equally to the complexity of the long-term dynamics, which supports asymmetric adjustment mechanisms. The constant convergence of all the components in the Baltic Dry Index into low-MDM values implies that multifractality is more of a short-run phenomenon. In the case of RMB/USD, the sustained separation between upward and downward MDM at medium scales indicates persistent directional asymmetry. It shows that the dynamics of the exchange rate are affected by gradual policy interference and trade imbalances as opposed to being driven by pure market adjustments. In general, the time-scale-dependent behavior of MDM confirms that multifractality is most strongly observed in the short term but that the behavior in longer time scales varies across markets, with WTI and RMB/USD showing much more persistent and asymmetric complexity than the relatively stable structure of the Baltic Dry Index.
As an additional robustness check, the variance-ratio test was applied to examine whether the return series follow a random-walk process. The results in Table 2 show that the random-walk null is rejected for the selected markets across several holding periods, providing conventional evidence of departures from weak-form market efficiency. These findings support the AMF-DFA evidence that market efficiency is scale-dependent and varies across market conditions.

4.2. Discussion

Overall, the results show that the these markets display multifractal and asymmetric behavior, but the strength and direction of these patterns differ across markets. The WTI results indicate stronger long-horizon persistence and directional asymmetry, suggesting that oil price shocks are processed unevenly across upward and downward regimes. This is consistent with the Adaptive Market Hypothesis, which argues that market efficiency changes across market conditions rather than remaining fixed. The RMB/USD results also show clear scale-dependent and asymmetric behavior, reflecting gradual adjustment in exchange rate dynamics. In contrast, the Baltic Dry Index shows weaker and less stable asymmetry, suggesting that freight market dynamics are more cyclical and capacity-driven.
These findings support the main argument of the study that market efficiency in oil, freight and exchange rate markets is not uniform across time scales or directional regimes. The evidence from the generalized Hurst exponents, multifractal spectra, shuffled/surrogate comparisons and multifractal degree measures indicates that deviations from weak-form efficiency are linked to persistence, nonlinear dependence and asymmetric adjustment. The results are also consistent with previous multifractal finance studies showing that commodity, energy and exchange rate markets may exhibit heterogeneous scaling behavior, especially during periods of uncertainty and structural change.

5. Conclusions

This paper explores the multifractal and asymmetric characteristics of oil, freight, and exchange rate prices in the global system of trade by using the AMF-DFA framework. The results strongly support the existence of multifractality, scale-dependent efficiency and directional asymmetry in all the three markets. These findings suggest that the behavior of markets cannot be wholly accounted for by traditional linear models or the rigid assumptions of weak-form efficiency. Rather, it is the dynamic perspective of market efficiency that can find persistence, nonlinearity, and asymmetry to be innate characteristics of changing market structures.
The findings indicate that there is evident heterogeneity amongst markets. At longer time scales in the oil market, there is high asymmetry and multifractal intensity. It also has the persistence of response to structural shocks such as geopolitical uncertainty and supply disruption. On the other side, the Baltic Dry Index indicates a relatively less strong multifractality but more symmetric dynamics. These are in line with capacity-driven and cyclic nature of freight markets. The exchange rate of RMB/USD exhibits intermediate behaviors which are characterized by long-run multifractality and directional asymmetry, especially at medium horizons, indicating gradual and policy-influenced adjustment processes.
More detailed analysis suggests that the long-range temporal dependence is one of the main factors that contributes to the multifractality in the oil and exchange rate markets whereas the dynamics of the freight market are more affected by short-term fluctuations. The persistence of the positive and negative divergence between upward and downward components in various measures proves that the market reaction to the positive and negative shocks is inherently asymmetric. This means that the persistence and transmission of shocks not only depend on the magnitude of the shock but also on the direction of the shock, which is a limitation of symmetric modeling frameworks.
Overall, the results indicate that the oil–freight–exchange rate nexus is a complex adaptive system that has nonlinear, asymmetric and scale-dependent dynamics. Practically, this means that traditional models might not be sensitive to persistence and risk, especially in times of economic uncertainty. Although the analysis is conducted separately for each market, it does not formally estimate cross-market spillovers, cross-correlations or transmission mechanisms; future research may extend this framework using joint scaling, spillover analysis, transfer entropy or cross-correlation-based multifractal methods. The results assist in developing a more nuanced picture of the issues of market behavior and highlight the necessity of the inclusion of multifractal and asymmetric strategies into the analysis of the global markets related to the issue of trade. Although the study focuses on the post-COVID-19 period from 2021 to 2024 and does not provide a full historical comparison of market efficiency before and after COVID-19, future research may extend the analysis using longer samples and explicit pre/post-COVID comparisons.

Author Contributions

Conceptualization, F.H.; methodology, F.H.; formal analysis, F.H.; data curation, M.J.; writing—original draft preparation, F.H. and M.J.; writing—review and editing, F.H. and M.J.; funding acquisition, F.H. All authors have read and agreed to the published version of the manuscript.

Funding

This study was supported by Wuhan Business University. The funding details are as follows: Wuhan Business University Doctoral Scientific Research Fund Program, grant number 2025KB010.

Data Availability Statement

The original contributions presented in the study are included in the article. Further inquiries can be directed to the corresponding author.

Conflicts of Interest

The authors declare no conflicts of interest.

Abbreviations

The following abbreviations are used in this manuscript:
AMF-DFAAsymmetric Multifractal Detrended Fluctuation Analysis
MF-DFAMultifractal Detrended Fluctuation Analysis
WTIWest Texas Intermediate
BDIBaltic Dry Index
EMHEfficient Market Hypothesis
AMHAdaptive Market Hypothesis
MDMMultifractal Degree Measure

References

  1. Cont, R. Empirical properties of asset returns: Stylized facts and statistical issues. Quant. Financ. 2001, 1, 223–236. [Google Scholar] [CrossRef]
  2. Di Matteo, T. Multi-scaling in finance. Quant. Financ. 2007, 7, 21–36. [Google Scholar] [CrossRef]
  3. Lo, A.W. The Adaptive Markets Hypothesis: Market efficiency from an evolutionary perspective. J. Portf. Manag. 2004, 30, 15–29. [Google Scholar] [CrossRef]
  4. Reboredo, J.C. Modelling oil price and exchange rate co-movements. J. Policy Model. 2012, 34, 419–440. [Google Scholar] [CrossRef]
  5. Mensi, W.; Tiwari, A.K.; Yoon, S.M. Global financial crisis and weak-form efficiency of Islamic sectoral stock markets: An MF-DFA analysis. Phys. A-Stat. Mech. Its Appl. 2017, 471, 135–146. [Google Scholar] [CrossRef]
  6. Tiwari, A.K.; Albulescu, C.T.; Gupta, R. Time–frequency relationship between US output with commodity and asset prices. Appl. Econ. 2016, 48, 227–242. [Google Scholar] [CrossRef]
  7. Bakshi, G.; Panayotov, G.; Skoulakis, G. The Baltic Dry Index as a predictor of global stock returns, commodity returns, and global economic activity. Commod. Returns Glob. Econ. Act. 2010. [Google Scholar] [CrossRef]
  8. Baruník, J.; Krištoufek, L. On Hurst exponent estimation under heavy-tailed distributions. Phys. A Stat. Mech. Its Appl. 2010, 389, 3844–3855. [Google Scholar] [CrossRef]
  9. Jiang, Z.Q.; Xie, W.J.; Zhou, W.X.; Sornette, D. Multifractal analysis of financial markets: A review. Rep. Prog. Phys. 2019, 82, 125901. [Google Scholar] [CrossRef] [PubMed]
  10. Wan, P.; Mujtaba, G.; Ashfaq, S.; Liangrong, S.; Nasir, R.M. Are rare earth stocks efficient? Novel insights using asymmetric MF-DFA. Financ. Innov. 2025, 11, 49. [Google Scholar] [CrossRef]
  11. Fama, E.F. Efficient capital markets: A review of theory and empirical work. J. Financ. 1970, 25, 383–417. [Google Scholar] [CrossRef]
  12. Urquhart, A.; Hudson, R. Efficient or adaptive markets? Evidence from major stock markets using very long run historical data. Int. Rev. Financ. Anal. 2013, 28, 130–142. [Google Scholar] [CrossRef]
  13. Noda, A. A test of the Adaptive Market Hypothesis using a time-varying AR model. Financ. Res. Lett. 2016, 17, 66–71. [Google Scholar] [CrossRef]
  14. Mandelbrot, B.B. Fractals and Scaling in Finance: Discontinuity, Concentration, Risk; Springer: New York, NY, USA, 1997. [Google Scholar] [CrossRef]
  15. Kantelhardt, J.W.; Zschiegner, S.A.; Koscielny-Bunde, E.; Havlin, S.; Bunde, A.; Stanley, H.E. Multifractal detrended fluctuation analysis of nonstationary time series. Phys. A Stat. Mech. Its Appl. 2002, 316, 87–114. [Google Scholar] [CrossRef]
  16. Kristoufek, L. Fractal markets hypothesis and the global financial crisis. Phys. A Stat. Mech. Its Appl. 2012, 391, 5102–5110. [Google Scholar] [CrossRef]
  17. Tabak, B.M.; Cajueiro, D.O. Are the crude oil markets becoming weakly efficient over time? Energy Econ. 2007, 29, 28–36. [Google Scholar] [CrossRef]
  18. He, L.Y.; Chen, S.P. Are crude oil markets multifractal? Evidence from MF-DFA and MF-SSA perspectives. Phys. A Stat. Mech. Its Appl. 2010, 389, 3218–3229. [Google Scholar] [CrossRef]
  19. Mensi, W.; Sensoy, A.; Vo, X.V.; Kang, S.H. Impact of COVID-19 on asymmetric multifractality of gold and oil prices. Resour. Policy 2020, 69, 101829. [Google Scholar] [CrossRef] [PubMed]
  20. Kumeka, T.T.; Uzoma-Nwosu, D.C.; David-Wayas, M.O. The effects of COVID-19 on the interrelationship among oil prices, stock prices and exchange rates in selected oil exporting economies. Resour. Policy 2022, 77, 102744. [Google Scholar] [CrossRef] [PubMed]
  21. Carrière-Swallow, Y.; Deb, P.; Furceri, D.; Jimenez, D.; Ostry, J.D. Shipping costs and inflation. J. Int. Money Financ. 2023, 130, 102771. [Google Scholar] [CrossRef] [PubMed]
  22. Alvarez-Ramirez, J.; Alvarez, J.; Rodriguez, E.; Fernandez-Anaya, G. Time-varying Hurst exponent for US stock markets. Phys. A Stat. Mech. Its Appl. 2008, 387, 6159–6169. [Google Scholar] [CrossRef]
  23. Cajueiro, D.O.; Tabak, B.M. The Hurst exponent over time: Testing the assertion that emerging markets are becoming more efficient. Phys. A Stat. Mech. Its Appl. 2004, 336, 521–537. [Google Scholar] [CrossRef]
  24. Xu, C.; Jia, T.; Zhang, Y.; Zhao, X. How Do Climate Risks Affect Market Efficiency of New Energy Industry Chain? Evidence from Multifractal Characteristics Analysis. Fractal Fract. 2026, 10, 127. [Google Scholar] [CrossRef]
  25. Ferraro, D.; Rogoff, K.; Rossi, B. Can oil prices forecast exchange rates? J. Int. Money Financ. 2015, 54, 116–141. [Google Scholar] [CrossRef]
  26. Ji, Q.; Liu, B.Y.; Fan, Y. Risk dependence of CoVaR and structural change between oil prices and exchange rates: A time-varying copula model. Energy Econ. 2019, 77, 80–92. [Google Scholar] [CrossRef]
  27. Han, L.; Wan, L.; Xu, Y. Can the Baltic Dry Index predict foreign exchange rates? Financ. Res. Lett. 2020, 32, 101157. [Google Scholar] [CrossRef]
  28. UNCTAD. Review of Maritime Transport 2021; United Nations: Geneva, Switzerland, 2021. [Google Scholar] [CrossRef]
  29. Pulido, S. Pandemic-Induced Increases in Container Freight Rates: Assessing Their Domestic Effects in a Globalized World. BIS Work. Papers 2023, 1132. Available online: https://ideas.repec.org/p/gii/giihei/heidwp24-2022.html (accessed on 1 October 2023).
  30. Khan, K.; Khurshid, A.; Cifuentes-Faura, J. The dynamic interaction between oil prices and freight rates in maritime trade: A bootstrap rolling window approach. Eur. Transp. Res. Rev. 2025, 17, 55. [Google Scholar] [CrossRef]
  31. Shahzad, S.J.H.; Bouri, E.; Kayani, G.M.; Nasir, R.M.; Kristoufek, L. Are clean energy stocks efficient? Asymmetric multifractal scaling behaviour. Phys. A Stat. Mech. Its Appl. 2020, 550, 124519. [Google Scholar] [CrossRef]

Table 1. Computational basis and interpretation of empirical results.
Empirical ResultComputational BasisRelated FigureInterpretation
AMF-DFA fluctuation functionsProfile construction, detrending and fluctuation scaling based on Equations (2)–(5)Figure 1Tests whether the return series exhibit scale-dependent fluctuation behavior across different time horizons.
Excess asymmetryDifference between upward and downward fluctuation functions across scalesFigure 2Identifies whether positive and negative market movements follow different scaling patterns.
Generalized Hurst exponentsGeneralized Hurst exponent h ( q ) obtained from the power-law scaling relationshipFigure 3Evaluates persistence, anti-persistence and departures from weak-form market efficiency.
Multifractal spectraLegendre transformation and spectrum-width calculation based on Equations (7) and (8)Figure 4Measures the heterogeneity, complexity and asymmetry of multifractal behavior.
Original, shuffled and surrogate comparisonComparison of multifractal behavior across original and transformed seriesFigure 5Provides robustness evidence on whether multifractality is driven by temporal dependence, distributional properties or nonlinear structure.
Asymmetric multifractal degree measureDirectional multifractal strength across time scalesFigure 6Assesses the degree of asymmetric market inefficiency across overall, upward and downward market regimes.
Table 2. Variance-ratio test for weak-form market efficiency.
MarketHorizonVR(q)Z-Statisticp-ValueDecision at 5%
RMB/USD21.01110.00740.9941Do not reject random walk
RMB/USD40.9857−0.00530.9958Do not reject random walk
RMB/USD81.08150.01910.9848Do not reject random walk
RMB/USD161.23740.03740.9701Do not reject random walk
Baltic Dry Index21.62230.37670.7064Do not reject random walk
Baltic Dry Index42.34720.47930.6317Do not reject random walk
Baltic Dry Index83.08450.51700.6052Do not reject random walk
Baltic Dry Index163.75810.50310.6149Do not reject random walk
WTI21.01300.01180.9906Do not reject random walk
WTI40.9430−0.02590.9793Do not reject random walk
WTI80.8132−0.05160.9589Do not reject random walk
WTI160.6980−0.05580.9555Do not reject random walk
Note: The variance-ratio test examines the null hypothesis that returns follow a random-walk process. The reported p-values are based on heteroskedasticity-robust test statistics. Rejection of the null indicates departures from weak-form market efficiency.
Disclaimer/Publisher’s Note: The statements, opinions and data contained in all publications are solely those of the individual author(s) and contributor(s) and not of MDPI and/or the editor(s). MDPI and/or the editor(s) disclaim responsibility for any injury to people or property resulting from any ideas, methods, instructions or products referred to in the content.