Article

Fractal Metrics and Pore Architecture as Determinants of Diffusion in High-Rank Coal Reservoirs of the Mengjin Coalfield, Henan Province

1
Key Laboratory of Coalbed Methane Resources and Reservoir Formation Process of the Ministry of Education, China University of Mining and Technology, Xuzhou 221008, China
2
Key Laboratory of Tectonics and Petroleum Resources of Ministry of Education, China University of Geosciences, Wuhan 430074, China
3
Department of Energy and Mineral Engineering, G3 Centre and Energy Institute, The Pennsylvania State University, University Park, PA 16802, USA
*
Author to whom correspondence should be addressed.
Fractal Fract. 2026, 10(5), 329; https://doi.org/10.3390/fractalfract10050329
Submission received: 1 April 2026 / Revised: 28 April 2026 / Accepted: 9 May 2026 / Published: 11 May 2026
(This article belongs to the Special Issue Multiscale Fractal Analysis in Unconventional Reservoirs, 2nd Edition)

Abstract

Understanding the pore structure of high-rank coals is essential in evaluating gas storage and transport. Here, twelve semianthracite samples from the early Permian Shanxi Formation were investigated by proximate analysis, optical microscopy, low-temperature N2 adsorption, and fractal analysis, coupled with diffusion coefficient modeling. The coals exhibit diverse pore types (plant-cellular, interparticle, and dissolution pores) shaped by coalification and minerals and show Type IV (a) isotherms with H4 hysteresis loops, indicating complex pore networks. Pore-size partitioning reveals that mesopores and macropores dominate total pore volume, whereas mesopores contribute most of the specific surface area. The pore structure exhibits strong fractal characteristics with an average comprehensive fractal dimension (Fc) of 2.628. The calculated gas diffusion coefficient decreases monotonically with increasing pressure from 1 MPa to 5.8 MPa, with a more pronounced decline at low pressure, indicating a clear pressure-dependent attenuation effect. Diffusion capacity is weakly related to average pore diameter but shows positive correlations with total pore volume and, particularly, macropore volume. Multiple linear regression further demonstrates that pore volume structure is the dominant control on diffusion under both low- and high-pressure conditions, with the relative importance ranked as macropores > mesopores > micropores. Macropores provide the main low-resistance transport framework, mesopores serve as transitional pathways linking storage and transport domains, whereas micropores mainly contribute to gas storage and may even suppress apparent diffusion when overly developed. These results reveal a clear functional differentiation of multiscale pore systems and highlight that gas migration in semianthracite is jointly governed by pore size distribution, connectivity, tortuosity, and fractal network topology.

1. Introduction

Coal is a porous carbon-based organic material, characterized by significant structural heterogeneity and amorphous characteristics [1,2]. Its intricate pore system, featuring complex and irregular surface morphology, profoundly influences critical physical properties and processes within coal seams, including the adsorption, storage, and production of coalbed methane (CBM) [3,4,5,6,7]. Understanding the relationship between coal pore structure and gas diffusion is crucial for optimizing CBM recovery and predicting long-term depletion [8,9].
Characterizing the pore structure of coal is essential in understanding its gas storage and transport properties [10]. A diverse range of experimental techniques and analytical methods can be applied to investigate the fractal properties of coal pore structure. Common techniques include direct imaging and scattering methods such as transmission electron microscopy (TEM) [11], scanning electron microscopy (SEM) [12], small-angle X-ray scattering (SAXS) [13], small-angle neutron scattering (SANS) [14], nuclear magnetic resonance (NMR) [15,16], atomic force microscopy (AFM) [17,18], and synchrotron-based nano-CT [19,20]. Furthermore, methods based on adsorption or intrusion, such as low-temperature nitrogen (N2) adsorption, low-pressure carbon dioxide (CO2) adsorption, and mercury intrusion porosimetry (MIP), are extensively used to derive fractal dimensions [1,21,22,23,24]. Low-temperature N2 adsorption is widely used, providing valuable information on pore size distribution, surface area, and pore volume within those pore fractions [21,23]. The shape of the N2 adsorption–desorption isotherms and hysteresis loops also provide insights into pore morphology, such as the prevalence of slit-shaped pores, commonly observed in coal [25]. However, the complex and irregular nature of coal pore surfaces often renders traditional Euclidean geometry inadequate for describing their structure [26]. Fractal geometry provides a powerful tool to quantify the heterogeneity of pore surfaces and volumes [27,28,29,30,31], with higher values indicating a more tortuous and heterogeneous volume-filling pore network [26]. Experimental evidence from numerous studies suggests that coal pores exhibit distinct fractal characteristics [32,33,34], making fractal analysis a valuable tool for understanding their complex geometry. The Frenkel–Halsey–Hill (FHH) model, based on N2 sorption data, is commonly used for determining the fractal dimension of coal [33,35].
Gas diffusion in coal is a complex process influenced by both Knudsen diffusion and bulk diffusion [36,37,38]. The pore structure of coal plays a critical role in determining the dominant diffusion mechanism and the overall gas diffusion coefficient [39,40,41]. Pore-structure-based models have been proposed to estimate the pressure-dependent diffusion coefficient for fractal coals [42], integrating Knudsen and bulk diffusion influxes to define the overall gas transport process. Such a model uses pore structure parameters of porosity, pore size distribution, and fractal dimension as inputs to predict the pressure-dependent gas diffusion behavior, highlighting the importance of pore morphological complexity in defining diffusion for different coals. The hierarchical nature of the pore structure of coal, with micropores, mesopores, and macropores contributing differently to gas storage and transport [3,39], further influences the diffusion process. However, while such existing models effectively integrate pore structure parameters to predict diffusion behavior [42], they often rely on theoretical fractal descriptions and may not fully capture the nuanced, multiscale contributions of real pore networks. Direct experimental evidence ground-truthing specific pore structure characteristics—particularly across different scales—against measured diffusion coefficients remains limited. A comprehensive understanding of how the distribution of micropores, mesopores, and macropores collectively governs the transition between Knudsen and bulk diffusion regimes is essential in accurately predicting gas transport in heterogeneous coal matrix. Consequently, this study aims to quantify the pore structure characteristics and determine the fractal dimension of high-rank coal based on N2 adsorption data, establish quantitative correlations between pore structure parameters, fractal dimension and gas diffusion coefficient, and ultimately develop a predictive model to estimate gas diffusion coefficient. These findings provide valuable insights for predicting gas transport in CBM reservoirs and in optimizing gas recovery strategies.

2. Geological Background

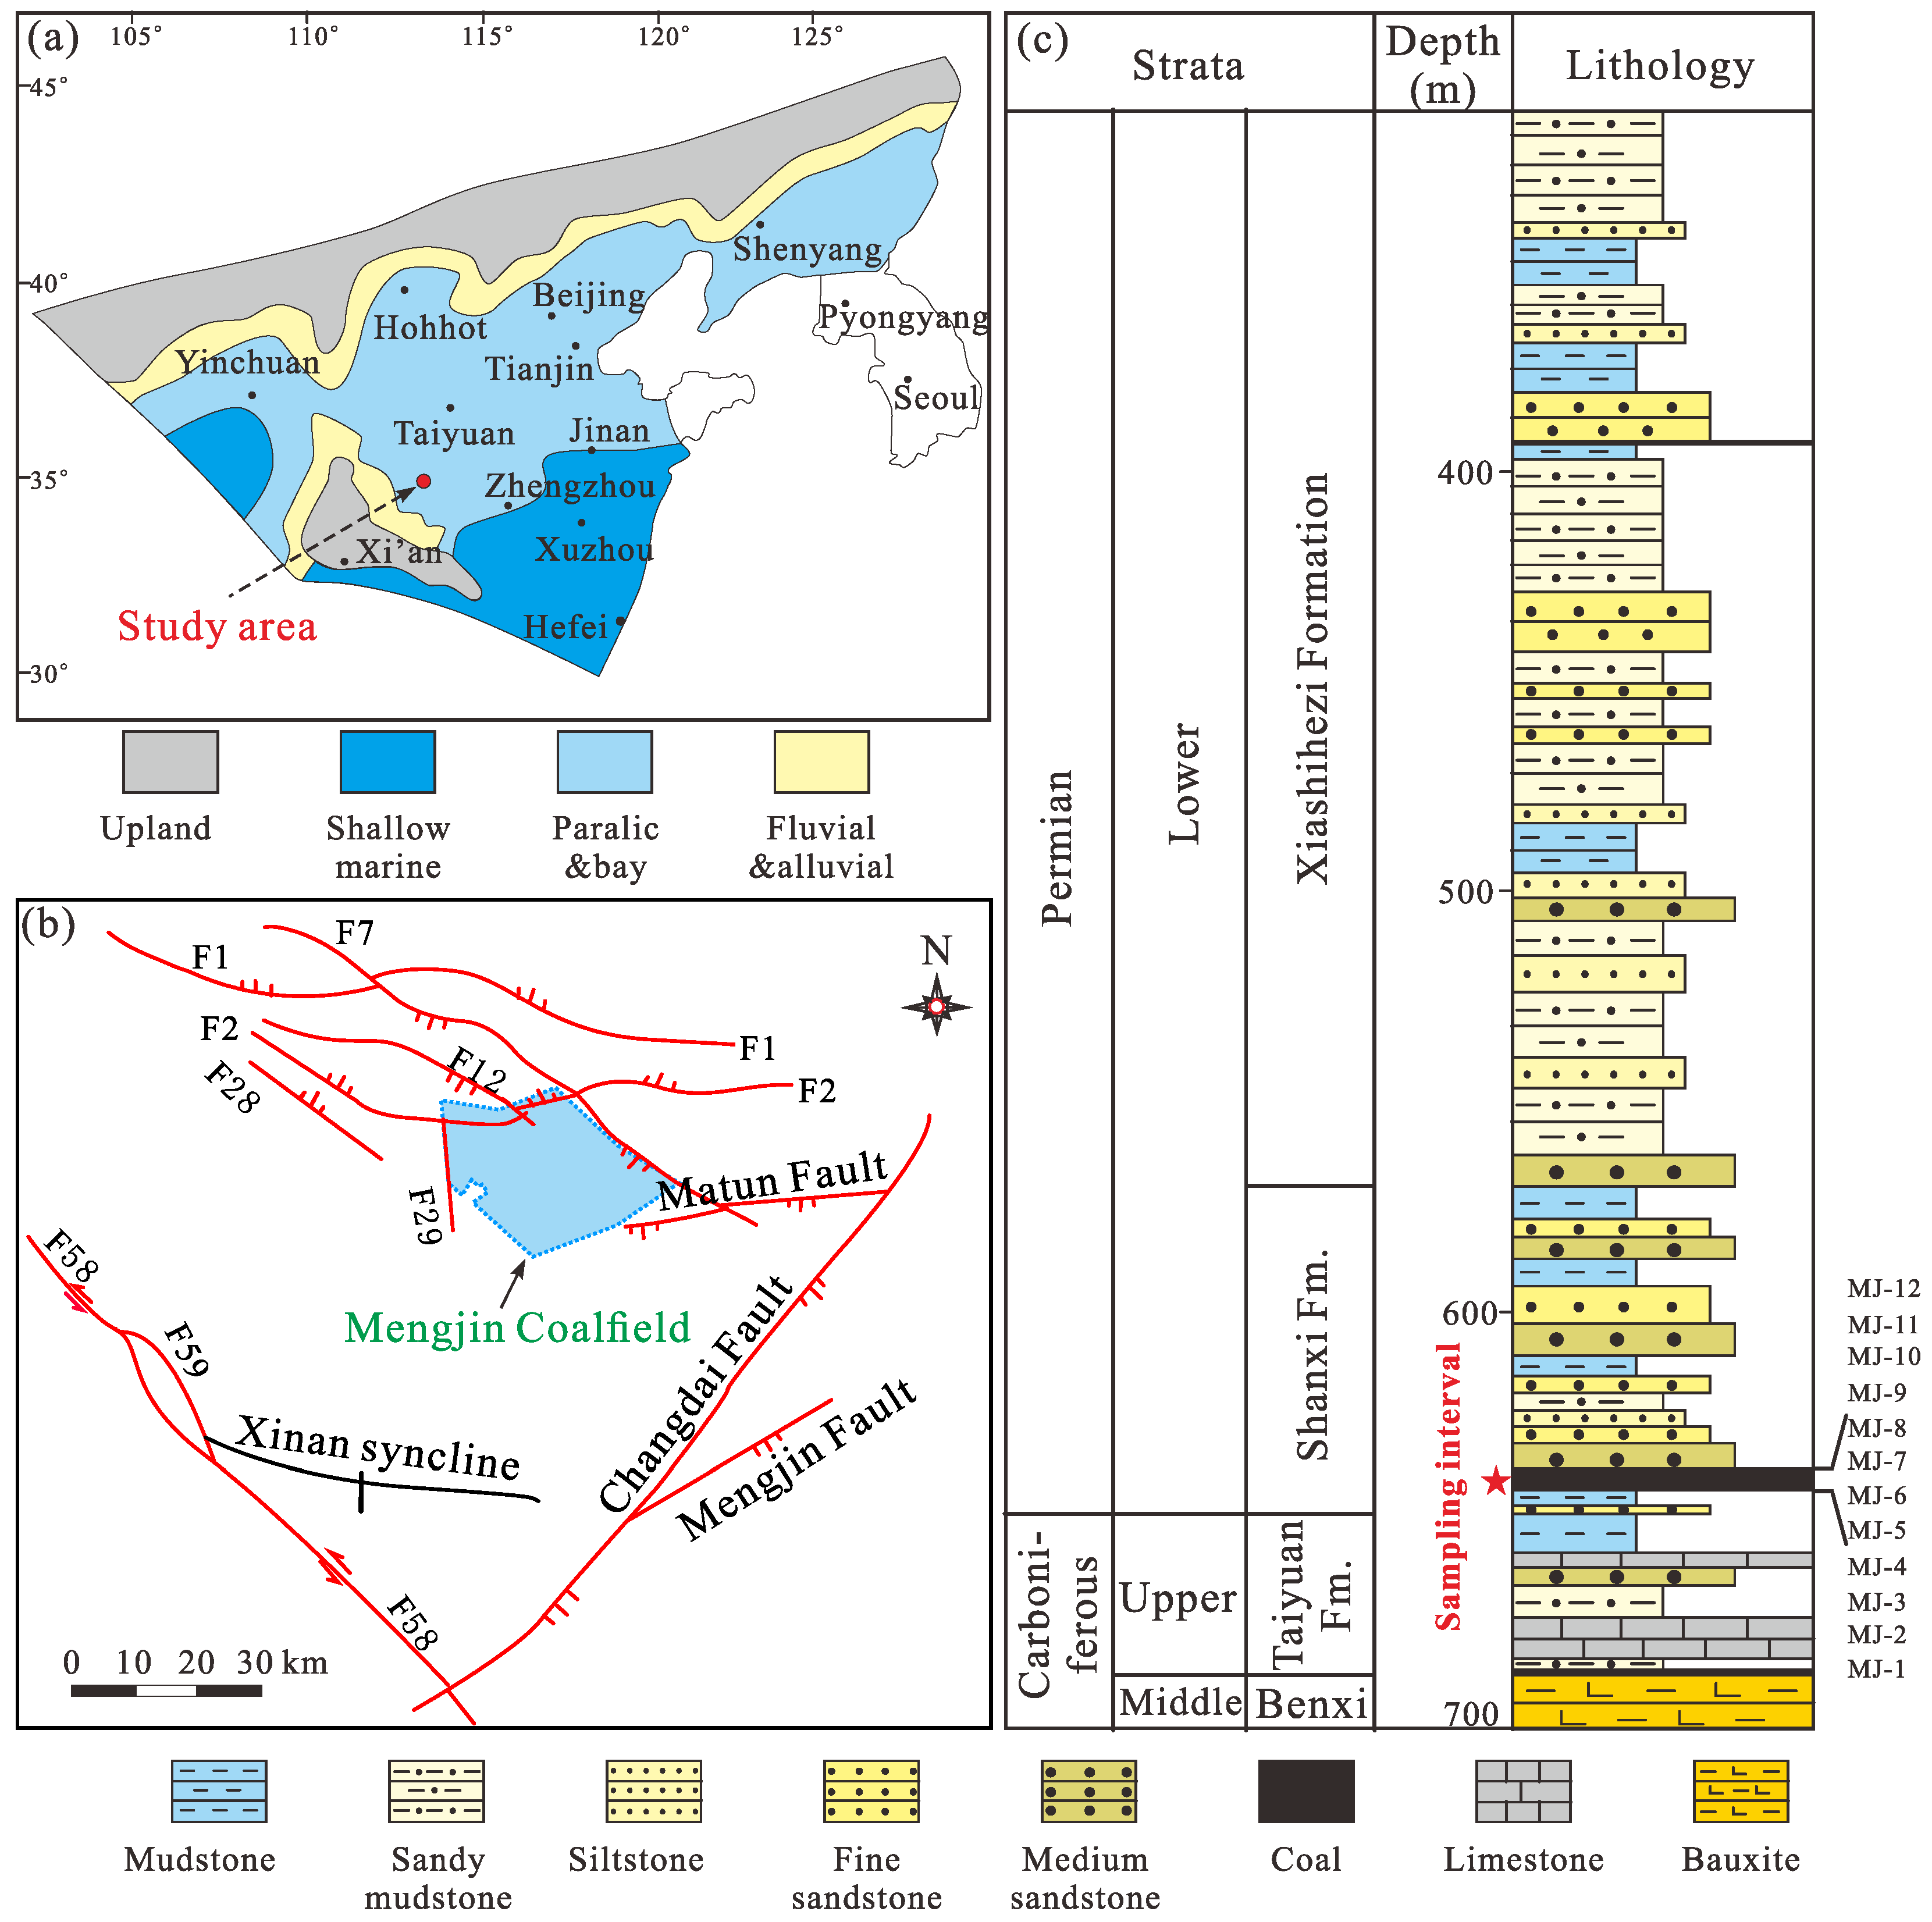
During the late Paleozoic, the north China region was dominated by a paralic and shallow marine environment (Figure 1a). The resulting middle to lower Permian sedimentary sequence comprises the Taiyuan, Shanxi, lower Shihezi, and upper Shihezi Formations upwards [43]. The Mengjin Coalfield, located in the western part of Henan Province, occupies the southern margin of the late Paleozoic giant depression basin controlled by fault systems active in north China (Figure 1b) [44]. The primary coal-bearing strata are constrained within the late Carboniferous Taiyuan Formation and the early Permian Shanxi Formation (Figure 1c), which are stably distributed and serve as a prolific producer of CBM in China [45]. Current mining operations predominantly target the No. 21 coal seam, located in the lower Shanxi Formation, which maintains an average thickness of ~2.5 m [46]. The considerable thickness of this specific seam is plausibly attributed to localized, relatively rapid subsidence within a formative delta plain setting [47].

3. Samples and Methods

3.1. Sample Collection

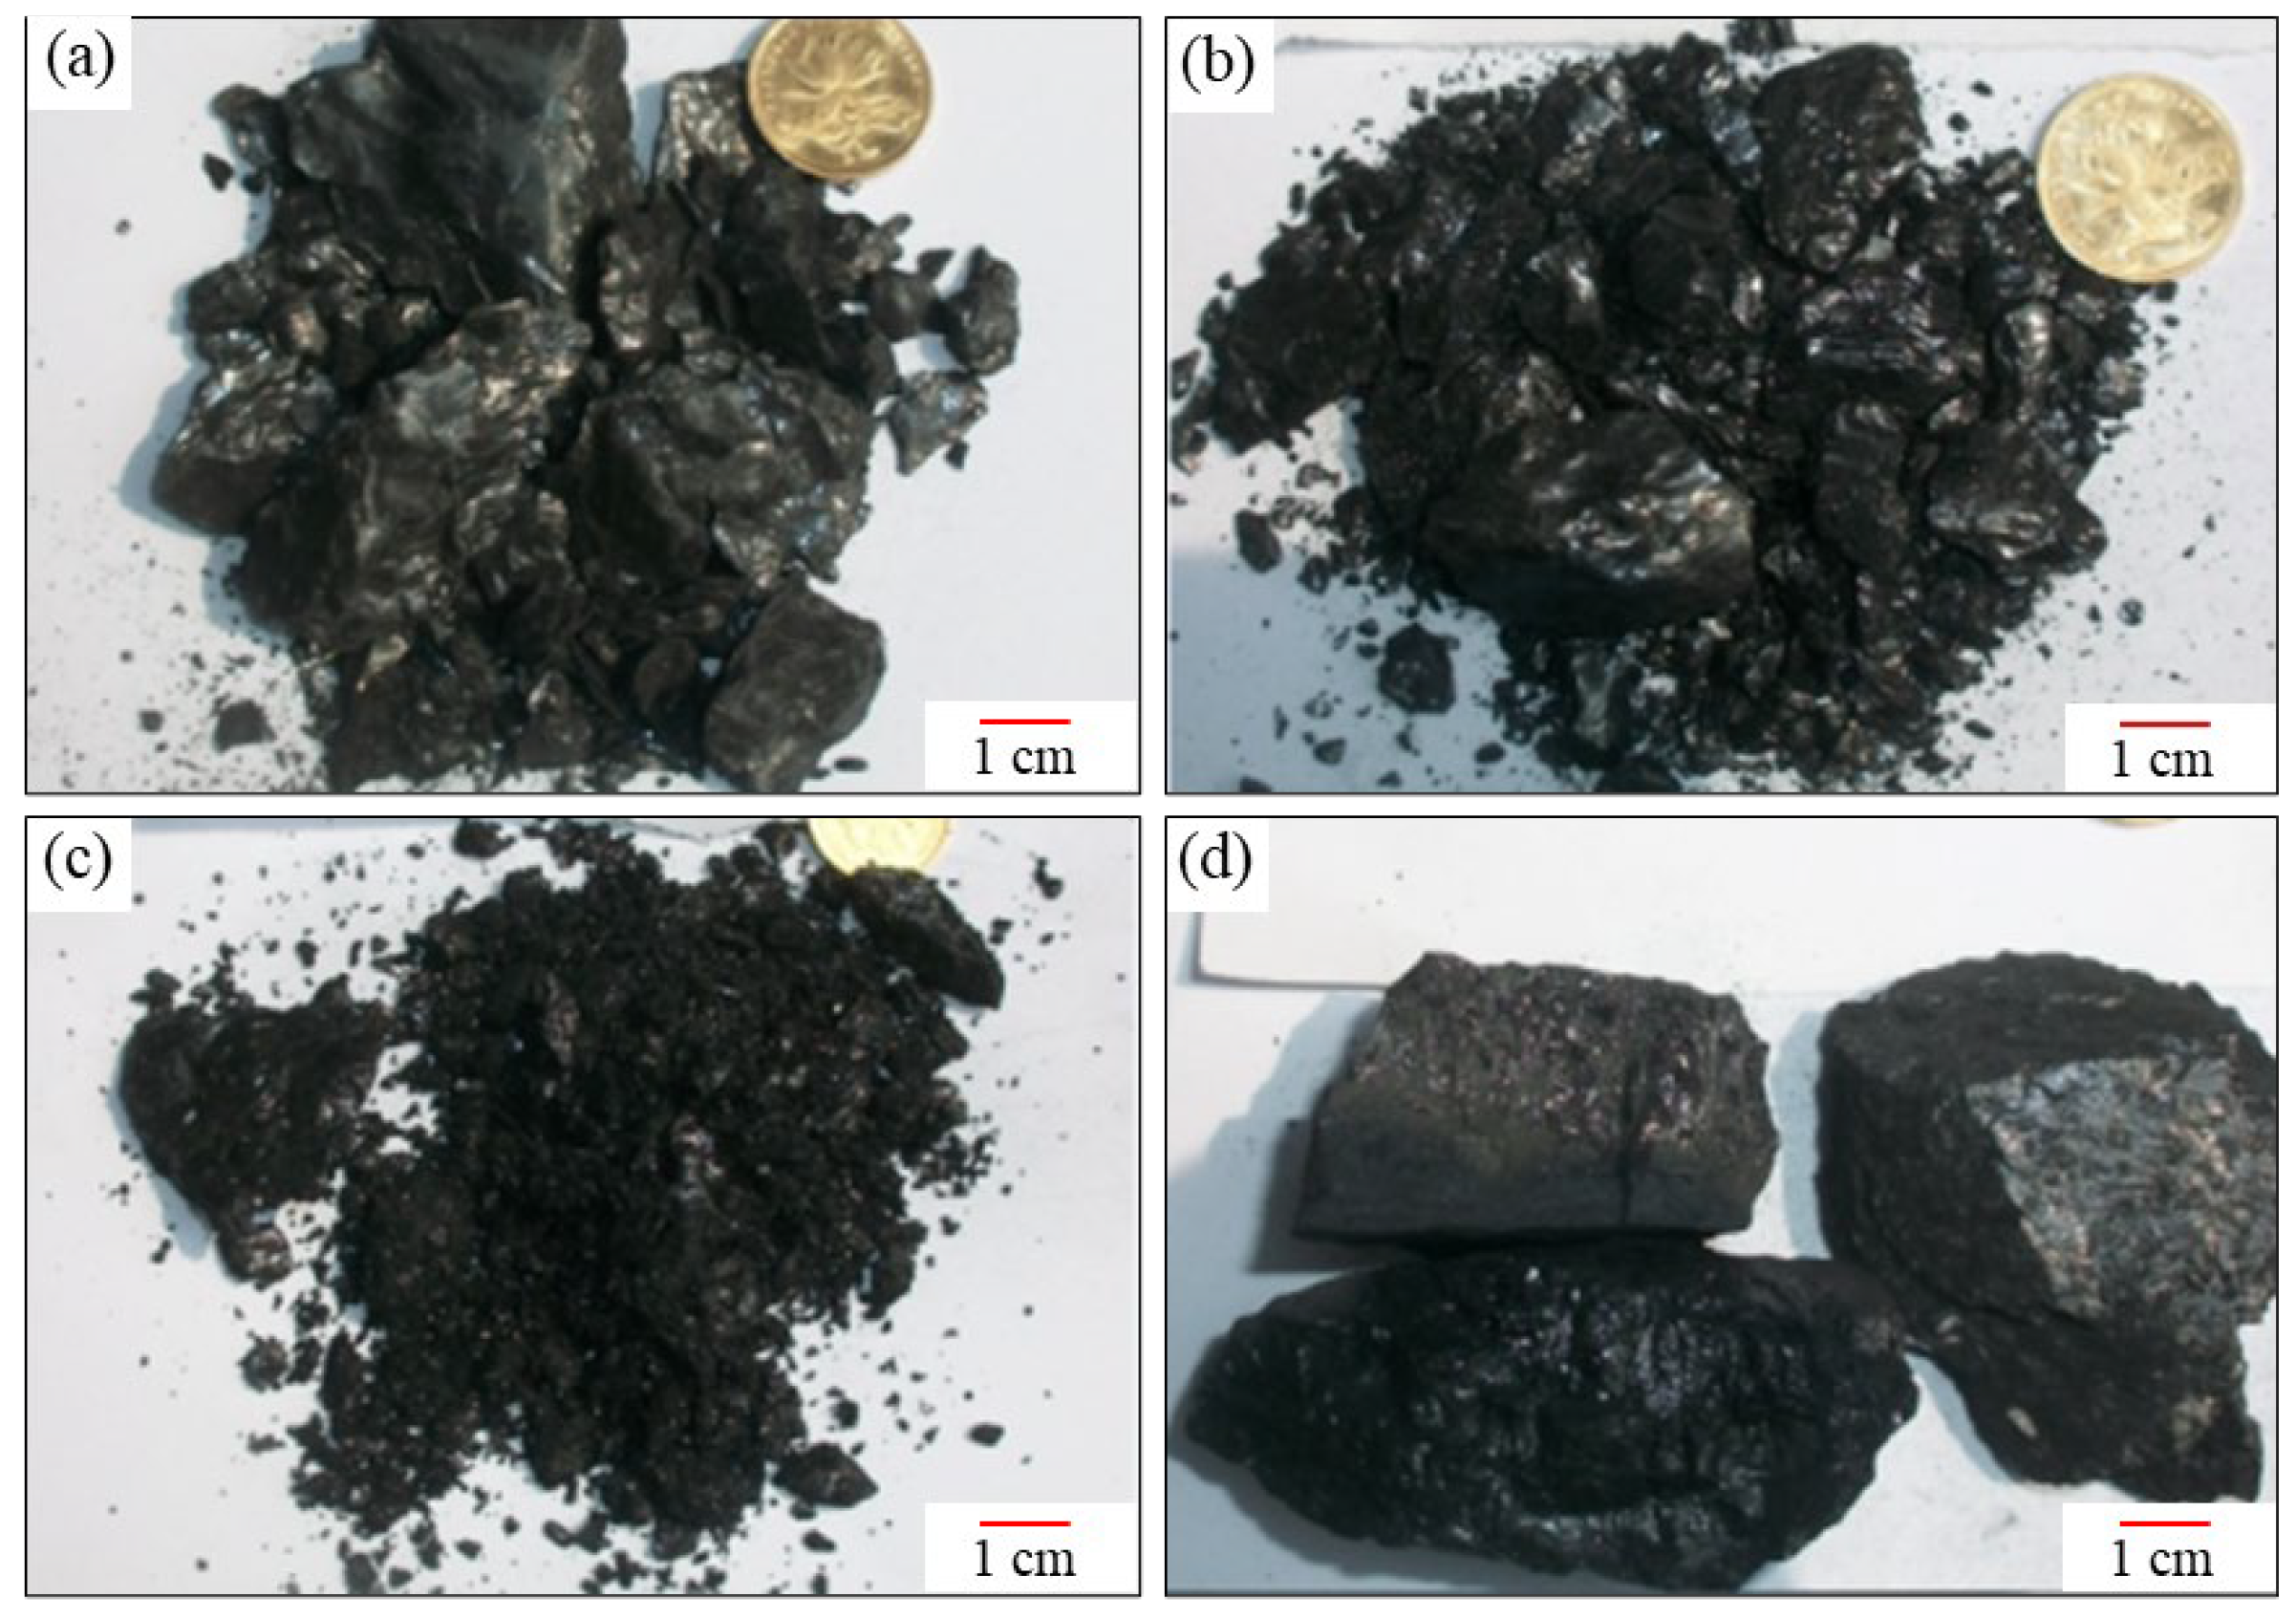
Twelve block coal (labeled MJ-1 to MJ-12 in upward stratigraphic order) were collected from the No. 21 coal seam with a sampling spacing of 20 cm in the Mengjin Coalfield. The No. 21 seam, situated in the lower member of the Permian Shanxi Formation, represents the primary commercially exploited coal horizon in this region. Macroscopically, the hand specimens predominantly consist of bright coal and semi-bright coal lithotypes. Upon examination of their polished surfaces, modification of primary structures was observed across all samples, manifesting as granulated texture, scaly structure, or sheet textures (Figure 2). Samples were carefully packaged to ensure preservation of structural and compositional integrity during subsequent laboratory analysis. All experimental work was conducted at China University of Geosciences (Wuhan).

3.2. Proximate and Petrographic Analysis

Proximate analysis (moisture content, ash yield, and volatile matter yield) followed Chinese National Standard GB/T 212-2008 [49]. Coal maceral composition (vitrinite, inertinite, and liptinite content) was determined following Chinese National Standard GB/T 8899-2013 [50]. Vitrinite reflectance analysis was performed according to Chinese National Standard GB/T 6948-2008 [51] to assess coal rank. For each sample, at least 50 random reflectance measurements were obtained. Three reflectance standards, yttrium–aluminum–garnet (YAG) (0.89%), gadolinium–gallium–garnet (GGG) (1.71%), and cubic zirconia (CZ) (3.16%) were used for calibration [39].

3.3. Low-Temperature Nitrogen Adsorption

Low-temperature nitrogen (N2) adsorption–desorption experiments were conducted at −196 °C on a Micromeritics ASAP 2020 Surface Area and Porosity Analyzer to characterize the pore (~1.9 nm to ~400 nm) structure of the coal samples. Prior to analysis, samples were crushed to a particle size of 60–80 mesh. The crushed samples (~2 g) were then dried in a drying oven at 110 °C for 4 h to remove free moisture, followed by degassing under vacuum at 70 °C for 12 h to remove adsorbed gases and remaining moisture. Adsorption–desorption isotherms were obtained over a relative pressure (P/P0) range from approximately 0.03 to 0.99. The Brunauer–Emmett–Teller (BET) model was applied to the adsorption data (typically in the relative pressure range of 0.05–0.35) to calculate the pore surface area. The Barrett–Joyner–Halenda (BJH) method based on the Kelvin equation was employed to calculate the pore volume and pore size distribution from the desorption branch of the isotherm [52].

3.4. Calculation of Fractal Dimension

The Frenkel–Halsey–Hill (FHH) model is a widely utilized method for fractal analyses based on low-temperature N2 adsorption data [53,54,55]. However, a critical evaluation of its underlying assumptions is essential when applying it to intrinsically heterogeneous materials like coal. The FHH model can be defined as:
ln   V = C + A [ ln   ( ln ( P 0 / P ) ) ]
where P0 is the N2 saturation pressure, MPa; P is the equilibrium pressure, MPa; V is the volume of adsorbed N2 at equilibrium pressure P, cm3/g; and C is a constant. The value of A is linked with the adsorption mechanism and fractal dimension, which is the slope of the ln V versus ln [ln (P0/P)]. There are two ways to calculate the fractal dimension F from the slope A corresponding to different adsorption stages. A key ambiguity in the FHH application lies in the choice between two relationships linking the slope A to the fractal dimension.
When solid–gas molecular interaction dominates the adsorption process (such as van der Waals interactions), the relationship between A and F is:
F 1 = 3 A + 3
When liquid–gas surface interaction dominates the adsorption process (such as capillary condensation), the relationship between A and F is:
F 2 = A + 3
However, the F value calculated by Equation (2) has been shown in previous studies to underestimate the fractal dimension (<2) due to its reliance on monolayer adsorption theory [33,56,57,58]. Since the FHH model, which is primarily designed for multilayer adsorption, is incompatible with classical fractal geometry theory, this study employed Equation (3) to determine the fractal dimension of coal pore structures. The FHH model has inherent assumptions regarding the fractal uniformity and interconnectedness of the pore system. The model presumes a chemically homogeneous surface, yet coal is a composite of diverse organic macerals and inorganic minerals. When the actual pore structure deviates from these assumptions, such as containing a large proportion of non-fractal regions, extremely heterogeneous size distributions, or exhibiting significant geometric confinement effects, its applicability may be affected, and the calculated fractal dimension may require cautious interpretation [59]. Previous study pointed out that it is applied to the heterogeneous pore structures of in situ coal, with its typical applicable pore size range being 8–217 nm [60]. Consequently, the model’s applicability decreases for pore regions that fall outside this range or for structures where the fractal law is not observed within this specific scale.
Furthermore, a weighted average, in accordance with the pore volume ratio for the comprehensive fractal dimensions of different diameter distributions, is adopted [61]. The adopted relation is:
F c = F i · R i
where Fc is the comprehensive fractal dimension; Fi is the corresponding fractal dimension of the ith pore diameter distribution segment; Ri is the corresponding pore volume ratio of the corresponding diameter distribution segment and i, a positive integer, is the ith diameter distribution segment. Crucially, the Fc is treated as a semi-quantitative index that holistically captures the combined effects of surface roughness, tortuosity, and network complexity.

4. Results and Discussion

4.1. Basic Characteristics

The characteristics of the coal samples are summarized in Table 1. The average maximum vitrinite reflectance (Ro,max) is 2.1%, classifying the coal as semianthracite. Proximate analysis results reveal the following averages: air-dry-base moisture content is 0.93%, dry-base ash yield is 15.76% and dry-ash-free-base volatile matter yield is 11.72%. Petrographic analysis indicates a maceral composition dominated by vitrinite (average 75.78%), followed by inertinite (average 23.62%), with minor contributions from liptinite (average 0.61%).

4.2. Pore Types Under Optical Microscopy

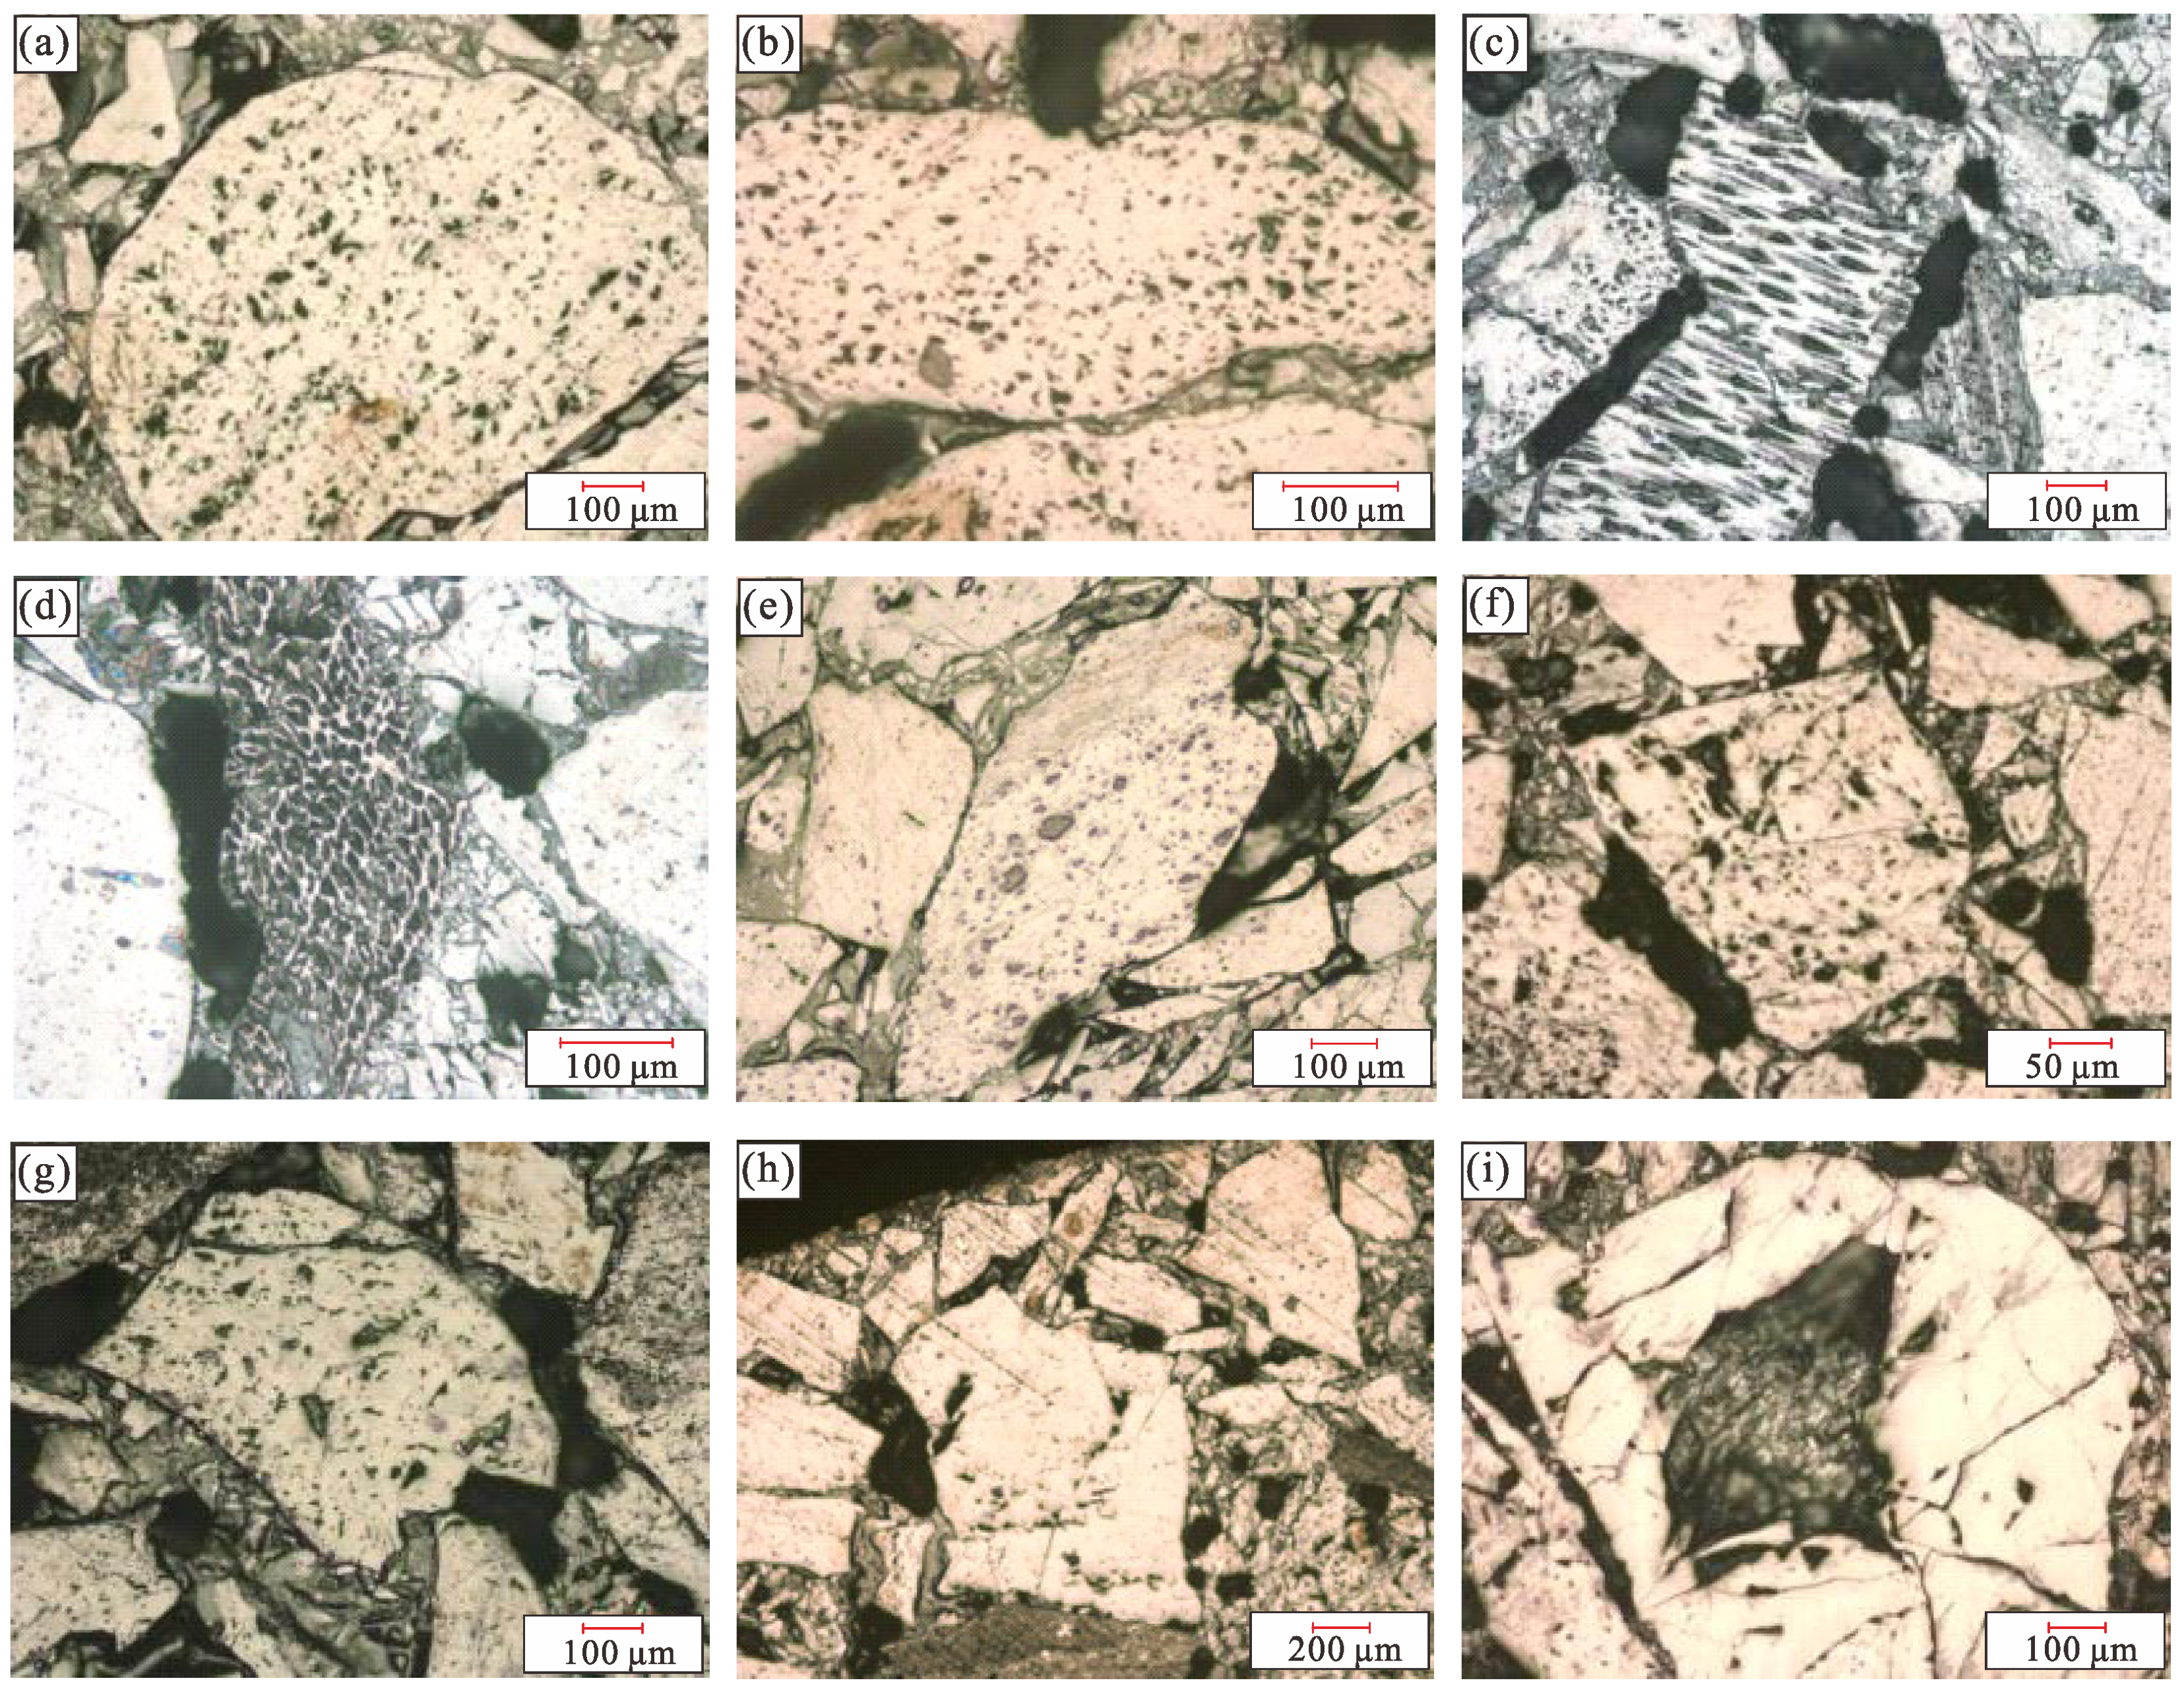
Optical microscopy of polished coal surfaces identifies three main pore types: plant-cellular pores, interparticle pores, and dissolution pores. Plant-cellular pores are predominantly observed within the fusinite, semi-fusinite, and vitrinite macerals. Owing to the high rank of the coal, the morphology of these pores exhibits significant divergence from their original plant-cellular structures. Furthermore, localized mineral infilling within some plant-cellular pores is noted, consequently reducing their overall porosity and network connectivity. Generally, plant-cellular pores exhibit a larger size in fusinite compared to vitrinite, a trend often accentuated in higher-rank coals [62]. Shrinkage pores resulting from gelification are also distributed within the vitrinite (Figure 3a,b). In contrast, pores within the fusinite macerals are partly mineralized, although some remnants of the original plant-cellular structure remain relatively well-preserved and display a regular morphology (Figure 3c,d). Pores within the semi-fusinite are characteristically circular with a relatively uniform arrangement, although their diameters show considerable variability (Figure 3e). Interparticle pores typically possess irregular geometries, such as triangular or polygonal outlines, with highly variable diameters spanning from a few micrometers to several hundreds of micrometers (Figure 3f–h). Finally, dissolution pores are primarily observed in association with mineral phases, notably calcite (Figure 3i).

4.3. Pore Structure Characterization by Low-Temperature N2 Adsorption

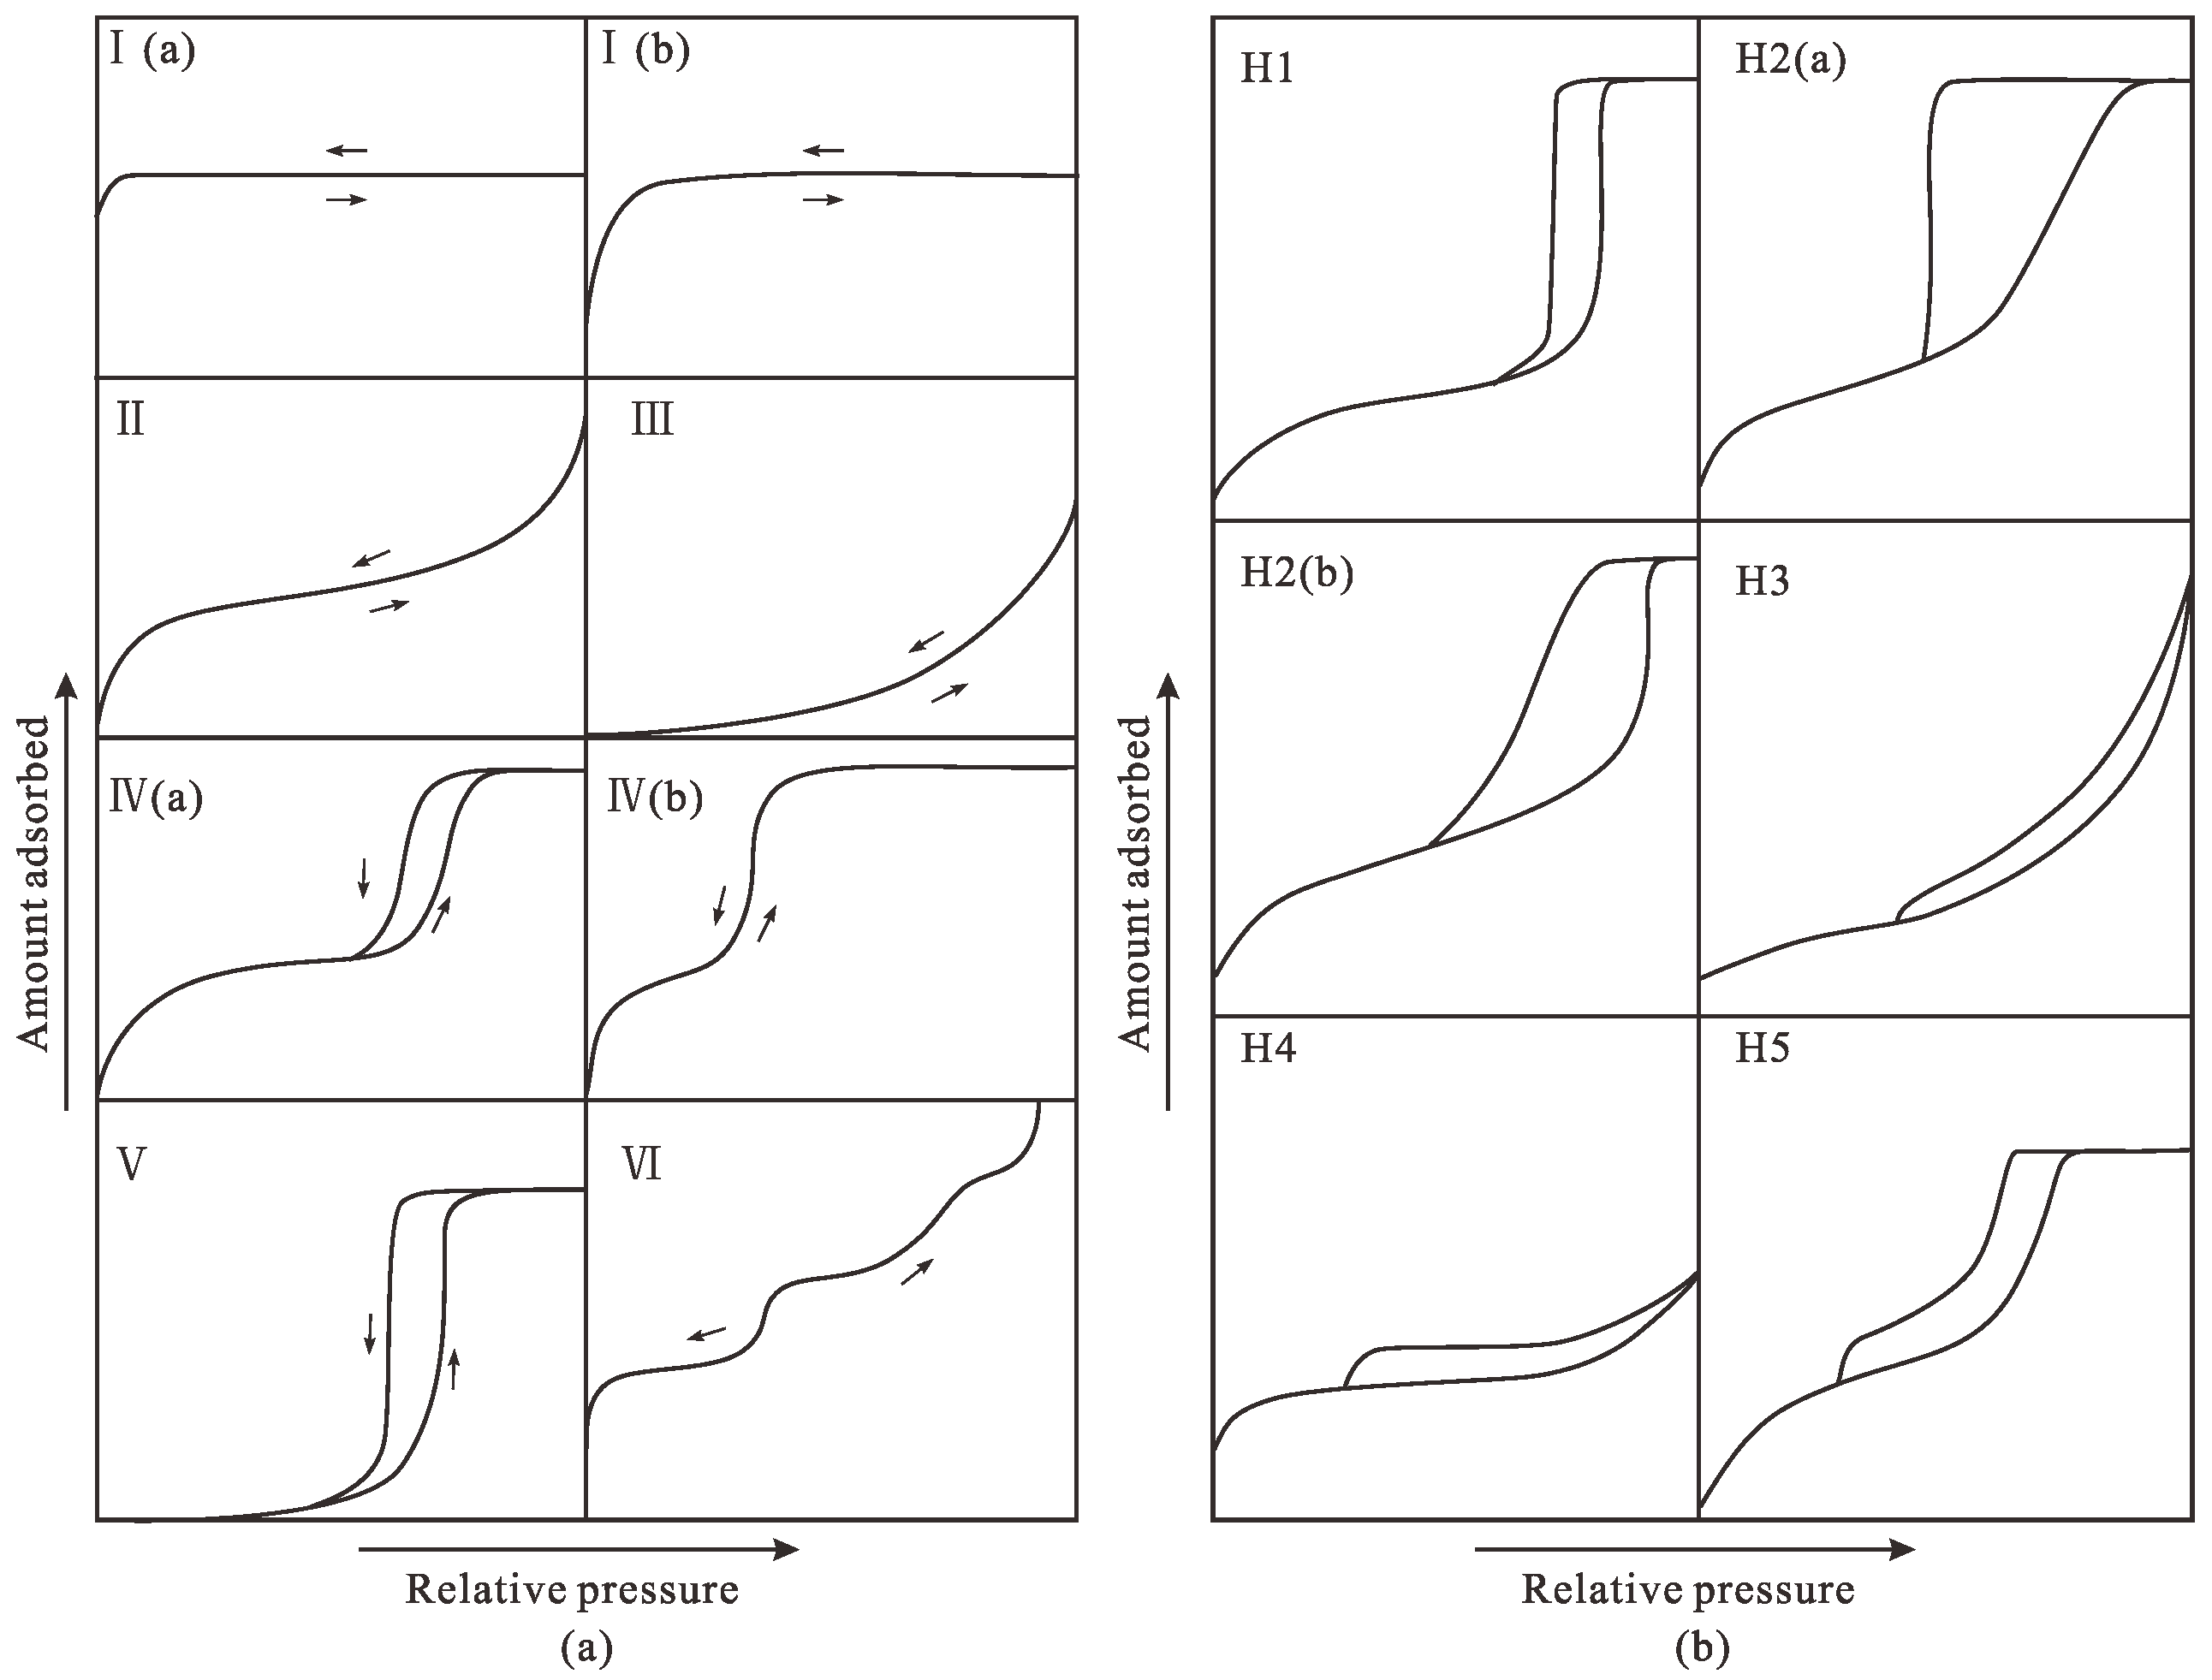
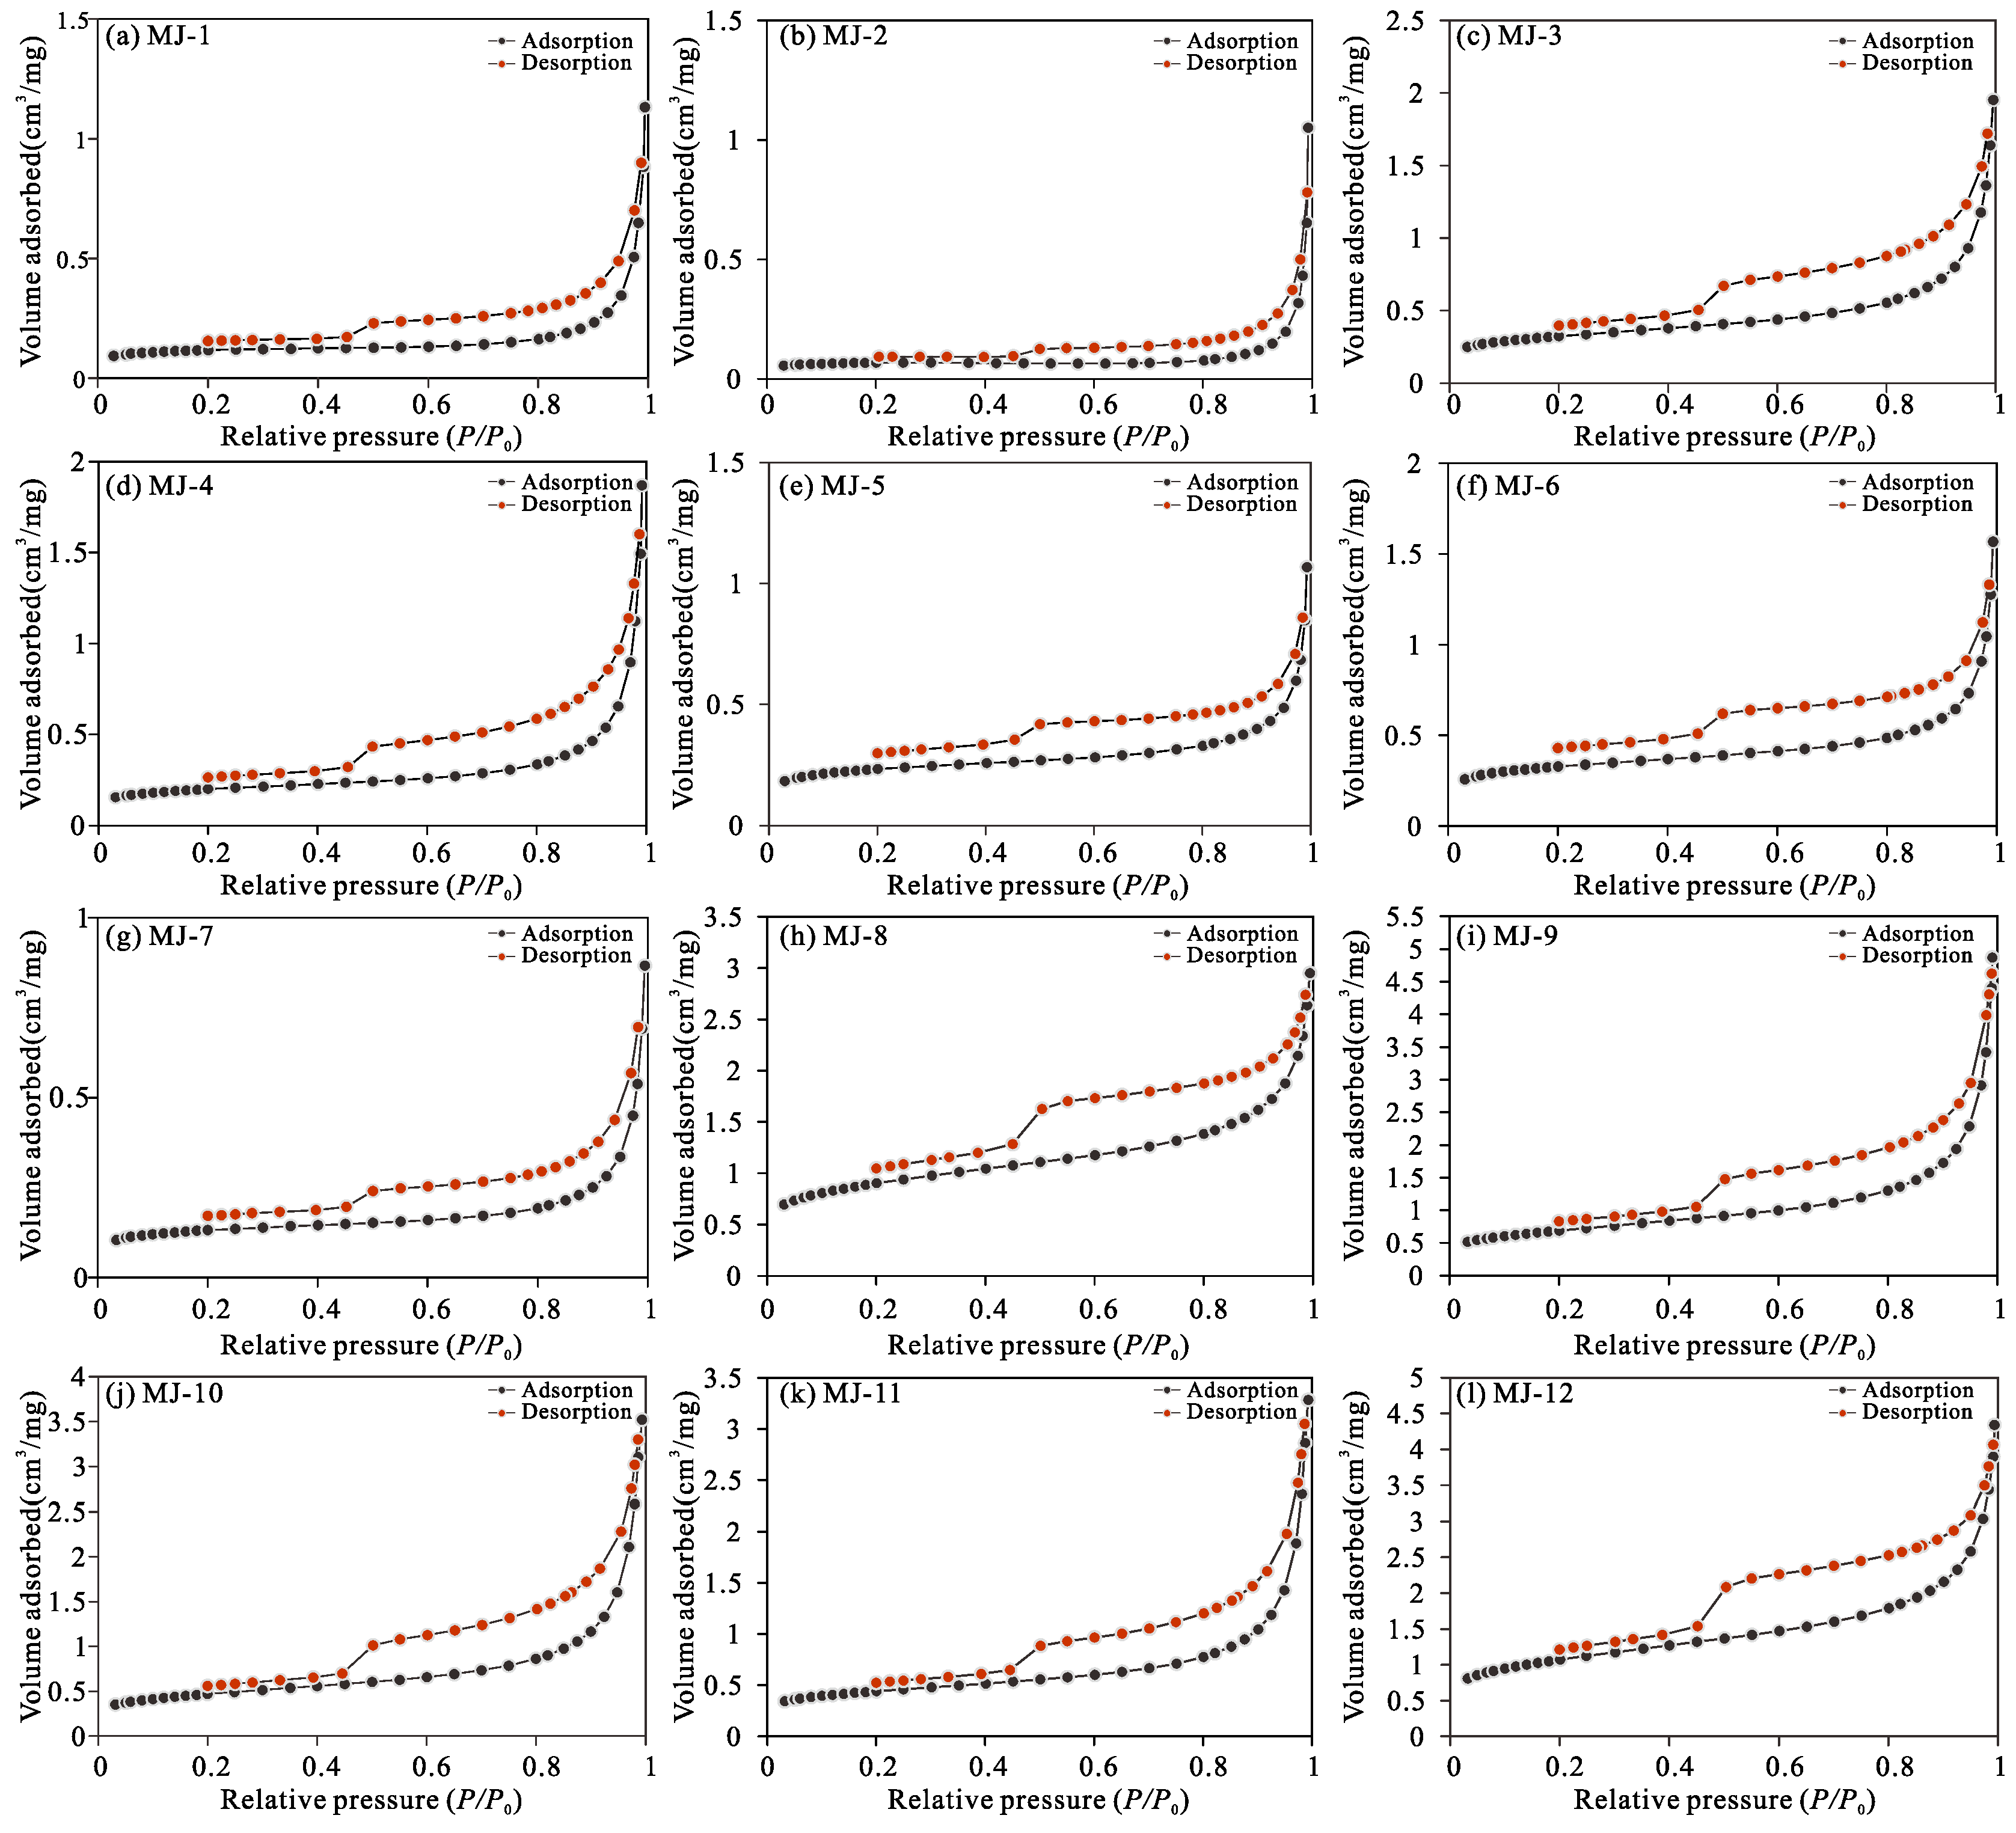
The pore structure of the coal samples is quantified using low-temperature N2 adsorption–desorption isotherms (Table 2). The resulting parameters indicate average pore diameter (5.76–27.77 nm), total pore volume (0.0013–0.0075 cm3/g, evaluated at a relative pressure of 0.99), and BET specific surface area (0.4061–3.7894 m2/g). The geometry of the adsorption–desorption isotherms provide insight into the pore structure characteristics. Based on a direct comparison with the IUPAC classification (Figure 4a) [60], the adsorption–desorption isotherms display similar sigmoidal shapes and generally match the characteristics of Type IV (a) isotherms (Figure 5). Specifically, Type IV (a) isotherms are characterized by a distinct hysteresis loop and are observed for mesoporous materials. Our isotherms clearly demonstrate a convex upward curvature at low relative pressures (P/P0 < 0.10), analogous to the initial part of the Type II isotherm, indicating monolayer–multilayer adsorption on micropore surfaces. Then, a slow and steady concave upwards rise stage (0.10 < P/P0 < 0.80) is consistent with multilayer adsorption and the onset of capillary condensation within mesopores. Last, a sharp concave upwards increase at high relative pressures (P/P0 > 0.80) without a clear saturation plateau indicates extensive capillary condensation in larger mesopores and possibly pore filling near saturation.
The presence of a hysteresis loop between the adsorption and desorption branches indicates irreversible capillary condensation, typical for porous materials with complex pore networks. The shape of the hysteresis loop provides insights into pore morphology and connectivity. As shown in Figure 5, the hysteresis loop for all samples consistently begins to develop at a relative pressure (P/P0) of approximately 0.45. When compared directly with the IUPAC classification for hysteresis loops (Figure 4b), the majority of our experimental loops closely resemble Type H4 [63]. The adsorption and desorption branches are nearly parallel and horizontal over a wide range of P/P0, which distinguishes it from the steep, well-defined loops of Type H1 (cylindrical pores) or the gradual closure of Type H2 (ink-bottle pores). This Type H4 hysteresis loop is characteristic of narrow slit-like pores, often found in aggregates of plate-like particles, or materials containing a significant proportion of pores in the range of <2 nm and 2–50 nm [25]. Collectively, the explicit classification as Type IV (a) with a Type H4 loop proves a complex pore structure. It indicates a hierarchical system comprising micropores for initial adsorption, a network of larger mesopores where capillary condensation occurs, and a significant presence of slit-shaped or plate-like voids.
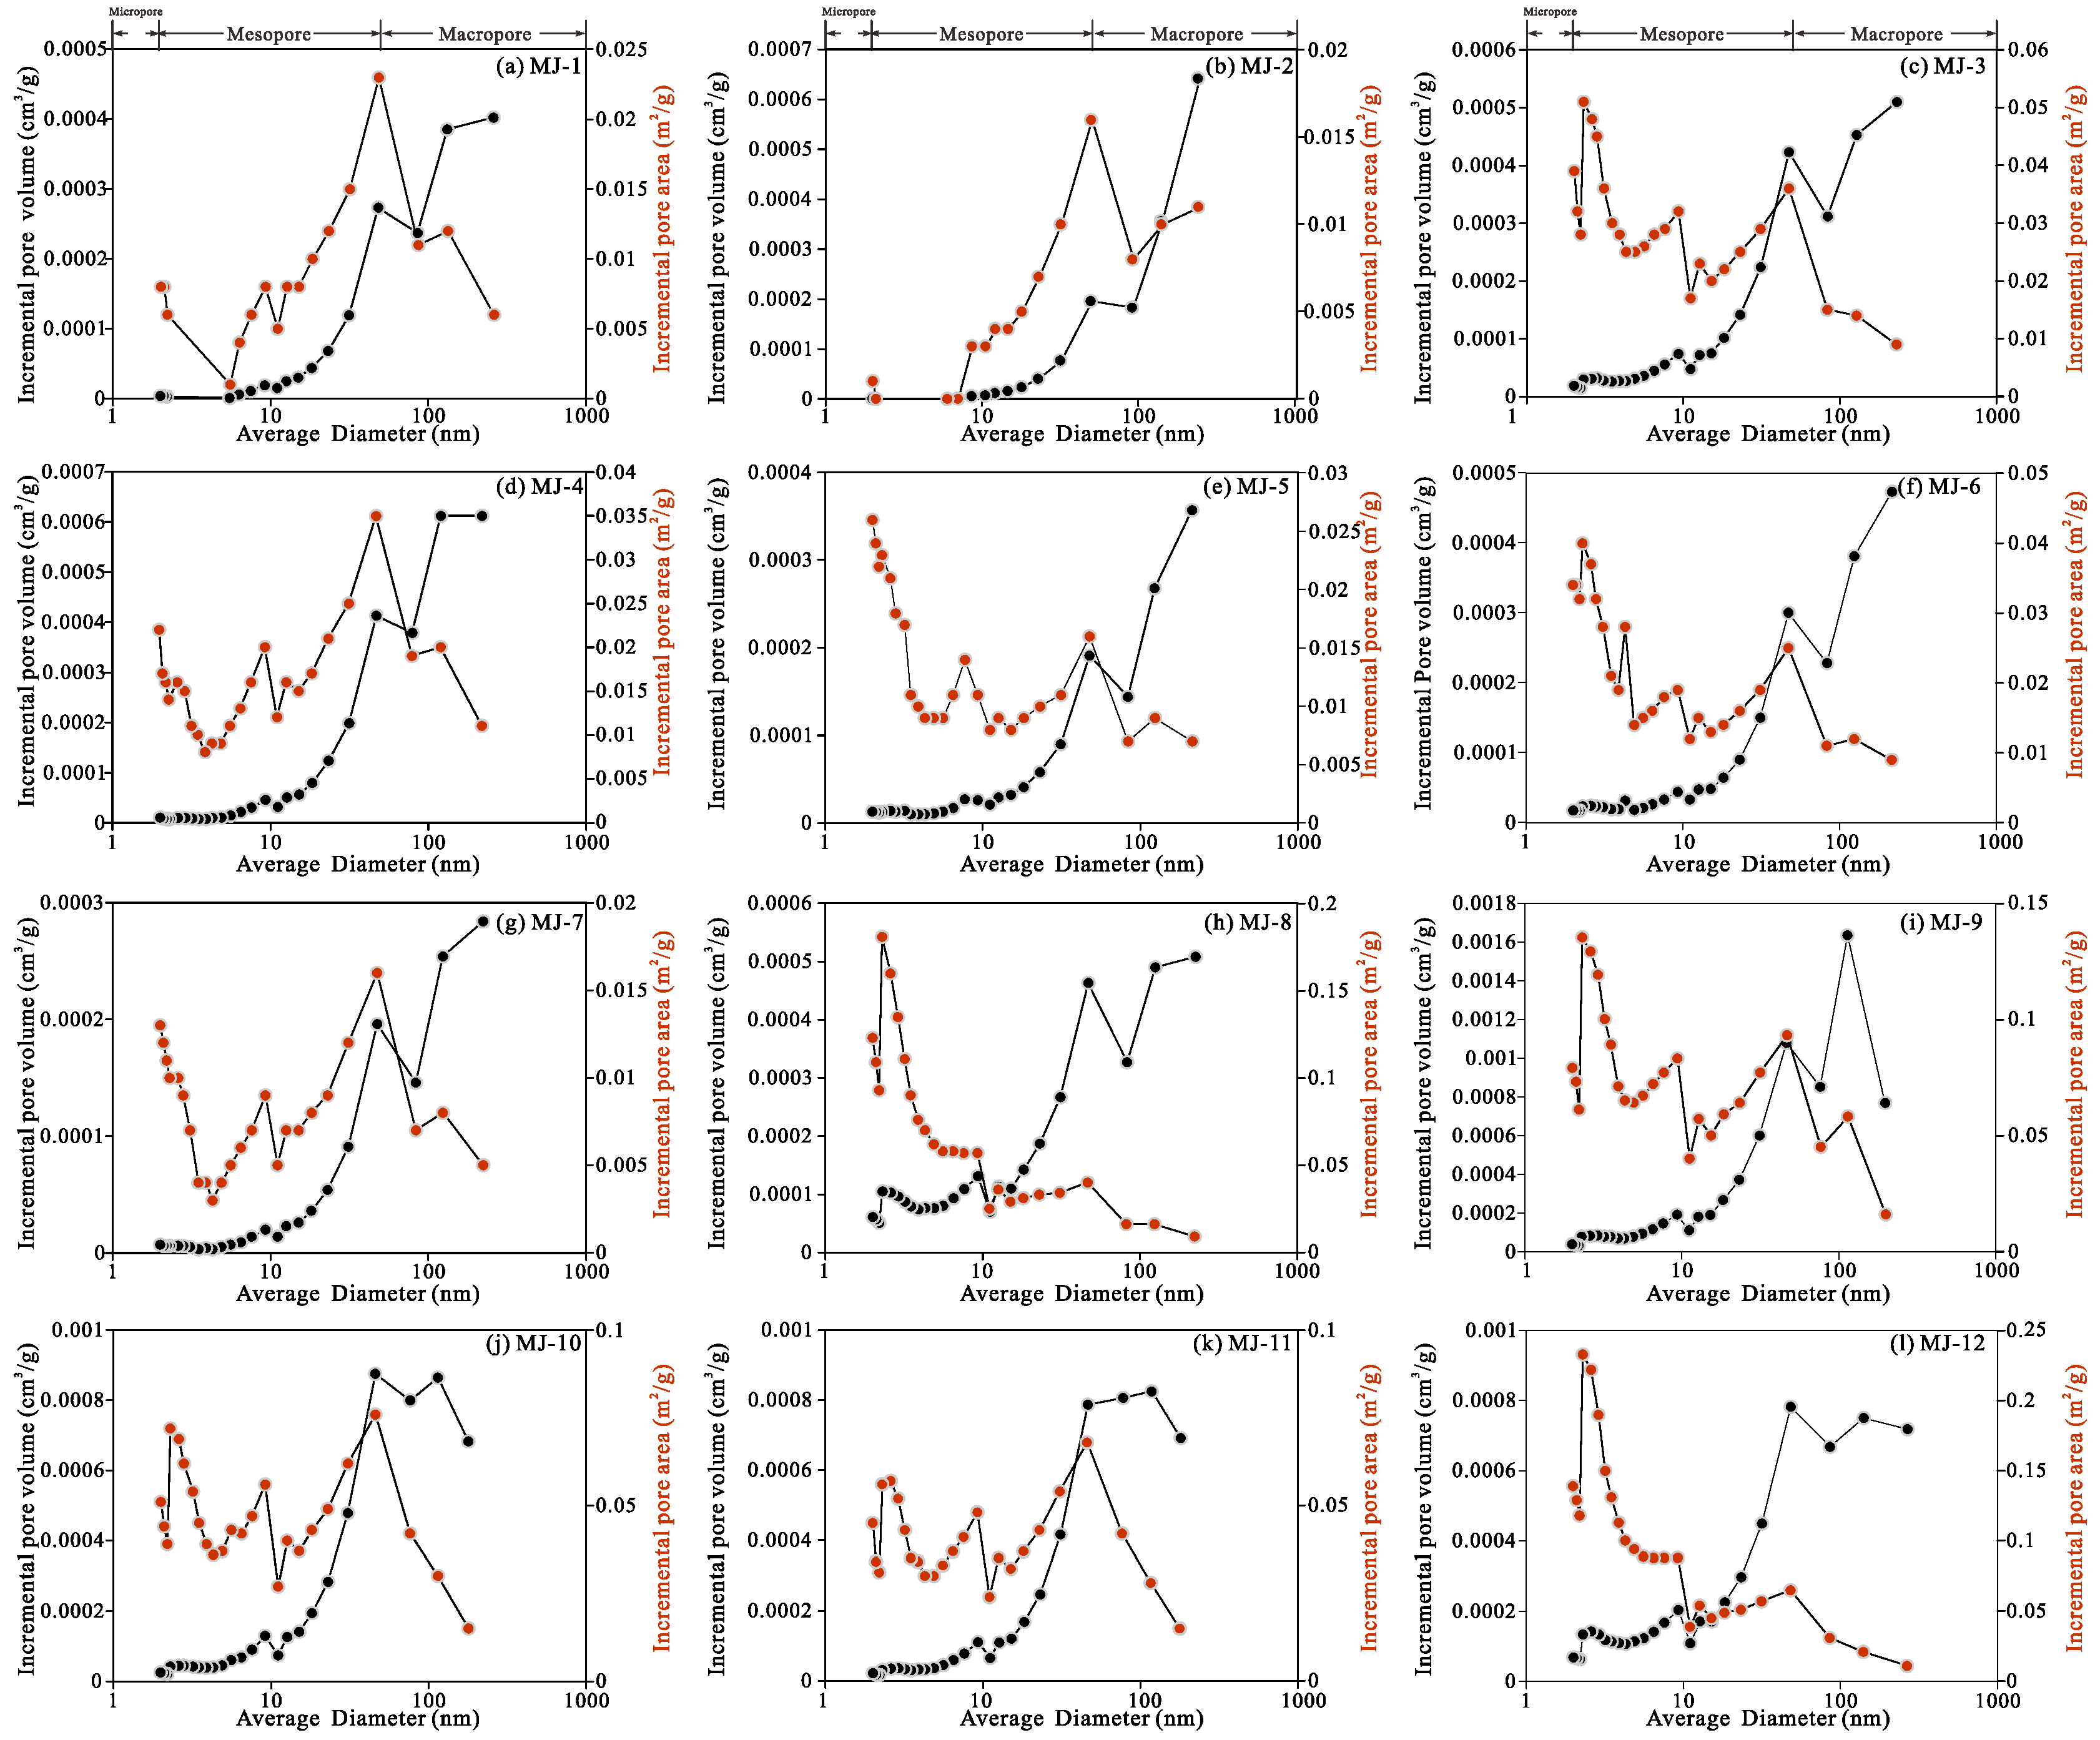
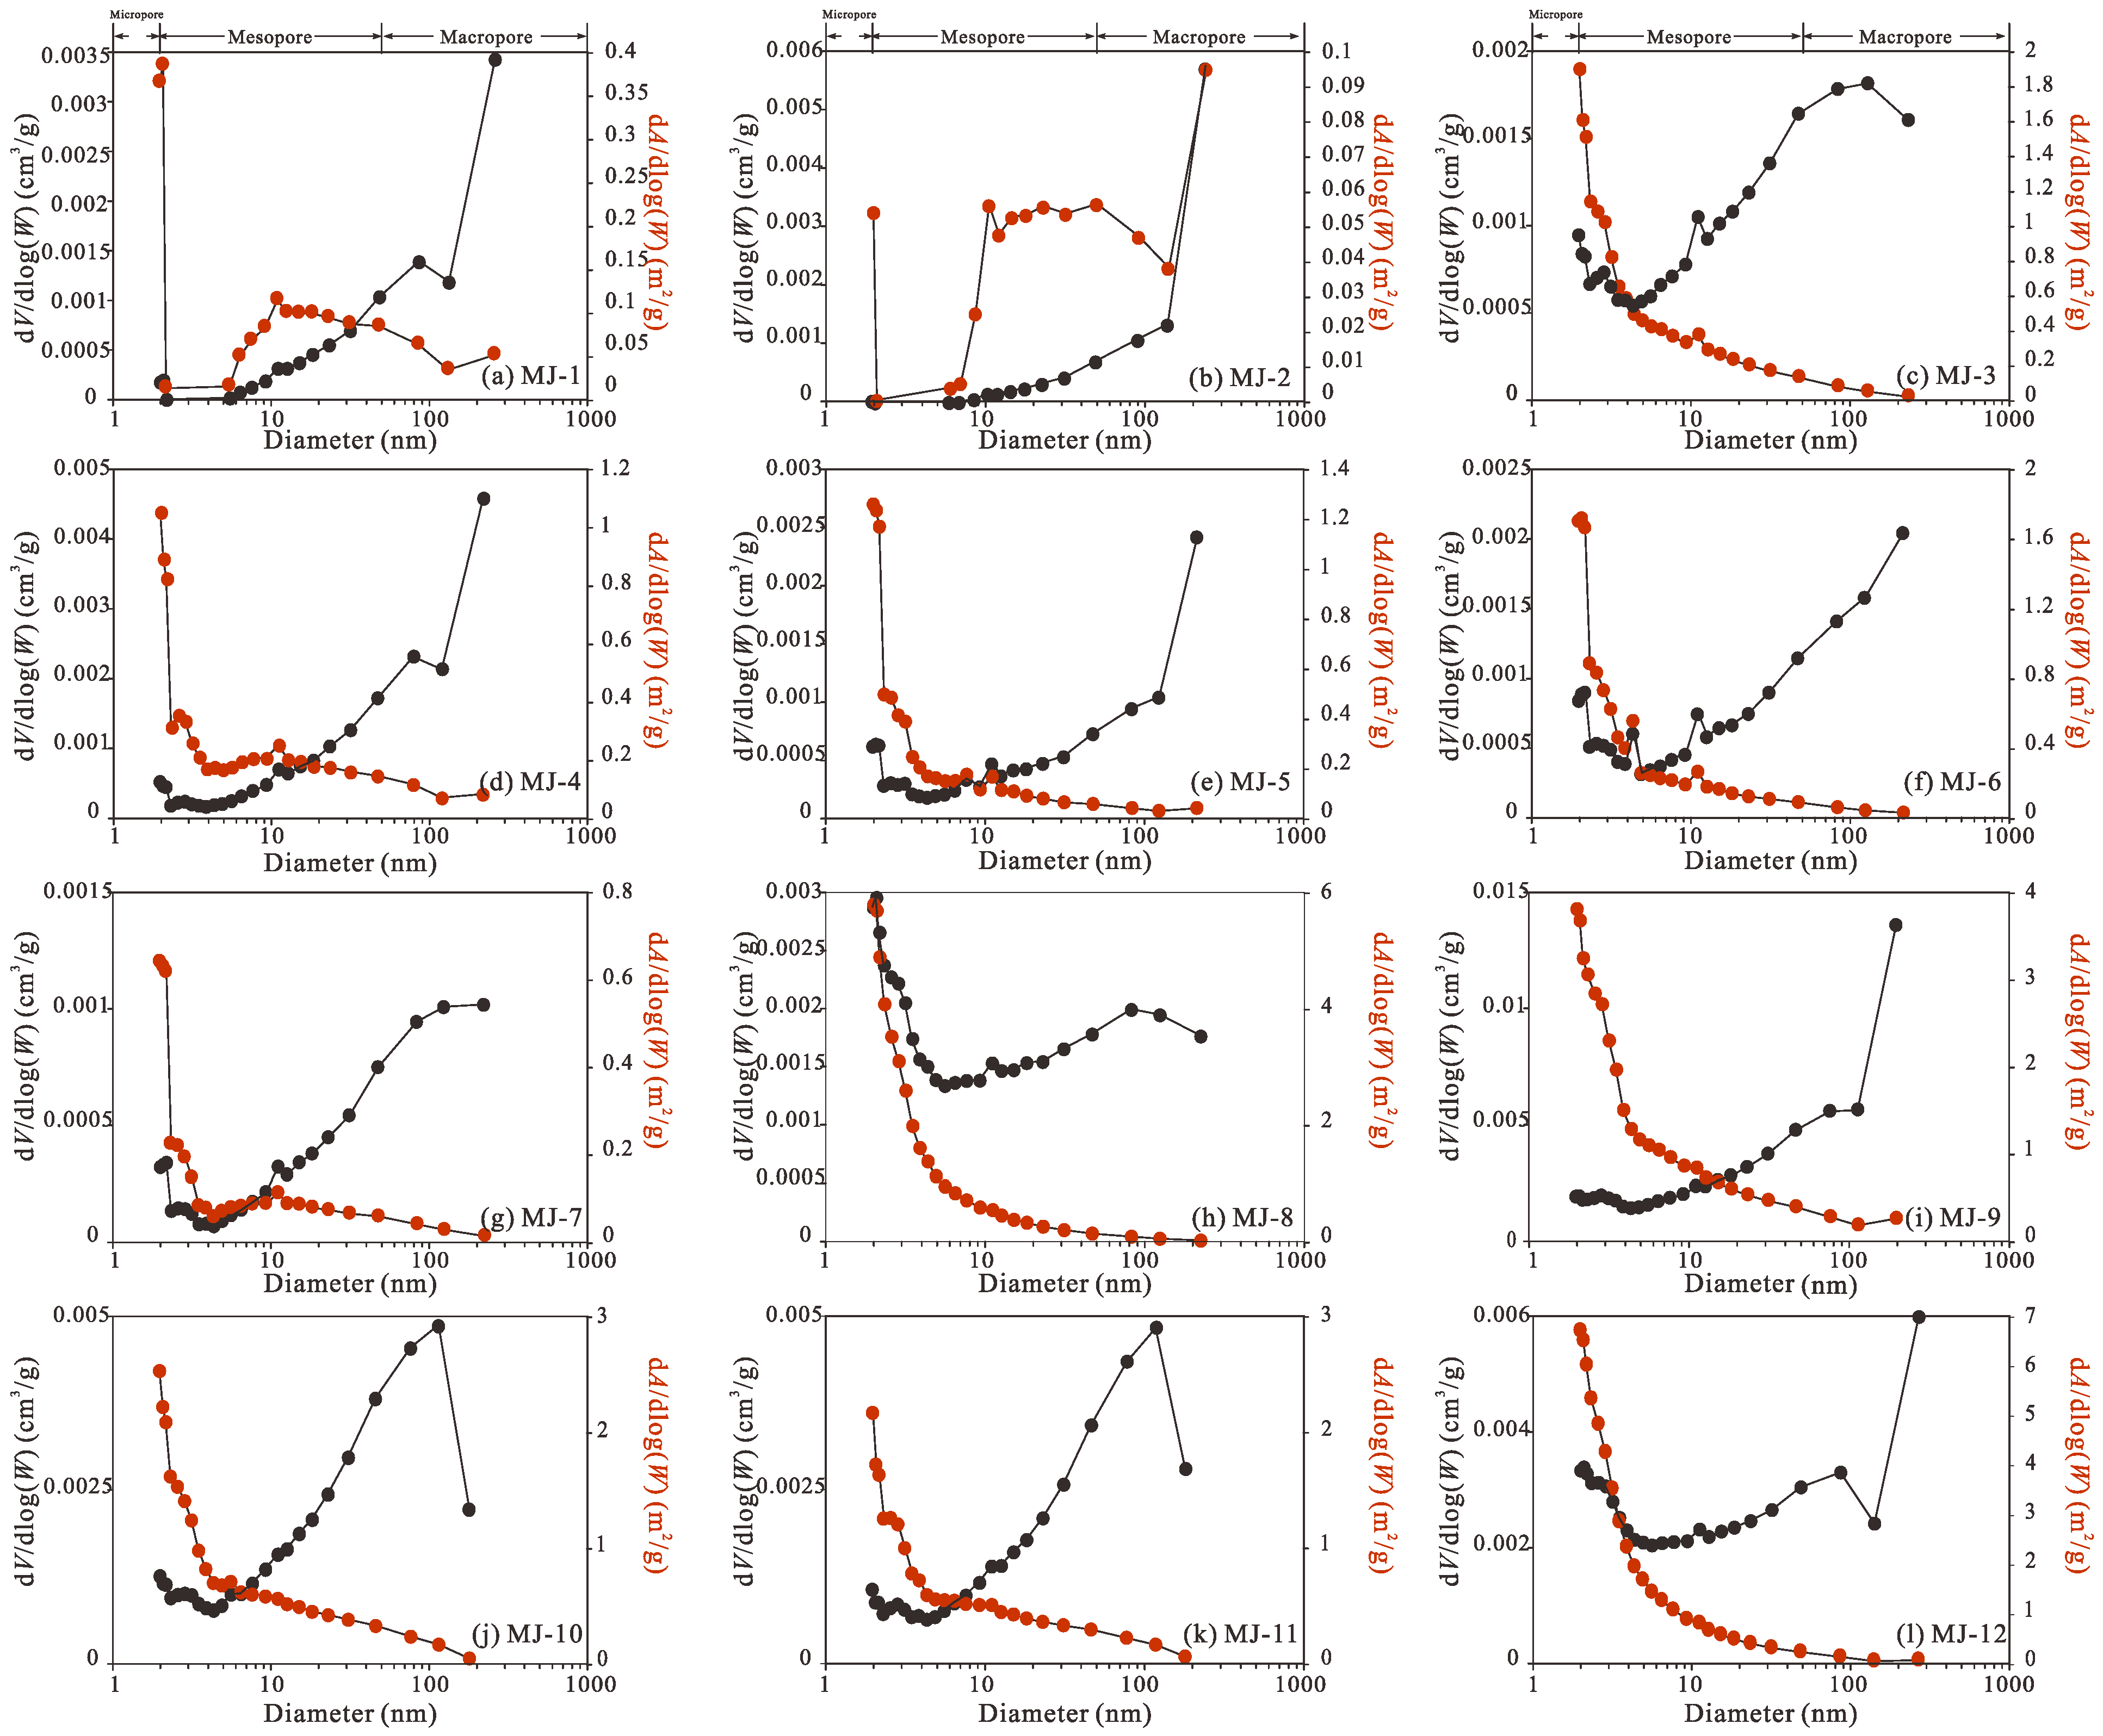
Figure 6 illustrates the incremental pore volume and surface area distributions as a function of pore diameter. Peaks in incremental pore volume distributions frequently occur in the mesopore and macropore ranges. In contrast, peaks in incremental pore surface area distributions are predominantly observed in the mesopore ranges. Analysis of the relative contributions to total pore volume and surface area (Table 3) shows that macropores contribute the largest proportion to total pore volume (average 64.78%), followed by mesopores (average 34.57%) and then micropores (average 0.65%). Conversely, mesopores dominate the total specific surface area (average 76.86%), followed by macropores (average 17.75%) and micropores (average 0.65%). This highlights the fact that, while larger pores contribute the majority of the pore volume, the smaller mesopores provide the largest fraction of the internal surface area. The dV/dlog(W) and dA/dlog(W) plots (Figure 7) further support these findings by illustrating the pore size ranges that contribute most significantly to pore volume and surface area, respectively.

4.4. Fractal Dimension Characteristics

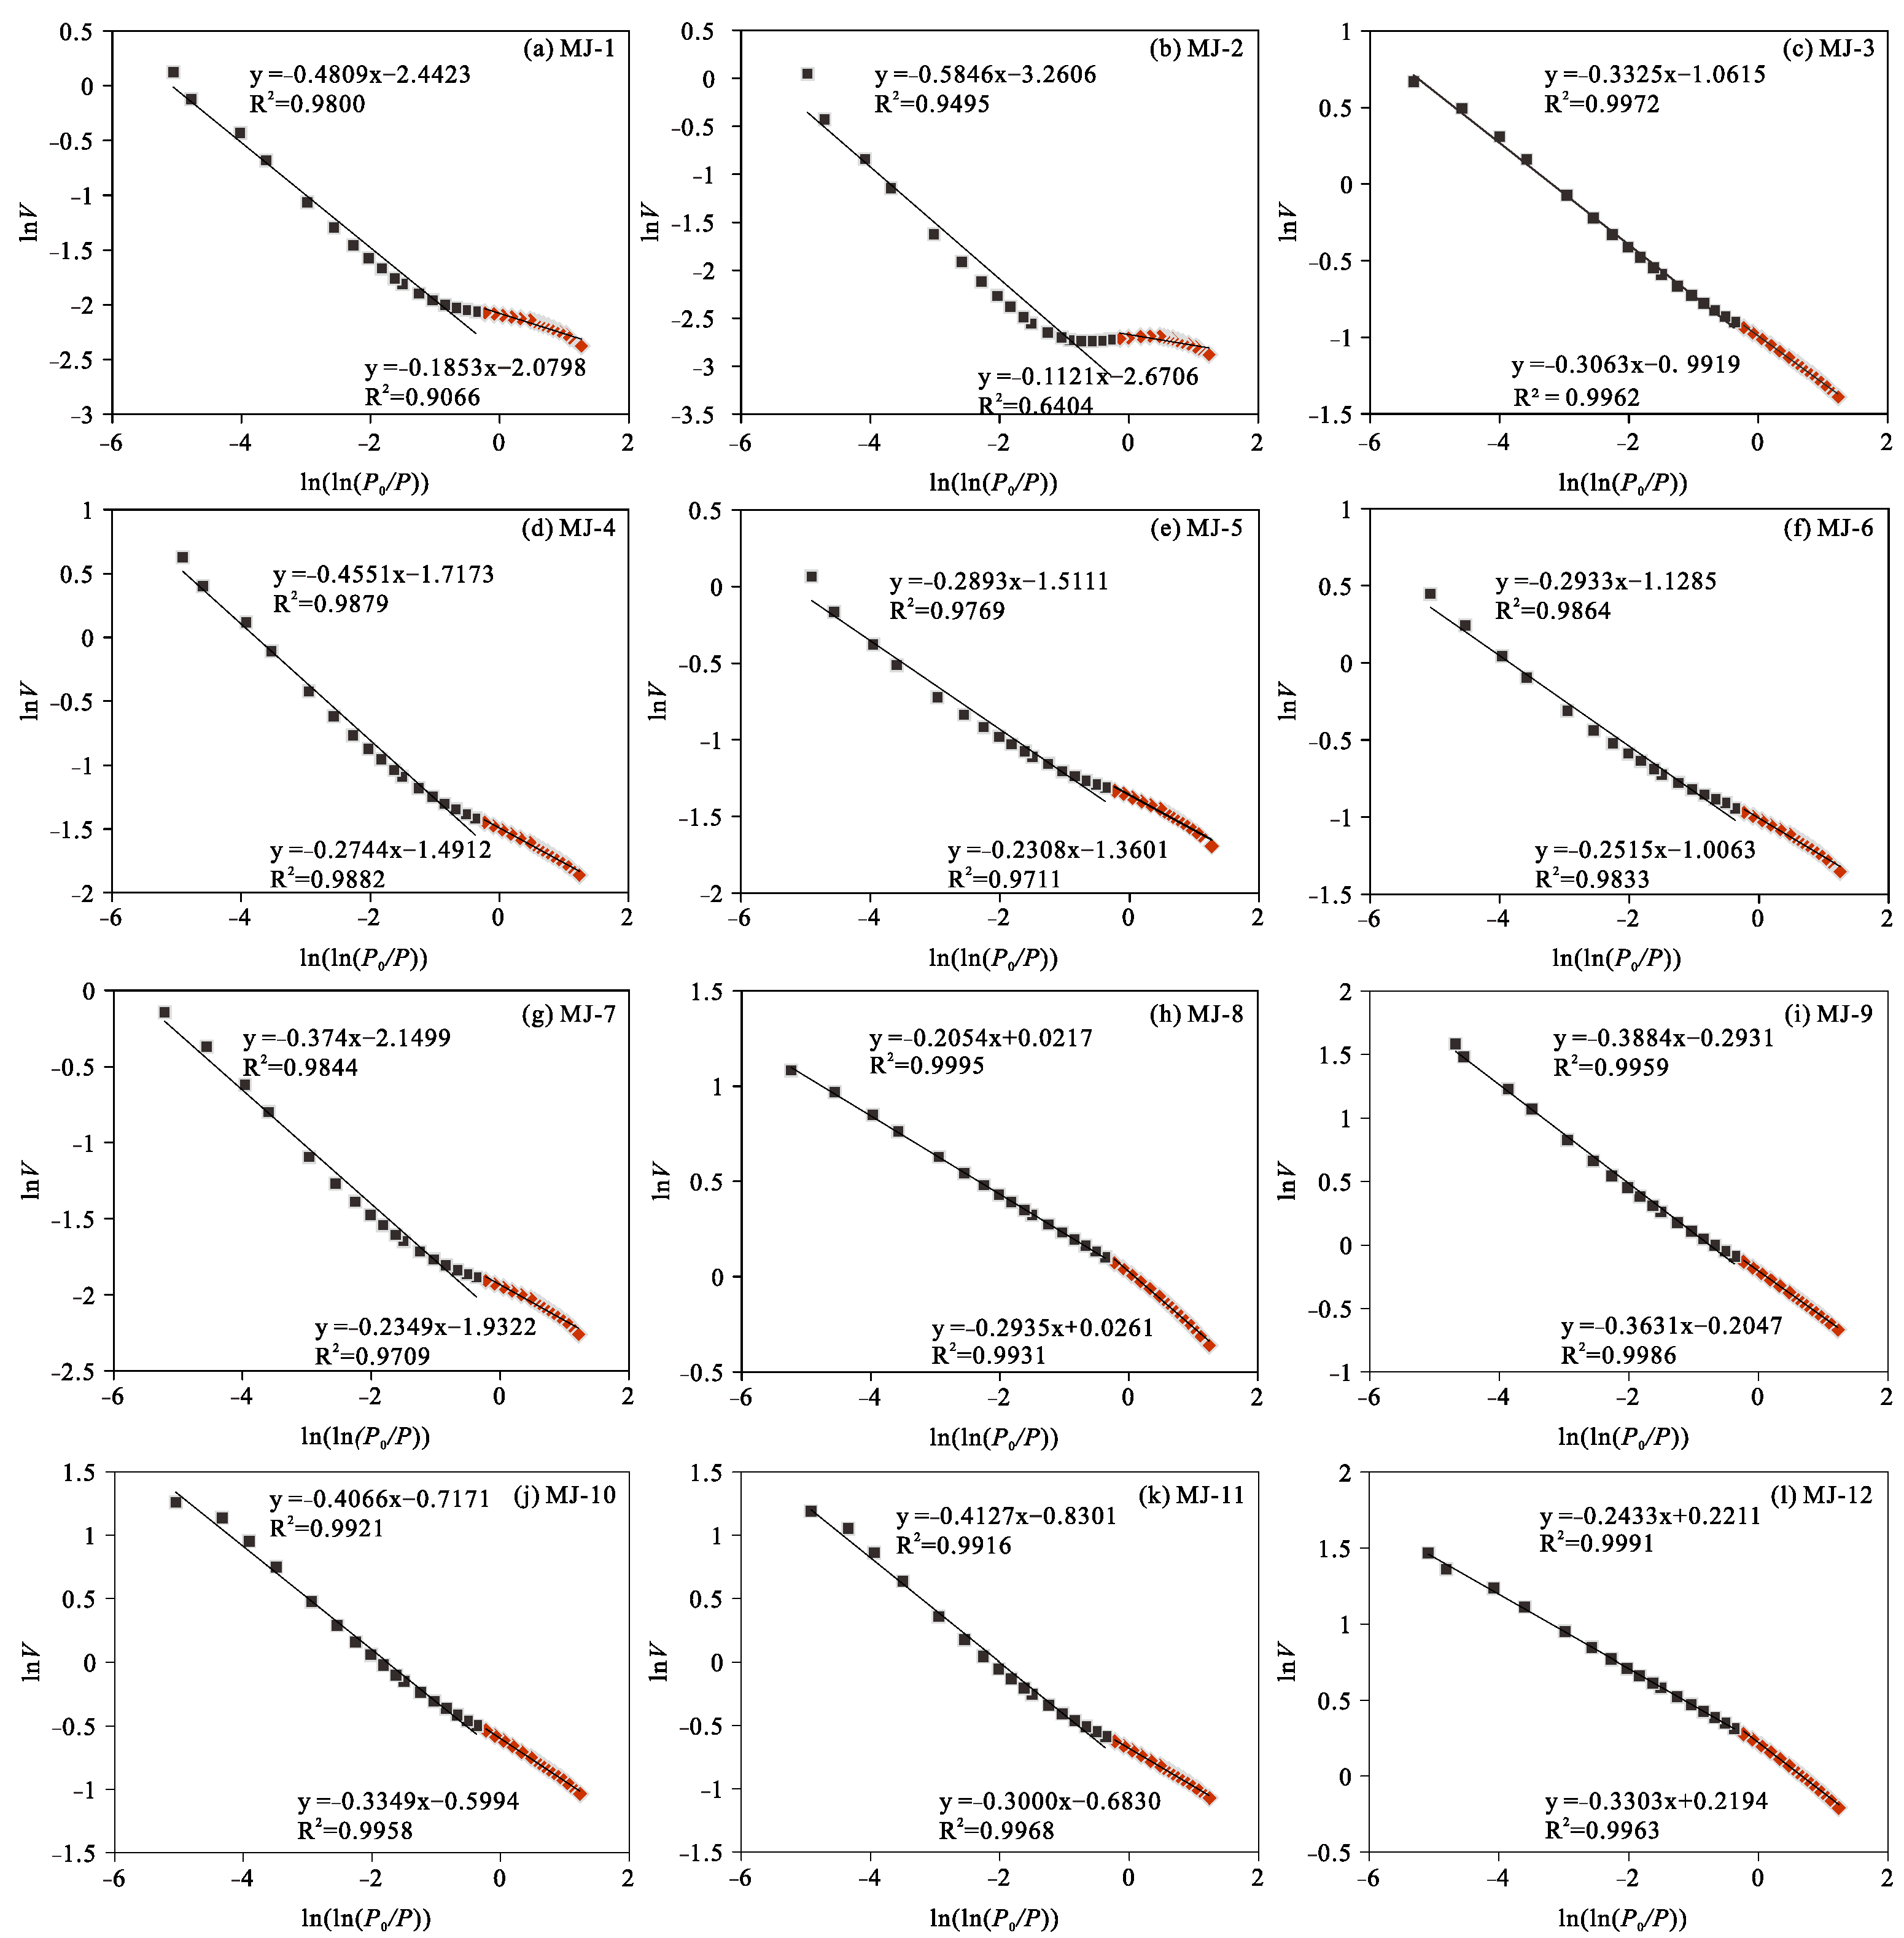
Results from low-temperature N2 isotherm adsorption analysis are presented in Figure 8 and Table 4. Generally, the plots exhibit good linearity across two distinct segments, indicating that the pore systems possess fractal characteristics within the measured range. The presence or absence of inflection points between linear segments in other samples may relate to the filling sequence of pores [64,65]. As shown in Figure 8, the plots often display two distinct linear regions separated at an approximate ln (ln (P0/P)) value of −0.4, corresponding to a pore diameter of approximately 3 nm as evaluated from the Kelvin equation. This division effectively splits the pore size range investigated by N2 adsorption into two parts: roughly 1.9–3 nm and 3–400 nm. The two fractal dimensions, F1 and F2, were calculated based on different pressure ranges [57]. F1 ranges from 2.637 to 2.888 (average of 2.732), and F2 ranges from 2.415 to 2.795 (average of 2.628) (Table 4). The fractal dimension ranges from 2 to 3 and is consistent with the classical fractal theory. Values closer to 3 mean a more irregular the pore surface and more complex pore structure [66]. F1 is calculated from the lower relative pressure range, which is directly linked with the surface roughness and geometric complexity of the micropores and smallest mesopores. In this regime, gas–solid interactions dominate, and F1 quantifies the irregularity of the surfaces where initial monolayer and subsequent multilayer adsorption occur. From a transport perspective, F1 characterizes the complexity of the primary gas storage domain. A higher F1 signifies that the surface of these smaller pores is highly irregular and possesses a complex configuration, which enhances gas storage capacity by providing abundant adsorption sites. In contrast, F2 is derived from the higher relative pressure range, where capillary condensation in larger mesopores and macropores primarily governs the adsorption behavior. Therefore, F2 moves beyond simple surface characterization and reflects the structural complexity and connectivity of the larger mesopore network. It represents the tortuosity of the pathways available for fluid flow. A generally lower F2 suggests that the surfaces of these larger pores, or the overall connectivity of the larger pore network, might be comparatively less irregular or possess a different type of fractal complexity. The difference between F1 and F2 highlights the scale-dependent heterogeneity of the coal pore system. A higher F1 suggests that gas diffusion through micropores and small mesopores will be more tortuous and hindered due to the extremely rough and complex surfaces, potentially leading to higher resistance to flow. Conversely, the characteristics captured by F2 would influence the bulk flow and storage in larger pores, affecting overall permeability and the effective accessible volume. Given this observed multiscale fractal behavior, a single fractal dimension is insufficient to capture the entire complexity of the entire pore system. Therefore, a comprehensive fractal dimension Fc was calculated according to Equation (4) based on the fractal dimensions over different pore diameter ranges and corresponding pore volume ratios. The Fc ranges from 2.415 to 2.784, with an average of 2.628 (Table 5). Fc provides a comprehensive representation of the overall fractal characteristics, integrating the different complexities observed at distinct pore scales. This approach offers a more balanced and representative measure of the irregularity and complexity of entire pore structures.

4.5. Controlling Mechanisms of Pore Structure on Diffusion Coefficient

The diffusion coefficient (D) is a key parameter controlling the efficiency of diffusive transport in coal. We adopt the pore structure model, based on fractal theory, proposed by Yang and Liu [42]. This model, founded on pore structure parameters obtained from low-temperature N2 adsorption experiments, describes gas diffusion in coal as a weighted combination of Knudsen diffusion and bulk diffusion, thereby enabling accurate calculation of the diffusion coefficient under various pressure conditions.
When the mean free path λ of gas molecules is greater than or comparable to the pore diameter, gas transport is dominated by Knudsen diffusion. In an ideal cylindrical pore, the Knudsen diffusion coefficient D K can be expressed as [67]:
D K = 1 3 d c
where c = 8 RT / π M  is the average thermal motion rate of gas molecules, R is the gas constant, T is the absolute temperature, and M is the molar mass of the gas.
When the mean free path λ of gas molecules is much smaller than the pore diameter d, bulk diffusion becomes dominant, and the diffusion coefficient D B can be expressed as [68]:
D B = 1 3 λ c
where λ is the mean free path of gas molecules, which can be estimated based on the kinetic theory of gases as:
λ = 5 8 u p R T π 2 M
where μ is the gas viscosity and p is the gas pressure.
Due to the complex pore structure of coal, the actual diffusion process is influenced by porosity ϕ and tortuosity, defined by a factor τ. Therefore, the Knudsen diffusion coefficient in porous media D K , p m is modified as:
D K , p m = ϕ τ D K
The tortuosity factor τ can be expressed by the fractal pore model as:
τ = d max λ 2 F c
where d m a x is the maximum pore diameter in the pore size distribution.
The total diffusion coefficient D p of gas in coal is obtained by proportionally weighting Knudsen diffusion and bulk diffusion, with the weighting factor w k depending on the Knudsen number [69]:
1 D p = w k 1 D K , p m + ( 1 w k ) 1 D B
where:
w K = 1 1 + K n
The pressure-dependent gas diffusion coefficient in coal can be finally expressed as:
1 D p = w k 1 1 3 ϕ d max λ 2 F c d c + ( 1 w k ) 1 1 3 λ c
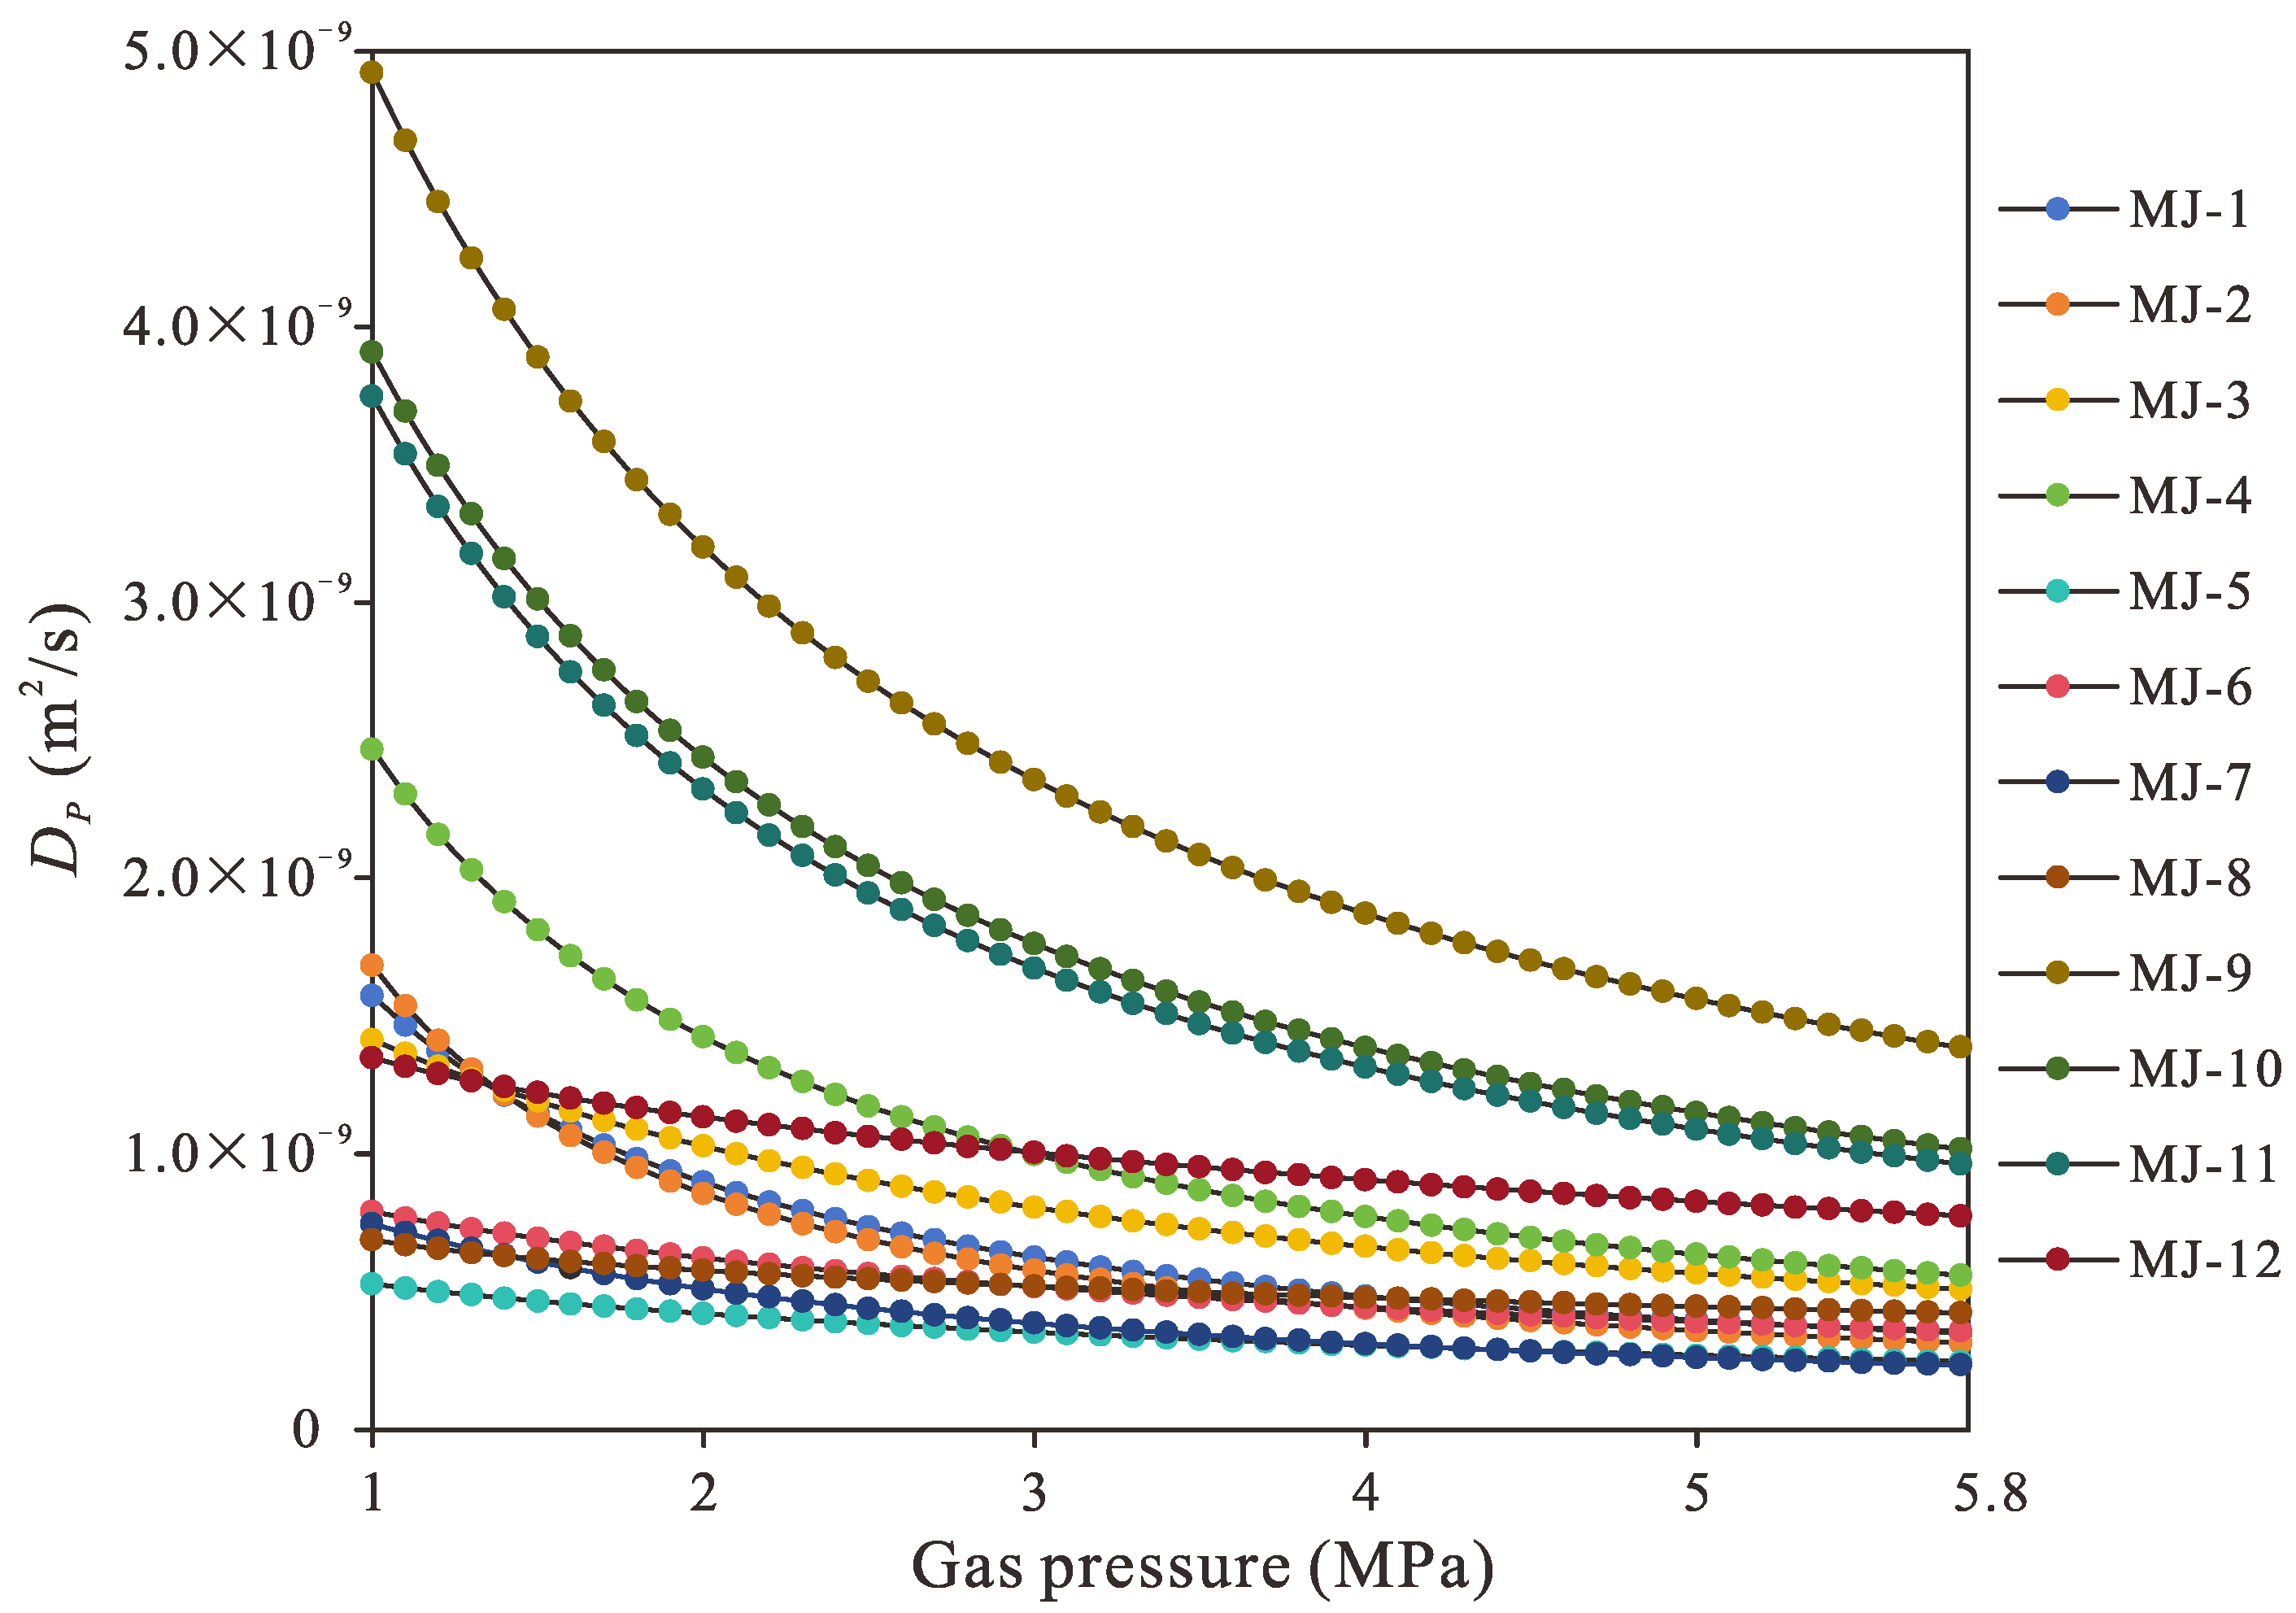
Therefore, the ensemble diffusion coefficient is ultimately expressed as a function related to pore structure parameters (fractal dimension, porosity, average pore diameter, maximum pore diameter), gas physical properties (molar mass, viscosity) and environmental conditions (pressure, temperature). Based on the pore structure parameters obtained from low-temperature nitrogen adsorption experiments, the diffusion coefficients of each coal sample were calculated under different gas pressures, ranging from 1 MPa (low pore pressure) to 5.8 MPa (high pore pressure/reservoir pressure), at the measured reservoir temperature of 308.15 K. The sample is buried at a depth of approximately 645 m, with a reservoir pressure gradient of 0.9 MPa/100 m, yielding a calculated reservoir pressure of 5.8 MPa. The variation of Dp with gas pressure for samples MJ-1 to MJ-12 is presented in Figure 9. Overall, Dp decreases monotonically as the gas pressure increases from 1 to 5.8 MPa for all samples, indicating a clear pressure-dependent attenuation behavior. The decline is more pronounced in the low-pressure region, especially between 1 and 3 MPa, whereas the curves gradually flatten at higher pressures, suggesting that the sensitivity of Dp to pressure becomes weaker as the system approaches a relatively stable state. Although all samples exhibit the same general trend, noticeable differences can be observed in their absolute values and decay rates. Among them, MJ-9 shows the highest Dp over the entire pressure range, while samples such as MJ-7 and MJ-8 remain at comparatively low levels. In addition, several samples with initially high Dp values show a sharper decrease with increasing pressure, reflecting stronger pressure responsiveness. These results demonstrate that gas pressure plays a significant role in controlling Dp, while the distinct behaviors among different samples also suggest the influence of sample-specific structural or physicochemical properties.
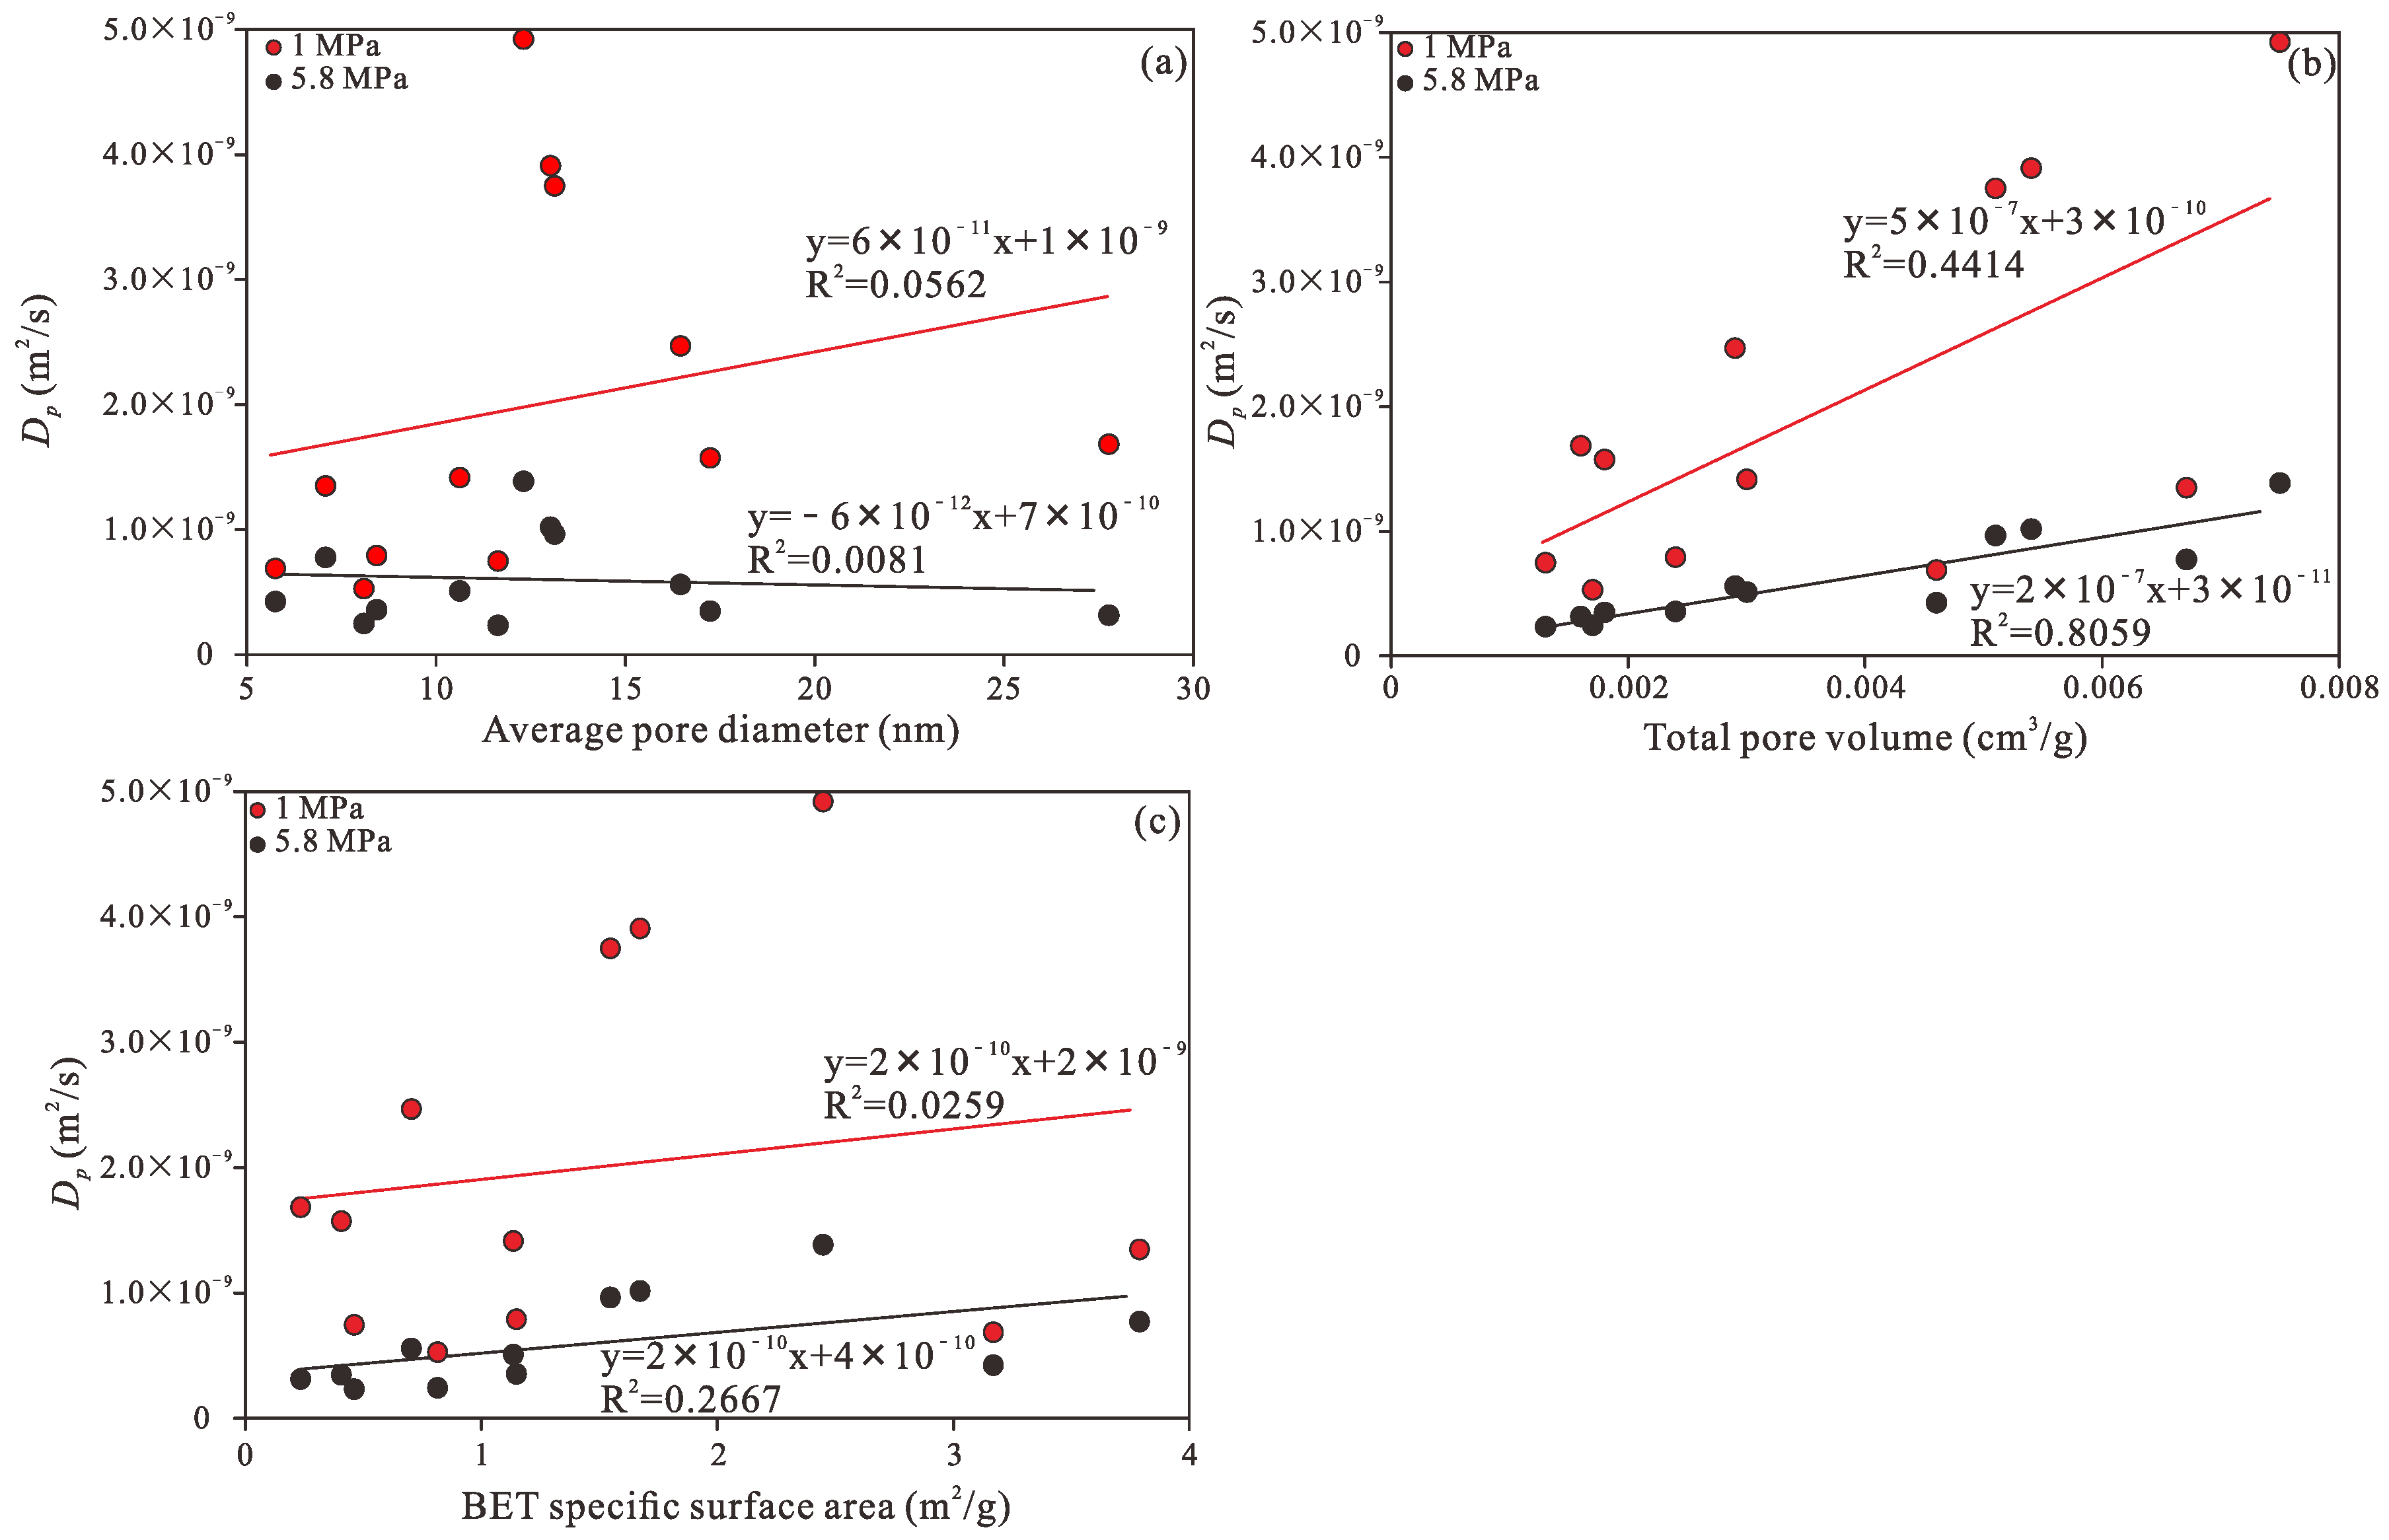
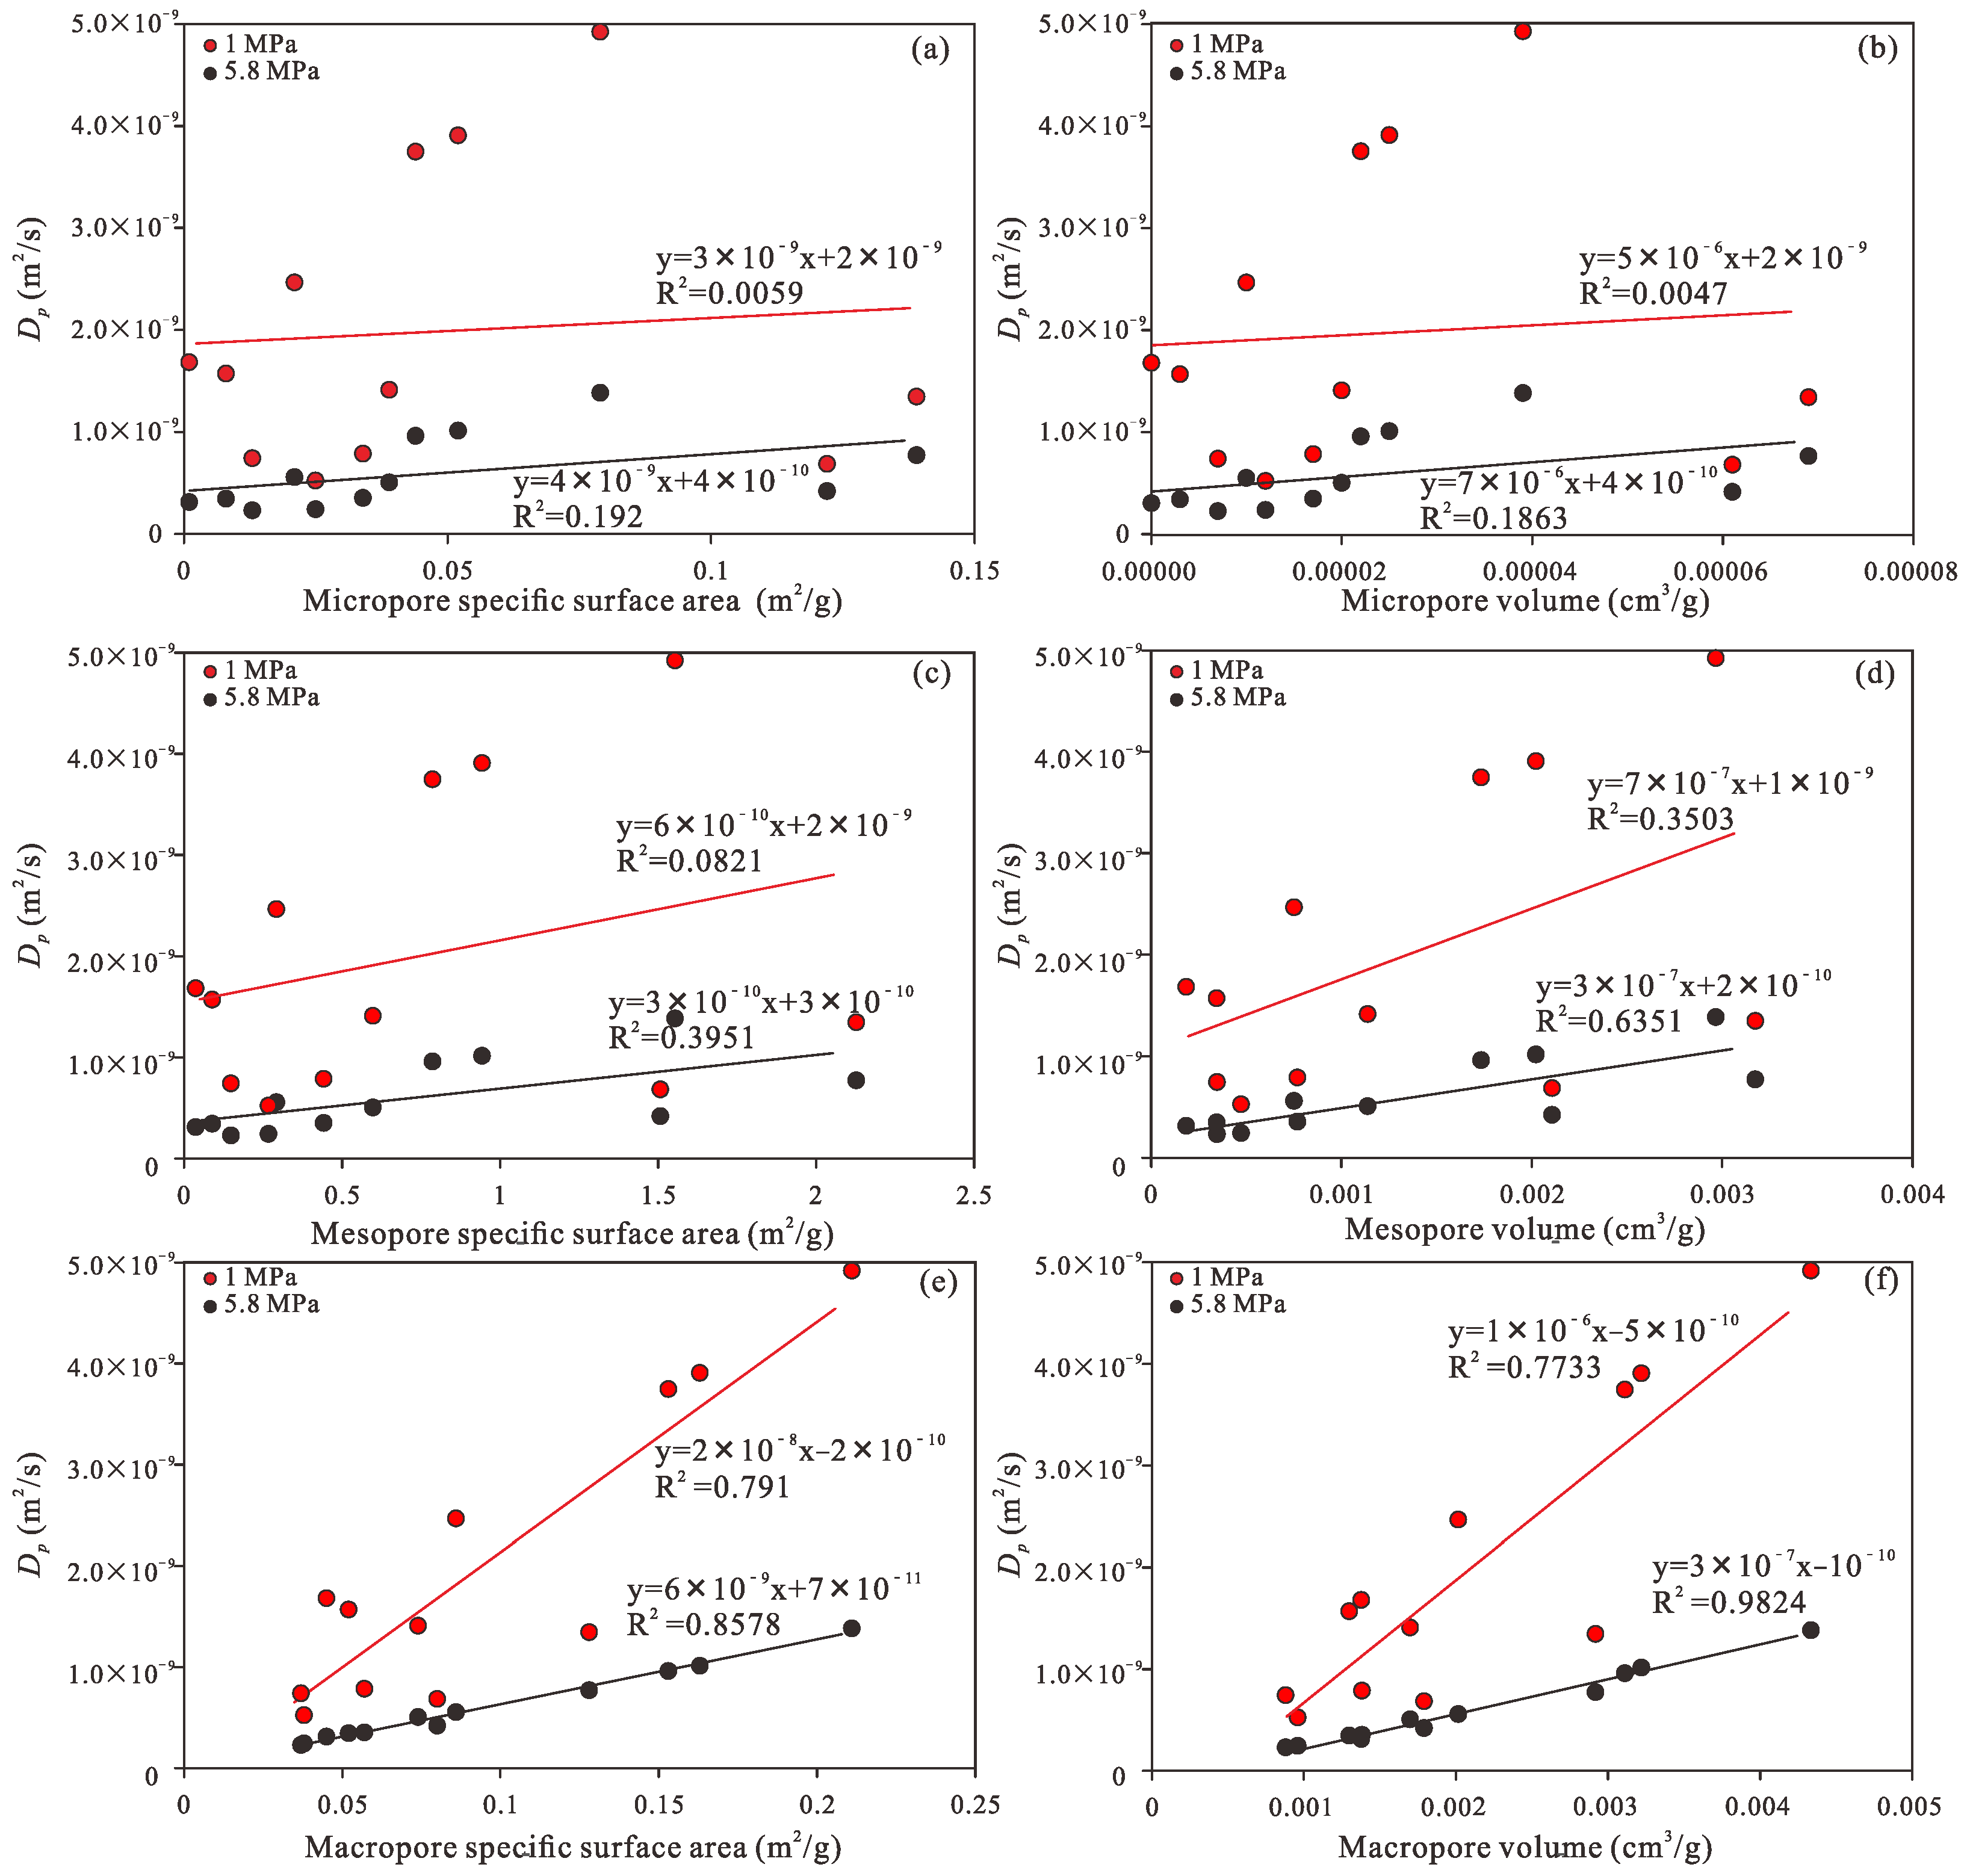
The diffusion coefficients of each coal sample under gas pressures of 1MPa (low pore pressure) and 5.8 MPa (high pore pressure/reservoir pressure) at a temperature of 308.15 K are shown in Table 6. The calculated diffusion coefficient Dp exhibits a weak correlation with average pore diameter (Figure 10a), strong positive correlation with pore volume (Figure 10b), and moderate positive correlation with BET specific surface area (Figure 10c). Diffusion coefficient D shows a weak positive correlation with specific surface area and volume of micropores (Figure 11a,b) and likewise a moderate positive correlation with mesopores (Figure 11c,d) and a strong positive correlation with macropores (Figure 11e,f). The weak correlation observed between Dp and average pore diameter appears to deviate from previous research that suggested a positive relationship [70,71]. However, this weak correlation is not an anomaly but a critical insight that highlights the limitations of using a single average parameter to describe transport in a complex, multiscale porous system. This finding is consistent with study on heterogeneous media, which emphasizes that transport properties are governed by the full pore size distribution and network connectivity [3,19]. The average pore diameter often represents a volume-weighted average and fails to account for the actual pore size distribution. As shown in Figure 6 and Table 3, coal pores exhibit a broad distribution spanning micropores, mesopores, and macropores. While the average diameter provides a single number, it does not reveal the dominance of macropores in contributing to total pore volume or the crucial role of mesopores in providing the majority of surface area. The diffusion process is not merely a function of a mean pore size but is profoundly affected by the ensemble of interconnected pathways and the bottlenecks present within the most conductive flow paths [72]. The strong positive correlation between Dp and total pore volume (Figure 10b), as well as macropore volume and surface area (Figure 11e,f), highlights that larger pores provide the primary conduits for bulk flow, reducing the overall resistance to gas transport [73,74,75]. Even if the average pore diameter is small due to a significant fraction of micropores, if a well-connected network of macropores exists, the overall diffusion can still be high.

4.6. Controls of Pore Structure Parameters over Diffusion Coefficients Across the Scales

We establish a multiple linear regression model to systematically explore the mechanisms by which pore structure parameters influence diffusion coefficient. In this, experimental data are used to quantitatively analyze the coupling relationship between measured pore volume parameters at different scales with the calculated diffusion coefficients. In constructing the multiple regression model, the volumes of micropores (Vmicro), mesopores (Vmeso) and macropores (Vmacro), were selected as independent variables. Parameters of specific surface area and average pore diameter were excluded for the following two reasons. First, pore volume is highly correlated with the corresponding specific surface area [72,76], thus including both would introduce multicollinearity, leading to distorted regression coefficients. Second, from a mechanistic perspective, pore volume, as a key parameter governing the diffusion space, has a more direct impact on the diffusion coefficient than specific surface area, which is primarily associated with adsorption performance [41,77,78].
Multiple linear regression is a statistical method used to investigate the linear relationship between a single dependent variable (D) and multiple independent variables (Vmicro, Vmeso, and Vmacro), thus:
D = β 0 + β 1 V micro + β 2 V meso + β 3 V macro + ε
where β0 is the intercept term; β1, β2, and β3 are the regression coefficients for each pore parameter, representing the average change in the diffusion coefficient when the corresponding variable changes by one unit while holding other variables constant; and ε is the random error term, accounting for the unexplained variation in the model.
The model parameters are estimated using ordinary least squares (OLS), minimizing the sum of squared residuals between the predicted and actual values as:
Minimize   RSS = i = 1 n D i D ^ i 2 = i = 1 n D i β ^ 0 + β ^ 1 V micro , i + β ^ 2 V meso , i + β ^ 3 V macro , i 2
By solving the system of equations where the partial derivatives are set to zero, the parameter estimates are obtained:
β ^ = X T X 1 X T y
Due to the differing scales of the original variables (Vmicro, Vmeso, and Vmacro are of a similar order of magnitude, while D is on the order of 10 × 10−10), a direct comparison of the regression coefficients would be misleading. Standardized regression addresses this by transforming the data into standardized variables with a mean of zero and a standard deviation of one:
x i * = x i x ¯ S x
The standardized regression coefficients (beta weights) allow for a direct comparison of variable importance, indicating the number of standard deviations the dependent variable changes in response to a one-standard-deviation change in the independent variable. Using 12 sets of measured data, the parameters were estimated via the ordinary least squares method, yielding the following multiple linear regression equation for low pressure (1 MPa):
D = 9.4812 e 10 1.4102 e 6 V micro 1.15191 e 6 V meso + 2.1620 e 6 V macro
While for high pressure (5.8 MPa) the multiple linear regression equation is:
D = 1.3876 e 11 7.9523 e 6 V micro + 2.1080 e 7 V meso + 2.4809 e 7 V macro
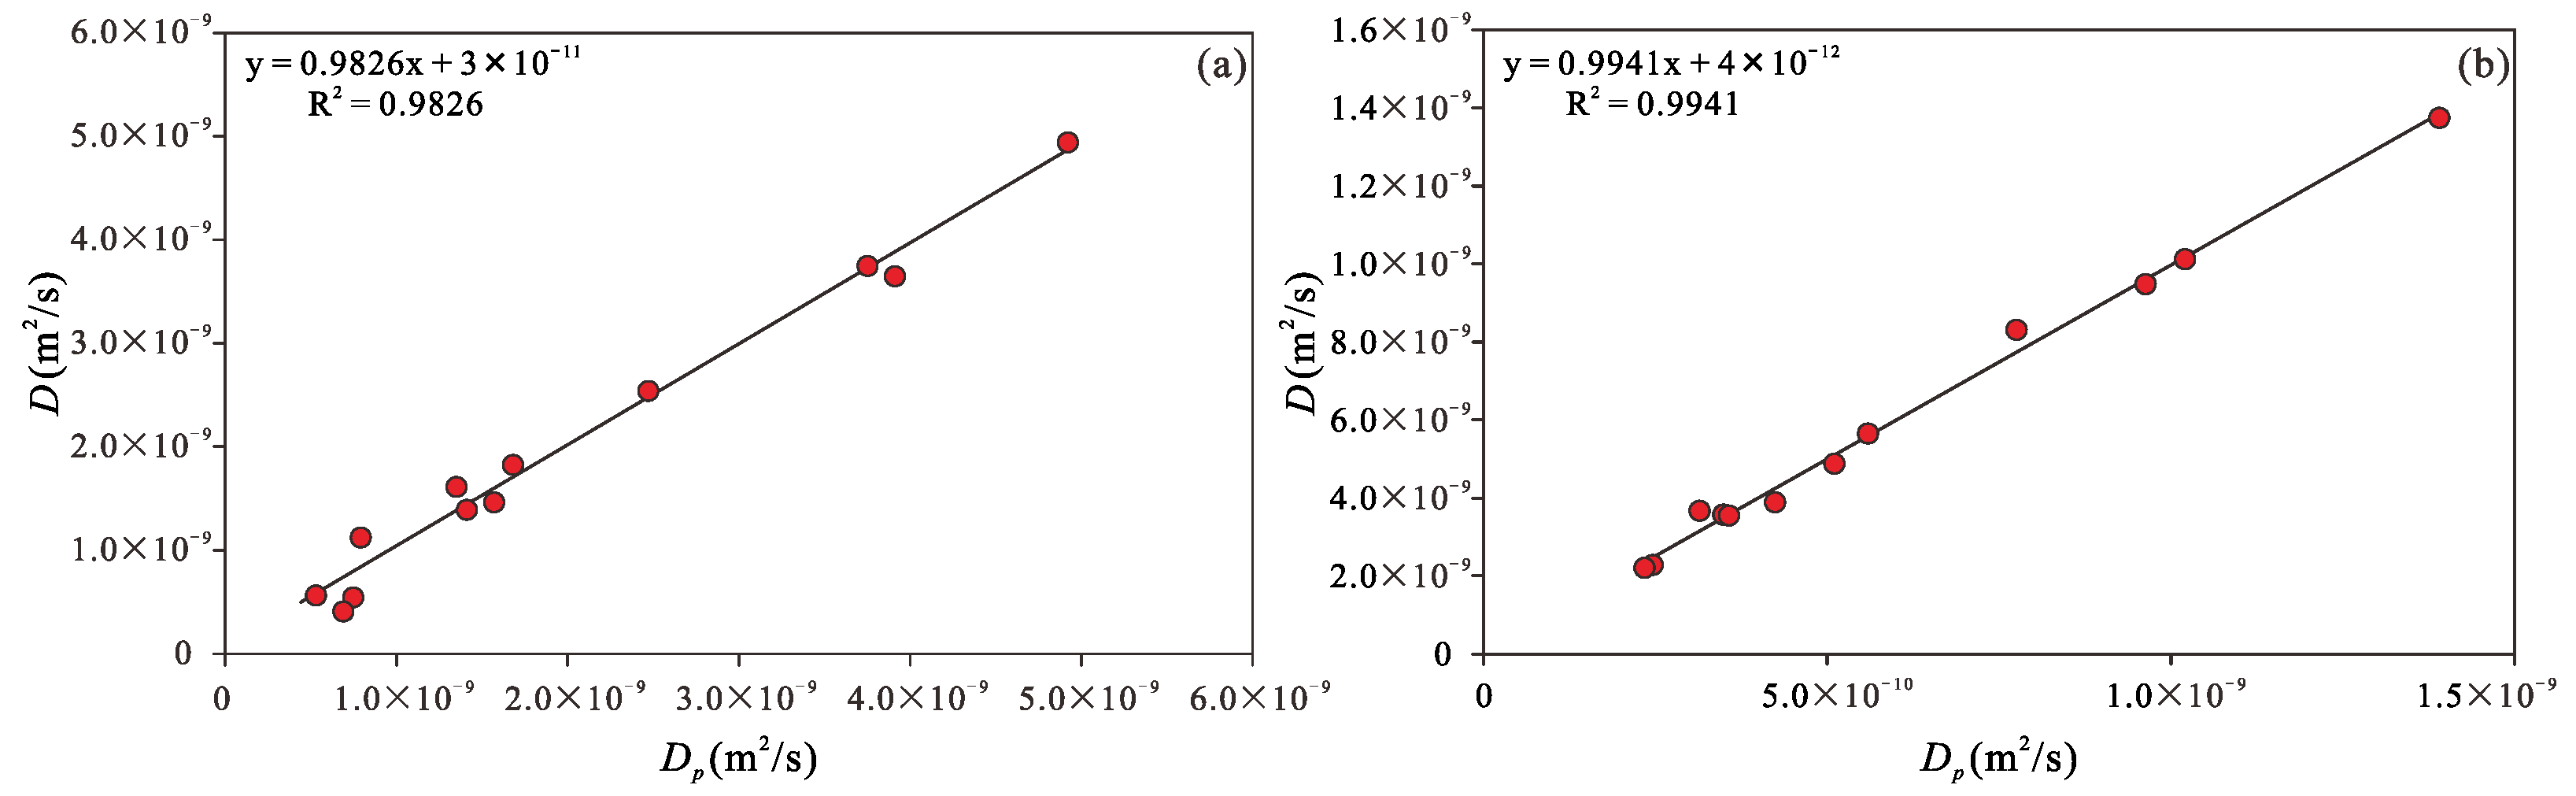
The multiple linear regression results provide a quantitative framework for elucidating how pore systems of different scales control gas diffusion under both low- and high-pressure conditions. Using the micropore, mesopore, and macropore volumes listed in Table 6 as independent variables, and the calculated diffusion coefficients at 1 MPa and 5.8 MPa as dependent variables, two regression models corresponding to the two pressure conditions were established. Under low-pressure conditions (1 MPa), the model exhibits an excellent goodness of fit, with R2 = 0.9826 (Figure 12a). Under high-pressure conditions (5.8 MPa), the model fit is even stronger, with R2 = 0.9941 (Figure 12b). These results demonstrate that, at both pressures, pore volume structure is the dominant factor controlling the calculated diffusion coefficient and that the regression models effectively capture the intrinsic relationship between pore structure and diffusion behavior.
Based on the absolute values of the standardized coefficients, the relative importance of the different pore types follows the order: macropore volume > mesopore volume > micropore volume. Notably, the standardized coefficient for micropore volume is negative, indicating that, after excluding the effects of mesopores and macropores, further enrichment of micropore space tends to suppress the effective diffusion coefficient rather than enhance it. This observation has clear physical significance, reflecting the dual role of the coal pore system in both storage and transport.
As shown in Figure 11, the diffusion coefficient exhibits only a weak correlation with micropore-related parameters, a moderate positive correlation with mesopore parameters, and the strongest positive correlation with the specific surface area and pore volume of macropores. In particular, the correlation between the diffusion coefficient and macropore volume is especially pronounced, reaching R2 = 0.7733 and 0.9824 at 1 MPa and 5.8 MPa, respectively. By comparison, the corresponding values for mesopore volume are only R2 = 0.3503 and 0.6351, whereas those for micropore volume are merely R2 = 0.0047 and 0.1863. Taken together, these statistical results indicate that the measurable diffusion response is controlled primarily by larger and better-connected transport spaces, whereas micropores play only a relatively limited role in determining the apparent diffusion coefficient.
Under low-pressure conditions (e.g., 1 MPa), the mean free path of gas molecules (λ) is relatively large and may become comparable to mesopore diameters. Under such circumstances, a substantial proportion of pores within the network satisfy Kn ≥ 1, indicating that gas transport is dominated by Knudsen diffusion. In this regime, molecule–wall collisions prevail over intermolecular collisions, and the diffusion coefficient shows a strong dependence on characteristic pore size. Consequently, well-developed macropores markedly enhance the overall diffusion capacity by providing wider channels for Knudsen flow. Gas diffusion in coal can therefore be described as a weighted combination of Knudsen diffusion and bulk diffusion, with the weighting factor governed by the Knudsen number, which itself depends on the ratio of the molecular mean free path to pore diameter. As pressure increases, the molecular mean free path decreases, and the contribution of Knudsen diffusion correspondingly weakens. As a result, Dp decreases progressively from 1 MPa to 5.8 MPa in all samples. At the same time, the tortuous and fractal nature of the coal pore network implies that this transition in diffusion mechanism is strongly scale-dependent. Different pore types contribute unequally to diffusion because they differ not only in size but also in connectivity, effective transport space, and the degree of wall-confinement effects.
Under low-pressure conditions (1 MPa), the relatively long molecular mean free path means that, over a substantial portion of the pore network, especially in small and intermediate pores, gas–wall collisions occur more frequently than intermolecular collisions. Under these conditions, Knudsen diffusion dominates, and larger effective pore diameters correspond to lower transport resistance [79]. Macropores provide wider and more continuous migration pathways, thereby reducing the resistance associated with pore–wall collisions and directly increasing the proportion of the pore network capable of efficient transport. Mesopores act as intermediate relay channels between the smallest pores and the macropore-dominated transport skeleton, enhancing pathway continuity and alleviating local diffusion bottlenecks. In contrast, the contribution of micropores under low pressure is nearly negligible. Although micropores increase internal specific surface area and enhance gas storage capacity [80], their extremely small pore diameters impose strong confinement and hinder the release of molecules from the adsorbed state. Thus, micropores primarily function as storage and desorption spaces rather than efficient pathways for long-range diffusion [81].
Under high-pressure conditions (5.8 MPa), the molecular mean free path decreases significantly, the Knudsen number is reduced, and the contribution of bulk diffusion to the overall transport process becomes more substantial. Accordingly, the diffusion coefficients of all samples are markedly lower than those at 1 MPa, and the Dp–pressure curves become flatter in the high-pressure region, indicating reduced pressure sensitivity when bulk diffusion becomes more important. Even under these conditions, macropores remain the most influential pore type. This suggests that their role is not limited to facilitating Knudsen transport at low pressure; rather, they continue to serve as the structural backbone of the effective transport network even when intermolecular collisions become more pronounced.
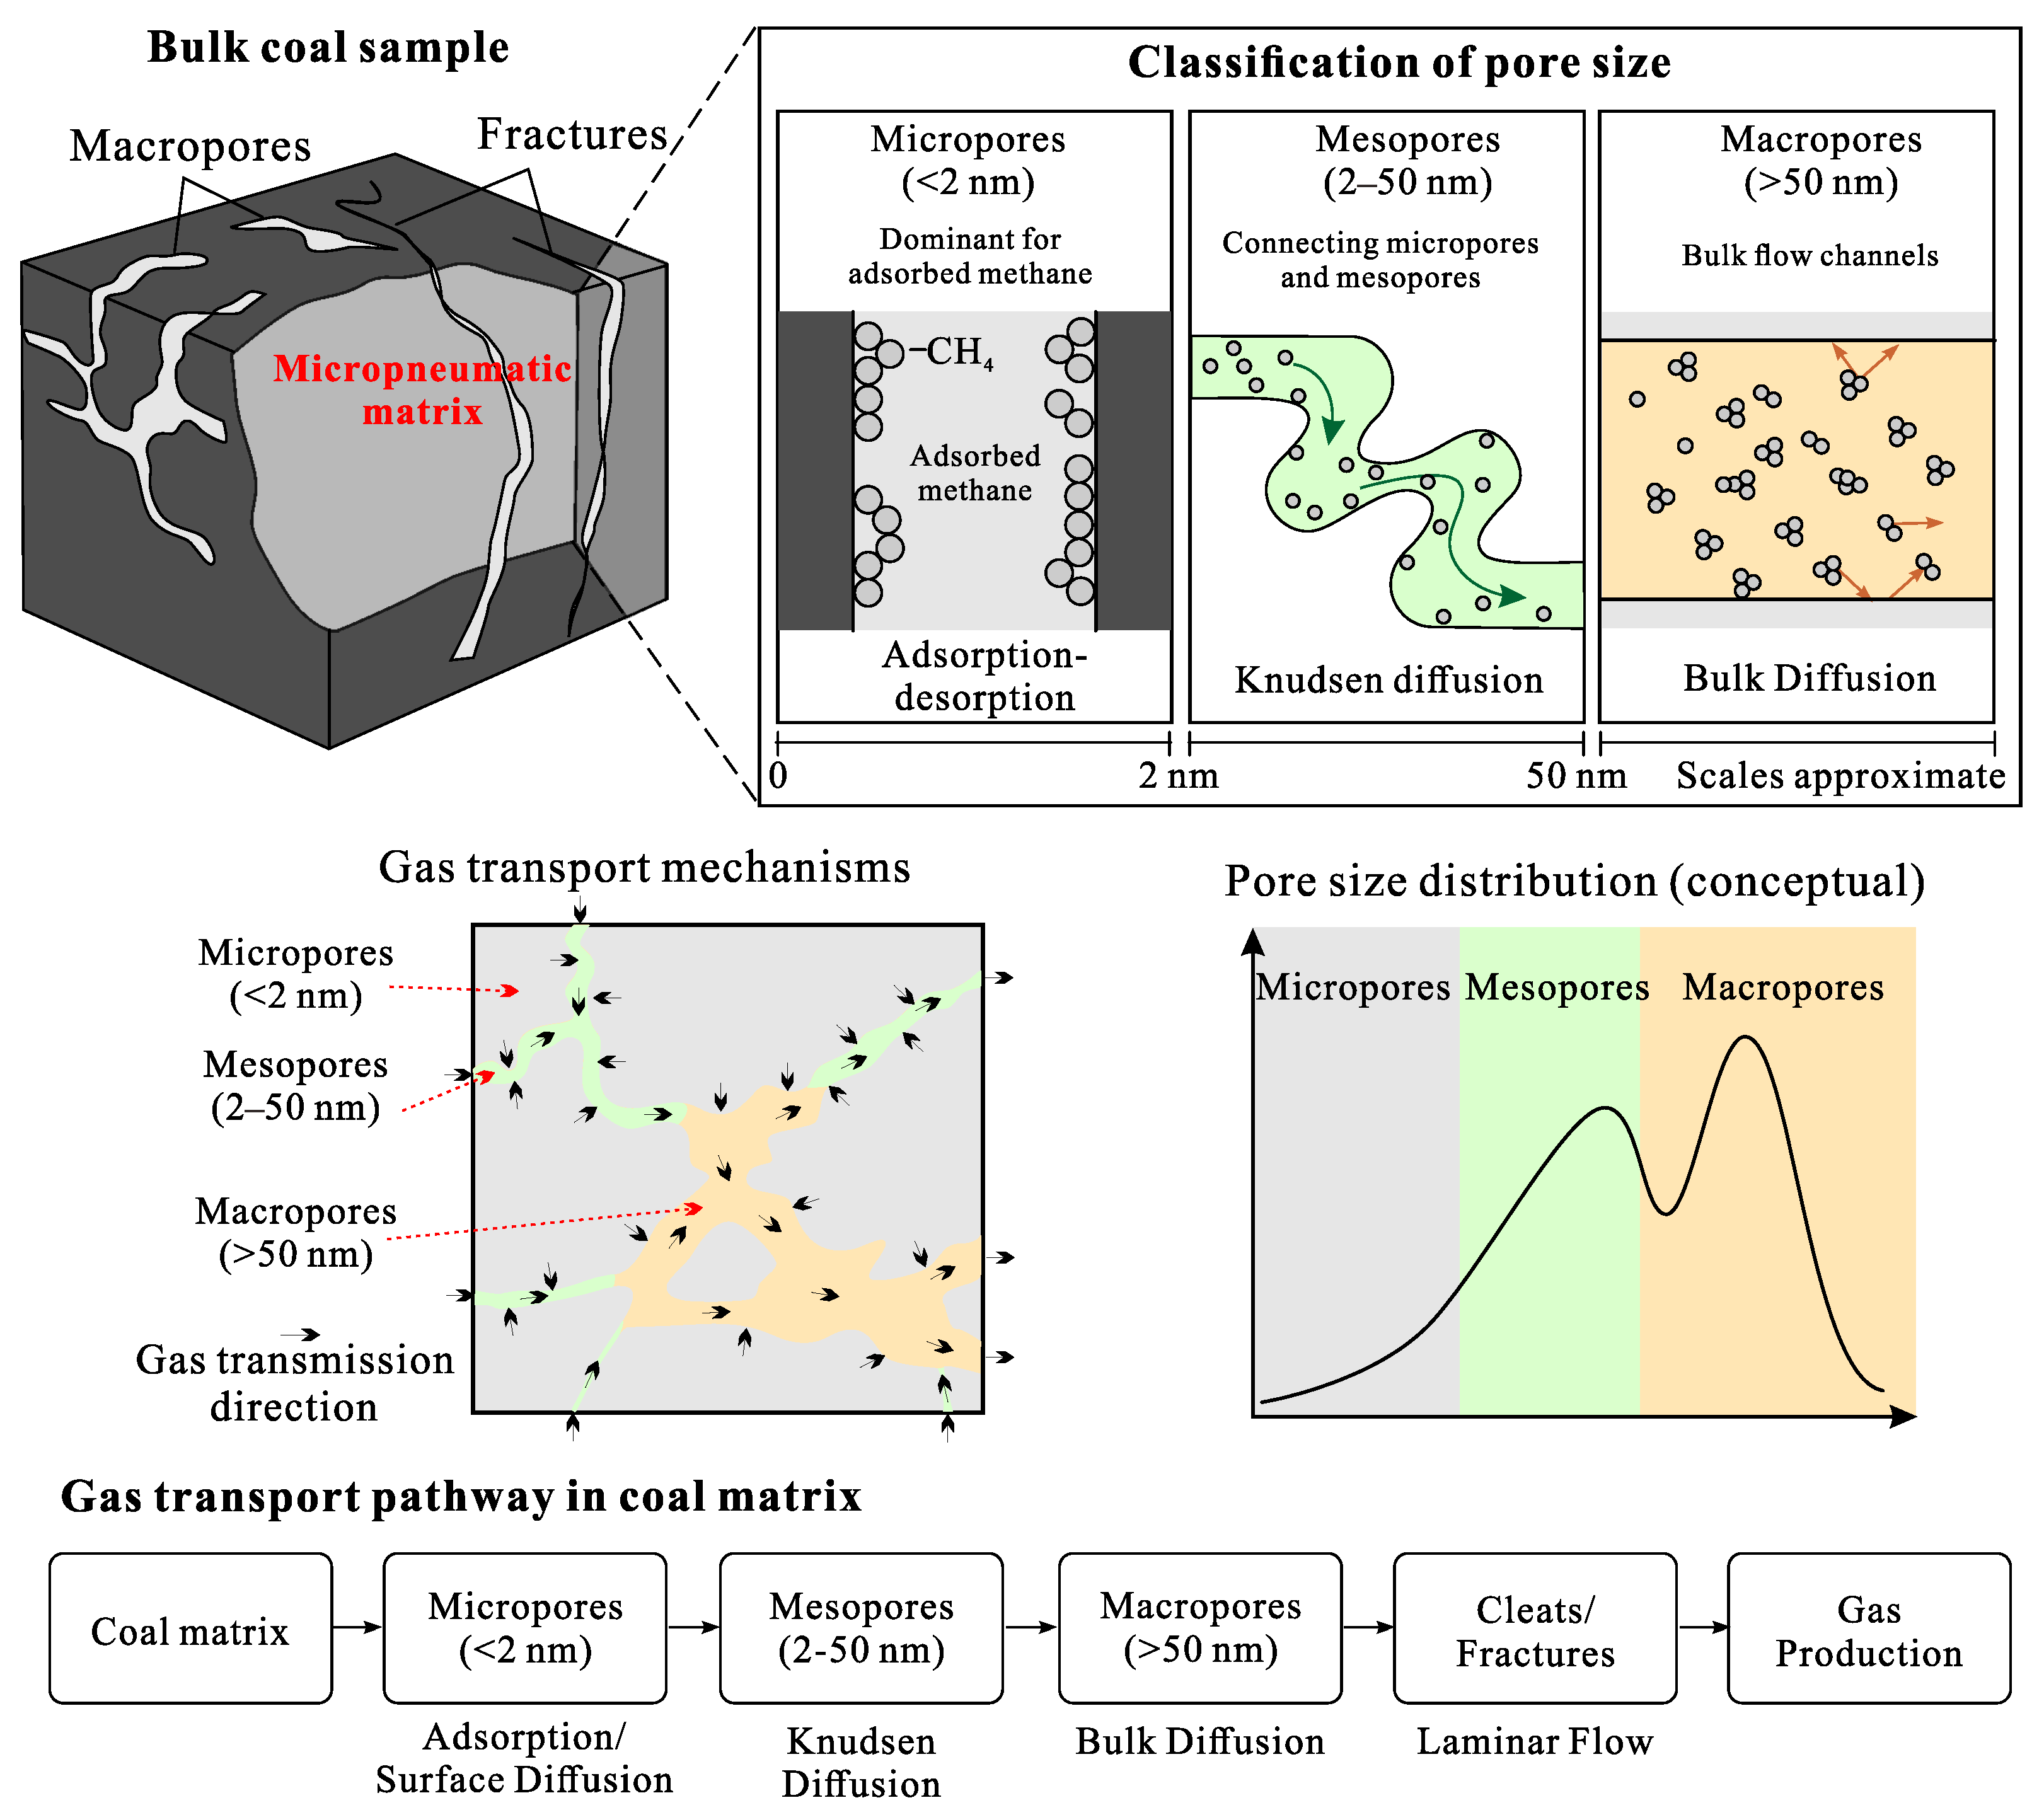
These results reveal a clear functional differentiation among pore types during pressure-dependent gas diffusion [82] (Figure 13). Micropores are primarily responsible for gas occurrence and adsorptive storage, but their narrow pore throats and strong surface interactions hinder rapid molecular migration [83]. Mesopores serve as transitional and matching pores, connecting micropore storage domains with larger transport channels and mitigating structural discontinuities across pore scales. In contrast, macropores function as the principal flow-conducting network within the coal matrix, providing low-resistance and well-connected pathways for long-distance gas migration. Therefore, the total diffusion coefficient is not governed by a single pore-size range but rather by the coordinated organization of storage space, transitional space, and transport space within a multiscale pore network [82]. Nevertheless, among all pore types, macropores make the greatest contribution to the apparent diffusion coefficient under both low- and high-pressure conditions.
It should also be noted that the diffusion coefficient shows only a weak relationship with average pore diameter, even though pore size plays a central role in the Knudsen diffusion framework. This seemingly paradoxical result indicates that average pore diameter alone cannot adequately characterize either the pore size distribution or the network topology of coal. Diffusion is not controlled by a single representative pore size but instead by the combined effects of total pore volume, scale-dependent connectivity, tortuosity, and the spatial distribution of different pore domains. Even if a coal sample exhibits a larger average pore diameter, its diffusion performance may still be poor if transport pathways are poorly connected or if micropore-rich bottlenecks interrupt serial migration pathways. Therefore, the controlling factors of diffusion are inherently multiscale and network-dependent and cannot be reduced to any single geometric parameter.
In summary, the relative importance of the different pore types exhibits a clear hierarchy. Macropore volume has the largest standardized coefficient and forms the low-resistance transport network, dominating effective transport under both Knudsen and bulk diffusion regimes. Mesopores act as transitional domains that connect micropore storage spaces with macropore flow pathways and alleviate scale discontinuities. In contrast, micropores exhibit a negative standardized coefficient and only weak correlations with diffusion coefficient, indicating that they primarily serve as gas storage domains and that their further enrichment may actually suppress the apparent diffusion coefficient. Gas transport efficiency is therefore jointly governed by pore volume distribution, connectivity, tortuosity, and multiscale network topology. This study not only provides a robust modeling basis for quantitatively linking coal pore structure with diffusion behavior but also reveals the physical essence of the functional differentiation between storage and transport within pore systems under pressure-dependent conditions. These findings are of substantial theoretical significance for advancing the understanding of coalbed methane migration mechanisms.

5. Conclusions

This study analyzes coal pore structure based on low-temperature N2 adsorption experiments and fractal theory and investigates the relationships between diffusion coefficient and pore structure. The following conclusions are apparent:
(1) Quantitative analysis using low-temperature N2 adsorption confirms a complex pore network comprising micropores, mesopores, and macropores. While mesopores and macropores contribute the majority of the total pore volume, mesopores are the dominant contributors to the total specific surface area.
(2) Based on N2 adsorption data and the FHH model, the comprehensive fractal dimension (Fc) is calculated and ranges from 2.415 to 2.784, suggesting that the pore network exhibits strong fractal characteristics with pronounced structural complexity and surface heterogeneity.
(3) Macropores dominate gas diffusion as the primary low-resistance transport network under both Knudsen and bulk diffusion regimes, mesopores serve as transitional pathways linking storage and transport domains, whereas micropores mainly function as gas storage sites and may even inhibit apparent diffusion when overdeveloped; collectively, gas transport is governed by the coupled effects of pore volume distribution, connectivity, tortuosity, and multiscale pore network topology.

Author Contributions

Conceptualization, Z.L.; methodology, Z.L.; writing—original draft preparation, Z.L.; writing—review and editing, D.E. and S.C.; resources, D.Y.; supervision, Z.L.; funding acquisition, Z.L. All authors have read and agreed to the published version of the manuscript.

Funding

This work was funded by the National Natural Science Foundation of China (No. 42502114).

Data Availability Statement

The data that support the findings of this study are available within the article.

Conflicts of Interest

The authors declare no conflicts of interest.

References

  1. Xu, C.; Wang, W.; Wang, K.; Guo, L.; Yang, T.; Nie, Z.; Shi, Y. Non-homogeneous characterisation of nanopore structures in low-, medium- and high-rank coals based on gas adsorption and multifractal theory. Fuel 2025, 401, 135947. [Google Scholar] [CrossRef]
  2. Li, Y.; Guo, X.; Song, D.; Liu, S.; Pan, J.; Wang, H. Expulsion of small molecule hydrocarbons and expansion of nanopores effect in tectonically deformed coal evolution. Fuel 2024, 357, 129961. [Google Scholar] [CrossRef]
  3. Wang, K.; Guo, L.; Xu, C.; Wang, W.; Yang, T.; Lin, S.; Cai, Y. Multiscale characteristics of pore-fracture structures in coal reservoirs and their influence on coalbed methane (CBM) transport: A review. Geoenergy Sci. Eng. 2024, 242, 213181. [Google Scholar] [CrossRef]
  4. He, J.; Li, H.; Yang, W.; Lu, J.; Lu, Y.; Liu, T.; Shi, S. Experimental study on erosion mechanism and pore structure evolution of bituminous and anthracite coal under matrix acidification and its significance to coalbed methane recovery. Energy 2023, 283, 128485. [Google Scholar] [CrossRef]
  5. Wei, Q.; Li, X.; Hu, B.; Zhang, X.; Zhang, J.; He, Y.; Zhang, Y.; Zhu, W. Reservoir characteristics and coalbed methane resource evaluation of deep-buried coals: A case study of the No.13–1 coal seam from the Panji Deep Area in Huainan Coalfield, Southern North China. J. Pet. Sci. Eng. 2019, 179, 867–884. [Google Scholar] [CrossRef]
  6. Wang, Z.; Wang, G.; Hao, C.; Hu, B.; Cheng, Y.; Liu, Z.; Qi, G. Study on Multifractal of Coal Pore Structure Based on Low Pressure Argon Adsorption and Its Effect on Gas Adsorption/Desorption. Energy Fuels 2023, 37, 10915–10928. [Google Scholar] [CrossRef]
  7. Jia, Q.; Kou, B.; Shi, Q. The evolution of closed pores induced by in situ pyrolysis of coal and its effect on volatile yield. J. Anal. Appl. Pyrolysis 2026, 193, 107386. [Google Scholar] [CrossRef]
  8. Liu, S.; Harpalani, S. Permeability prediction of coalbed methane reservoirs during primary depletion. Int. J. Coal Geol. 2013, 113, 1–10. [Google Scholar] [CrossRef]
  9. Wang, Y.; Liu, S. Estimation of Pressure-Dependent Diffusive Permeability of Coal Using Methane Diffusion Coefficient: Laboratory Measurements and Modeling. Energy Fuels 2016, 30, 8968–8976. [Google Scholar] [CrossRef]
  10. Shi, R.; Elsworth, D.; Wang, X.; Shen, J.; Liu, J.; Wang, Z. Multimodal Evolution of Coal Permeability due to Interior Deformations within a Triple Porosity System. SPE J. 2023, 28, 1945–1955. [Google Scholar] [CrossRef]
  11. Li, J.; Qin, Y.; Shen, J.; Chen, Y. Evolution of carbon nanostructures during coal graphitization: Insights from X-ray diffraction and high-resolution transmission electron microscopy. Energy 2024, 290, 130316. [Google Scholar] [CrossRef]
  12. Zang, J.; Liu, J.; He, J.; Zhang, X. Characterization of the pore structure in Chinese anthracite coal using FIB-SEM tomography and deep learning-based segmentation. Energy 2023, 282, 128686. [Google Scholar] [CrossRef]
  13. Prehal, C.; Grätz, S.; Krüner, B.; Thommes, M.; Borchardt, L.; Presser, V.; Paris, O. Comparing pore structure models of nanoporous carbons obtained from small angle X-ray scattering and gas adsorption. Carbon 2019, 152, 416–423. [Google Scholar] [CrossRef]
  14. Ji, Y.; Grigore, M.; Radlinski, A.P.; Piane, C.D.; Blach, T.; Chen, X.; Vu, P.; Sun, M.; Sakurovs, R.; de Campo, L.; et al. Nanopore structure characterization of Velkerri Shale: SANS investigation of pore accessibility and anisotropy. Fuel 2026, 403, 136079. [Google Scholar] [CrossRef]
  15. Zhang, Y.; Gao, Y.; Yu, L. Multi-stage evolution of pore structure of microwave-treated sandstone: Insights from nuclear magnetic resonance. Int. J. Rock. Mech. Min. Sci. 2024, 183, 105952. [Google Scholar] [CrossRef]
  16. Dong, J.; Huang, Z.; Chen, J.; Li, T.; Zhao, J.; Pan, Y.; Qu, T. Pore Structure and Fractal Characteristics of Tight Sandstone: A Case Study for Huagang Formation in the Xihu Sag, East China Sea Basin, China. Energies 2023, 16, 2013. [Google Scholar] [CrossRef]
  17. Chen, S.; Li, X.; Chen, S.; Wang, Y.; Gong, Z.; Zhang, Y. A new application of atomic force microscopy in the characterization of pore structure and pore contribution in shale gas reservoirs. J. Nat. Gas Sci. Eng. 2021, 88, 103802. [Google Scholar] [CrossRef]
  18. Zhao, J.; Liu, K.; Zhao, S.; Hu, Q.; Wu, W.; Chen, Y.; Liu, G.; Li, J.; Yu, L.; You, Z.; et al. Response of organic matter pore development to functional groups in overmature marine shale: Insights from AFM-IR spectroscopy. Pet. Explor. Dev. 2025, 52, 445–458. [Google Scholar] [CrossRef]
  19. Zheng, H.; Yang, F.; Guo, Q.; Pan, S.; Jiang, S.; Wang, H. Multi-scale pore structure, pore network and pore connectivity of tight shale oil reservoir from Triassic Yanchang Formation, Ordos Basin. J. Pet. Sci. Eng. 2022, 212, 110283. [Google Scholar] [CrossRef]
  20. Song, L.; Guo, X.; Deng, C.; Zhang, L.; Zhang, Y.; Cao, L. Impact mechanism of microscopic pore structure on sensitivity and ability of CO2-ECBM based on X-ray nano-CT. Gas Sci. Eng. 2024, 130, 205436. [Google Scholar] [CrossRef]
  21. Liu, D.; Xu, M.; Chen, H.; Chen, Y.; Feng, X.; Jiang, Z.; Fan, Q.; Liu, L.; Du, W. Pore Structure and Its Controlling Factors of Cambrian Highly Over-Mature Marine Shales in the Upper Yangtze Block, SW China. J. Mar. Sci. Eng. 2025, 13, 1002. [Google Scholar] [CrossRef]
  22. Wang, G.; Jin, Z.; Zhang, Q.; Zhu, R.; Tang, X.; Liu, K.; Dong, L. Effects of clay minerals and organic matter on pore evolution of the early mature lacustrine shale in the Ordos Basin, China. J. Asian Earth Sci. 2023, 246, 105516. [Google Scholar] [CrossRef]
  23. Liu, Z.X.; Yan, D.T.; Niu, X. Insights into Pore Structure and Fractal Characteristics of the Lower Cambrian Niutitang Formation Shale on the Yangtze Platform, South China. J. Earth Sci. 2020, 31, 169–180. [Google Scholar] [CrossRef]
  24. Xue, Y.; Wu, W. Characterization of brittleness evolution of hot dry rock during cyclic thermal treatment. Acta Geotech. 2026. [Google Scholar] [CrossRef]
  25. Sing, K.S. Reporting physisorption data for gas/solid systems with special reference to the determination of surface area and porosity (Recommendations 1984). Pure Appl. Chem. 1985, 57, 603–619. [Google Scholar] [CrossRef]
  26. Mandelbrot, B. Les objets fractals: Forme, hasard et dimension. Paris 1989, 233, 5. [Google Scholar]
  27. He, H.; Liu, P.; Xu, L.; Hao, S.; Qiu, X.; Shan, C.; Zhou, Y. Pore structure representations based on nitrogen adsorption experiments and an FHH fractal model: Case study of the block Z shales in the Ordos Basin, China. J. Pet. Sci. Eng. 2021, 203, 108661. [Google Scholar] [CrossRef]
  28. Lin, H.; Bai, Y.; Bu, J.; Li, S.; Yan, M.; Zhao, P.; Qin, L. Comprehensive Fractal Model and Pore Structural Features of Medium- and Low-Rank Coal from the Zhunnan Coalfield of Xinjiang, China. Energies 2020, 13, 7. [Google Scholar] [CrossRef]
  29. Wood, D.A. Deriving coal fractal dimensions from low-pressure nitrogen adsorption isotherms applying an integrated method. Appl. Geochem. 2021, 131, 105042. [Google Scholar] [CrossRef]
  30. Fan, Y.; Liu, K.; Yu, L.; Liu, J.; Regenauer-Lieb, K. Assessment of multi-scale pore structures and pore connectivity domains of marine shales by fractal dimensions and correlation lengths. Fuel 2022, 330, 125463. [Google Scholar] [CrossRef]
  31. Ren, H.; Guo, Z.; Xie, H.; Han, S.; Zhou, X.; Zhao, L.; Wei, Y.; Qiu, W. Characteristics of the Microfracture and Pore Structure of Middle- and High-Rank Coal and Their Implications for CBM Exploration and Development in Northern Guizhou. Energies 2025, 18, 5. [Google Scholar] [CrossRef]
  32. Wood, D.A. Complex interactions between coal maceral fractions, thermal maturity, reaction kinetics, fractal dimensions and pore-size distributions: Implications for gas storage. Int. J. Coal Geol. 2025, 305, 104788. [Google Scholar] [CrossRef]
  33. Li, Z.; Ren, T.; Li, X.; Qiao, M.; Yang, X.; Tan, L.; Nie, B. Multi-scale pore fractal characteristics of differently ranked coal and its impact on gas adsorption. Int. J. Min. Sci. Technol. 2023, 33, 389–401. [Google Scholar] [CrossRef]
  34. Wang, L.; Wu, S.; Han, S.; Hu, B.; Wang, Q.; Zhang, K.; Song, T. Fractal Analysis of Coal Pore Structure Based on Low-Pressure Gas Adsorption and Its Influence on Methane Adsorption Capacity: A Perspective from Micropore Filling Model. Energy Fuels 2024, 38, 4031–4046. [Google Scholar] [CrossRef]
  35. Li, A.; Ding, W.L.; He, J.H.; Dai, P.; Yin, S.; Xie, F. Investigation of pore structure and fractal characteristics of organic-rich shale reservoirs: A case study of Lower Cambrian Qiongzhusi formation in Malong block of eastern Yunnan Province, South China. Mar. Pet. Geol. 2016, 70, 46–57. [Google Scholar] [CrossRef]
  36. Zheng, Q.; Yu, B.; Wang, S.; Luo, L. A diffusivity model for gas diffusion through fractal porous media. Chem. Eng. Sci. 2012, 68, 650–655. [Google Scholar] [CrossRef]
  37. Nie, X.; Cheng, Y.; Cheng, X.; Lu, Z.; Wang, L.; Liu, C. A dynamic coupled model of coal body gas migration considering the effect of stress on gas diffusion. Fuel 2026, 405, 136759. [Google Scholar] [CrossRef]
  38. Zhengzheng, C.; Yi, X.; Yi, X.; Feng, D.; Zhenhua, L.; Cunhan, H.; Shuren, W.; Yongqiang, Y.; Wenqiang, W.; Minglei, Z.; et al. Diffusion Evolution Rules of Grouting Slurry in Mining-induced Cracks in Overlying Strata. Rock. Mech. Rock. Eng. 2025, 58, 6493–6512. [Google Scholar] [CrossRef]
  39. Wang, K.; Guo, L.; Xu, C.; Wang, W.; Yang, T.; Hu, Y.; Nie, Z. Control mechanisms of methane transport in coal: Dominant factors of methane diffusion governed by multi-scale pore structures. Int. J. Hydrogen Energy 2025, 140, 315–332. [Google Scholar] [CrossRef]
  40. Zhang, K.; Wang, B.; Jin, Y.; Zhao, J.; Yu, Y. Discrepancies on adsorption/desorption and diffusion kinetic behaviors of methane molecules and pore structure characters in coals with different deformations. Chem. Eng. J. 2025, 519, 165077. [Google Scholar] [CrossRef]
  41. Liu, H.; Mou, J.; Cheng, Y. Impact of pore structure on gas adsorption and diffusion dynamics for long-flame coal. J. Nat. Gas Sci. Eng. 2015, 22, 203–213. [Google Scholar] [CrossRef]
  42. Yang, Y.; Liu, S. Estimation and modeling of pressure-dependent gas diffusion coefficient for coal: A fractal theory-based approach. Fuel 2019, 253, 588–606. [Google Scholar] [CrossRef]
  43. Wang, G.; Pei, Z.; Zhou, Z.; Xiao, Z.; Wang, L. Depositional features of mid-lower Permian in west Henan area. Nat. Gas Ind. 2003, 23, 24–27+175–176. (In Chinese) [Google Scholar]
  44. Zheng, Q.; Zhang, Y.; Zhao, D.; Liu, Z.; Peng, G. Tectonic Evolution and Upper Triassic Distribution inthe Western Henan. Pet. Geol. Eng. 1998, 12, 6–10+59. (In Chinese) [Google Scholar]
  45. Chen, B.; Stuart, F.M.; Xu, S.; Györe, D.; Liu, C. Evolution of coal-bed methane in Southeast Qinshui Basin, China: Insights from stable and noble gas isotopes. Chem. Geol. 2019, 529, 119298. [Google Scholar] [CrossRef]
  46. Yuan, D.; Wang, X.; Yan, D.; Li, J.; Li, B.; Liu, B.; Liu, Z.; Zhang, L. An original set of nanometer-scale mineralogical analyses of cookeite and the implications for Li enrichment: No. 21 coal, Mengjin Mine, western Henan. Int. J. Coal Geol. 2024, 283, 104445. [Google Scholar] [CrossRef]
  47. Li, Y.; Shao, L.; Fielding, C.R.; Wang, D.; Mu, G.; Luo, H. Sequence stratigraphic analysis of thick coal seams in paralic environments—A case study from the Early Permian Shanxi Formation in the Anhe coalfield, Henan Province, North China. Int. J. Coal Geol. 2020, 222, 103451. [Google Scholar] [CrossRef]
  48. Dai, S.; Ren, D.; Tang, Y.; Shao, L.; Li, S. Distribution, isotopic variation and origin of sulfur in coals in the Wuda coalfield, Inner Mongolia, China. Int. J. Coal Geol. 2002, 51, 237–250. [Google Scholar] [CrossRef]
  49. GB/T 212-2008; Proximate Analysis of Coal. National Standardization Administration: Beijing, China, 2008.
  50. GB/T 8899-2013; Determination of Maceral Group Composition and Minerals in Coal. National Standardization Administration: Beijing, China, 2013.
  51. GB/T 6948-2008; Method of Determining Microscopically the Reflectance of Vitrinite in Coal. National Standardization Administration: Beijing, China, 2008.
  52. Mastalerz, M.; Wei, L.; Drobniak, A.; Schimmelmann, A.; Schieber, J. Responses of specific surface area and micro- and mesopore characteristics of shale and coal to heating at elevated hydrostatic and lithostatic pressures. Int. J. Coal Geol. 2018, 197, 20–30. [Google Scholar] [CrossRef]
  53. Li, P.; Zhang, X.; Zhang, S. Structures and fractal characteristics of pores in low volatile bituminous deformed coals by low-temperature N2 adsorption after different solvents treatments. Fuel 2018, 224, 661–675. [Google Scholar] [CrossRef]
  54. Ma, X.; Guo, S.; Shi, D.; Zhou, Z.; Liu, G. Investigation of pore structure and fractal characteristics of marine-continental transitional shales from Longtan Formation using MICP, gas adsorption, and NMR (Guizhou, China). Mar. Pet. Geol. 2019, 107, 555–571. [Google Scholar] [CrossRef]
  55. Jiang, L.; Tian, L.; Chen, Z.; Wang, Z.; Huang, W.; Chai, X. Research on the micro-pore structure and multiscale fractal characteristics of shale under supercritical CO2 action: A case study of the Chang 73 submember in the Ordos Basin, China. J. Nat. Gas Geosci. 2025, 10, 159–178. [Google Scholar] [CrossRef]
  56. Wang, M.; Xue, H.; Tian, S.; Wilkins, R.W.T.; Wang, Z. Fractal characteristics of Upper Cretaceous lacustrine shale from the Songliao Basin, NE China. Mar. Pet. Geol. 2015, 67, 144–153. [Google Scholar] [CrossRef]
  57. Yao, Y.; Liu, D.; Tang, D.; Tang, S.; Huang, W. Fractal characterization of adsorption-pores of coals from North China: An investigation on CH4 adsorption capacity of coals. Int. J. Coal Geol. 2008, 73, 27–42. [Google Scholar] [CrossRef]
  58. Jiang, W.; Zhang, Y.; Ma, T.; Chen, S.; Hu, Y.; Wei, Q.; Zhuang, D. Pore Structure and Its Fractal Dimension: A Case Study of the Marine Shales of the Niutitang Formation in Northwest Hunan, South China. Fractal Fract. 2025, 9, 49. [Google Scholar] [CrossRef]
  59. Zhang, S.; Tang, S.; Tang, D.; Huang, W.; Pan, Z. Determining fractal dimensions of coal pores by FHH model: Problems and effects. J. Nat. Gas Sci. Eng. 2014, 21, 929–939. [Google Scholar] [CrossRef]
  60. Chen, K.; Liu, X.; Wang, L.; Song, D.; Nie, B.; Yang, T. Influence of sequestered supercritical CO2 treatment on the pore size distribution of coal across the rank range. Fuel 2021, 306, 121708. [Google Scholar] [CrossRef]
  61. Ren, J.; Zhang, G.; Song, Z.; Liu, G.; Li, B. Comprehensive Fractal Description of Porosity of Coal of Different Ranks. Sci. World J. 2014, 2014, 490318. [Google Scholar] [CrossRef]
  62. Yuan, Y.; Tang, Y.; Tong, L.; Cao, D.; Wei, Y.; Bi, C. Porosity Characteristics of Coal Seams and the Control Mechanisms of Coal Petrology in the Xishanyao Formation in the Western Part of the Southern Junggar Basin. Minerals 2024, 14, 543. [Google Scholar] [CrossRef]
  63. Thommes, M.; Kaneko, K.; Neimark, A.V.; Olivier, J.P.; Rodriguez-Reinoso, F.; Rouquerol, J.; Sing, K.S.W. Physisorption of gases, with special reference to the evaluation of surface area and pore size distribution (IUPAC Technical Report). Pure Appl. Chem. 2015, 87, 1051–1069. [Google Scholar] [CrossRef]
  64. Zhang, Z.; Weller, A. Fractal dimension of pore-space geometry of an Eocene sandstone formation. Geophysics 2014, 79, D377–D387. [Google Scholar] [CrossRef]
  65. Yin, Y. Adsorption isotherm on fractally porous materials. Langmuir 1991, 7, 216–217. [Google Scholar] [CrossRef]
  66. Zou, J.; Chen, W.; Yang, D.; Yuan, J.; Jiao, Y.-Y. Fractal characteristics of the anisotropic microstructure and pore distribution of low-rank coal. AAPG Bull. 2019, 103, 1297–1319. [Google Scholar] [CrossRef]
  67. Knudsen, M. Die Gesetze der Molekularströmung und der inneren Reibungsströmung der Gase durch Röhren. Ann. Phys. 1909, 333, 75–130. [Google Scholar] [CrossRef]
  68. Welty, J.R.; Wicks, C.E.; Wilson, R.E. Conference fundamentals of momentum, heat, and mass transfer. In Fundamentals of Momentum, Heat, and Mass Transfer; John Wiley & Sons: Hoboken, NJ, USA, 2014. [Google Scholar]
  69. Wu, K.; Chen, Z.; Wang, H.; Yang, S.; Li, X.; Shi, J. A Model for Real Gas Transfer in Nanopores of Shale Gas Reservoirs. In Proceedings of the Conference A Model for Real Gas Transfer in Nanopores of Shale Gas Reservoirs, Madrid, Spain, June 2015; SPE: Richardson, TX, USA, 2015. [Google Scholar] [CrossRef]
  70. Li, Z.; Liu, Y.; Xu, Y.; Song, D. Gas diffusion mechanism in multi-scale pores of coal particles and new diffusion model of dynamic diffusion coefficient. J. China Coal Soc. 2016, 41, 633–643. (In Chinese) [Google Scholar]
  71. Chen, Y.; Cao, L.; He, W.; He, R. Effects of pore characteristics of fractal porous media on gas diffusion. Chin. J. Chem. Eng. 2011, 62, 3024–3029. (In Chinese) [Google Scholar]
  72. Cao, T.; Song, Z.; Wang, S.; Xia, J. A comparative study of the specific surface area and pore structure of different shales and their kerogens. Sci. China Earth Sci. 2015, 58, 510–522. [Google Scholar] [CrossRef]
  73. Yuan, Z.; He, G.; Li, S.X.; Misra, R.P.; Strano, M.S.; Blankschtein, D. Gas Separations using Nanoporous Atomically Thin Membranes: Recent Theoretical, Simulation, and Experimental Advances. Adv. Mater. 2022, 34, e2201472. [Google Scholar] [CrossRef]
  74. Rieder, D.R.; Peters, E.A.J.F.; Kuipers, J.A.M. Modeling the Drying Process of Porous Catalysts: Impact of the Pore Size Distribution. Ind. Eng. Chem. Res. 2023, 62, 20006–20016. [Google Scholar] [CrossRef]
  75. Wan, Y.; Lu, W.; Huang, Z.; Qian, R.; Sun, Z. The Gaseous Hydrogen Transport Capacity in Nanopores Coupling Bulk Flow Mechanisms and Surface Diffusion: Integration of Profession and Innovation. Processes 2024, 12, 972. [Google Scholar] [CrossRef]
  76. Scherdel, C.; Reichenauer, G.; Wiener, M. Relationship between pore volumes and surface areas derived from the evaluation of N2-sorption data by DR-, BET- and t-plot. Microporous Mesoporous Mater. 2010, 132, 572–575. [Google Scholar] [CrossRef]
  77. Yang, B.; Kang, Y.; You, L.; Li, X.; Chen, Q. Measurement of the surface diffusion coefficient for adsorbed gas in the fine mesopores and micropores of shale organic matter. Fuel 2016, 181, 793–804. [Google Scholar] [CrossRef]
  78. Zhong, Y.; She, J.; Zhang, H.; Kuru, E.; Yang, B.; Kuang, J. Experimental and numerical analyses of apparent gas diffusion coefficient in gas shales. Fuel 2019, 258, 116123. [Google Scholar] [CrossRef]
  79. Du, Z.; Huang, Q.; Guo, J.; Gao, F.; Du, Y. The occurrence of nano- and micro-scale pores and their controls on the selective migration of gases in the coals of different ranks. Fuel 2020, 264, 116748. [Google Scholar] [CrossRef]
  80. Liu, Y.; Hao, C.; Wang, Z.; Xie, J.; Zhao, W.; Meng, F.; Han, Y. Micropore distribution and methane adsorption process and mechanism in bituminous coals: A molecular dynamics simulation study. J. Environ. Chem. Eng. 2024, 12, 112139. [Google Scholar] [CrossRef]
  81. Ji, P.; Lin, H.; Kong, X.; Li, S.; Hu, B.; Wang, P.; He, D.; Yang, S. Pore structure of low-permeability coal and its deformation characteristics during the adsorption–desorption of CH4/N2. Int. J. Coal Sci. Tech. 2023, 10, 51. [Google Scholar] [CrossRef]
  82. Clarkson, C.R.; Bustin, R.M. The effect of pore structure and gas pressure upon the transport properties of coal: A laboratory and modeling study. 2. Adsorption rate modeling. Fuel 1999, 78, 1345–1362. [Google Scholar] [CrossRef]
  83. Mathias, S.A.; Dentz, M.; Liu, Q. Gas Diffusion in Coal Powders is a Multi-rate Process. Transp. Porous Media 2019, 131, 1037–1051. [Google Scholar] [CrossRef]
Figure 1. (a) Paleogeography of the late Paleozoic in North China [48]; (b) Geological structure outline map of the Mengjin Coalfield; (c) Comprehensive lithological column of the late Paleozoic within the study area. The red star refers to the sampling interval.
Fractalfract 10 00329 g001
Figure 2. Characteristics of hand specimens of No. 21 coal. (a) MJ-12; (b) MJ-8; (c) MJ-7; (d) MJ-5.
Fractalfract 10 00329 g002
Figure 3. Images of pores from optical microscopy. (a,b) Pores in vitrinite. (c,d) Pores in fusinite. (e) Pores in semi-fusinite. (fh) Interparticle pores. (i) Dissolution pores.
Fractalfract 10 00329 g003
Figure 4. Types of physisorption (a) and hysteresis loops (b) [63].
Fractalfract 10 00329 g004
Figure 5. N2 adsorption–desorption isotherms.
Fractalfract 10 00329 g005
Figure 6. Incremental pore volume and pore area.
Fractalfract 10 00329 g006
Figure 7. dV/dlog(W) pore volumes (cm3/g) and dA/dlog(W) pore surface areas (m2/g). V, A, and W refer to pore volume, pore surface area, and pore diameter, respectively.
Fractalfract 10 00329 g007
Figure 8. Plots of ln V − ln (ln (P0/P)).
Fractalfract 10 00329 g008
Figure 9. Pressure-dependent variation in Dp for samples MJ-1 to MJ-12.
Fractalfract 10 00329 g009
Figure 10. Correlations among measured pore structure parameters and calculated diffusion coefficient. (a) Average pore diameter, (b) Total pore volume, and (c) BET specific surface area.
Fractalfract 10 00329 g010
Figure 11. Correlations among parameters of different pores and calculated diffusion coefficient. (a) Micropore specific surface area, (b) Micropore pore volume, (c) Mesopore specific surface area, (d) Mesopore volume, (e) Macropore specific surface area, (f) Macropore pore volume.
Fractalfract 10 00329 g011
Figure 12. Comparison of calculated and model-predicted diffusion coefficient values: (a) Low pore pressure—1 MPa, (b) High pore pressure—5.8 MPa.
Fractalfract 10 00329 g012
Figure 13. Schematic of pore structure and gas diffusion in coal.
Fractalfract 10 00329 g013
Table 1. Vitrinite reflectance, proximate analysis, and coal macerals. “ad”, “d”, and “daf” refer to air dry base, dry base, and dry ash-free base, respectively.
Ro,max (%)Proximate Analysis (wt. %)Coal Macerals (%)
MadAdVdafVitriniteInertiniteLiptinite
2.10.9315.7611.7275.7823.620.61
Table 2. Pore structure parameters recovered from N2 adsorption.
SamplesAverage Pore DiameterTotal Pore VolumeBET Specific Surface Area
(nm)(cm3/g)(m2/g)
MJ-117.250.00180.4061
MJ-227.770.00160.2340
MJ-310.630.00301.1363
MJ-416.460.00290.7031
MJ-58.100.00170.8152
MJ-68.440.00241.1483
MJ-711.640.00130.4604
MJ-85.760.00463.1700
MJ-912.320.00752.4473
MJ-1013.030.00541.6726
MJ-1113.140.00511.5470
MJ-127.090.00673.7894
Table 3. Contributions of pore surface areas and volumes of different pore classifications. Ratio 1 (%) refers to the ratio of incremental pore volume, and Ratio 2 (%) refers to the ratio of incremental pore surface area.
SamplesMicroporesMesoporesMacropores
Ratio 1Ratio 2Ratio 1Ratio 2Ratio 1Ratio 2
MJ-10.245.3020.9660.2678.8034.44
MJ-20.061.2211.7843.9088.1654.88
MJ-30.670.4039.8684.1359.4710.39
MJ-40.405.5326.9573.1272.6521.36
MJ-50.907.9032.7680.2466.3411.85
MJ-60.786.3835.4782.9363.7510.69
MJ-70.576.5727.9475.2571.4918.18
MJ-81.547.2053.2588.0645.214.74
MJ-90.534.2940.4084.2159.0711.50
MJ-100.474.4138.3781.5061.1614.09
MJ-110.454.5735.6279.8863.9315.55
MJ-121.125.8051.5288.8547.365.34
Average0.654.9634.5776.8664.7817.75
Table 4. Evaluated fractal dimensions from FHH model.
SamplesFitting EquationSlope 1F1Fitting EquationSlope 2F2
MJ-1y = −0.1853x − 2.0798−0.18532.815y = −0.4809x − 2.4423−0.48092.519
MJ-2y = −0.1121x − 2.6706−0.11212.888y = −0.5846x − 3.2606−0.58462.415
MJ-3y = −0.3063x − 0.9919−0.30632.694y = −0.3325x − 1.0615−0.33252.668
MJ-4y = −0.2744x − 1.4912−0.27442.726y = −0.4551x − 1.7173−0.45512.545
MJ-5y = −0.2308x − 1.3601−0.23082.769y = −0.2893x − 1.5111−0.28932.711
MJ-6y = −0.2515x − 1.0063−0.25152.749y = −0.2933x − 1.1285−0.29332.707
MJ-7y = −0.2349x − 1.9322−0.23492.765y = −0.3740x − 2.1499−0.37402.626
MJ-8y = −0.2935x + 0.0261−0.29352.707y = −0.2054x + 0.0217−0.20542.795
MJ-9y = −0.3631x − 0.2047−0.36312.637y = −0.3884x − 0.2931−0.38842.612
MJ-10y = −0.3349x − 0.5994−0.33492.665y = −0.4066x − 0.7171−0.40662.594
MJ-11y = −0.3000x − 0.6830−0.30002.700y = −0.4127x − 0.8301−0.41272.587
MJ-12y = −0.3303x + 0.2194−0.33032.670y = −0.2433x + 0.2215−0.24332.757
Table 5. Evaluated comprehensive fractal dimensions.
SamplesDiameter Range (nm)FiVolume RatioComprehensive Fractal
Dimension, Fc
MJ-11.9~32.8150.00612.521
3~304.42.5190.9939
MJ-21.9~32.8880.00002.415
3~280.72.4151.0000
MJ-31.9~32.6940.05042.669
3~400.42.6680.9496
MJ-41.9–32.7260.02052.549
3~263.92.5450.9795
MJ-51.9~32.7690.05332.714
3~2642.7110.9467
MJ-61.9~32.7490.05632.709
3~311.22.7070.9437
MJ-71.9~32.7650.03082.630
3~355.32.6260.9692
MJ-81.9~32.7070.11952.784
3~365.72.7950.8805
MJ-91.9~32.6370.04862.613
3~211.22.6120.9514
MJ-101.9~32.6650.03802.596
3~304.32.5930.9620
MJ-111.9~32.7000.03332.591
3~268.72.5870.9667
MJ-121.9~32.6700.09972.748
3~316.32.7570.9003
Table 6. Specific surface areas and volumes of different pore ranges relative to calculated diffusion coefficients.
SamplesMicroporesMesoporesMacroporesDp—1 MPa
(m2/s)
Dp—5.8 MPa
(m2/s)
Specific Surface Area (m2/g)Volume
(cm3/g)
Specific Surface Area
(m2/g)
Volume
(cm3/g)
Specific Surface Area
(m2/g)
Volume
(cm3/g)
MJ-10.0080.0000030.0890.000340.0520.001301.57 × 10−93.49 × 10⁻¹⁰
MJ-20.0010.0000000.0370.000180.0450.001381.68 × 10−93.14 × 10⁻¹⁰
MJ-30.0390.0000200.5980.001140.0740.001701.41 × 10−95.10 × 10⁻¹⁰
MJ-40.0210.0000100.2920.000750.0860.002022.47 × 10−95.59 × 10⁻¹⁰
MJ-50.0250.0000120.2670.000470.0380.000965.28 × 10−92.46 × 10⁻¹⁰
MJ-60.0340.0000170.4420.000770.0570.001387.90 × 10−103.57 × 10⁻¹⁰
MJ-70.0130.0000070.1490.000350.0370.000887.46 × 10−102.34 × 10⁻¹⁰
MJ-80.1220.0000611.5070.002110.080.001796.89 × 10−104.24 × 10⁻¹⁰
MJ-90.0790.0000391.5540.002970.2110.004334.92 × 10−91.39 × 10⁻⁹
MJ-100.0520.0000250.9430.002020.1630.003223.91 × 10−91.02 × 10⁻⁹
MJ-110.0440.0000220.7860.001730.1530.003113.75 × 10−99.63 × 10⁻¹⁰
MJ-120.1390.0000692.1270.003170.1280.002921.35 × 10−97.75 × 10⁻¹⁰
Disclaimer/Publisher’s Note: The statements, opinions and data contained in all publications are solely those of the individual author(s) and contributor(s) and not of MDPI and/or the editor(s). MDPI and/or the editor(s) disclaim responsibility for any injury to people or property resulting from any ideas, methods, instructions or products referred to in the content.