1. Introduction
The phenomenon of diffusion occurs across various domains, including the transmission of diseases via social networks, the dissemination of information [
1,
2], and the adoption of innovations [
3], as well as the movement of animals, microorganisms, and cells [
4]. Diffusion emerges when a system is not in a state of equilibrium, with random motion facilitating the progression toward uniformity. This process, originally grounded in the field of physics, has consistently been a focal point in stochastic analysis. Moreover, diffusion has numerous significant applications in both scientific research and engineering practices [
5,
6].
In social networks, diffusion plays a central role in shaping public opinion, trust relationships, and collective behavior. Understanding how sentiment spreads in signed networks—where edges carry positive or negative valence—is particularly important, as it reveals the mechanisms behind opinion polarization, echo chambers, and information cocoons [
7,
8].
Understanding diffusion in disordered and complex systems is crucial for deciphering the physical laws and governing equations that underlie transport processes. Spatiotemporal evolution in complex systems is typically encoded by partial differential equations (PDEs) of fractional or integer order with uncertain parameters. These equations stem from a generalized master equation and simple prototypes of random walk models. Recently, fractional kinetic diffusion equations have emerged as a powerful tool for characterizing transport dynamics in complex systems, thanks to their ability to capture the anomalous features observed in various systems [
6].
The nature of diffusion is characterized by the mean square displacement (MSD) over time. Intuitively, MSD measures how far a randomly moving particle (or, in our context, a sentiment signal) spreads from its starting point over a given time interval. Diffusion is typically categorized into normal or anomalous based on how MSD scales with time: linear growth indicates normal diffusion, while non-linear growth indicates anomalous diffusion.
The nature of the diffusion or the walker’s motion can be characterized by the mean square displacement (MSD) over time, which can be calculated analytically. Diffusion is typically categorized into normal or anomalous, measured and classified by MSD. Based on the movements of a particle, MSD is a statistical measurement of distances covered till time
t and is formulated as
, where
and
are the positions of the particle with time
difference, and
denotes the mean of difference of positions related to time. The emergence of anomalies could be due to the length of a given jump, as well as the waiting-time distributions showing infinite variance [
6,
9] or the presence of correlated steps, which compromises their independence [
10,
11].
Brownian motion gives rise to the global emergence pattern of the Gaussian Process that leads to an MSD
that does grow linearly with time and is called “normal diffusion”, embodied as Equation (
1). Normal diffusion reflects the physical fact that the diffusion processes in systems are in equilibrium or very close to equilibrium. The process of normal diffusion is often described as arising from microscopic random walks with independent and identically distributed steps, where the step sizes have a finite variance and a characteristic time between steps can be established. In this scenario, the central limit theorem (CLT) implies that the resulting distribution of particle positions, which is determined by the accumulated sum of steps, converges to a Gaussian (normal) distribution.
Any stochastic process that leads to an MSD that does not grow linearly with time is called “anomalous diffusion”, a characterization shared by an MSD that grows either sublinearly or superlinearly with time, with the former often called subdiffusion and the latter superdiffusion. Anomalous diffusion generally refers to diffusion behavior that does not comply with Fick’s diffusion law or Brownian motion law, i.e.,
where
or
. Diffusion obeying Equation (
2) is called anomalous diffusion, reflecting the characteristic of the diffusion processes in systems that are not in equilibrium or very far from equilibrium. Anomalous diffusion is characterized by a variance growing slower (subdiffusive) or faster (superdiffusive) than normal. The anomalous diffusion behavior manifest in Equation (
2) is intimately connected with the breakdown of the central limit theorem, caused by either broad distributions or long-range correlations. Anomalous diffusion may arise if any of the conditions required for the validity of the CLT are breached.
In brief, diffusion can be classified by the scaling index . When , it is normal diffusion; all other cases are anomalous. is superdiffusive, including (ballistic diffusion), and is subdiffusive.
Anomalous diffusion holds particular significance, given that the majority of natural systems exhibit normal diffusion. Some studies indicate that information diffusion within both Digg and Twitter demonstrates anomalous characteristics, specifically indicating subdiffusion [
12]. Further scrutiny reveals that in some instances, the diffusive type tends toward superdiffusion during the early stages of diffusion.
However, recent empirical studies have revealed that anomalous diffusion is in fact prevalent in many real-world social systems [
12,
13]. Classical diffusion models based on CTRW and fractional equations often assume idealized conditions that may not capture the heterogeneity and non-equilibrium nature of signed networks [
14,
15,
16]. This gap motivates our development of a more general framework that unifies normal and anomalous diffusion within a single analytical description.
Numerous diffusion models [
17,
18] have been proposed, and extensive analyses of diffusion datasets have successfully extracted characteristics and patterns of information diffusion within social networks [
1,
2].
Networks inherently represent systems comprising interacting elements, enabling an examination of the influence of structure on the dynamics and function of a system. The dissemination of information depends heavily on the topology of the network, and the structure of the network serves as a cornerstone for studying this dynamic process. Information diffusion in online social networks occurs when there is substantial momentum in the growth of edge connections, driving both the network structure and function toward uniformity. Unlike the majority of studies that concentrate on the information diffusion phenomena within social networks, here we focus on the stochastic process of edge generation. We conceptualize the edge (E) generation process as a time-evolving graph characterized by a number of vertices .
We further conceptualize edge generation as a stochastic process in which new connections form according to a random walk mechanism. In this view, each new edge corresponds to a “jump” of a walker on the network, and the time between successive edge additions follows a waiting-time distribution. This analogy allows us to treat the evolution of signed edges as a diffusion process in both time and space, drawing on the rich theory of continuous-time random walks (CTRWs).
The edge generation process is crucial for comprehending the complex dynamics of network structures. This process endeavors to analyze the evolution of a social network’s topology across both temporal and spatial dimensions. Its applications are diverse and include link prediction, recommender systems, experimental design, and the study of complex systems. Significantly, this process facilitates the exploration of link recommendation clustering, trust relationships, and the polarization of public opinion in online environments. Such analyses are particularly pertinent when edges denote relationships such as trust versus distrust, like versus dislike, and approval versus disapproval. These relationships may be interpreted as mixed-link diffusion behaviors within networks.
This diffusion-based approach allows researchers to model how new connections form throughout a network over time. By analyzing the patterns of edge formation, we can better predict future network evolution and identify key factors influencing social connectivity. Furthermore, understanding edge growth as a diffusion process can inform strategies for enhancing information dissemination and community building within social networks.
In this study, we investigate the stochastic generation process of signed edges of real-world online signed social networks. The main goal of our theoretical analysis is to test the hypothesis that sentiment propagation in signed networks can be modeled as a continuous-time random walk (CTRW) and that the resulting diffusion regimes (subdiffusion, normal diffusion, superdiffusion) are determined by the underlying distributions of waiting times and jump lengths. Specifically, we hypothesize that: (i) the edge generation process follows a CTRW framework; (ii) the scaling exponent in the mean square displacement directly indicates the diffusion type; and (iii) the diffusion regime is linked to the finiteness or infiniteness of the moments of the waiting-time and jump-length distributions. We validate these hypotheses through both analytical derivations and empirical analysis of real-world signed networks.
Specifically, we assume that the generating process of the positive and negative edges of an empty network is a discrete time random walk. We model the edge growth dynamic process as a homogeneous Continuous Time Random Walk (CTRW) and draw from the concept of integrating the random walk approach with the continuum description through the diffusion equation. In order to model with a broad mathematical framework for both normal and anomalous diffusion, we shall turn to fractional tools.
The main contributions of this paper are as follows:
We propose a novel analytical framework that models the generation of signed edges in social networks as a continuous-time random walk process, unifying normal and anomalous diffusion within a single fractional diffusion equation.
We derive the time-fractional diffusion equation and show that the scaling exponent directly characterizes the diffusion type—subdiffusion (), normal diffusion (), and superdiffusion (), each corresponding to distinct sentiment propagation regimes.
We provide rigorous theoretical justification linking the emergence of these diffusion modes to the underlying distributions of waiting times and jump lengths, as formalized in Theorem 1.
We validate our model using two large-scale real-world signed social networks (Reddit and Bitcoin OTC), demonstrating that sentiment dynamics exhibit all three diffusion patterns across different evolutionary stages.
We interpret the practical implications of these diffusion modes for information cocoons, opinion polarization, and community dynamics in digital environments.
Following the establishment of the fundamental framework of random walks and the recovery of the standard diffusion, we explore an alternative generalization of the diffusion equation using fractional calculus. This approach allows for the replacement of the first-time derivative, resulting in what is known as the time-fractional diffusion equation. We aim to illustrate how this equation explains subdiffusive and superdiffusion phenomena which are observed for the edge growth of social networks.
The remaining points are organized as follows.
Section 2 provides the incremental dynamic model of signed edges behind the simple random walk.
Section 3 presents the continuity implementation of a one-dimensional random walk, and illustrates that the growth process of signed edges can be analogical to a standard thermal diffusion equation. In
Section 4, we extend the standard thermal diffusion equation to the time-fractional order framework in order to elucidate the complex phenomena of subdiffusion, superdiffusion, and normal diffusion. These behaviors are pertinent to the growth and fluctuations observed in online signed social networks, which are characterized by sentimental spreading. In
Section 5, we validate that the theoretical stochastic analysis is consistent with the observations of the real-world temporal signed network. Finally,
Section 6 concludes the paper.
2. Random Walks as Models of Dynamic Growth of Sentiment
While relationships in the real world can be diverse and complex, they often share an essential foundation of sentiment that fosters connection and understanding. In signed social networks, the edges represent relationships that can exhibit either positive or negative sentimental polarity, facilitating a more nuanced understanding of complex entity relationships across various applications. Positive edges, indicated by a “+” sign, represent constructive relationships such as friendship, trust, support, and approval. In contrast, negative edges, marked by a “−” sign, denote adversarial relationships, including enmity, distrust, disapproval, and opposition. This distinction is essential for analyzing the dynamics of sentimental polarity within these networks.
For instance, in the Reddit network, a positive edge from subreddit A to subreddit B indicates that a post in A expresses a supportive or approving sentiment toward a post in B. Conversely, a negative edge signals disagreement, criticism, or opposition. In the Bitcoin OTC trust network, a positive edge from user X to user Y means X trusts Y, while a negative edge indicates distrust.
Therefore, by modeling and examining the growth and fluctuation of edges in signed networks, it becomes possible to investigate the evolutionary mechanisms that influence emotions, sentiments, and opinions in social interactions.
Now, we develop a microscopic evolution model for generating signed edges. Similar to Ref. [
19], we assume that the generating process of the positive and negative edges of a network is a discrete time random walk on an infinite one-dimensional uniform lattice. A preliminary study [
19] modeled the generation of signed edges using a simple random walk on an infinite one-dimensional lattice, but it was restricted to normal diffusion (Brownian motion). In contrast, the present work generalizes this framework by incorporating fractional calculus, which allows us to capture subdiffusion and superdiffusion as well. Moreover, we provide extensive empirical validation on two real-world signed networks, demonstrating the existence of all three diffusion regimes across different temporal stages. This generalization significantly extends the analytical scope and practical applicability beyond the earlier work.
The assumption of an infinite one-dimensional lattice is a simplification that captures the essential stochastic nature of edge generation without loss of generality. In signed social networks, the accumulation of positive versus negative edges can be mapped to the net displacement of a walker on a line: rightward steps correspond to positive edge increments, and leftward steps to negative increments. The infinite lattice reflects the fact that, in large-scale online networks, the number of potential edges is unbounded over long time scales. This idealized setting allows us to derive analytical solutions while preserving the key features of sentiment dynamics, such as the competition between opposing polarities and the emergence of anomalous diffusion. Similar one-dimensional random walk models have been successfully used to model opinion dynamics and information propagation in social systems.
Let us consider a scenario in which a walker commences at the origin () and proceeds to jump a brief distance, denoted as either moving to the left or the right, within a short waiting time. The movement is presumed to be entirely stochastic with equal probabilities of moving in both the left and right directions, each at . After the next time step, the walker will either be at a distance of to the left or right of the origin (with a probability of each), or will have returned to the origin (with a probability of ).
We define the following parameters:
: the elementary step length (in units of edge count), representing the minimum change in the signed edge count per jump.
: the elementary waiting time (in minutes), representing the fixed time interval between successive jumps in the discrete-time random walk.
n: the number of time steps elapsed.
m: the net displacement (in units of ) from the origin after n steps. Positive m indicates an excess of positive edges; negative m indicates an excess of negative edges.
After n time steps (each of duration ), the walker’s position is .
Continuing in this way, the probability that a walker will be at distance
to the right (random walking to the right is analogous to positive edge growth) of the origin after
time steps (where
m and
n are even) has the following relation,
According to symmetry, the probability that a walker will be at distance
to the left (random walking to the left is analogous to negative edge growth) of the origin after
time steps is given by
When
, Stirling’s formula provides an approximate Gaussian distribution
for both Equations (3) and (4). Note that this is a relatively common feature of the one-dimensional lattice Brownian walk that leads to the mean square displacement
in the case of two random variables, waiting time and jump length: (1) the first-order moment of waiting time is finite, and (2) jump length variance is finite [
6]. This scenario implies that the resulting distribution of the walker’s positions, determined by the accumulated sum of steps, converges to an approximate Gaussian distribution, which can be verified through the CLT.
The discrete random walk described above operates at microscopic time scales () and spatial scales (). However, real signed edge dynamics occur over continuous time and involve many small increments. To connect the microscopic model to macroscopic observables (such as the probability density of signed edge counts), we take the continuum limit , , while keeping the diffusion coefficient finite. In this limit, the discrete master equation converges to the standard diffusion equation (Equation (6)), and the discrete probability distribution approaches a continuous Gaussian density. This transition is standard in the theory of stochastic processes and allows us to leverage the powerful tools of partial differential equations to analyze sentiment propagation.
The continuum limit introduces an approximation error of order
and
, which becomes negligible when the time scales of interest are much larger than the microscopic waiting time and the spatial resolution is much smaller than the characteristic length scale of the network. For real-world signed networks with a large number of edges over long time spans (as in our datasets), this approximation is well justified. Standard references [
6,
13] provide further details on the validity of this continuum limit.
To empirically justify the continuum approximation for our specific datasets (
Table 1), we now estimate the microscopic parameters
and
and quantify the associated errors. The step size
corresponds to the minimal change in net signed edge count per jump. Since each edge addition alters
by exactly
, we have
(in units of edges) deterministically. For the Reddit dataset (
Table 1), the total time span is 3.25 years (≈
min) with 858,490 edges, yielding a mean inter-event time
min. For the OTC dataset (
Table 1), the time span is 5.17 years (≈
min) with 35,592 edges, giving
min. Our analysis focuses on time scales
t ranging from
to
mins. For
mins, we have
and
, satisfying
for the Reddit dataset and marginally for OTC. At the smallest scale
min,
is appreciable, which explains the larger fluctuations in the estimated
during the early stage, our main conclusions are drawn from
mins, where the approximation is well-controlled.
The diffusion coefficient remains finite in the continuum limit. Using the above estimates, edge2/min and edge2/min, both positive and bounded as required. To quantify the truncation error from the continuum approximation, we note that the neglected higher-order terms in the Taylor expansion are of order relative to the leading diffusion term, where is the standard deviation of the displacement. For min, we have edges, yielding for Reddit. For OTC at the same min, edges, yielding . The temporal truncation error scales as , giving and at min, which is of the same order as the spatial error for OTC. For larger t, both errors decrease further. These estimates demonstrate that the discrete-to-continuum approximation introduces acceptably small errors (less than for Reddit and less than for OTC at min), validating the use of the diffusion equation for our empirical analysis.
Having validated the continuum approximation for our empirical data, we now proceed to extend the discrete random walk model to the continuous case and establish the standard diffusion equation.
3. The Standard Diffusion Equation
In the following, we interpret the spatial variable x as the net signed edge count: , where and are the numbers of positive and negative edges accumulated up to time t, respectively. Thus, x measures the overall sentiment bias of the network.
Here, we extend the walking distance
and time steps into the continuous case. This means that the probability that a walker will be at a continuous distance to the right or left of the origin after continuous
time steps can be modeled by the master equation as follows,
Considering the process’s localization in both space
x and time
t, Equation (
5) represents the continuous extension of the basic one-dimensional discrete model, i.e., a CTRW. It defines the probability density function (pdf) at position
x (the number of signed edges) and time
t based on the population of the two adjacent sites. The prefactor
accounts for the isotropy of the jumps in both directions.
In the continuum limit
and
, such that
= constant
D, Taylor expansions in
x and
t lead to the diffusion Equation (
6). This derivation leads to the expression of the PDE associated with CTRW.
where constant
D is called the diffusion coefficient. In the context of signed social networks,
D quantifies the rate at which sentiment propagates through the network. A larger
D indicates faster diffusion of positive or negative edges, reflecting higher user activity or stronger social influence; a smaller
D corresponds to slower sentiment spread, which may occur in sparse or less interactive communities.
Compared to purely data-driven approaches such as graph neural networks [
15,
16] or temporal link prediction models [
20,
21], the diffusion Equation (
6) offers several advantages for modeling edge growth in signed social networks. First, it provides an analytically tractable framework that yields closed-form solutions (e.g., the Gaussian Green function), enabling explicit interpretation of the underlying stochastic process. Second, it naturally generalizes to fractional diffusion (
Section 4), allowing a unified description of normal and anomalous diffusion through a single parameter
. Third, the diffusion equation directly connects to the fundamental theory of random walks, giving a rigorous probabilistic foundation. While blackbox machine learning models may achieve high predictive accuracy, they often lack interpretability and cannot easily capture the transition between different diffusion regimes. Thus, our approach complements those methods by providing a mechanistic understanding of sentiment propagation.
Diffusion Equation (
6) is one of the most fundamental equations in physics, being a direct consequence of the central limit theorem. Furthermore, for long times, i.e., a large enough number of steps, the fundamental solution (referred as the Green function) of Equation (
6) with sharp initial condition
is given by the standard Gaussian-shaped Green function, i.e.,
where
is the Dirac delta function.
The function in Equation (7) is a probability density function (PDF) describing the likelihood of observing a net signed edge count x (i.e., the difference between the number of positive and negative edges) at time t. It satisfies the normalization condition for all , consistent with its interpretation as a probability density. In the context of signed social networks, captures the distribution of sentiment polarity across the network: positive x indicates an excess of positive edges (overall positive sentiment), while negative x indicates an excess of negative edges. In fact, Equation (7) satisfies the integral form of the diffusion equation, i.e., the Volterra integral equation , with initial-boundary value . The fundamental solution of the integral equation, recognized as the Green function, explicitly corresponds to the initial condition represented by the evolving Gaussian probability density over time.
Meanwhile, this Gaussian shape solution governed by diffusion Equation (
6) is a hallmark of normal diffusion, characterized by an MSD (variance) that grows linearly with time
The diffusion equation’s applicability extends beyond physics, finding use in various fields such as biology, chemistry, and economics to model processes involving random motion or spread. Its versatility and fundamental nature make it a cornerstone in understanding and predicting the behavior of many complex systems.
In this paper, we use diffusion Equation (
6) together with the probability density function given in Equation (7) to model the incremental process of signed edges in a network.
defines the pdf with
x signed edges at evolutionary time
t.
Gaussian solution (7) represents the theoretical benchmark for normal diffusion, which arises when the waiting-time distribution has a finite mean and the jump length distribution has finite variance. The empirical deviation from a perfect Gaussian shape is not a contradiction but a reflection of the complex, non-equilibrium nature of real social networks. Such deviations are precisely what motivate the generalization to fractional diffusion presented in
Section 4, where waiting times and jump lengths may have infinite moments, leading to sub or superdiffusion.
Our prior research on the signed network Reddit demonstrates that the incremental processes of signed edges can be elucidated by Brownian motion. However, it is important to note that the probability density function
approaches a standard Gaussian density rather than conforming to a strict Gaussian distribution. This observation indicates that the incremental processes of signed edges in the empirical signed network of Reddit diverge from the principles of normal diffusion, as referenced in [
19].
Nevertheless, for certain time windows and under specific aggregation scales, the edge increment distributions exhibit approximate Gaussian behavior, supporting the Brownian motion analogy as a first-order approximation. Similar observations of near-normal diffusion in social media information spreading have been reported in other empirical studies [
12,
13].
Consequently, this finding encourages further investigation into additional signed network datasets to ascertain whether they exhibit normal diffusion, anomalous diffusion, or alternative diffusion patterns.
In fact, diffusion processes in various complex systems usually violate Gaussian statistics as the abnormality is normal. Numerous reports have documented the identification of anomalous regimes. Anomalous behaviors, i.e., subdiffusion and superdiffusion, have been the subject of study in diverse systems, including human and animal displacements [
22,
23] and biological [
24,
25] and physical systems [
26,
27].
Anomalous diffusion is characterized by particle movement that deviates from the linear time dependence observed in normal diffusion. This phenomenon is distinguished by a non-linear power-law relationship between mean square displacement and time. Subdiffusion is associated with a slower rate of particle spread, whereas superdiffusion exhibits an accelerated rate of dispersion.
Anomalous diffusion is prevalent in complex systems, including biological cells, porous media, and financial markets. The underlying mechanisms responsible for this behavior may include trapping events, long-range correlations, or heterogeneous environments. A comprehensive understanding of anomalous diffusion is crucial for accurately describing transport processes in diverse natural and engineered systems.
Several approaches have been used for investigating these phenomena with usual or anomalous diffusion. They are essentially the Langevin equations [
28,
29], master equations [
30], random walks [
31,
32], generalized thermostatistics [
33] or fractional Brownian motion [
34]. While these classical approaches have been successful in describing anomalous diffusion in physical and biological systems, they often assume idealized conditions (e.g., independent and identically distributed waiting times and jump lengths) and do not account for the signed nature of interactions or the temporal ordering of edge formation. In the context of signed social networks, these assumptions are too restrictive, as user behavior is inherently heterogeneous, time-dependent, and influenced by the polarity of relationships [
15,
16]. Moreover, most existing models treat edges as undirected or ignore the temporal dynamics that are crucial for understanding sentiment propagation [
19,
20]. Our model addresses these shortcomings by explicitly incorporating the sign of edges (positive/negative), allowing waiting time and jump length distributions to have infinite moments, and employing a fractional diffusion framework that naturally captures memory effects and non-Markovian dynamics.
4. M-Wright Function and Time-Fractional Diffusion Equation
Mainardi in [
35,
36] defines a transcendental function of the Wright type (for more details on Wright functions the reader can refer to [
37]), also named M-Wright function, as follows:
Intuitively, the M-Wright function acts as a generalization of the Gaussian distribution for anomalous diffusion processes. When , it reduces to the standard Gaussian, which describes normal diffusion. For other values of , it captures the stretched exponential decay or heavy tails observed in subdiffusive and superdiffusive regimes, making it a natural candidate for the fundamental solution of time-fractional diffusion equations.
A useful way to express
t function is in terms of the probability density function
where
x and
t are the space-time variables, which defines a spatial probability density in
x evolving in time
t with self-similarity exponent
. Recently, Mura et al. [
38] showed that
M-Wright function, as a particular case of the Wright function family, plays a fundamental role in explaining a general class of stochastic models for anomalous diffusion [
39].
For a diffusion process, at the macroscopic level, i.e., in terms of the particle pdf, the
M-function plays the same role as Green function in normal diffusion, acting as a probability density in a relevant class of time-fractional space-time diffusion processes. The intrinsic connection between Green function and
M-function is expressed as follows
where constant
D is the diffusion coefficient,
t is the time variable. Moreover, in anomalous diffusion the fundamental solution of the time-fractional equation turns out to be related to the
M-Wright function, which is a natural generalization of the Gaussian density, and appears as the most general extension of the corresponding result for
in Equation (
10).
The appearance of fractional equations is particularly noteworthy due to their resemblance to conventional equations. A transformation exists that effectively maps the Gaussian-shaped solution to its corresponding fractional solution. This intriguing relationship proves to be beneficial for both analytical and numerical analyses.
The time-fractional diffusion equation is obtained by replacing the first-order time derivative in Equation (6) with a fractional derivative of order
in the Caputo sense [
40]. For
, the Caputo fractional derivative is defined as
which requires one initial condition
. For
, the definition is
requiring two initial conditions:
and
. This leads to the time-fractional diffusion equation
where
is a generalized diffusion coefficient. The integral form corresponding to (12) for
reads
For
, the integral form includes an additional term involving the initial time derivative
, following standard results in fractional calculus [
14,
40]. This integral representation explicitly shows the convolution with a power-law kernel
, which encodes the memory of past states. This generalization accounts for memory effects and long-range correlations in the waiting-time distribution, which are characteristic of anomalous diffusion. The resulting Equation (
12) is not derived by a simple substitution
; rather, it arises from a continuous-time random walk with a waiting-time distribution having a heavy tail
. The fractional derivative captures the non-Markovian nature of the process.
The corresponding fundamental solution is the stretched-time Gaussian
with MSD (variance)
Equations (14) and (15) are the central results of this section. Equation (
15) verifies a general anomalous diffusion process, specifically of subdiffusion for
and of superdiffusion for
. When
, Equation (
14) reduces to the Green function in normal diffusion formulated in Equation (
11); further, Equation (
15) degenerates into Equation (
8).
Thus, the exponent directly indicates the diffusion type: for normal diffusion, for subdiffusion (slower than normal), and for superdiffusion (faster than normal). In signed social networks, can vary over time, reflecting different stages of community interaction and sentiment propagation.
The formula encourages a comprehensive understanding of sentiment diffusion behavior, which can be elucidated through the careful analysis of variations in the power exponent. This approach yields valuable insights into the dynamics of sentiment propagation and fluctuation within online signed social networks. This understanding can contribute to a deeper comprehension of how emotions and opinions circulate in digital communities. According to [
6], both normal and anomalous diffusion can be encapsulated by the following theorem.
Theorem 1 (Theorem on three types of diffusion). CTRW is characterized by the distributions and , where the walker can wait for a time τ from an independent distribution between jumps, and the distance covered in each jump follows an independent distribution . Different types of CTRW can be categorized by the characteristic waiting time and the jump length variance .
(i) For distributions of step times with finite mean μ, a jumping-length distribution with diverging variance results in superdiffusion. In contrast, (ii) when is finite and μ is infinite, this scenario leads to subdiffusion. (iii) Both and μ are finite, leading to normal diffusion.
Intuitively, this theorem states that the type of diffusion is determined by whether the jumps (step lengths) and waiting times have finite or infinite statistical moments. If the average waiting time is finite but the jump lengths have infinite variance (i.e., very long jumps occur frequently), the spread is superdiffusive. Conversely, if jump lengths have finite variance but the average waiting time is infinite (i.e., very long pauses occur), the spread is subdiffusive. Only when both are finite do we recover normal diffusion.
To make this intuition more concrete, consider a CTRW after
n steps. The displacement variance scales as
, while by the law of large numbers the total elapsed time scales as
(when
is finite). Eliminating
n yields
, which is normal diffusion. If
diverges (i.e., the jump-length distribution has a heavy tail
with
), the central limit theorem no longer applies, and the MSD scales superdiffusively as
with
. If instead
diverges (i.e., the waiting-time distribution has a heavy tail
with
), the walker experiences long trapping events, and the MSD scales subdiffusively as
with
. The time-fractional diffusion Equation (
12) emerges precisely from the continuum limit of a CTRW with such heavy-tailed waiting times and finite-variance jump lengths, where the fractional derivative order
directly equals the MSD scaling exponent.
Proof. The key idea of the proof is as follows. For a CTRW with waiting-time distribution and jump-length distribution , consider the scaling of the mean squared displacement (MSD). After n steps, the displacement variance scales as , where is the jump-length variance (when finite). The total elapsed time scales as , where is the mean waiting time (when finite). Eliminating n yields , i.e., normal diffusion with .
If
diverges due to a heavy-tailed jump distribution
with
, the central limit theorem no longer applies. In this case, a single large jump can dominate the displacement, leading to superdiffusion with MSD
. If instead
diverges due to a heavy-tailed waiting-time distribution
with
, the walker experiences long trapping events, leading to subdiffusion with MSD
. The time-fractional diffusion Equation (
12) provides the continuum description for the latter case, with the fractional derivative order
directly controlling the MSD scaling exponent. For the rigorous mathematical derivation via the Montroll–Weiss equation, we refer the reader to the comprehensive treatment in [
6]. □
5. Empirical Validation
As a proof of concept, here we demonstrate the consistency of our model by analyzing the sentimental or signed edge incremental dynamic process for two temporal signed social networks, RedditHyperlinks and Bitcoin OTC. Please consult
Appendix A for a comprehensive examination of the correspondence between empirical data analysis and theoretical proof.
The RedditHyperlinks network captures hyperlink connections between subreddits from January 2014 to April 2017. Each directed edge has a timestamp, a binary sentiment (positive or negative), and a text property vector. The Bitcoin OTC trust network spans November 2010 to January 2016, where users rate each other on a scale from
(distrust) to
(trust) in increments of 1. Both datasets are publicly available from the Stanford Network Analysis Project (SNAP); the URLs are provided in
Table 1.
In our analysis, we binarize the Bitcoin OTC edge weights: positive ratings (>0) are mapped to , negative ratings (<0) to , and neutral ratings (0) excluded. For Reddit, the original data already provide binary sentiment labels. Thus, we use only the sign information in all diffusion calculations.
Prior to the main analysis, we performed standard data preprocessing steps: removal of self-loops, filtering of edges with missing timestamps, and normalization of edge weights to binary signs as described above. To handle possible outliers, we applied a threshold based on the 99.5th percentile of waiting times and jump lengths, as extreme values beyond this range were found to be sparsely distributed and did not affect the fitted power-law exponents. The waiting time and jump step distributions were fitted using maximum likelihood estimation (MLE) with power-law tail detection following the methodology in Clauset et al. [
41].
The statistics pertaining to the three datasets are articulated in the table below. This section focuses on the analysis of sentiment diffusion in the signed social network presented in
Table 1. We carry out calculations of the mean squared displacement (MSD) through the pseudocode outlined in Algorithm 1 (pseudocode for msd calculation).
| Algorithm 1 MSD of sentiment in signed social network |
| Require: sentiment position sequence |
| Ensure: MSD of interval |
- 1:
for to do - 2:
for to do - 3:
if then - 4:
- 5:
end if - 6:
end for - 7:
- 8:
end for
|
In the pseudocode, M denotes the set of starting time indices t for which the sentiment position is defined (i.e., no missing data). is the number of such valid pairs, and the average is taken over them.
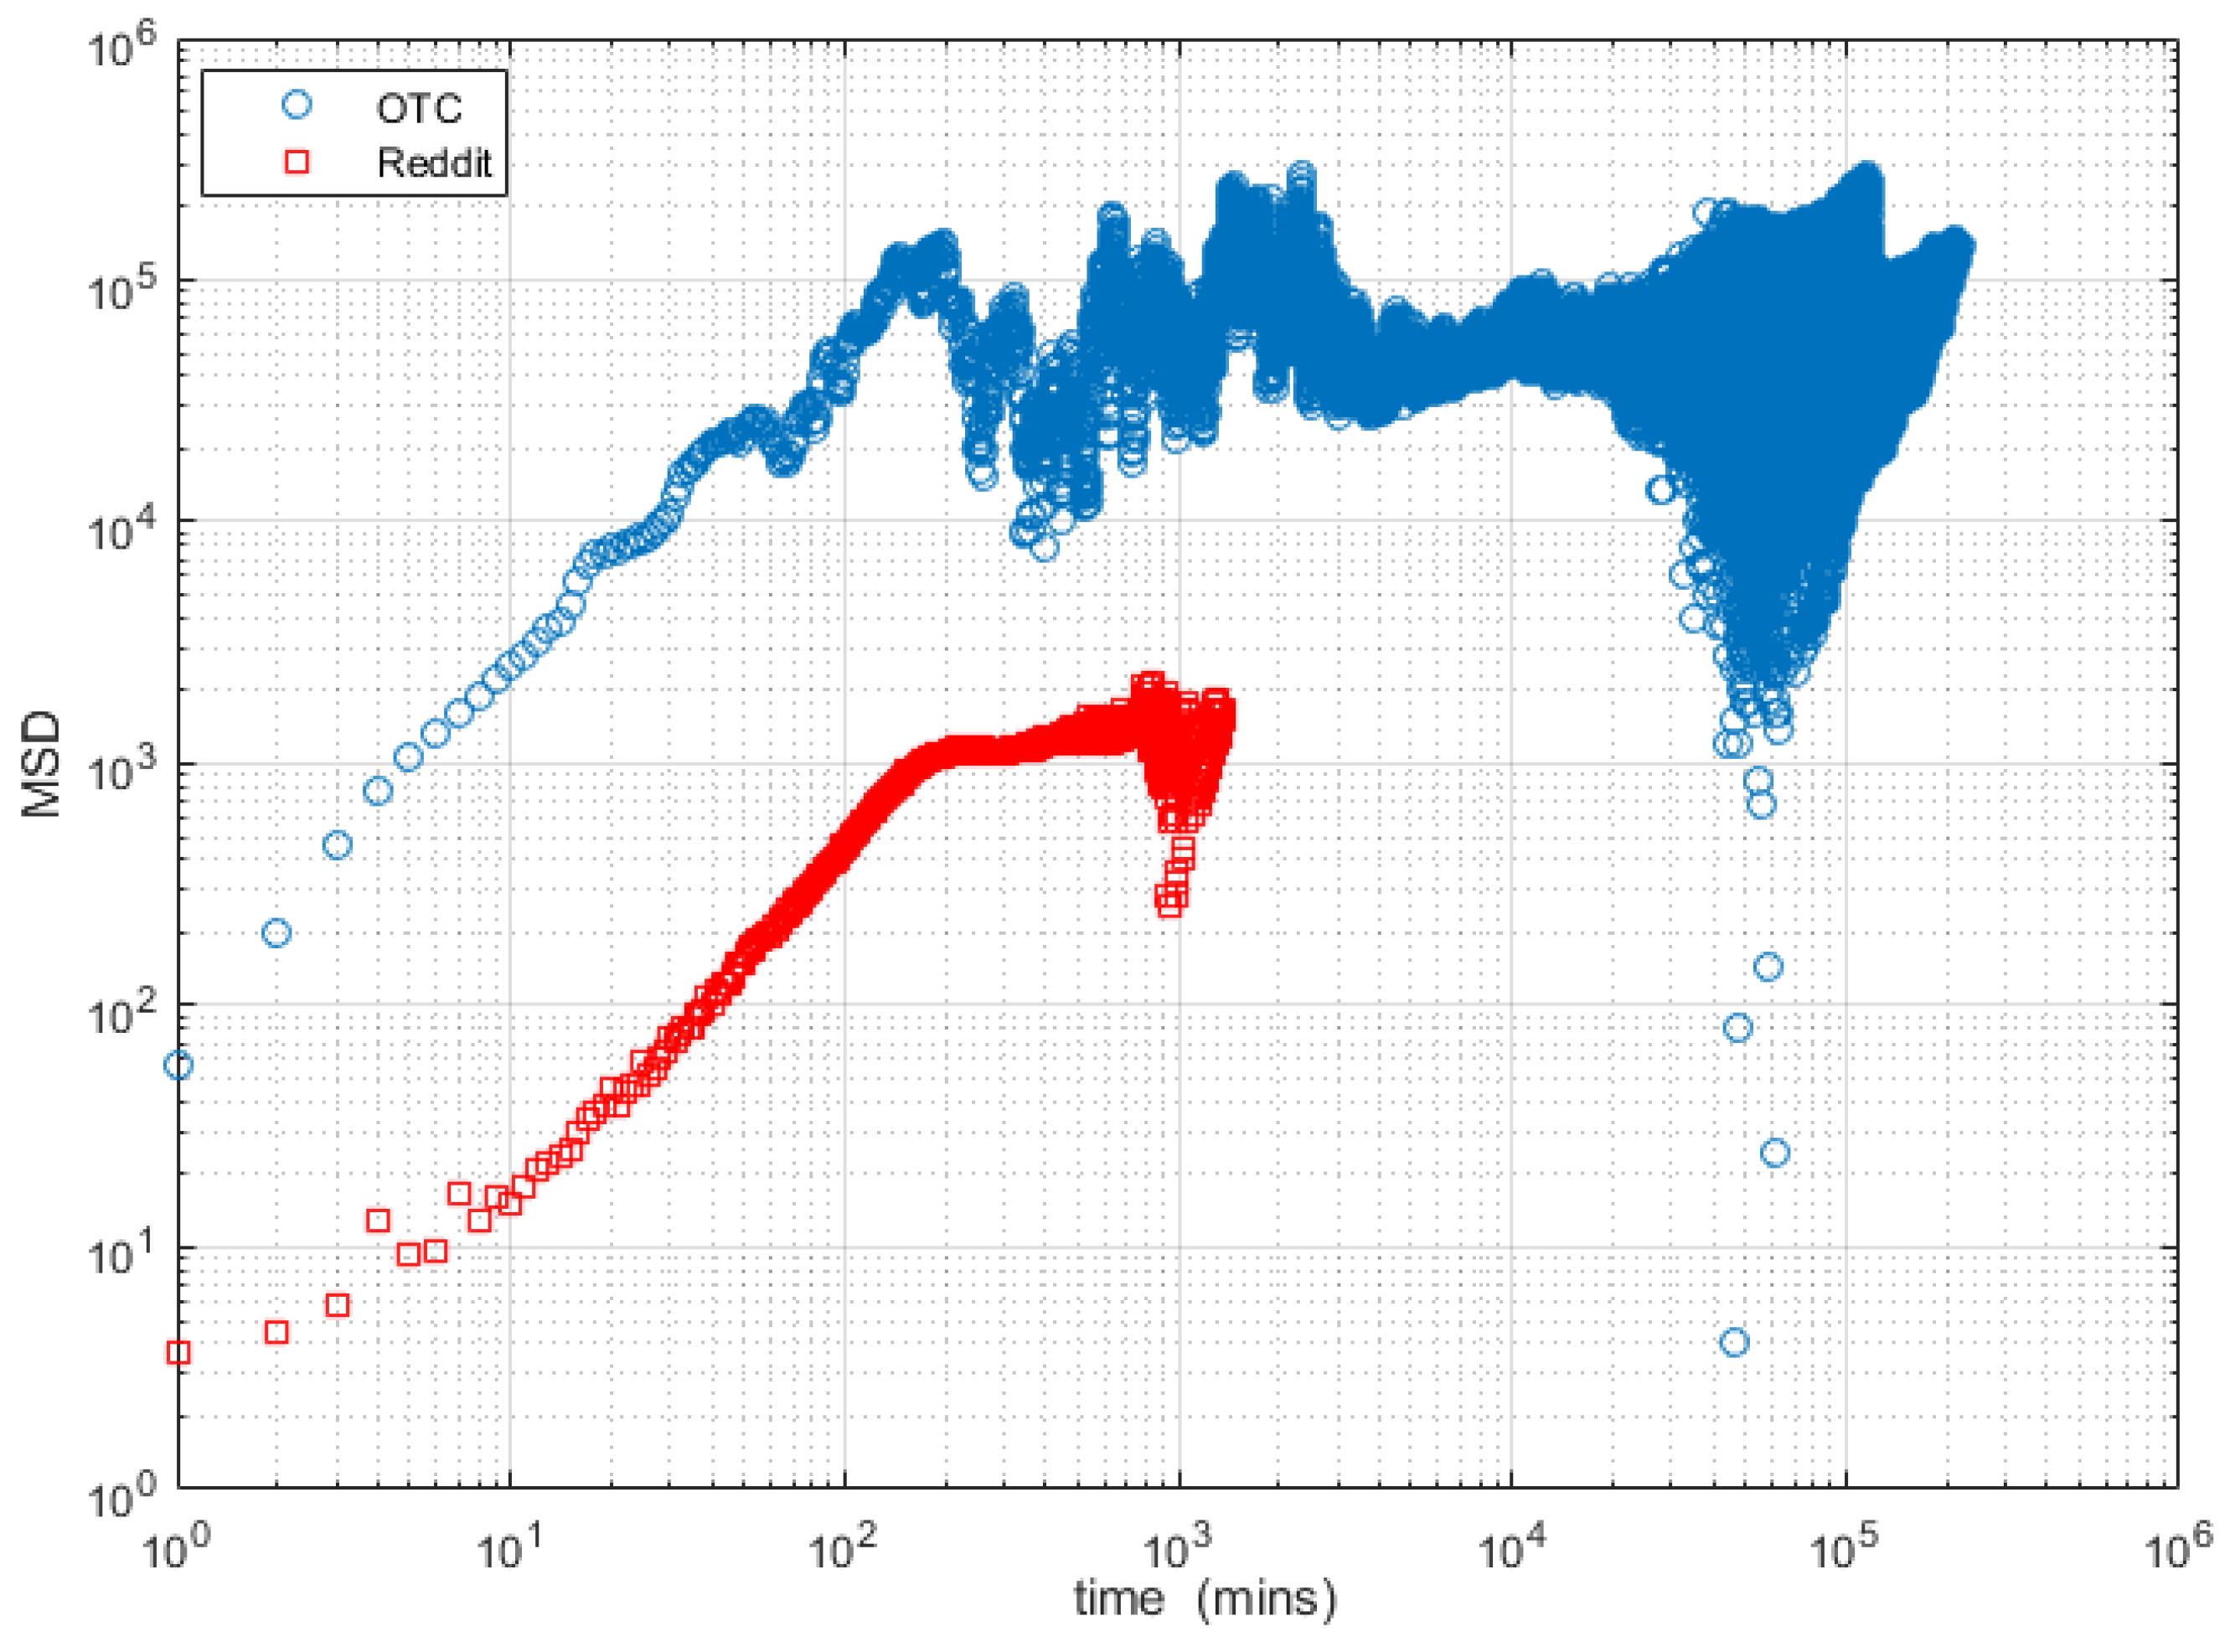
Figure 1 illustrates the log–log plot of mean squared displacement (MSD) as a function of time (in minutes) for sentiment diffusion in RedditHyperlinks (red squares) and Bitcoin OTC (blue circles). The MSD curves for both networks exhibit a gradual transition from superdiffusion in the initial phase toward normal diffusion at later times, with pronounced oscillations between regimes. To quantitatively assess the similarity between the two networks’ diffusion behaviors, we computed the time–varying diffusion exponent
for each network using a sliding window on logarithmically resampled MSD data (points per decade = 30, window size = 7). The two
sequences were interpolated onto a common logarithmic time grid. The Pearson correlation coefficient between the sequences is
(
), indicating a moderate positive linear relationship. A two-sample Kolmogorov–Smirnov test yielded
(
), confirming that the distributions of
values are significantly different. The root–mean–square error (RMSE) between the two curves is
. The mean diffusion exponents are
and
, both exceeding 1 and thus confirming superdiffusive behavior overall. These quantitative measures demonstrate that while both networks exhibit superdiffusion and a general trend of decreasing
over time, their detailed evolution patterns differ, likely due to the distinct platform characteristics: RedditHyperlinks captures content-driven cross-community hyperlinks, whereas Bitcoin OTC records user-to-user trust ratings.
To deepen our quantitative understanding of the diffusion process, we calculated the time exponent using the least squares method, as outlined in Equation (
15). This exponent is crucial, as it characterizes the type of diffusion observed in the system.
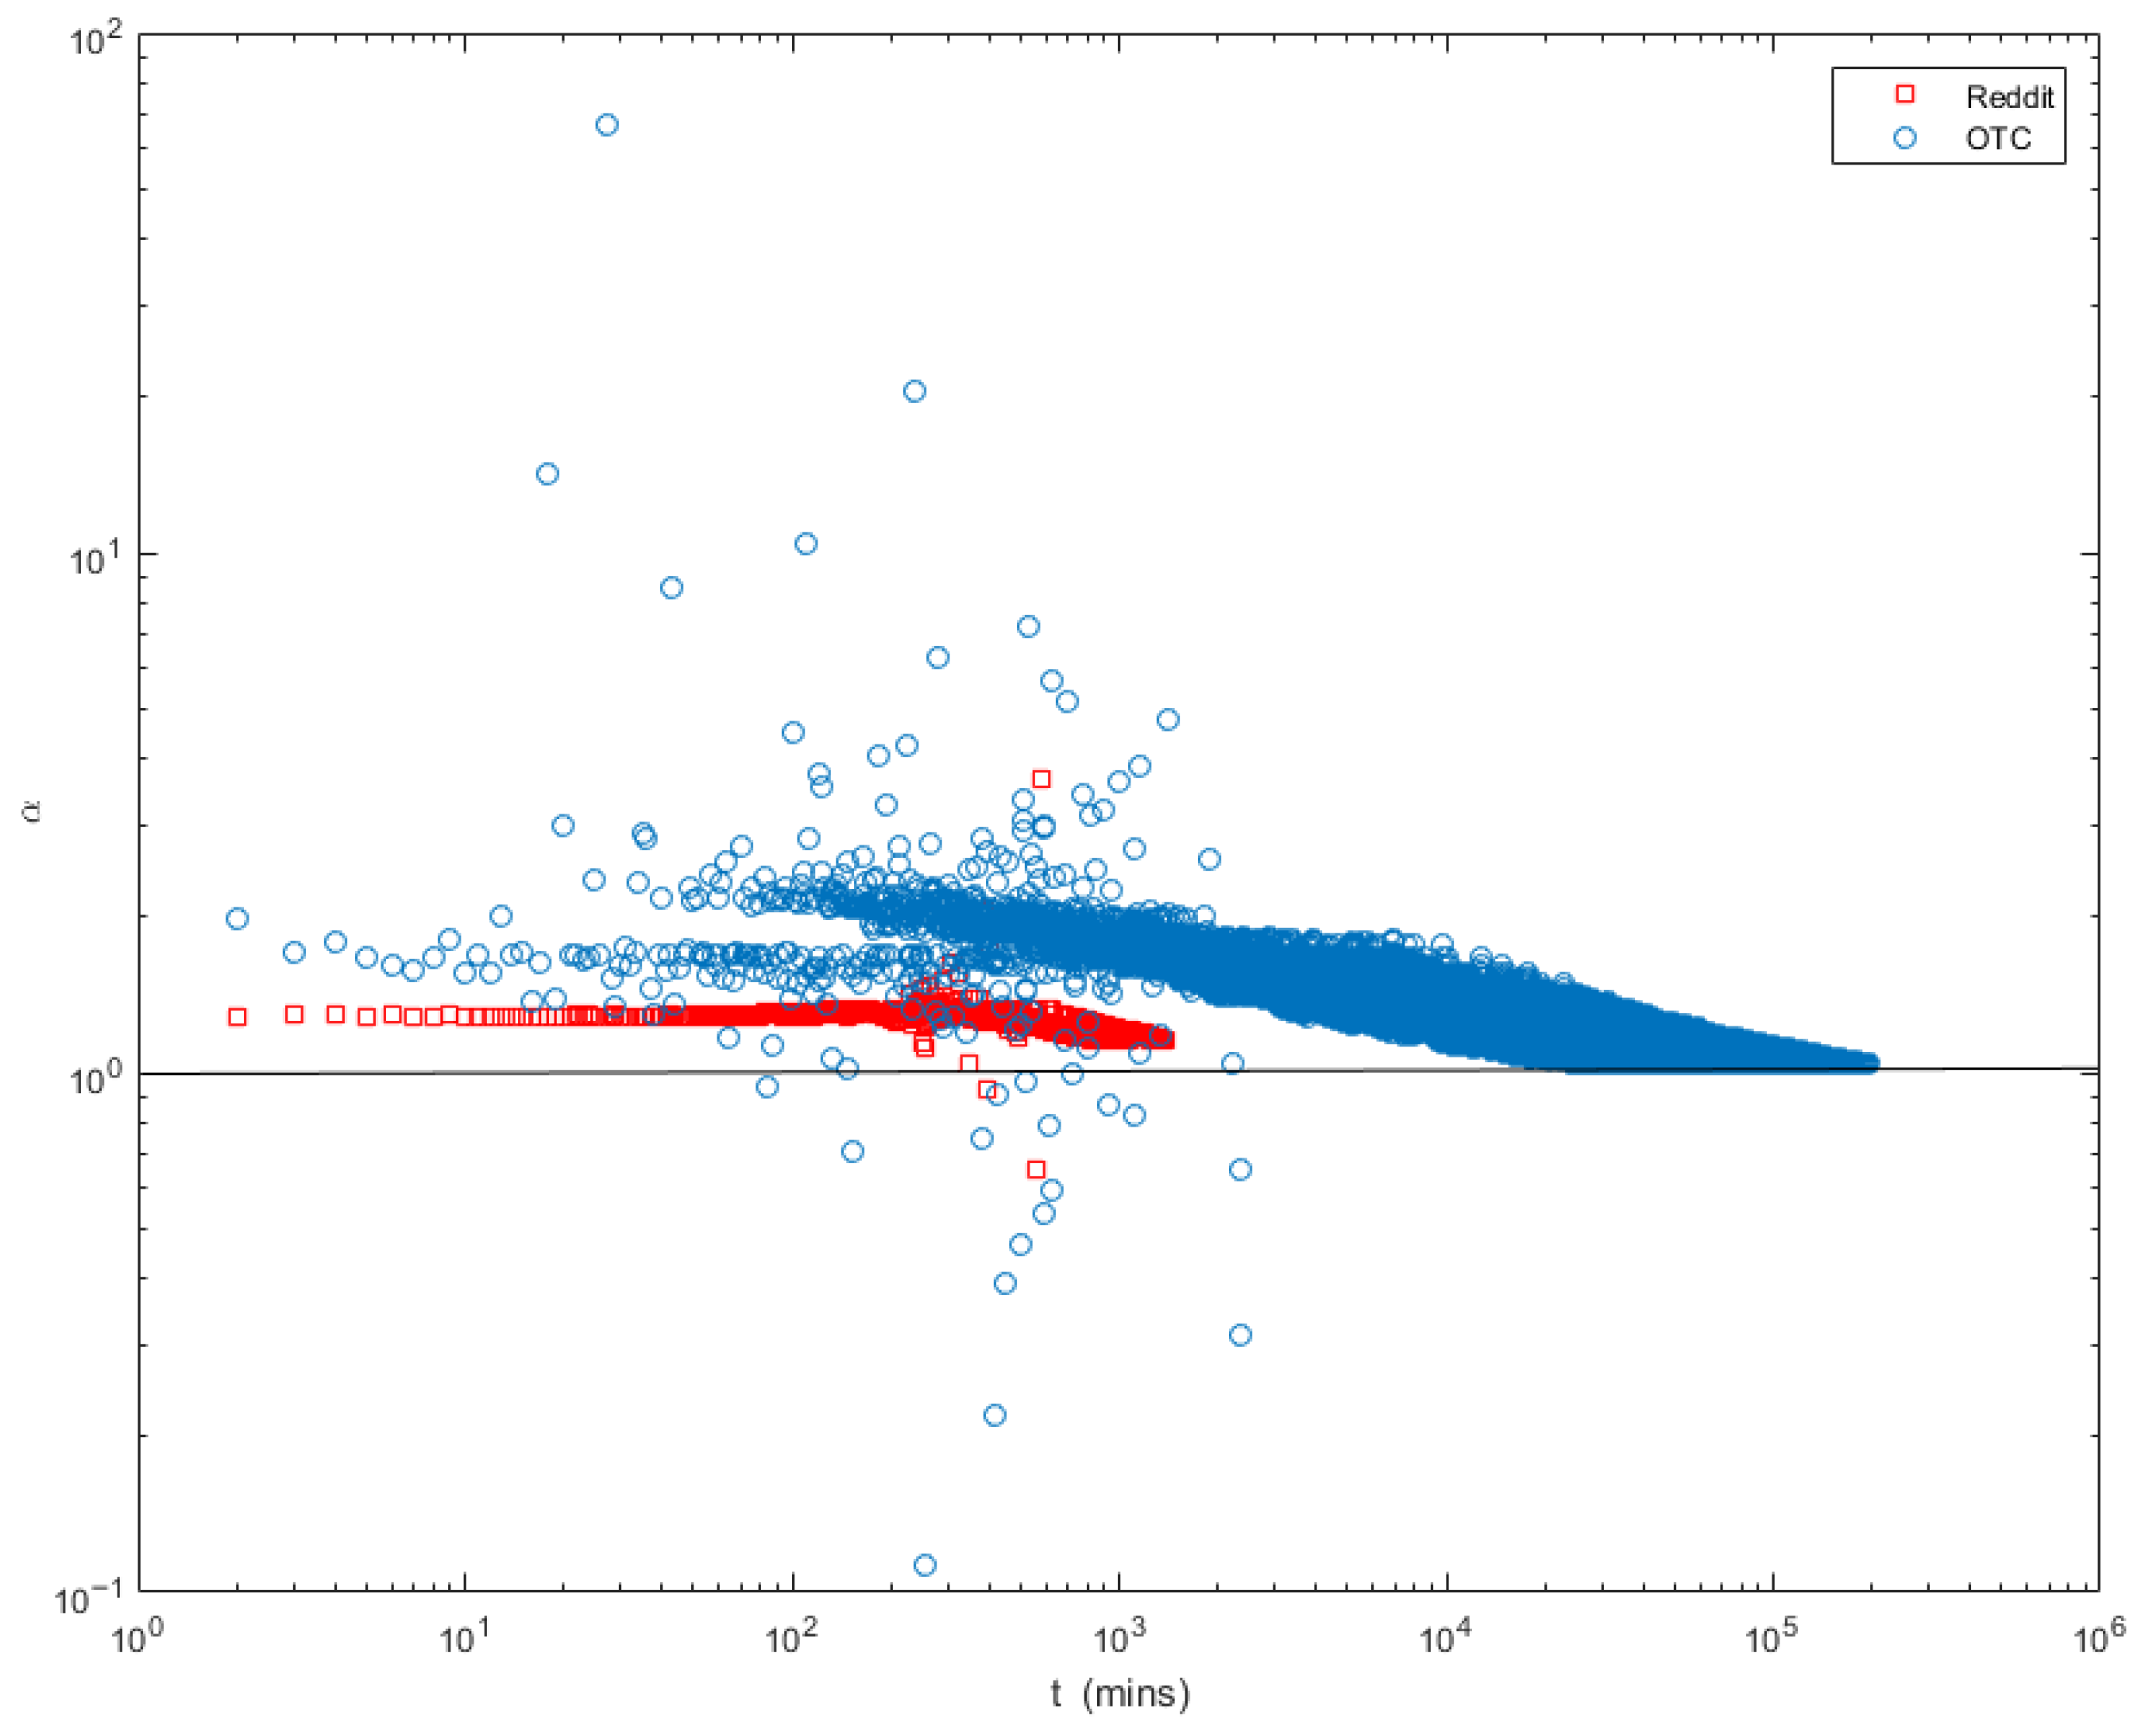
Figure 2 presents a detailed plot that illustrates the relationship between sentimental diffusion time and the calculated exponent. This graphical representation allows us to visualize how changes in the sentimental diffusion time correspond to variations in the time exponent. The analysis reveals a noteworthy trend in the time exponent, indicating significant shifts in user engagement patterns and interaction dynamics on the platform.
In response to the change in MSD illustrated in
Figure 1,
Figure 2 demonstrates that both signed networks—despite their distinct characteristics—exhibit a similar trend as they transition from superdiffusion to normal diffusion.
The exponent directly indicates the diffusion regime: indicates normal diffusion (linear MSD growth), superdiffusion (accelerated spread), and subdiffusion (slower spread). These regimes reflect different underlying user behaviors and network structures.
In the context of the Reddit network, the growth process of its signed edges exhibits characteristics of a stable superdiffusion process that is converging towards normal diffusion. In detail, around , Reddit demonstrates a dynamic behavior characterized by oscillations among three distinct modes of diffusion. These modes reflect varying patterns of information spread and engagement within the platform. As time progresses and approaches , the diffusion process stabilizes, leading Reddit to transition toward a state that closely resembles normal diffusion. This shift indicates a more uniform and predictable distribution of content across the platform, suggesting a maturation in user interactions and sentiment dissemination.
To provide a theoretical explanation for the occurrence of three distinct types of diffusion at varying stages in the evolution of signed networks, it is essential to conduct an empirical analysis of the distributions related to waiting times and jump-length within the signed edge production process, as outlined in Theorem 1.
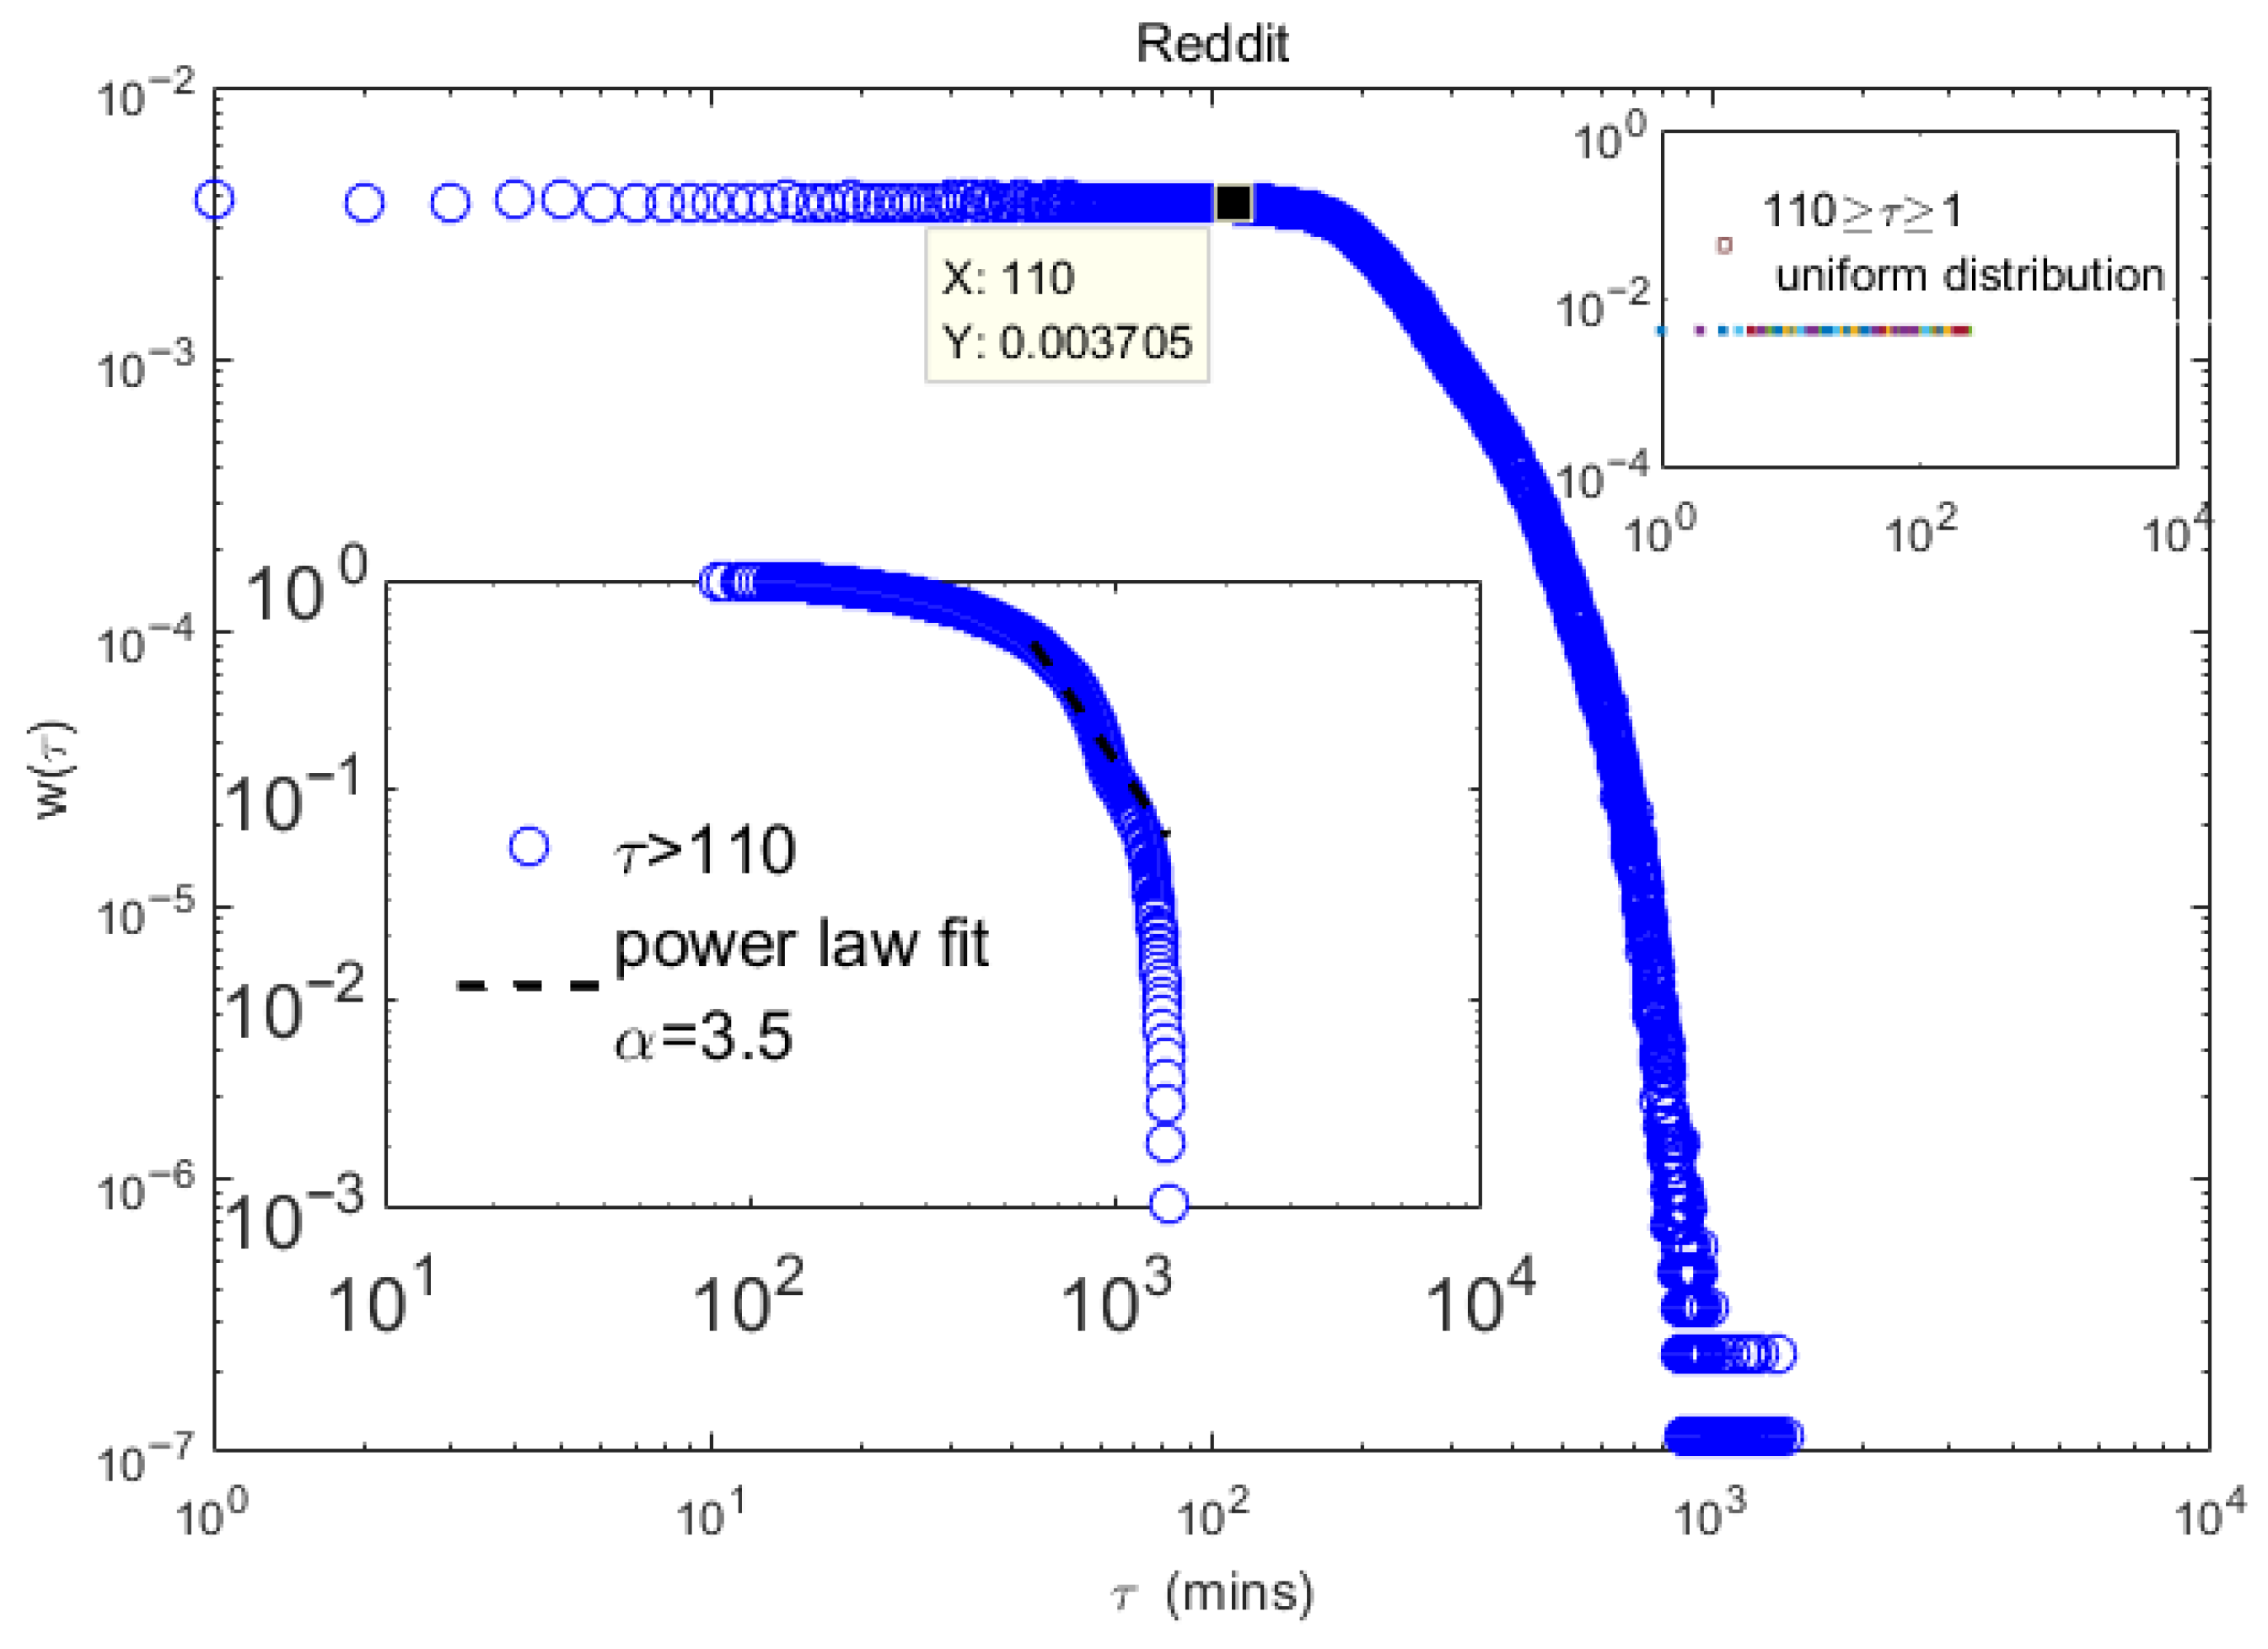
Figure 3 demonstrates that when the waiting time is between 1 and 110 (mins), its density conforms to a uniform distribution denoted as
. In contrast, when the waiting time exceeds 110 min, the density follows a power-law distribution characterized by a power exponent of
.
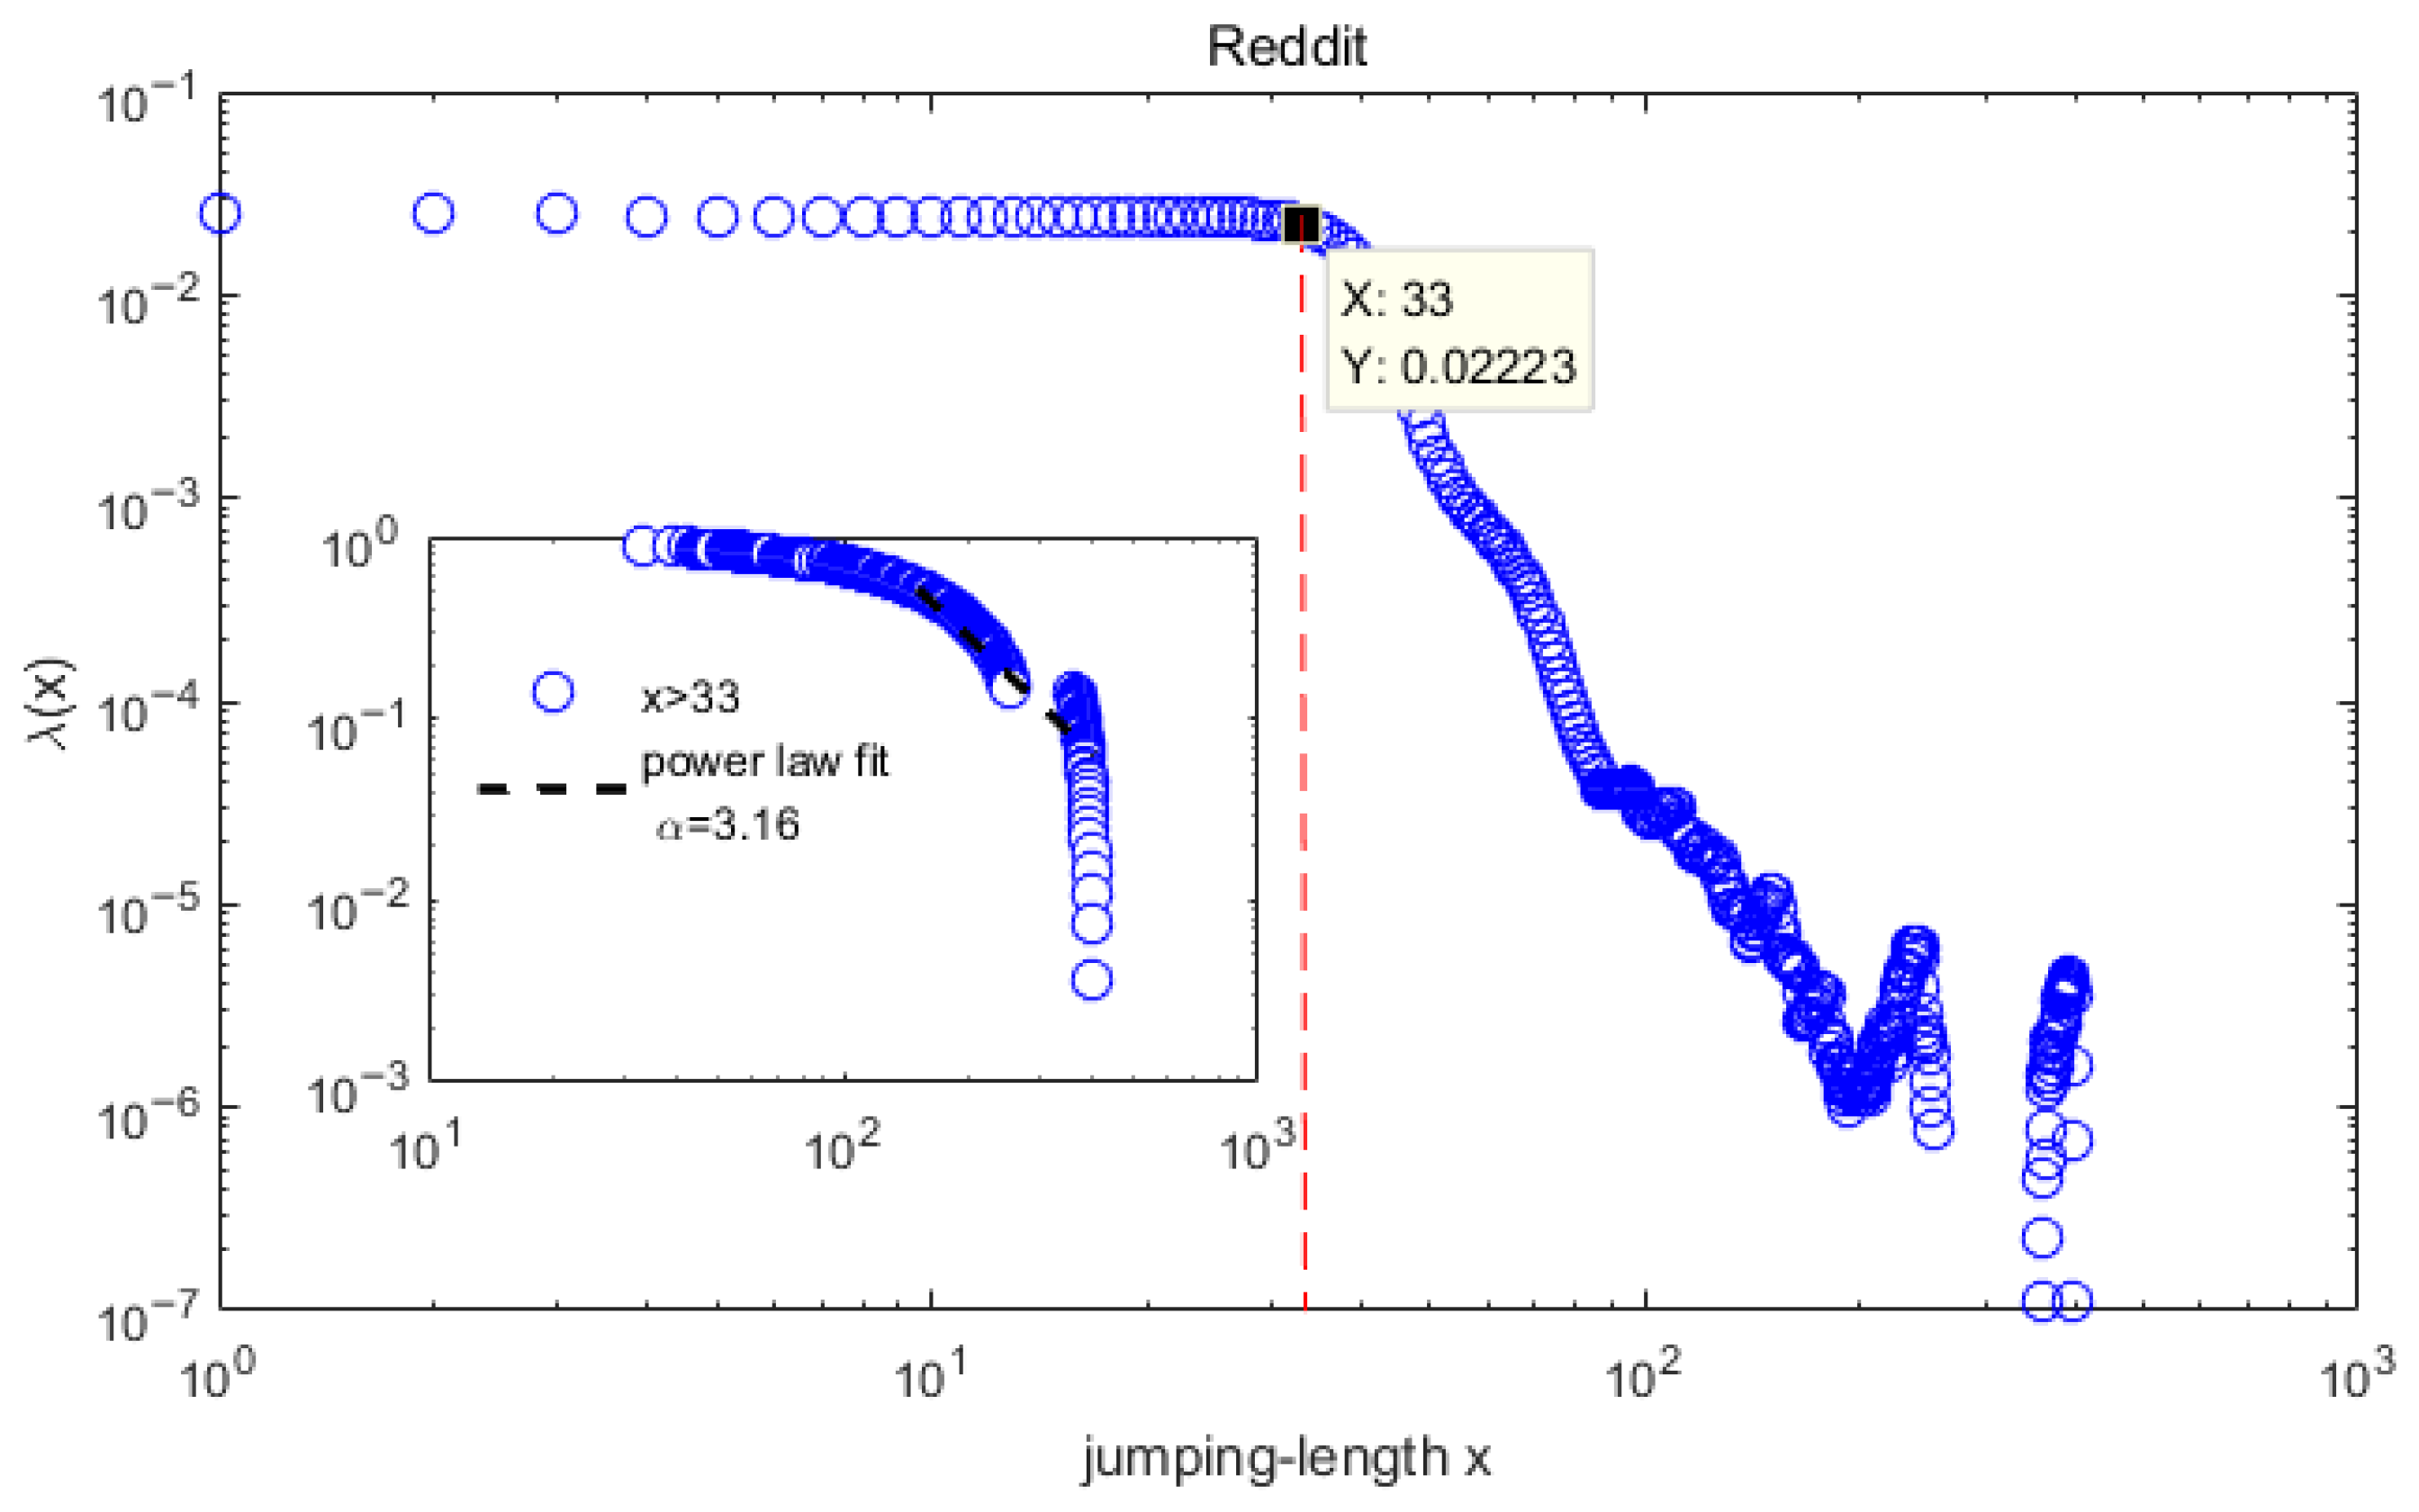
Similar to the distribution of waiting time, the distribution of jump step length exhibits almost the same distribution characteristics. As shown in
Figure 4, the jump step length exhibits a uniform distribution between (1, 33). When the jump step length exceeds 33, its density follows a power-law distribution with a power exponent of 3.25.
To estimate the power-law exponents, we applied the maximum likelihood estimation (MLE) method with goodness-of-fit testing, following the procedure recommended by Clauset et al. [
41]. For each distribution, we first identified the lower bound
where the power-law behavior begins by minimizing the Kolmogorov–Smirnov statistic between the empirical and fitted distributions. The exponent
was then estimated via MLE. This approach ensures statistically reliable identification of heavy tails.
The observed phenomenon can be attributed to the early stages of diffusion, as shown in
Figure 4; the MSD closely aligns with long distance jump (when the jump step size x exceeds 33, its density follows a heavy tailed power-law distribution
with larger variance
, and is not significantly influenced by waiting time (as shown in
Figure 3, when
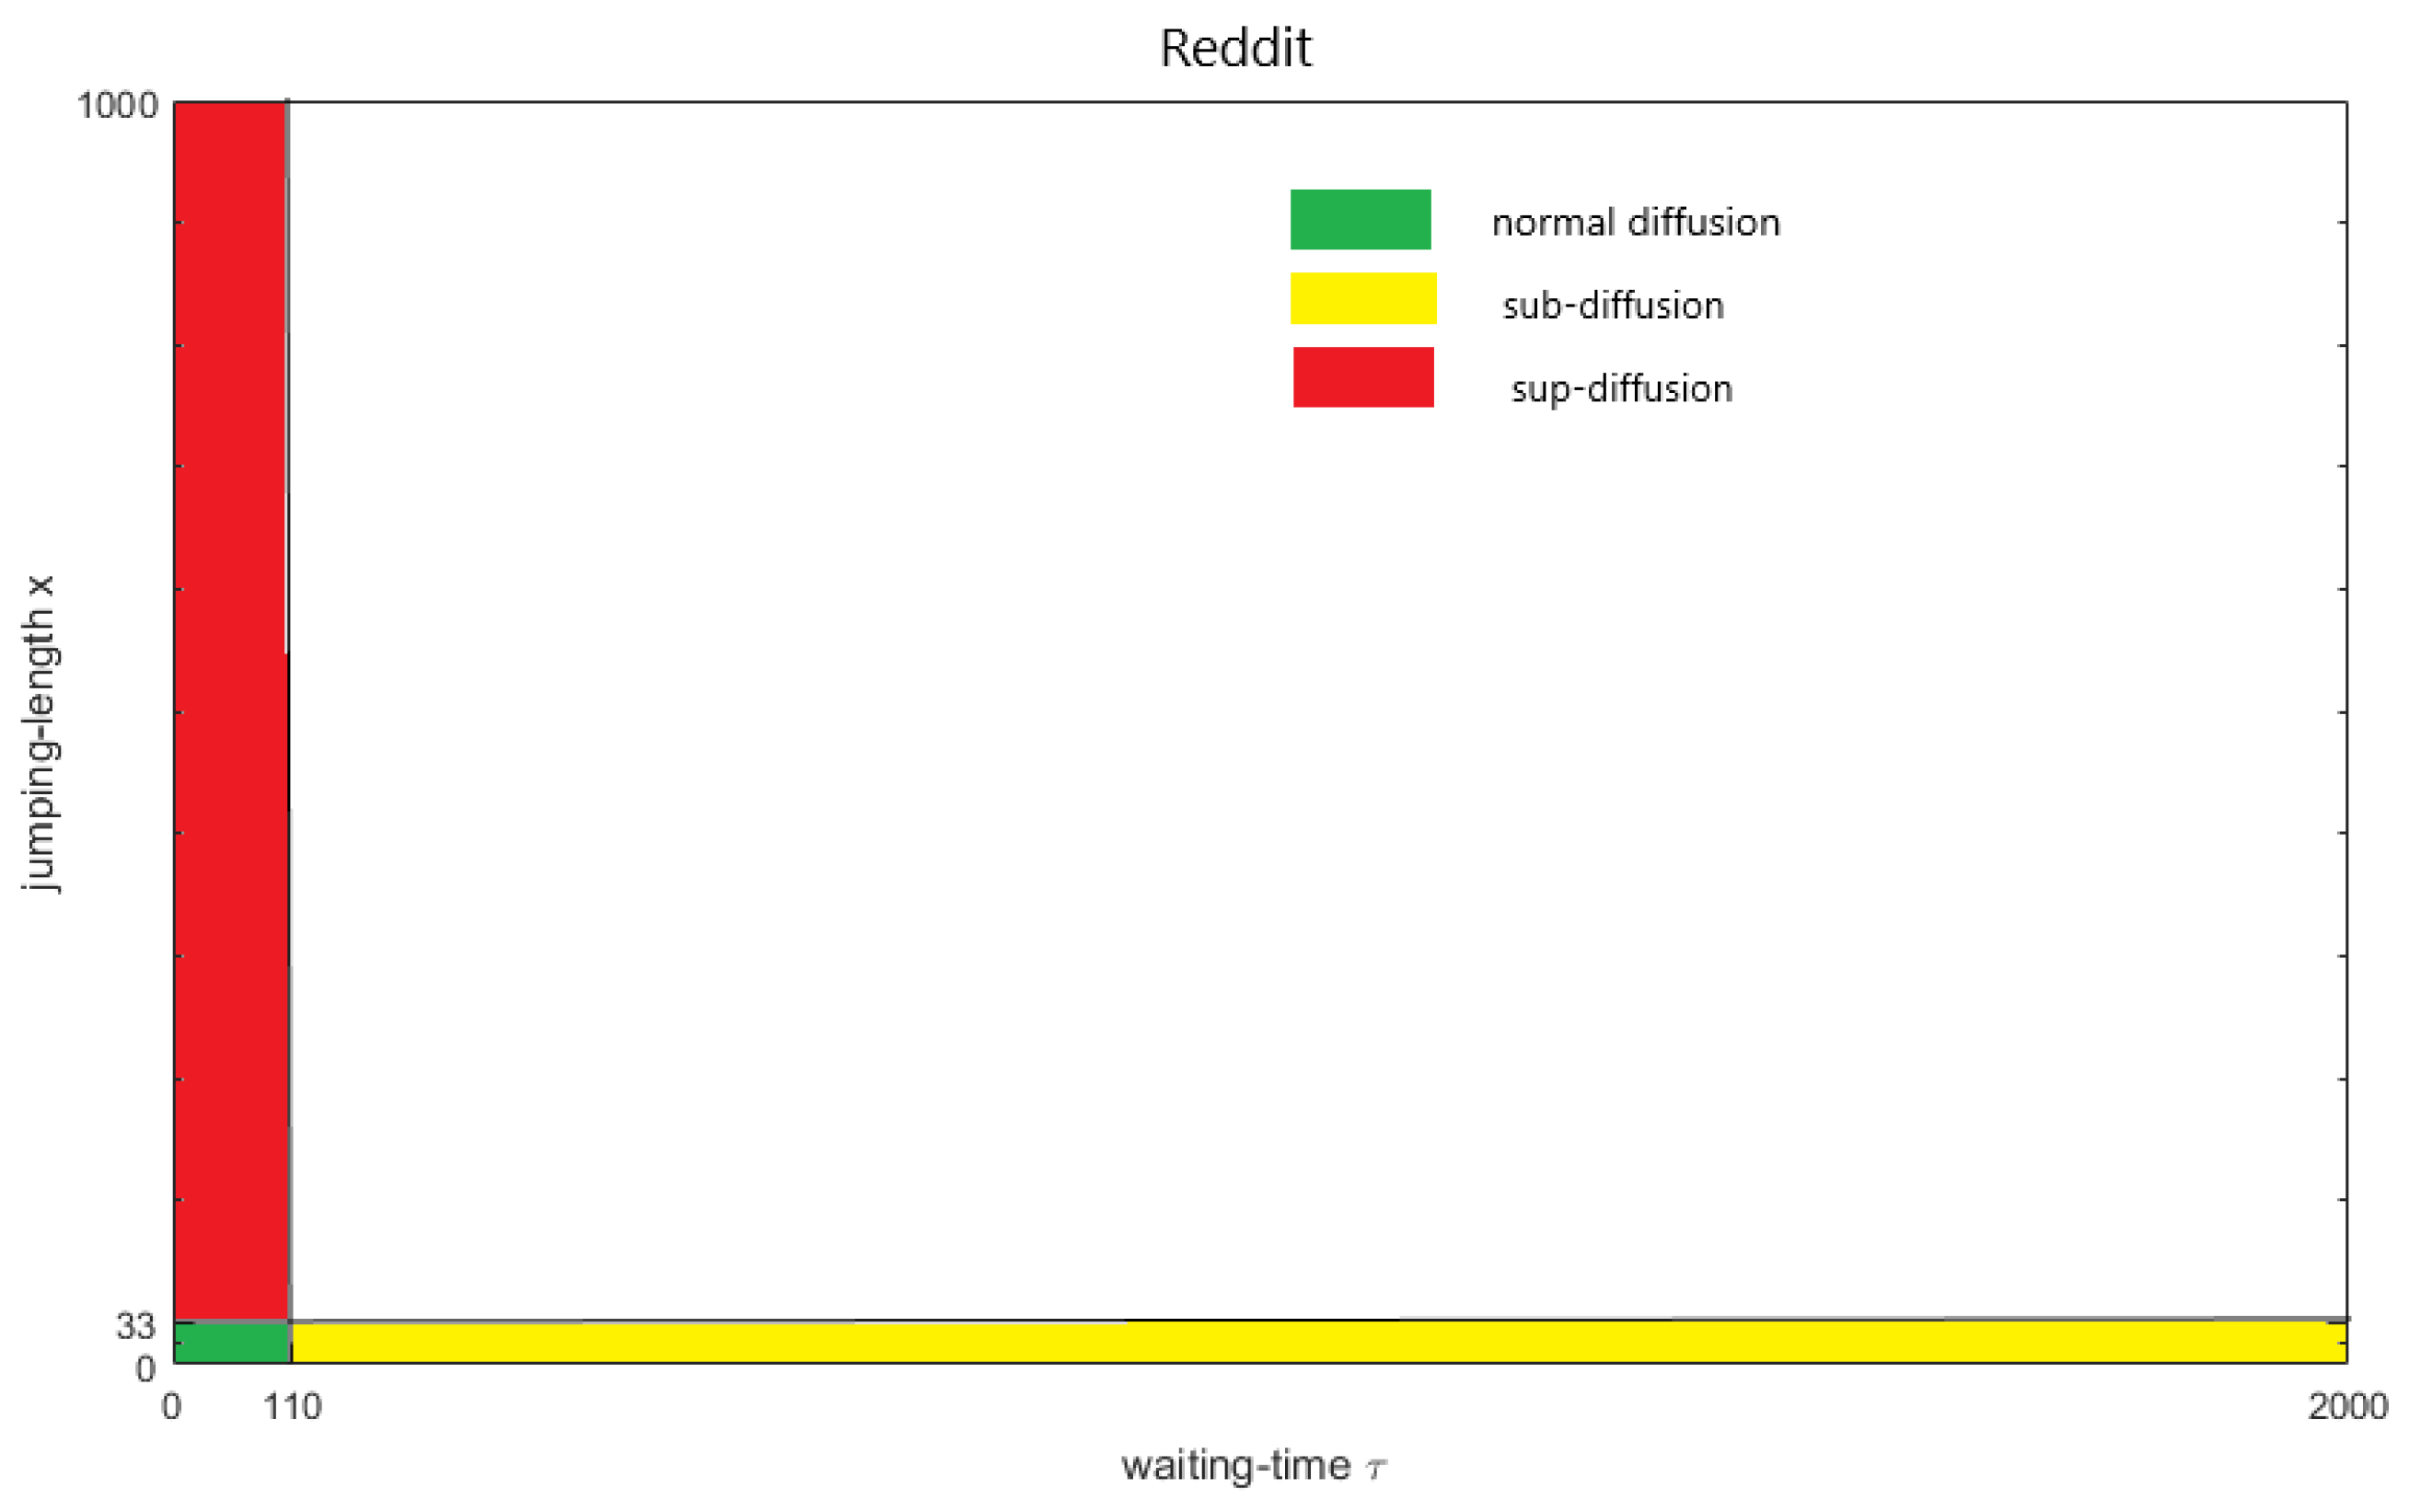
, its density follows a uniform distribution with finite mean 55 min), resulting in a state known as superdiffusion (red rectangle in
Figure 5).
The empirical evidence shows that the sentiment diffusion behavior of signed edges is no longer entirely random. Although short step sizes are predominant, there are occasional significant displacements that considerably exceed the average distance traveled. The probability decay rate for these long step sizes is remarkably slow. This process of sentiment diffusion is comparable to Lévy flight. At this stage, the signed network system is in a non-equilibrium state, characterized by an uneven distribution of resources and the presence of long-range correlations. From the perspective of social network information dissemination, this phenomenon manifests as the breaking of the information Cocoons.
However, as shown in
Figure 3 and
Figure 4, as we progress to the later period of diffusion, MSD is significantly influenced by long waiting time (when
, its density follows a power-law distribution
with larger mean 183.3 and variance 26,886.2 min), and accompanied by finite variance jump size (when
, its density follows a uniform) resulting in a state known as subdiffusion (yellow rectangle in
Figure 5). This situation illustrates that sentiment diffusion within signed networks is now limited to local communities, leading to a lack of sustained long-term interaction between them. This phenomenon can be explained through the framework of information diffusion, especially in relation to the emergence of information cocoons.
Meanwhile, we also identified a rare instance of a normal diffusion pattern (green rectangle in
Figure 5), which pertains to scenarios where the jump step sizes and waiting times do conform to a finite expectation and variance distribution.
The schematic diagram in
Figure 5 illustrates the mechanism for establishing three diffusion patterns within Reddit.
The data we have accessed reveals that the early evolution of signed networks is marked by superdiffusion. This means that the sentiment of the source community post towards the target community post over long and ultra-long distances, highlighting a remarkable period of rapid growth for the signed network. As we progress to the middle and later stages of signed network evolution, we notice a fascinating oscillation between superdiffusion and subdiffusion. Furthermore, exponent of diffusion types nearing 1 signals that Reddit is gravitating toward normal diffusion. This transition is crucial, as it indicates that the signed network is shifting from a dynamic growth phase into a more stable period of maturity or gradual stagnation.
In the context of the OTC signed network, at the early stage, the sentiment dynamic exhibits characteristics of superdiffusion. In the intermediate phase of its evolution, the sentiment dynamics within OTC exhibit fluctuations between subdiffusion and superdiffusion, while maintaining a central emphasis on normal diffusion. In the middle and later stages, the sentiment dynamics in OTC tend to converge toward a stable normal diffusion pattern.
The results respond to the fact that all of them (Reddit, OTC) have gone through a brief normal diffusion stage, and from the perspective of the entire time range, they have exhibited abnormal diffusion patterns. The experiments reveal a significant deviation from normal diffusion, indicating that the diffusion process occurs at rates that may be either faster or slower than normal cases. Additionally, the MSD does not demonstrate a linear correlation with time.
Figure 2 also reflects the physical fact that the diffusion processes in the signed systems are in equilibrium or very close to equilibrium for both OTC and Reddit in relation to evolution time.
To provide a theoretical explanation for the occurrence of three distinct types of diffusion at varying stages within OTC, we also conduct an empirical analysis of the distributions related to waiting times and jump-length echoed to Theorem 1.
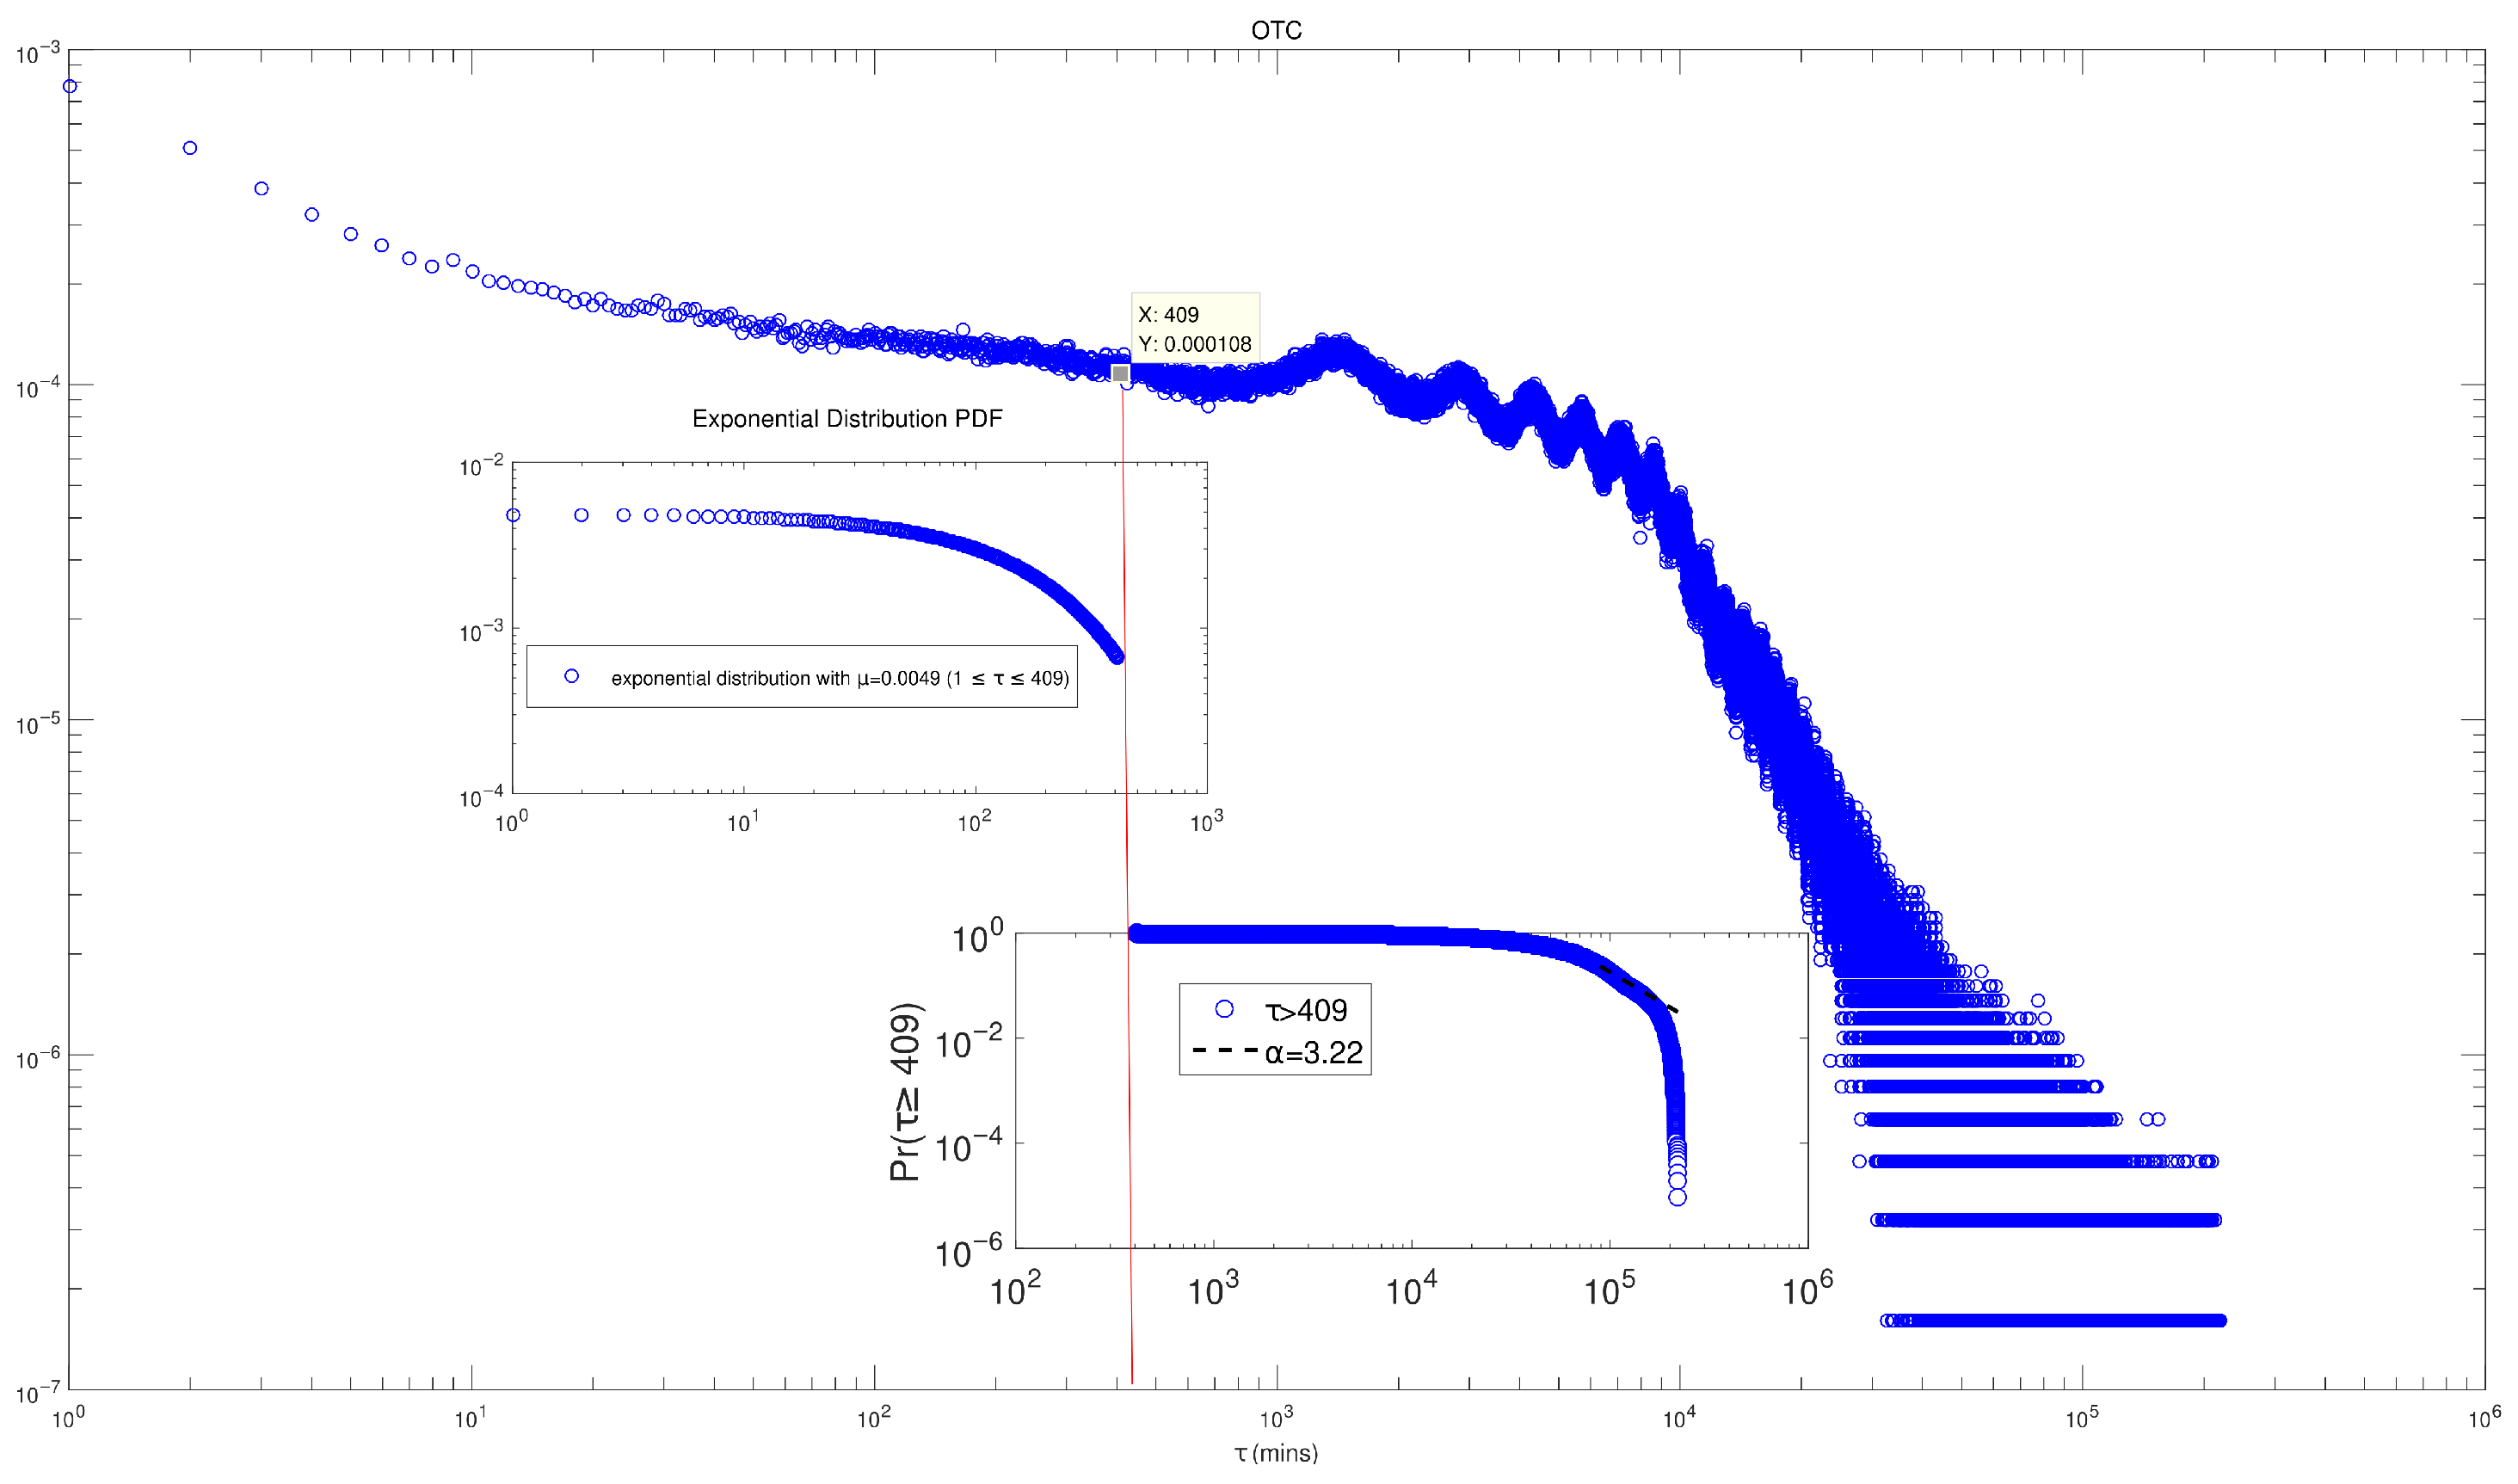
Figure 6 demonstrates that when the waiting time is between 1 and 409 (mins), its density conforms to a uniform distribution denoted as
. In contrast, when the waiting time exceeds 409 min, the density follows a power-law distribution characterized by a power exponent of
.
Meanwhile, as shown in
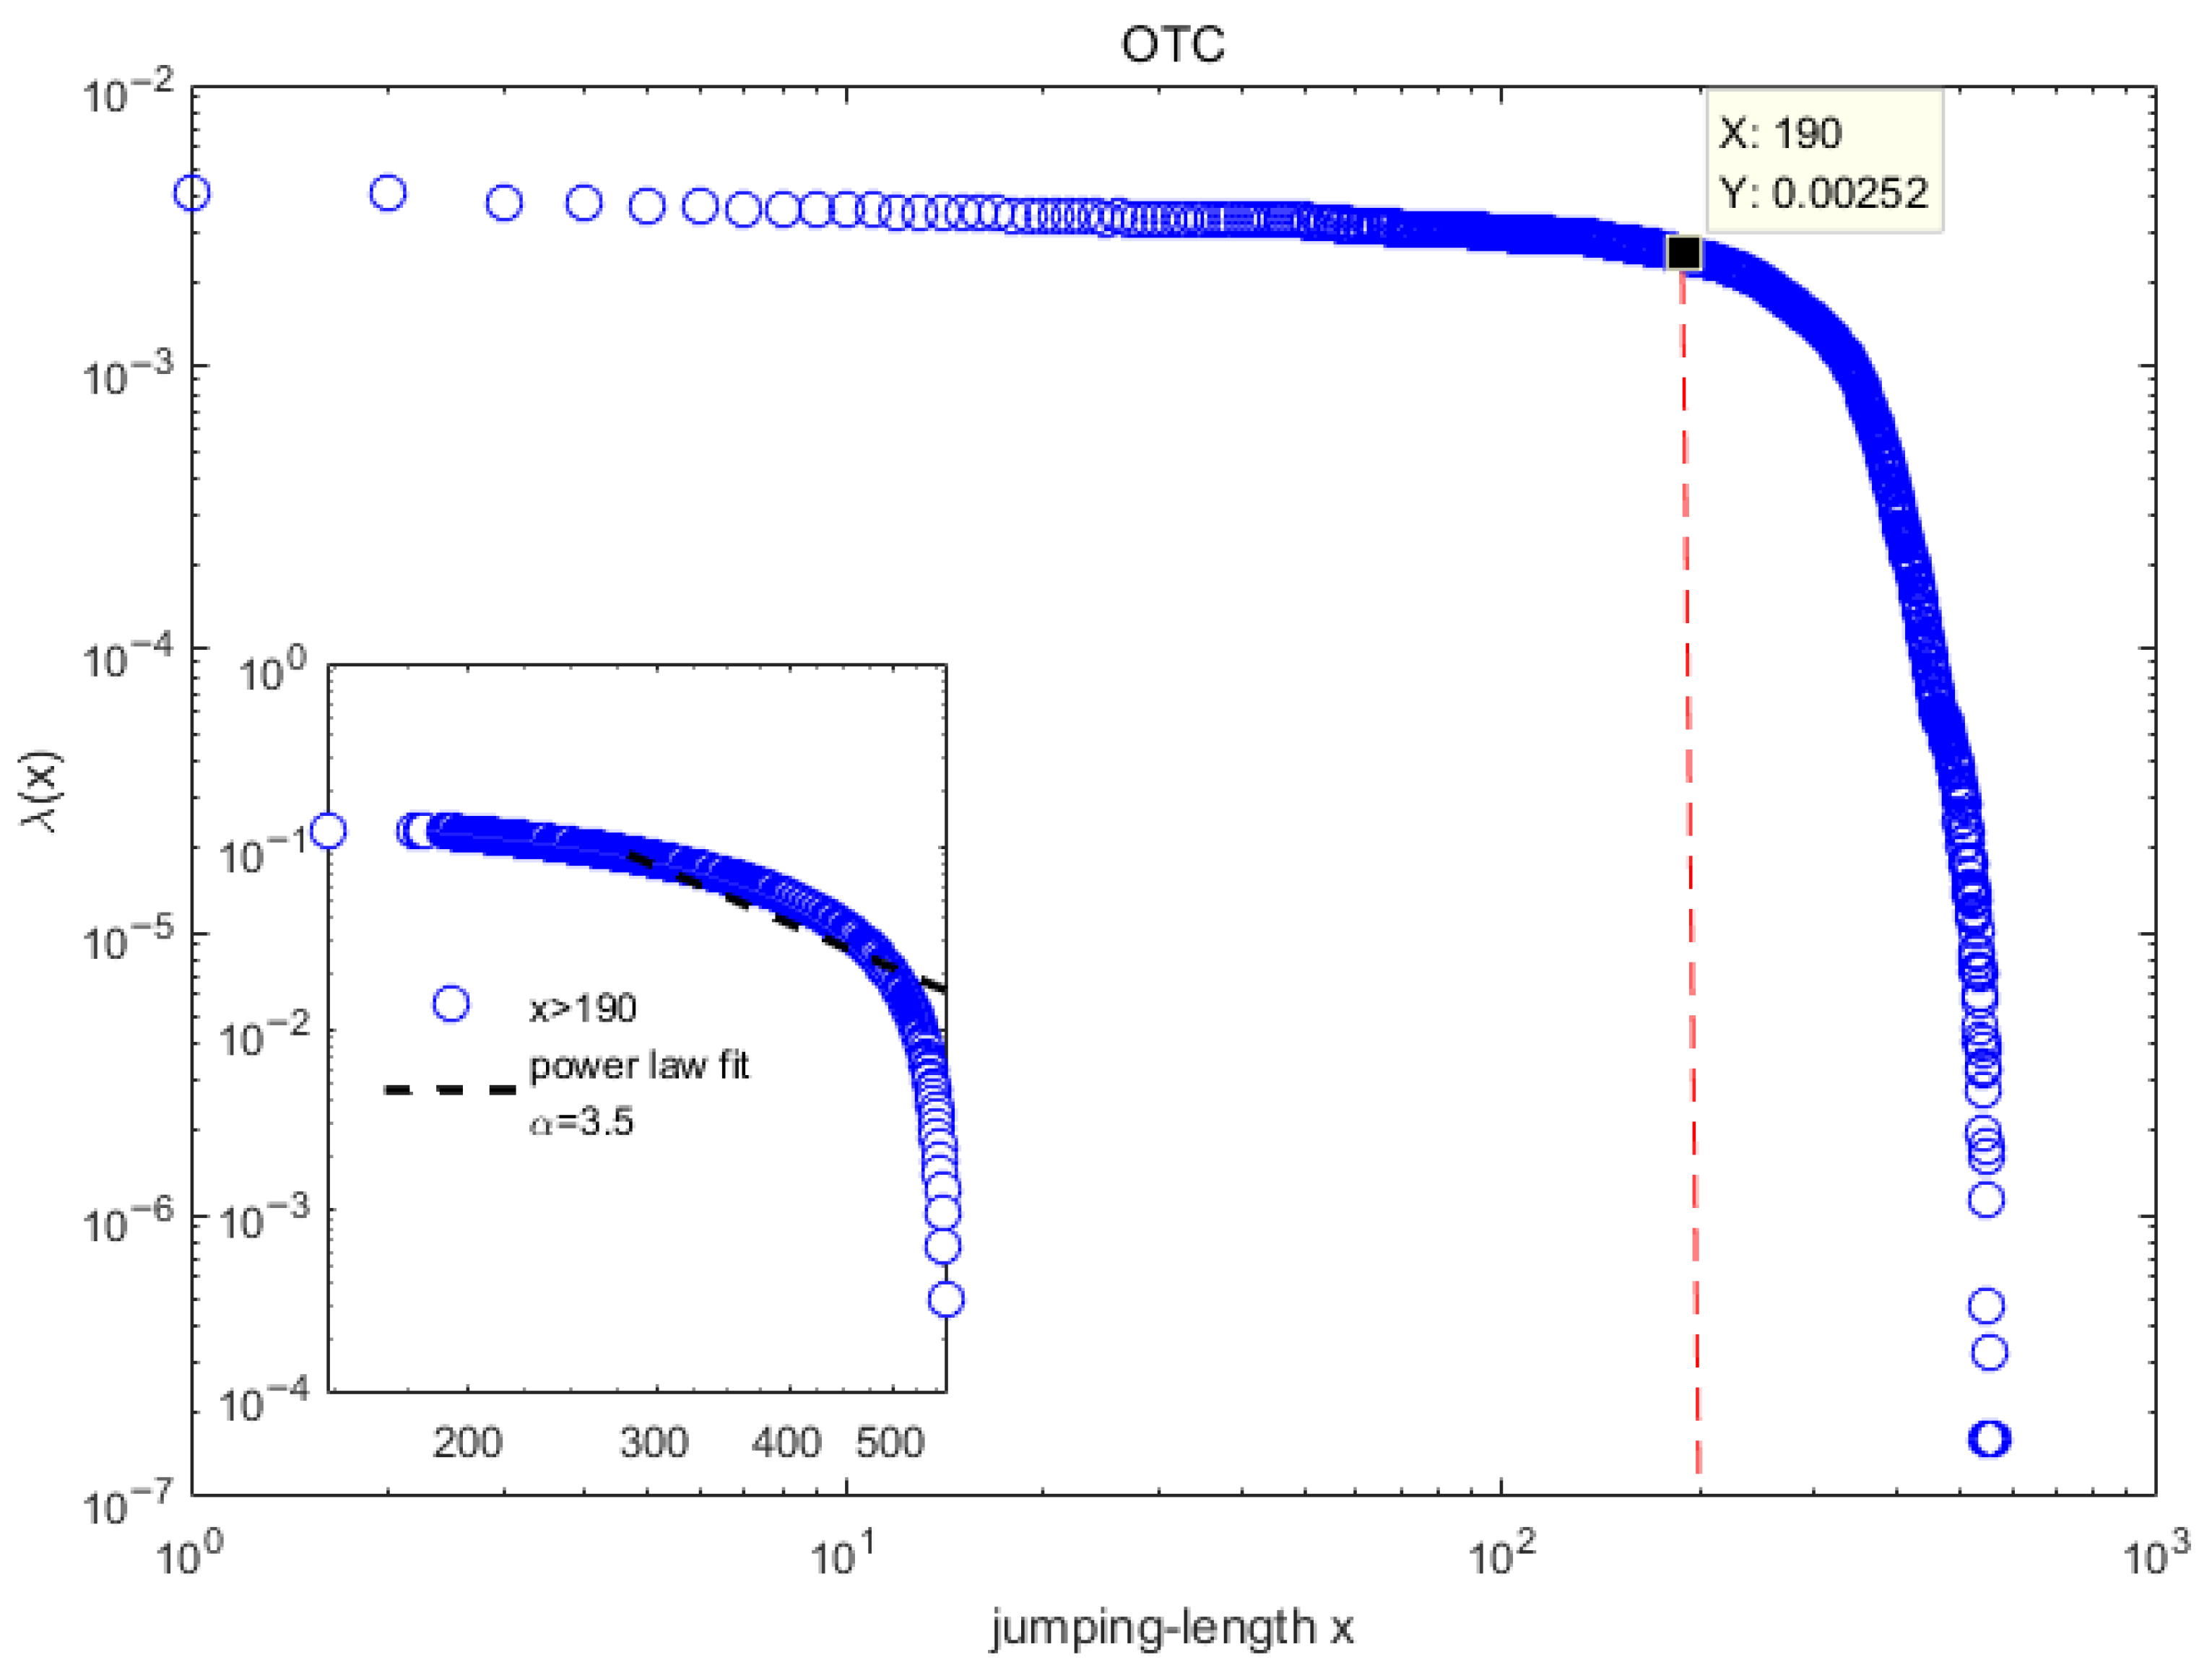
Figure 7, the jump step length exhibits a uniform distribution between (1, 190). When the jump step length exceeds 190, its density follows a power-law distribution with a power exponent of 3.22.
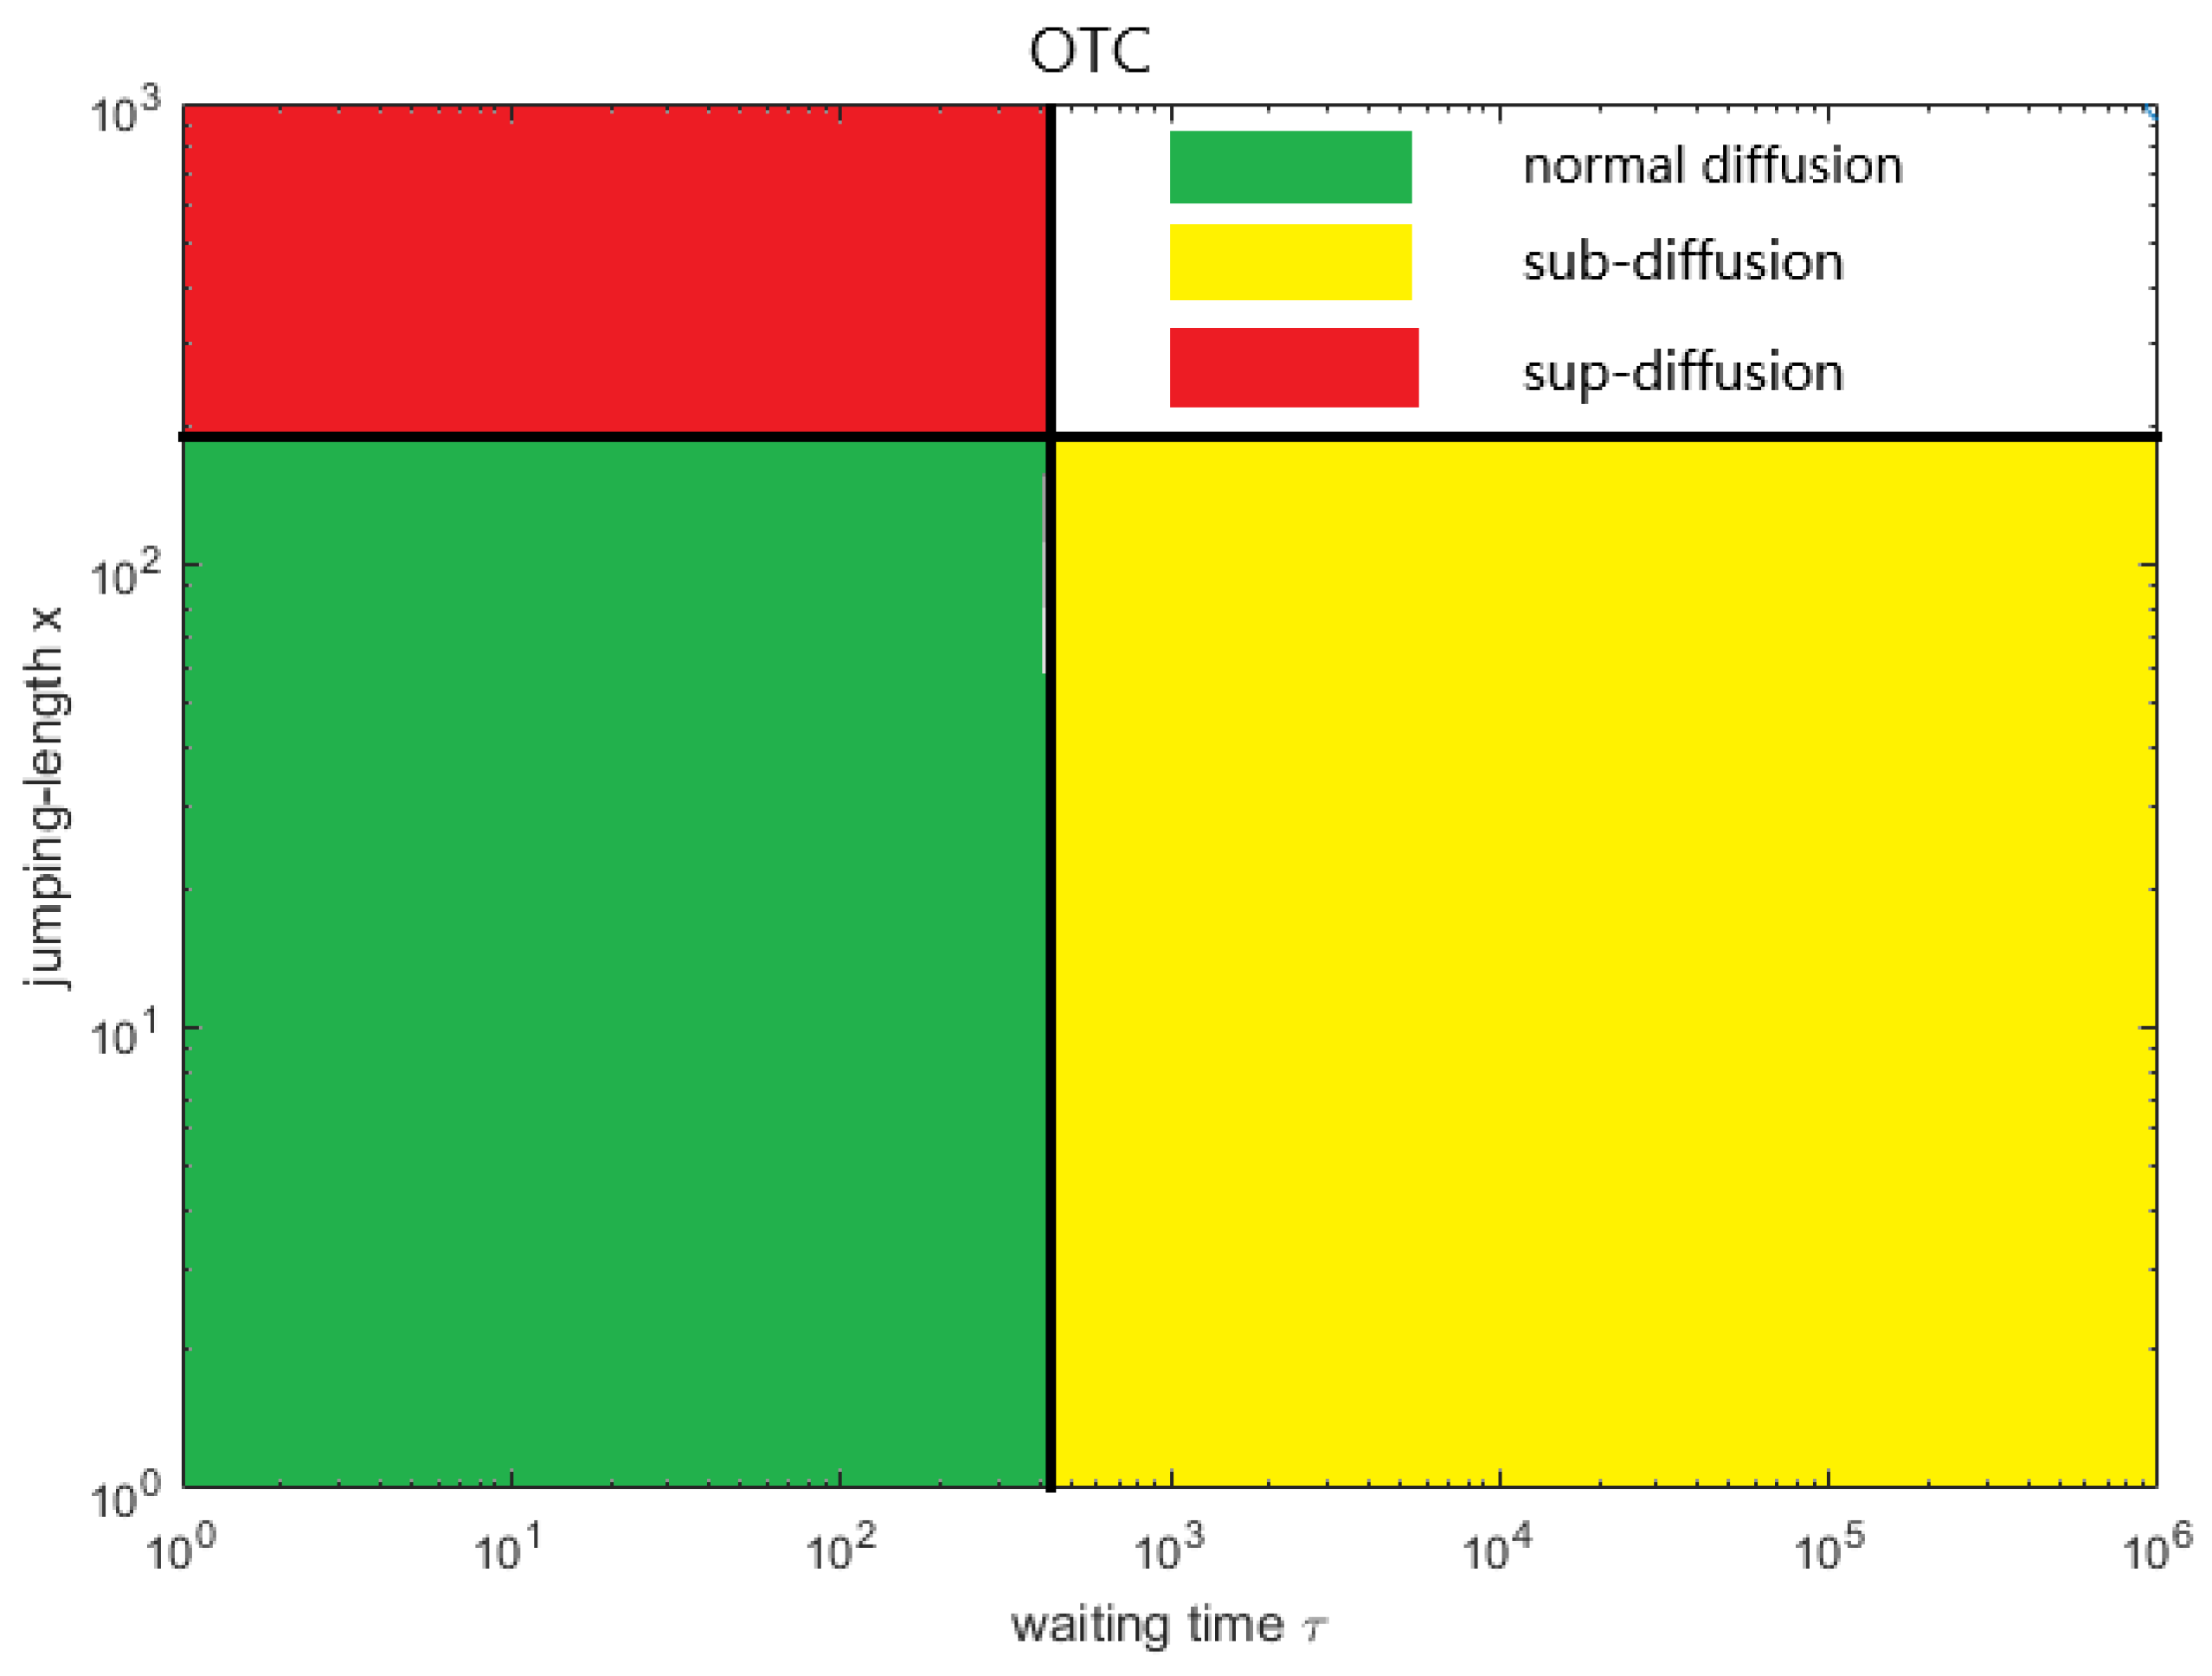
In a manner similar to
Figure 5,
Figure 8 delineates the mechanisms underlying the formation of three patterns of sentiment diffusion within the context of OTC. The first scenario, the distribution of waiting times with a finite expectation, coupled with divergent jump lengths, results in a phenomenon referred to as superdiffusion (indicated by the red rectangle in
Figure 8). The second scenario, the distribution of waiting times with an infinite expectation, coupled with convergent jump lengths, results in a phenomenon referred to as subdiffusion (indicated by the yellow rectangle in
Figure 8). The third scenario, both the distribution of waiting times with a finite expectation coupled with convergent jump lengths, results in a phenomenon referred to as normal diffusion (indicated by the green rectangle in
Figure 8).
Our empirical analysis reveals that sentiment diffusion in signed networks exhibits three distinct regimes—subdiffusion, normal diffusion, and superdiffusion—depending on the underlying distributions of waiting times and jump lengths. These regimes are closely linked to the phenomenon of information cocoons and echo chambers in online social networks.
The subdiffusive regime, characterized by long waiting times and finite jump lengths, corresponds to a situation where sentiment propagation is confined to local communities. This aligns with the concept of “information cocoons” or “echo chambers,” where users are exposed primarily to opinions that reinforce their existing beliefs. Recent empirical studies by Cinelli et al. [
7] on Facebook, Twitter, Reddit, and Gab, and by Flaxman et al. [
8] on online news consumption provide strong evidence that such compartmentalization occurs in real social networks. In our model, subdiffusion (
) reflects these localized interaction patterns, where the formation of new signed edges is hindered by long pauses and limited spatial reach.
Conversely, the superdiffusive regime (
) indicates accelerated sentiment spread, often driven by occasional long-distance jumps (heavy-tailed jump lengths). This regime can be interpreted as the breaking of information cocoons, where cross-community interactions allow novel perspectives to propagate rapidly. Such behavior is consistent with the “anomalous diffusion” reported by Foroozani & Ebrahimi [
12] in Twitter and Digg, where information spreading was found to be subdiffusive overall but exhibited superdiffusive bursts in early stages.
Our time-fractional diffusion model provides a unifying framework that captures both subdiffusive and superdiffusive regimes through a single exponent
. Compared to classical CTRW approaches [
6,
13], which focus primarily on temporal scaling, our model explicitly incorporates the signed nature of edges and the competition between positive and negative sentiments. This aspect is increasingly recognized in modern network science, where signed graph neural networks [
15,
16] and temporal network analysis [
20] are used to model polarity and dynamics. Our findings thus complement these recent developments by offering a complementary analytical perspective grounded in fractional calculus.
The observed transition from superdiffusion to normal diffusion over time suggests a maturation process in online communities: initial rapid, long-range sentiment exchanges gradually give way to more balanced, localized interactions as the network stabilizes. This pattern is robust across the two distinct platforms studied (Reddit and Bitcoin OTC), suggesting that the underlying mechanisms may generalize to other signed networks, though further empirical validation is required.
In summary, the diffusion regimes identified in our model provide a quantitative basis for understanding how information cocoons form and dissolve in signed social networks. The theoretical framework bridges microscopic random walk dynamics with macroscopic diffusion behavior, offering a powerful tool for analyzing sentiment propagation in digital environments.
6. Conclusions
We embark on an inspiring exploration of the generation of signed edges within the dynamic realm of real-world online social networks, where sentiments of positivity and negativity coexist. Our primary aim is to create an analytical framework that illuminates the transformative growth of sentiment as it spreads across these interconnected signed systems, envisioned as a physical diffusion process. To accomplish this objective, we initially utilized fractional order diffusion equations to elucidate the dynamic patterns of emotions within signed networks.
Random walks are pivotal in a diverse array of methodologies aimed at extracting valuable information from complex networked systems. These processes act as a fundamental model for understanding conservative diffusion phenomena that occur within networks. The inherent linear characteristics of traditional random walks facilitate comprehensive analytical approaches, allowing researchers to unravel intricate patterns and behaviors observed in the dynamics of networks.
The analysis begins with the implementation of a simple random walk model on a one-dimensional line to simulate the sentimental growth and fluctuations. This foundational model is then extended to a continuous framework, leading to the formulation of a standard diffusion equation. We further developed the standard diffusion equation to explore a fractional order case. As a result, we derived the fundamental Gaussian solution for basic stretching time, which demonstrates the mean squared displacement (MSD) represented by . This framework delineates the subdiffusion for , normal diffusion when , and superdiffusion for , based on the theoretical derivation and empirical validation on two signed networks.
The formula provides a basis for understanding sentiment diffusion behavior, as illuminated by the analysis of variations in the power exponent. This approach offers insights into the dynamics of sentiment propagation and fluctuations within the two signed networks studied here. For example, when we see the emergence of information cocoons since the sentiment diffusion is locked into local communities. While , we state that a signed edge can form between long-distance users, crossing barriers among communities, which indicates that the information cocoon has been broken. Superdiffusion may be the result of active users’ trust in transport processes or due to jumps with heavy-tailed distributions.
Our empirical analysis of the Reddit and Bitcoin OTC networks reveals three key findings: (i) sentiment diffusion exhibits all three regimes—subdiffusion (), normal diffusion (), and superdiffusion ()—across different evolutionary stages; (ii) the transition from superdiffusion to normal diffusion over time suggests a maturation process in online communities, where initial rapid, long-range exchanges gradually give way to more balanced, localized interactions; (iii) the diffusion regime is determined by the underlying distributions of waiting times and jump lengths, consistent with the theoretical predictions of Theorem 1.
We have empirically validated the effectiveness of our proposed fractional diffusion equation through the analysis of two large-scale temporal signed networks. The generation process of signed edges on Reddit and OTC demonstrates that the patterns of emotional transmission and fluctuation within these two signed networks exhibit distinct characteristics during various evolutionary periods, including subdiffusion, superdiffusion, and normal diffusion. Utilizing Theorem 1, this study rigorously establishes the conditions required for the emergence of three distinct diffusion modes through a thorough analysis of the distributions of random walking steps and interval times.
This research aims to advance our understanding of analytical methods related to topological structures that incorporate signed attributes, alongside the development of evolutionary models. By focusing on the theory of structural balance and the principles governing the evolution of social network factions, this study seeks to contribute valuable insights that could enhance further exploration in these areas.
Despite these contributions, our model has several limitations. First, the assumption of an infinite one-dimensional lattice, while analytically tractable, simplifies the complex topological structure of real signed networks. Second, the model treats time as continuous and assumes homogeneity in step and waiting-time distributions, which may not fully capture platform-specific heterogeneities. Third, the empirical validation is limited to two datasets (Reddit and Bitcoin OTC); generalizability to other signed social networks requires further testing. Fourth, while the theoretical model assumes homogeneous, independent waiting times and jump lengths, the empirical data exhibit platform-specific heterogeneity and time-varying fluctuations (e.g., the trajectories oscillate between diffusion regimes, and Reddit exhibits higher variability than OTC). Consequently, the model should be interpreted as capturing the first-order asymptotic scaling behavior rather than an exact microscopic description. The theoretical predictions (Theorem 1) hold asymptotically under the assumed distributional conditions; deviations in empirical data are expected and inform the boundaries of the model’s applicability.
Future research directions include: (1) extending the model to higher-dimensional lattices or network-constrained random walks to better capture topological complexity; (2) incorporating node-specific heterogeneity (e.g., user activity, influence) and time-varying parameters to account for non-stationary behavior; (3) applying the framework to other types of signed networks, such as political discourse networks, product review networks, or collaborative platforms; (4) integrating the fractional diffusion approach with modern graph neural networks [
15,
16] to combine analytical tractability with data-driven learning; and (5) exploring the implications of our diffusion regimes for designing interventions to mitigate echo chambers or foster healthy cross-community interactions.
The fractional diffusion model explored in this article provides insights into how emotions traverse through the two signed networks studied. While these findings suggest potential relevance for understanding sentiment dynamics in other online platforms, further validation on a broader range of signed networks is needed before generalizing the conclusions. Grasping these mechanisms may inform the development of communication strategies, but the applicability to other social media contexts requires additional investigation.