Article

Fractional Calculus and Adaptive Balanced Artificial Protozoa Optimizers for Multi-Distributed Energy Resources Planning in Smart Distribution Networks

1
Renewable Energy and Environmental Technology Center, University of Tabuk, Tabuk 47913, Saudi Arabia
2
Electrical Engineering Department, Faculty of Engineering, University of Tabuk, Tabuk 47913, Saudi Arabia
3
Electrical Engineering Department, Comsat University Islamabad Attock Campus, Attock 43600, Pakistan
4
Department of Electrical Engineering, Dong-A University, Busan 49315, Republic of Korea
5
Department of ICT Integrated Safe Ocean Smart Cities Engineering, Dong-A University, Busan 49315, Republic of Korea
*
Authors to whom correspondence should be addressed.
Fractal Fract. 2026, 10(2), 101; https://doi.org/10.3390/fractalfract10020101
Submission received: 18 December 2025 / Revised: 18 January 2026 / Accepted: 29 January 2026 / Published: 2 February 2026

Abstract

This paper presents two enhanced variants of the Artificial Protozoa Optimizer (APO), namely the Adaptive Balanced Artificial Protozoa Optimizer (AB-APO) and the Fractional Calculus-Enhanced Artificial Protozoa Optimizer (FC-APO), for optimal multi-Distributed Energy Resources (DERs) planning in smart radial distribution networks. The proposed framework addresses the coordinated allocation of Electric Vehicle Charging Stations (EVCSs), photovoltaic (PV) units, and Battery Energy Storage Systems (BESS). The AB-APO introduces an adaptive balancing mechanism that dynamically regulates exploration and exploitation to improve convergence stability and robustness, while the FC-APO incorporates fractional-order dynamics to embed long-memory effects, enhancing numerical stability and search smoothness. The proposed optimizers are evaluated on the IEEE-33 and IEEE-69 bus systems under eight DERs penetration scenarios. Simulation results demonstrate significant reductions in real and reactive power losses, improved voltage profiles, and effective mitigation of EV-induced network stress. Real power loss reductions exceeding 54%, 38.53%, 53.78%, 38.20%, 61.68%, and 60.72% are achieved for the IEEE-33 system, while reductions of 64.32%, 63.51%, 64.33%, 63.51%, 67.31%, and 67.04% are obtained for the IEEE-69 system across Scenarios 3–8. Overall, the results highlight the effectiveness of adaptive balancing and fractional-order modeling in strengthening APO-based optimization and confirm the suitability of the AB-APO and FC-APO as efficient planning tools for future smart distribution networks.

1. Introduction

Electric vehicles (EVs) are witnessing rapid global adoption due to zero tailpipe emissions and increasing reliance on clean energy sources. In parallel, the continuous reduction in photovoltaic (PV) panel and balance-of-system (BOS) costs has accelerated PV integration worldwide [1]. The widespread deployment of PVs and other DERs has enabled the emergence of prosumers, consumers who both generate and consume electricity [2]. Beyond environmental benefits, PV integration contributes to reduced power losses and improved voltage profiles in distribution networks [3], while lowering consumer dependence on utility supply and electricity costs. The growing penetration of EVs, together with advances in DER technologies, is widely recognized as an effective pathway to reduce petroleum dependence and greenhouse gas (GHG) emissions [4]. However, increased EV adoption significantly raises electricity demand and imposes additional stress on distribution networks, underscoring the need for strategic planning of EVCSs [5,6]. Prior studies indicate that 10% EV penetration can increase peak-demand charges by 17.9%, rising to 35.8% at 20% penetration [7]. Real-world charging analyses further confirm that EV charging amplifies peak demand, leading to higher power losses and voltage instability [8,9]. The resulting electrical stress may accelerate thermal loading in transformers and distribution cables, degrading insulation and reducing equipment lifespan if not properly mitigated. Coordinated charging strategies supported by accurate EV load modeling have been shown to reduce system losses and improve voltage profiles [10]. Despite these advances, the combined impact of high-penetration PV systems, BESSs, and EV charging has not yet been comprehensively investigated. Moreover, optimization frameworks addressing their simultaneous effects on power loss reduction and voltage stability enhancement remain under-explored.
Prior research has proposed numerous EVCS placement and planning techniques targeting specific objectives, such as leveraging EV fleets as spinning reserves to support peak-load demand and improve key performance indicators (KPIs), including voltage deviation (VD) and power loss reduction [11]. Particle swarm optimization (PSO) has been widely applied for the optimal siting of EVCSs in distribution networks [12], while other studies have incorporated carbon emission metrics into EVCS location problems [13]. Clustering-based approaches, such as the K-means method in [14], optimized interactions among parking stations to maximize profit while minimizing network losses and voltage fluctuations. Several studies have examined the coordinated integration of EVCSs with PV systems to mitigate the adverse effects of large-scale penetration [15,16]. More comprehensive frameworks considering user behavior, operator constraints, vehicle dynamics, system performance, and traffic conditions have also been developed for optimal fast-charging station placement [17]. To further alleviate EV-induced demand stress, batteries supporting solar-powered charging stations have been explored, demonstrating reduced grid demand and improved energy utilization [18,19]. Pricing-aware optimization models were proposed in [20] to determine optimal BESS capacities for minimizing operating costs in PV-powered EV charging. PSO-based financial sizing frameworks for grid-connected PV–BESSs, formulated as power-balanced energy systems (PBESs), were introduced in [21,22,23], incorporating economic indicators such as net present value (NPV) and contractual grid limits. Coordinated renewable storage grid control strategies supported by EMS architectures were demonstrated in [24], while mixed-integer linear programming (MILP) approaches were used for EV charging scheduling in PBES [25]. The optimal allocation of EVCS facilities with multi-energy resources was further investigated in [26]. In [27,28,29], the simultaneous allocation of DERs and shunt capacitors have been used to reduce losses and enhance voltage stability. More recently, multi-objective residential EMS frameworks incorporating vehicle-to-home (V2H) and home-to-grid (H2G) interactions were proposed using epsilon-constraint and lexicographic optimization to jointly minimize the electricity cost, peak-to-average ratio, and customer discomfort [30].
Nouri et al. [31] introduced a fuzzy-logic controller to coordinate vehicle-to-grid (V2G) and grid-to-vehicle (G2V) operations by regulating generation variability, demand dynamics, the EV state-of-charge, and parking duration, demonstrating improved charging station energy flow efficiency. Bibak and Bai [32] proposed an optimal scheduling framework for hybrid PV–battery–EV systems on a Turkish campus, achieving more than 5% electricity cost reduction and improved load profiles. A hybrid renewable-energy-based EVCS design for supermarkets under Morocco’s medium-voltage framework was developed in [33], while centralized genetic-algorithm-based residential valley-filling and transformer load mitigation through EV load shifting were investigated in [34]. Hierarchical and multi-objective charging/discharging power optimization at both station and EV levels was examined in [35], and the techno-economic feasibility of hybrid EVCS configurations was analyzed in [36]. Liu et al. [37] designed a transient energy network integrating rooftop PV, stationary storage, and EVs to realize a net-zero-energy office building with flexible grid interaction. Datta and Das [38] proposed a bi-level energy management strategy for hybrid microgrids across industrial, commercial, and residential sectors, improving both environmental and economic performance. Barik [39] analyzed optimal resource allocation in sustainable hybrid microgrids incorporating solar, wind, biomass, and EV-based DERs, addressing renewable intermittency and inertia challenges, and demonstrated the effectiveness of a quasi-oppositional chaotic selfish herd optimization algorithm using MATLAB/Simulink-based simulations.
Although extensive research exists on EVCSs, PV systems, and BESSs, most existing optimization approaches exhibit notable limitations when applied to high-penetration, multi-DER community- or institutional-scale distribution networks. Conventional metaheuristics and mathematical models often suffer from premature convergence, an inadequate exploration–exploitation balance, sensitivity to parameter tuning, and limited robustness under strongly nonlinear and tightly coupled EVCS–PV–BESS interactions. Moreover, most prior studies address EVCSs, PV systems, and BESSs independently or under simplified assumptions, leaving a clear gap in the comprehensive assessment of their simultaneous impacts on real and reactive power losses, voltage stability, and network stress under varying EVCS penetration levels. To address these shortcomings, this manuscript proposes two enhanced variants of the APO, namely the AB-APO and the FC-APO. The AB-APO introduces an adaptive balancing mechanism to dynamically regulate exploration and exploitation, thereby improving convergence consistency and solution reliability. The FC-APO integrates fractional-order calculus into protozoa movement to embed memory effects, enhancing convergence stability, search smoothness, and robustness. The proposed algorithms are applied to the joint optimization of EVCSs, PV systems, and BESSs in radial distribution systems, with the objective of minimizing real and reactive power losses while improving voltage stability.
In contrast to existing metaheuristic enhancement strategies, the proposed AB-APO and FC-APO introduce distinct and problem-specific improvements to the Artificial Protozoa Optimizer. The AB-APO employs an adaptive balancing mechanism that dynamically regulates exploration and exploitation based on the evolving search state, rather than relying on fixed control parameters or externally tuned transition rules commonly used in adaptive metaheuristics. Meanwhile, the FC-APO integrates fractional-order calculus directly into the protozoa movement dynamics, enabling long-memory effects through nonlocal historical dependence, which fundamentally differs from conventional hybrid or restart-based memory strategies. This fractional-order formulation provides smoother search trajectories and enhanced convergence stability, particularly in highly coupled multi-DER optimization problems, thereby establishing clear methodological novelty beyond existing APO variants and generic metaheuristic extensions.
The main highlights are as follows:
  • A new joint optimization framework for the simultaneous allocation of EVCSs, PV units, and BESSs in radial distribution networks.
  • An enhanced APO variant, the AB-APO, incorporating an adaptive exploration–exploitation balancing strategy that improves convergence robustness and mitigates premature stagnation.
  • An advanced APO variant, the FC-APO, integrating fractional calculus with memory-aware movement to enhance adaptability, embed long-memory effects, improve numerical stability, and balance global exploration with stable and precise local refinement to result in smoother and more consistent resource allocation decisions.
  • Extensive multi-scenario validation on IEEE-33 and IEEE-69 bus systems under eight DER penetration levels, demonstrating superior loss reduction and voltage stability support compared to existing baselines.
The remainder of this paper is organized as follows. Section 2 presents the mathematical modeling of EVCSs, PV units, BESSs, and the multi-objective optimization formulation. Section 3 describes the standard APO and details the proposed AB-APO and FC-APO variants, including their algorithmic structures and underlying mathematical principles. Section 4 discusses the simulation setup and analyses the results obtained on the IEEE-33 and IEEE-69 bus distribution systems under various DER penetration scenarios. Finally, Section 5 concludes the paper and highlights key findings and directions for future research.

2. Active Power Distribution Network

The rapid growth in global energy demand over the past two decades has intensified concerns regarding energy security, system adequacy, and sustainable development. Effective energy resource planning, supported by coordinated control and storage infrastructures, remains essential for ensuring economic stability during the clean energy transition. The deployment of microgrids enhances system flexibility and resilience, improving operational performance and reducing distribution losses. Recent work in the area is primarily aimed at overcoming the predominant challenges of the hybrid microgrids regarding the regulation of voltage and frequency, the mitigation of system inertia, the integration of renewable sources, and the use of metaheuristic algorithm techniques.
The high power demand imposed by fast-charging stations is illustrated in Figure 1 through a conceptual solar PV-supported EVCS framework. Unlike conventional passive distribution networks with unidirectional power flow from generation to consumers, active distribution networks employ advanced control strategies to manage high renewable penetration and increasing demand variability. Such networks integrate technologies such as advanced metering infrastructure, real-time monitoring and control, and smart grid–based communication and automation to regulate and optimize power flow. As a result, operational efficiency and reliability are enhanced while facilitating large-scale integration of renewable energy sources [40]. Consequently, active distribution grids represent a key enabler for the transition toward cleaner, smarter, and more sustainable power systems.

2.1. Voltage Stability Analysis

Static voltage analysis in power distribution systems is commonly conducted using three principal approaches: power flow analysis, Q–V curve assessment, and continuation power flow (CPF). Among these, power flow analysis is the steady-state tool most widely adopted by electric utilities for evaluating voltage performance. It enables the assessment of nodal voltage magnitudes at buses as well as active and reactive power transfers along distribution branches. Using the bus admittance matrix formulation, the general system relationship can be expressed as follows:
I b = k = 1 m   Y b k V k
Here, Y is the admittance, b is the bus number, and m is the total number of buses. Based on these, the current, voltage, and reactive power value for any bus can be determined through the relation provided in Equation (2):
I b = P b j Q b V * b
where P and Q stand for active and reactive power, respectively. The injection of active and reactive powers into bus `b` is given in Equation (3):
P b = + J Q b = V b k = 1 m   G b k J B b k V k
In this case, G and B represent the conductance and susceptance parts of admittance so that Y = G ± j B . The expression obtained for the active and reactive powers in terms of voltage magnitude and phase angle differences is given below:
P b = V b k = 1 m     G b k V k c o s   θ b k + B b k V k s i n   θ b k
Q b = V b k = 1 m     G b k V k s i n   θ b k B b k V k c o s   θ b k
where θ b k denotes the phase angle difference between buses.
In Q-V model analysis, voltage stability is determined assuming constant active power at every point, hence focusing on the reactive power and voltage interaction. The reduced Jacobian matrix, as expressed in Equation (6), is used to determine the incrementally characterizing sensitivity between reactive power and voltage:
Δ Q = J Δ V
The Jacobian matrix may be further decomposed as follows:
Δ V = k   x k η k / λ k Δ Q
where x and η denote the right and left eigenvector matrices of the Jacobian matrix, respectively, and λ represents its diagonal eigenvalue matrix. The relationship between voltage and reactive power is then expressed in Equations (8) and (9):
Δ V = x Λ 1 η Δ Q
Δ V = k   x k η k / λ k Δ Q
Here, x k is the kth right eigenvector column, η k is the kth left eigenvector row, and λ k is the corresponding eigenvalue obtained from the diagonal matrix Λ 1 . The voltage deviation associated with the kth mode is thus given by:
v k = 1 λ k q k
The eigenvalues of the Jacobian matrix are prominent indicators of the voltage stability of the system. A stable system has all the eigenvalues positive, whereas the absence or negativity of the minimum eigenvalue indicates instability. In addition to that, smaller positive eigenvalues indicate the closeness to voltage collapse.
The V–Q sensitivity at bus b is expressed as:
V b Q b = k   x b k η b k λ k
A negative V–Q sensitivity signifies voltage instability, with lower magnitudes indicating more robust voltage behavior. The relationship between buses and individual eigenmodes is quantified using the participation factor, defined in Equation (12):
P b k = x b k η b k
Equations (1)–(12) define the baseline power flow model for the radial distribution network. The computed system states real/reactive power losses and bus voltage profiles are directly passed to the objective functions optimized iteratively by the Std-APO and proposed APO variants.

2.2. Typical PV Panel

The number of PV panels needed in a PBES is expressed in relation to the expected output of the PV panels and the expected load on the system. The expected output of a PV panel is affected by several variables, which may include the effect of the cell temperature, level of irradiance, size of the panels, and absorption rate. This is shown in Equation (13) [41,42].
P p v ( t ) = G t ( t ) G r e f × P P V S T C × η P V × 1 β T T C T C S T C
where G t ( t ) denotes the incident solar irradiance perpendicular to the PV surface at time t, and G r e f = 1000 W/m2 represents the standard reference irradiance. P P V S T C is the rated power of the PV module under standard test conditions, while η P V denotes the panel efficiency. T C S T C is the reference cell temperature (25 °C), β T is the temperature coefficient (typically between 0.004 and 0.006 per °C), and T C is the operating temperature of the PV cell.
The cell temperature T C can be estimated using Equation (14):
T c = T a m b + ( N O C T 20 ) × G t ( t ) 800
where T a m b represents the ambient temperature and NOCT refers to the nominal operating cell temperature measured under typical laboratory test conditions.

2.3. Modeling of PV System

PV systems convert incident solar radiation into electrical energy through semiconductor devices [43,44,45]. The generated direct-current (DC) output is converted to alternating current (AC) through an inverter for grid compatibility. The instantaneous PV power output depends on the panel surface area (A), the solar irradiance u(t), and the module efficiency β as expressed in Equation (15):
P P V ( t ) = A β μ ( t )
In steady-state operation, the PV inverter is modeled as a constant power factor generator, allowing simultaneous consideration of load and generation for realistic system representation. The active power P k , t L and reactive power Q k , t L at bus k during time step t are thus computed using the following expressions:
P k , t L = P k ,   base L × H B F t
Q k , t L = Q k ,   base L × H B F t
where P k ,   base L and Q k ,   base L are the basal active and reactive powers, while H B F t time-dependent scaling factor is applied to the base-load values, respectively.

2.4. Battery Energy Storage System (BESS)

In PBESs, a BESS serves as a critical component for maintaining equilibrium between supply and demand. Through the proposed optimization model, the optimal BESS capacity and its associated charging–discharging schedule can be determined. The evolution of stored energy within the BESS for each time interval is described by Equation (18):
E B E S S t = E B E S S t 1 × 1 σ + p c h t × η c h × μ 1 t p dis t η dis × μ 2 t × Δ t t = [ 1,2 , , T ]
where σ denotes the self-discharge rate of the BESS, p c h t and p dis t represent the charging and discharging powers at time t, respectively, and η c h and η dis correspond to the charging and discharging efficiencies. The duration of each period is Δt, and T denotes the total number of time intervals. As indicated in Equations (19)–(21), the BESS cannot charge and discharge simultaneously:
μ 1 ( t ) + μ 2 ( t ) = [ 0 , 1 ]
μ 1 ( t ) = [ 0 , 1 ]
μ 2 ( t ) = [ 0 , 1 ]
Here, μ 1 ( t ) and μ 2 ( t ) are binary state variables of the BESS model and are not continuous weighting parameters. μ 2 ( t ) ∈ {0, 1} activates the charging mode (1 = charging, 0 = inactive), and μ 2 ( t ) ∈ {0, 1} activates the discharging mode (1 = discharging, 0 = inactive). The combined constraint μ 1 t + μ 2 ( t ) 1 ensures that charging and discharging do not occur simultaneously.
To prevent systematic energy accumulation or depletion across the scheduling horizon, the BESS energy level at the beginning and end of the cycle must remain equal, as enforced by Equation (22):
E B E S S ( 0 ) = E B E S S ( T )
In addition, charging and discharging rates are constrained by the manufacturer’s specifications, leading to the following limits:
P c h ( t ) P B E S S
P ds ( t ) P B E S S
If the PBES corresponds to the rated power of the storage unit, then the allowable energy range of the BESS is defined by Equation (25):
E B E S S min E B E S S ( t ) E B E S S max
where E B E S S max and E B E S S min are the upper and lower energy storage limits. The minimum permissible stored energy is expressed in Equation (26):
E B E S S m i n = ( 1 D O D ) E B E S S m a x
with DOD being the maximum allowable depth of discharge.
In the proposed framework, the sizes of EVCSs, PV units, and BESSs are not predefined but are treated as decision variables within the optimization process. Practical lower and upper bounds on DER capacities are imposed based on typical planning limits and feeder-level operational considerations to ensure feasible solutions. Within these bounds, the proposed optimizers simultaneously determine the optimal locations and sizes of DERs by minimizing power losses and voltage deviation while satisfying network constraints. The BESS model adopted in this study represents a planning-stage abstraction, where the optimized BESS size corresponds to its available discharge capability under supportive operating conditions, rather than continuous charging operation; detailed time-varying charging–discharging scheduling; and SOC-dependent operational modes.

3. Design Methodology

In this section, the general design approach used for the optimization of EVCSs, PV systems, and BESSs in the RDS is introduced for each case of the optimization approach presented in this section. To this purpose, the suggested approach is tested through the IEEE-33 and -69 bus systems considering various optimization scenarios representing different power penetration levels of EVCSs, PV systems, and BESSs. In order to achieve a fair comparison, all optimization methods are tested considering the same system constraints and variables and operation conditions. Also explained briefly in the following sections are the APO-Std and AB-APO and FC-APO methods that are the central optimization engines of the presented approach.

3.1. Artificial Protozoa Optimizer

Euglena is a unicellular organism classified under protozoa, exhibiting both plant-like and animal-like characteristics, which help it obtain nutrients through both autotrophic and heterotrophic modes. It reproduces asexually by binary fission, which is a simple and efficient dividing method [46]. Motivated by the foraging activity of Euglena, its dormancy response, and its reproduction dynamics, Wang et al. proposed the APO. This method mimics these processes as the governing principle for the search capability of the optimizer. A mathematical description of the APO is provided below.

3.1.1. Population Initialization

The APO is built upon the concept of classical random sampling, which is used to generate an initial population uniformly distributed within the search space. Each individual in the protozoa population is represented as:
y i = [ y i , 1 , y i , 2 , , y i , n ] , i = 1,2 , , K
where K denotes the population size and n is the dimensionality of the problem. The initial population is generated using Equation (28):
y i = L b + R a n d × ( U b L b )
where L b = l b 1 , l b 2 , , l b n , and U b = u b 1 , u b 2 , , u b n represent the lower and upper bounds of the decision variables. The terms I b n i and u b n i correspond to the nth components of these boundary vectors. The vector R a n d = r a n d 1 , r a n d 2 , , r a n d n contains uniformly distributed random values in the interval [0, 1], and the operator × indicates the Hadamard (element-wise) product.
At the start of each iteration, all individuals are ranked according to their fitness values, as indicated in Equation (29):
y i = s o r t y i ,
and based on this ordering, a subset of the protozoa population is randomly assigned to either dormant or reproductive states. The remainder enter the foraging state, determined by the proportional factor f , defined in Equation (30):
p f = p f m a x rand
where the maximum proportional threshold p f m a x is set to 0.1, and rand is a uniformly generated random number in [0, 1].

3.1.2. Foraging

Protozoa obtain nutrients required for survival through a combination of autotrophic and heterotrophic mechanisms. This biological behavior inspires the foraging phase of the APO, where individuals explore and exploit the search space based on adaptive movement strategies.

3.1.3. Autotrophic Mode

Under appropriate lighting conditions, protozoa perform plant-like photosynthesis using chloroplasts to synthesize carbohydrates for energy. They are also capable of sensing light intensity and direction, allowing them to migrate toward or away from light sources to locate favorable habitats. Within the APO framework, protozoa individuals move toward regions with light conditions that are more favorable for photosynthesis. This light-driven, plant-like behavior defines the autotrophic foraging mode, which is mathematically modelled by Equations (31)–(35).
y i n e w ( t + 1 ) = y i ( t ) + f ( y j ( t ) y i ( t ) + 1 n p . k = 1 n p w a ( y k ( t ) y k + ( t ) ) ) × M f
f = r a n d ( 1 + c o s ( t T π ) )
n p = N 1 2 m a x
w a = e | f ( y k ( t ) ) f ( y k + ( t ) ) + e p s |
M f [ d i ] = { 1 if   d i r a n d p e r m ( D , D i N ) 0 otherwise
In Equation (31), y i n e w ( t + 1 ) denotes the updated location of the protozoa individual y i ( t ) at iteration t+1. The variables t and T correspond to the current iteration and the maximum number of iterations permitted, respectively. The vector y j ( t ) represents a protozoa individual randomly selected from the population at iteration t. Prior to this selection process, all individuals are ranked in ascending order based on their fitness values. The term y k ( t ) refers to the kth left neighbor of the current individual y i ( t ) ; this neighbor is randomly chosen from among those protozoa whose ranking indices are smaller than i. Conversely, y k + ( t ) designates the kth right neighbor of y i t , randomly selected from the subset of protozoa with ranking indices greater than ii. The parameter np indicates the number of selected neighboring pairs incorporated into the foraging update process. The factor f is the foraging coefficient governing autotrophic movement, while w a is the corresponding weight parameter within this mode. The function f (⋅) computes the fitness value of each individual. Finally, M f is a random mapping vector of dimension D, which determines the specific components of the solution vector that undergo mutation during the foraging stage.

3.1.4. Heterotrophic Mode

In low-light environments, protozoa behave like animals, being heterotrophs, and their nutrition comes from consuming organic matter from their surrounding environment. In case a nutrient-dense region, ynear(t), exists within proximity to y(t), then the protozoa individual will migrate to said region. This is represented by Equation (36):
y i new ( t + 1 ) = y i ( t ) + f y near ( t ) y i ( t ) + 1 n p k = 1 n p     w h y i k ( t ) y i + k ( t ) × M f
where the position y near t is determined through Equation (37):
y near ( t ) = 1 ± R a n d 1 t T × y i ( t )
and the heterotrophic weight factor w h is given by:
w h = e f y i k ( t ) f y i + k ( t ) + e p s
In this formulation, y near ( t ) specifies a location proximal to y i t , where the symbol “±” reflects the possibility of movement in either direction relative to the current position. The terms y i k ( t ) and y i + k ( t ) denote the left and right neighboring individuals of y i ( t ) , respectively. The coefficient w h represents the weighting factor employed in the heterotrophic mode.
During the foraging process, the autotrophic learning model supports extensive search by examining the surrounding search space, and this enhances global search. On the contrary, the heterotrophic model is centered on optimizing areas, and this improves the local refinement process. The selection process for the transition between autotrophic and heterotrophic learning is expressed by the equation below:
y i new ( t + 1 ) = Equation   ( 31 ) , if   r   and   < p a h Equation   ( 36 ) , otherwise
where the probability p a h is defined as:
p a h = 1 2 1 + c o s t T π
The value of p a h controls the probability of the protozoa type exhibiting autotrophic or heterotrophic strategies at each iteration. The value of p a h gradually declines with the increasing value of t, thus changing the optimizer strategy from autotrophic, predominantly exploration-driven, to heterotrophic, predominantly exploitation-driven.

3.1.5. Dormancy or Reproduction

Dormancy
In unfavorable conditions within the environment, protozoa can enter a state of dormancy. During this process, non-active members within this population model will be replaced by new members. This process is characterized by Equation (41):
y i n e w ( t + 1 ) = L b + R   and   × ( U b L b ) .
This formulation generates a new individual uniformly within the defined search space, thereby promoting exploration.
Reproduction
When protozoa reach suitable physiological conditions, they reproduce asexually through binary fission. In the APO framework, reproduction is modeled by generating a modified replica of the current individual, as governed by Equation (42):
y i n e w ( t + 1 ) = y i ( t ) ± r   and   ( L b + R   and   × ( U b L b ) ) × M r ,
where the mutation mapping vector M r is defined element-wise in Equation (43):
M r [ d i ] = 1 , if   d i   is   in   r   and   perm   ( D , [ D   rand   ] ) 0 , otherwise
The symbol “±” indicates that the mutation may occur in a forward or reverse direction. The operator ⌈⋅⌉ denotes the ceiling function. The vector M r specifies which dimensions undergo mutation during reproduction.
In the APO search dynamics, the dormant phase emphasizes global exploration, while the reproductive phase enhances individual development and local refinement. The transition between these two states is determined by Equation (44):
y i new ( t + 1 ) = Equation   ( 41 ) ,   if   r   and   < p d r Equation   ( 42 ) , otherwise
where the probability of entering the dormancy state, p d r , is given by:
p d r = 1 2 1 + c o s 1 i N π
At the end of each iteration, the APO selects the final individual for the next generation using a greedy update strategy. The decision rule is stated in Equation (46):
y i ( t + 1 ) = y i new   ( t + 1 ) , if   f y i new   ( t + 1 ) < f y i ( t ) y i ( t ) ,   otherwise   .
This ensures that only individuals with improved fitness replace their predecessors, maintaining the algorithm’s convergence characteristics.

3.2. Adaptive Balanced Artificial Protozoa Optimizer (AB-APO)

Although the APO has a competitive performance, it sometimes encounters the results of early convergence and unevenly distributed exploration vs. exploitation, especially when solving the optimization tasks that have a large number of dimensions, a nonlinear model, and constraints. The proposed solution develops a new variant, the Adaptive Balanced Artificial Protozoa Optimizer.
The core idea of the AB-APO is to adaptively regulate the balance between global exploration and local exploitation throughout the optimization process by incorporating:
  • Adaptive balance coefficients.
  • Guided learning toward elite solutions.
  • Controlled stochastic perturbations to preserve population diversity. The mathematical formulation of the AB-APO is presented below.

3.2.1. Population Initialization

The AB-APO population consists of N protozoa (search agents), initialized uniformly within the search space
x i , d ( 0 ) = x d m i n + r i , d x d m a x x d m i n
where
r i , d U ( 0,1 ) ,   i = 1,2 , , N ,   d = 1,2 , , D

3.2.2. Adaptive Balance Mechanism

To dynamically regulate exploration and exploitation, the AB-APO introduces an adaptive balance factor β(t) defined as
β ( t ) = β m i n + β m a x β m i n 1 t T m a x
where:
t is the current iteration;
T max   is the maximum number of iterations;
β max   promotes exploration;
β m i n promotes exploitation.
This formulation ensures strong global exploration in early iterations, and progressive transition toward exploitation as convergence proceeds.

3.2.3. Position Update Strategy of AB-APO

The movement of each protozoa is governed by a balanced combination of guided learning and stochastic interaction
x i ( t + 1 ) = x i ( t ) + β ( t ) R 1 x best   ( t ) x i ( t ) + ( 1 β ( t ) ) R 2 x r 1 ( t ) x r 2 ( t )
where
x best   ( t ) is the global best solution;
x r 1 ( t ) ,   x r 2 ( t ) are two randomly selected distinct protozoa;
R 1 ,   R 2 U ( 0 ,   1 ) D ;
denotes element-wise multiplication.
In the above definition, the first term promotes exploitation by guiding the search process towards superior solutions, while the second term promotes exploration, which is supported by interaction at the population level. Both of these are controlled by the adaptive parameter β(t) automatically.

3.2.4. Stochastic Diversity Enhancement

To prevent stagnation and maintain diversity, the AB-APO incorporates a probabilistic perturbation mechanism
x i ( t + 1 ) = x i ( t + 1 ) + σ ( t ) ε , i f < P d x i ( t + 1 ) , o t h e r w i s e
where:
r U ( 0,1 ) ;
p d is the diversity activation probability;
ε N ( 0 , I ) ;
σ ( t ) is a decreasing perturbation scale:
σ ( t ) = σ 0 1 t T m a x
This mechanism ensures high randomness early in the search, and fine local refinement near convergence.

3.2.5. Boundary Handling

All updated solutions are repaired using a boundary control function
x i , d ( t + 1 ) = m i n m a x x i , d ( t + 1 ) , x d m i n , x d m a x

3.2.6. Fitness Evaluation and Selection

Each candidate solution is evaluated using the objective function. A greedy selection mechanism retains the better solution:
x i ( t + 1 ) = x i ( t + 1 ) , f x i ( t + 1 ) < f x i ( t ) x i ( t ) ,   otherwise  
The global best solution is updated accordingly.

3.2.7. Computational Complexity

The computational complexity of AB-APO per iteration is:
O N × D + N × C f
where Cf denotes the cost of objective function evaluation. The adaptive balance mechanism introduces negligible overhead, preserving scalability.

3.3. Fractional Calculus-Enhanced Artificial Protozoa Optimizer (FC-APO)

Fractional calculus has demonstrated a strong capability in modeling memory, hereditary properties, and long-range dependence in metaheuristic optimization approaches [47,48,49,50,51]. Motivated by these characteristics, the Artificial Protozoa Optimizer (APO) is extended in this work by incorporating fractional-order dynamics into the population update mechanism, thereby explicitly introducing fractional memory into the search process. The proposed FC-APO employs a Grünwald–Letnikov fractional-order operator [52,53] to embed weighted historical information from past positions into the evolutionary process of protozoan individuals. This memory-aware formulation enables smoother trajectory evolution, enhances long-memory effects, and improves the stability and consistency of protozoa-based resource-allocation behavior.

3.3.1. Fractional Memory Representation

To introduce memory, the FC-APO defines a fractional sequence of coefficients based on the Grünwald–Letnikov formulation. The generalized binomial coefficients c α ( k ) of fractional order α ∈ (0, 1] are expressed as:
c α ( 0 ) = 1 , c α ( k ) = α k + 1 k c α ( k 1 ) , k 1
and the corresponding weights become:
w α ( k ) = k c α ( k ) , k = 0,1 ,
Using these weights, the fractional memory state of each protozoa individual is defined as:
M i α ( t ) = k = 0 m i n ( t , K )   w α ( k ) y i ( t k ) ,
where K denotes the memory length. The effective, memory-augmented position is then computed by blending the current and historical states:
y ˆ i ( t ) = ( 1 λ ) y i ( t ) + λ M i α ( t ) ,
where λ ∈ [0, 1] regulates the contribution of fractional memory. When λ = 0, FC-APO reduces to the canonical APO.

3.3.2. Fractional Autotrophic Foraging Mode

In the original APO, autotrophic behavior given in Equation (31) drives protozoa toward favorable light conditions. In the FC-APO, this movement is governed not by the current position alone but by the fractional memory state. Accordingly, Equation (31) is reformulated as:
y i n e w ( t + 1 ) = y ˆ i ( t ) + f y j ( t ) y ˆ i ( t ) + 1 n p k = 1 n p     w a y k ( t ) y k + ( t ) × M f ,
where all variables retain their definitions from the canonical APO model.

3.3.3. Fractional Heterotrophic Mode

Similarly, the heterotrophic update rule is modified by replacing the current position y i ( t ) with its fractional counterpart y ˆ i ( t ) . The fractional near-position is expressed as:
y ˆ near   ( t ) = 1 ± R a n d 1 t T y ˆ i ( t ) ,
and the updated heterotrophic movement becomes:
y i new   ( t + 1 ) = y ˆ i ( t ) + f y ˆ near   ( t ) y ˆ i ( t ) + 1 n p k = 1 n p     w h y i k ( t ) y i + k ( t ) × M f .
Thus, the fractional operator enhances the exploitation capability by smoothing oscillations and emphasizing evolutionary trends within the search landscape.

3.3.4. State-Transition Strategy

The FC-APO retains the original dormant and reproductive modes of the APO. Only the movement dynamics (autotrophic and heterotrophic behaviors) are replaced by fractional variants. Thus, the transition rule remains:
y i new   ( t + 1 ) = Equation   ( 41 ) , r < p d r Equation   ( 42 ) , otherwise .
The greedy selection mechanism is also preserved:
y i ( t + 1 ) = y i new   ( t + 1 ) , f y i new   ( t + 1 ) < f y i ( t ) , y i ( t ) ,   otherwise   .

3.3.5. Impact of Fractional-Order Parameters (α, λ, and K)

In the proposed FC-APO framework, the fractional order α controls the degree of memory inheritance and directly influences the exploration–exploitation balance. Lower values of α emphasize long-memory effects, resulting in smoother search trajectories and enhanced global exploration, whereas higher values gradually approach integer-order behavior with faster but potentially less stable convergence. Accordingly, α was selected to achieve a balanced trade-off between convergence speed and numerical stability. The memory length K determines the number of past solution states contributing to the current update. Larger values of K strengthen long-range dependence and improve robustness against premature convergence, at the expense of increased computational effort. To maintain efficiency while preserving memory benefits, a moderate value of K was adopted in this study. The value of the blending factor λ controls the proportion of the current position increment to the weighted fractional contribution from the memory. The appropriate setting of λ makes it possible to integrate the memory influence smoothly into the optimization process without affecting the stability of the explorative dynamics. Empirical evidence shows that moderate settings of λ result in enhanced convergence smoothness and solution quality independence of the DER penetration levels. The impact of α, λ and K reinforces the convergence stability and robustness of the FC-APO over its integer-order alternatives, thus confirming the usefulness of the fractional-order model in multi-DER planning optimization problems.

3.3.6. Theoretical Interpretation of Fractional-Order Dynamics in FC-APO

From a theoretical perspective, the improved performance of the FC-APO stems from fundamental properties of fractional-order dynamical systems, particularly long-range dependence and nonlocality. The current state of the fractional-order dynamical systems is weighted in such a way that it is dependent on the previous states, thus possessing the property of memory. The use of memory in the FC-APO algorithm increases the exploration vs. exploitation trade-off, maintaining diversity during the early stages of iteration and gradually increasing the rate of exploitation as the iterations progress. Such behavior is consistent with fractional gradient-like optimization methods, where fractional derivatives are known to improve numerical smoothness and convergence stability. Consequently, the fractional-order dynamics in the FC-APO provide a principled theoretical explanation for the observed improvements in convergence robustness and solution consistency.
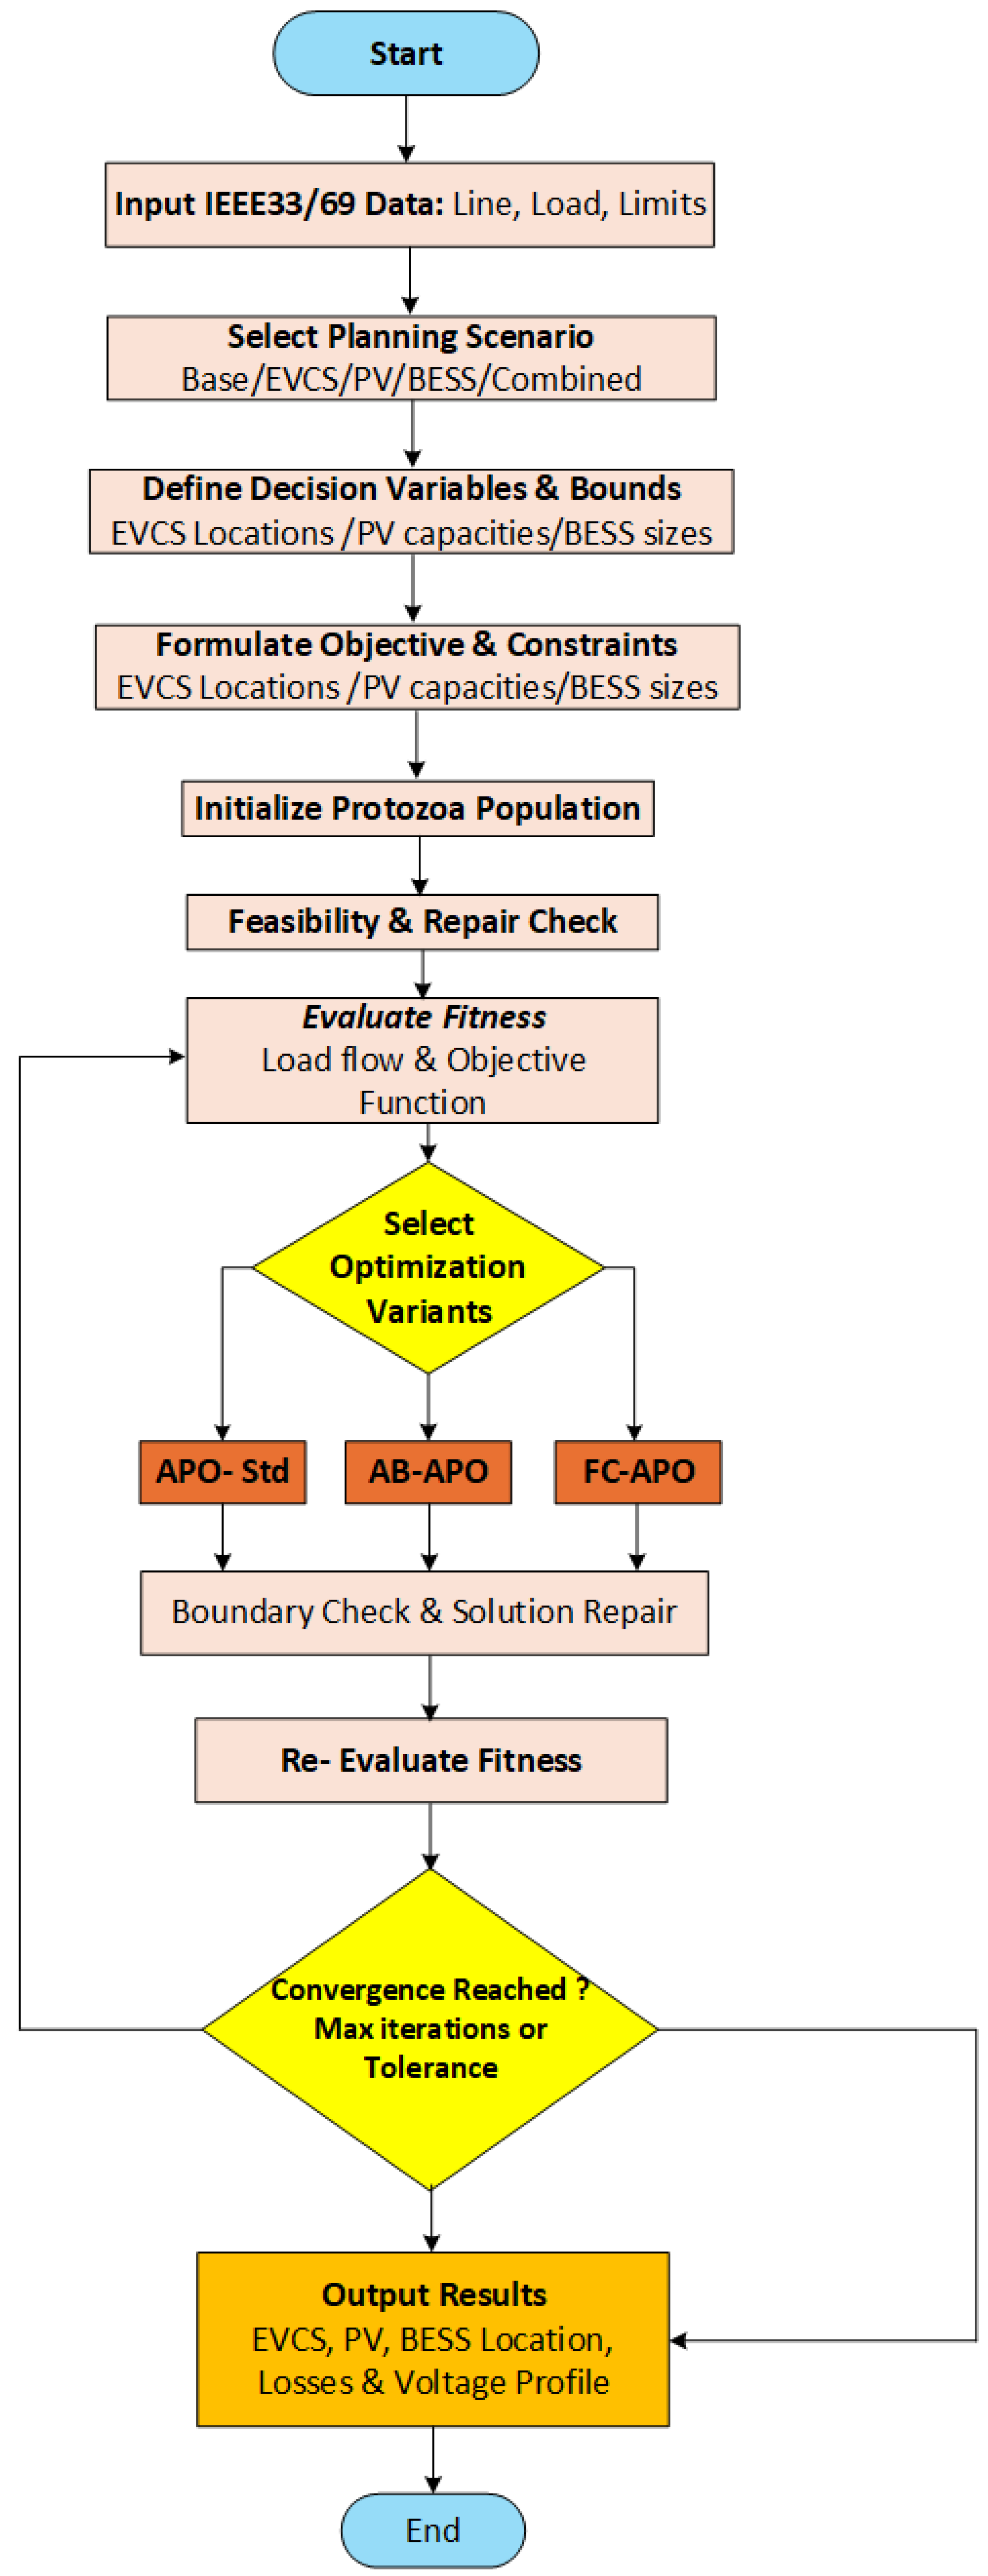
The working methodology of the proposed variants, as shown in Figure 2, demonstrates the stepwise procedure for solving the optimal allocation of multiple DERs.

4. Results and Discussion

To assess the performance and effectiveness of the proposed FC-APO method, comprehensive simulations are conducted on the IEEE-33 and IEEE-69 RDSs (RDS). To accurately capture the operational impact of electric EVs, PV units, and BESSs (BESS), eight distinct case studies are formulated as follows: The proposed APO variants are suitable for real-time multi-DER planning in smart radial distribution networks, with real power loss evaluation as the core optimized system KPI. All simulations were conducted using MATLAB R2025b, ensuring implementation validity in a recent and widely used power system optimization environment.
  • Case 1: Base system configuration (no EVCSs, no PV, no BESS).
  • Case 2: EV-only scenario (three EVCS units, no PV, no BESS).
  • Case 3: PV-only scenario (two PV units, no EVCSs, no BESS).
  • Case 4: BESS-only scenario (one BESS unit, no EVCSs, no PV).
  • Case 5: Combined EV and PV scenario (three EVCS units, two PV units, no BESS).
  • Case 6: Combined EV and BESS scenario (three EVCS units, one BESS unit; no PV).
  • Case 7: Combined PV and BESS scenario (two PV units, one BESS unit, no EVCSs).
  • Case 8: Integrated EV–PV–BESS scenario (three EVCSs units, two PV units, and one BESS unit).

4.1. IEEE-33 RDS Results

In this study, simulations are performed on the IEEE-33 bus RDS (RDS), illustrated in Figure 3. Detailed specifications of the network can be found in [54,55,56]. The benchmark system consists of 33 buses and 32 distribution feeders, operating at a nominal voltage level of 12.66 kV and a base power of 100 MVA. The aggregated system loading comprises 3715 kW of active power demand and 2300 kVar of reactive power demand.
For performing a direct load flow study, the steady-state voltage profile along with the power loss associated with it will be determined. The initial study indicates that the amount of active power lost in the system is 202.303 kW along with a reactive power loss of 134.641 kVar. The minimum voltage in the system is identified in bus 18 as 0.91337 p.u., while the maximum voltage in the system appears in bus 1 measured as 1 p.u. The voltage deviation in the system will be 11.640. Analysis of the EVCSs’ location in the IEEE-33 bus distribution network indicates a trade-off between the need to deploy these facilities to address increasing charging demand and the fact that this increases system losses to some extent. To mitigate such negative aspects, the location of PV plants and battery energy storage facilities can work to compensate for such increased losses and hence enhance overall voltage stability.
Table 1 presents a comparative performance assessment of the APO-Std, AB-APO, and FC-APO for the optimal allocation of EVCSs, PV units, and BESSs under eight planning scenarios for the IEEE-33 radial distribution system. In Scenario 1 (base case), all three algorithms yield identical results, as no decision variables are involved, which confirms the correctness of the modeling and simulation framework. In Scenario 2 (EVCS only), real and reactive power losses increase, and the minimum bus voltage deteriorates due to concentrated charging demand; all algorithms produce comparable solutions, indicating limited flexibility in loss mitigation without supportive DERs.
The introduction of PV units (Scenario 3) leads to a substantial reduction in both active and reactive power losses and improves voltage profiles. In this case, the AB-APO and FC-APO provide marginal improvements over the APO-Std, reflected by slightly lower voltage deviation and Q-loss values, demonstrating enhanced search efficiency when renewable generation is introduced. In Scenario 4 (BESS only), all algorithms achieve nearly identical solutions, as the optimization dimensionality remains low and storage placement alone provides limited degrees of freedom. Performance differences become more evident in combined DER scenarios. In Scenario 5 (EVCS + PV), the AB-APO and FC-APO consistently achieve lower losses and improved voltage deviation compared to the APO-Std through more effective coordination of EV charging demand and local generation. In Scenario 6 (EVCS + BESS), the FC-APO yields slightly lower real and reactive power losses than the APO-Std, attributed to the improved placement of storage units providing local active power support under discharging operation. The most notable improvements are observed in Scenarios 7 (PV + BESS) and 8 (EVCS + PV + BESS). Scenario 7 achieves the lowest real (77.35 kW) and reactive (54.9978 kVAr) losses with the FC-APO, along with the smallest voltage deviation (VD = 0.1290), indicating highly uniform voltage profiles across the feeder. In Scenario 8, joint deployment of all DERs further mitigates EV-induced stress; the FC-APO again attains the lowest loss values and voltage deviation among the compared methods, confirming its effectiveness under a highly coupled, DER-rich planning condition. Figure 4a,b illustrate the corresponding voltage profiles. The base and EVCS-only cases exhibit pronounced downstream voltage drops, with the minimum voltage occurring at bus 18, consistent with feeder topology and load concentration. Scenarios 3–8 demonstrate progressive voltage recovery, with Scenario 7 (PV + BESS) achieving the closest voltage levels to 1 p.u across most buses, while Scenario 8 remains slightly lower due to residual EVCS loading.
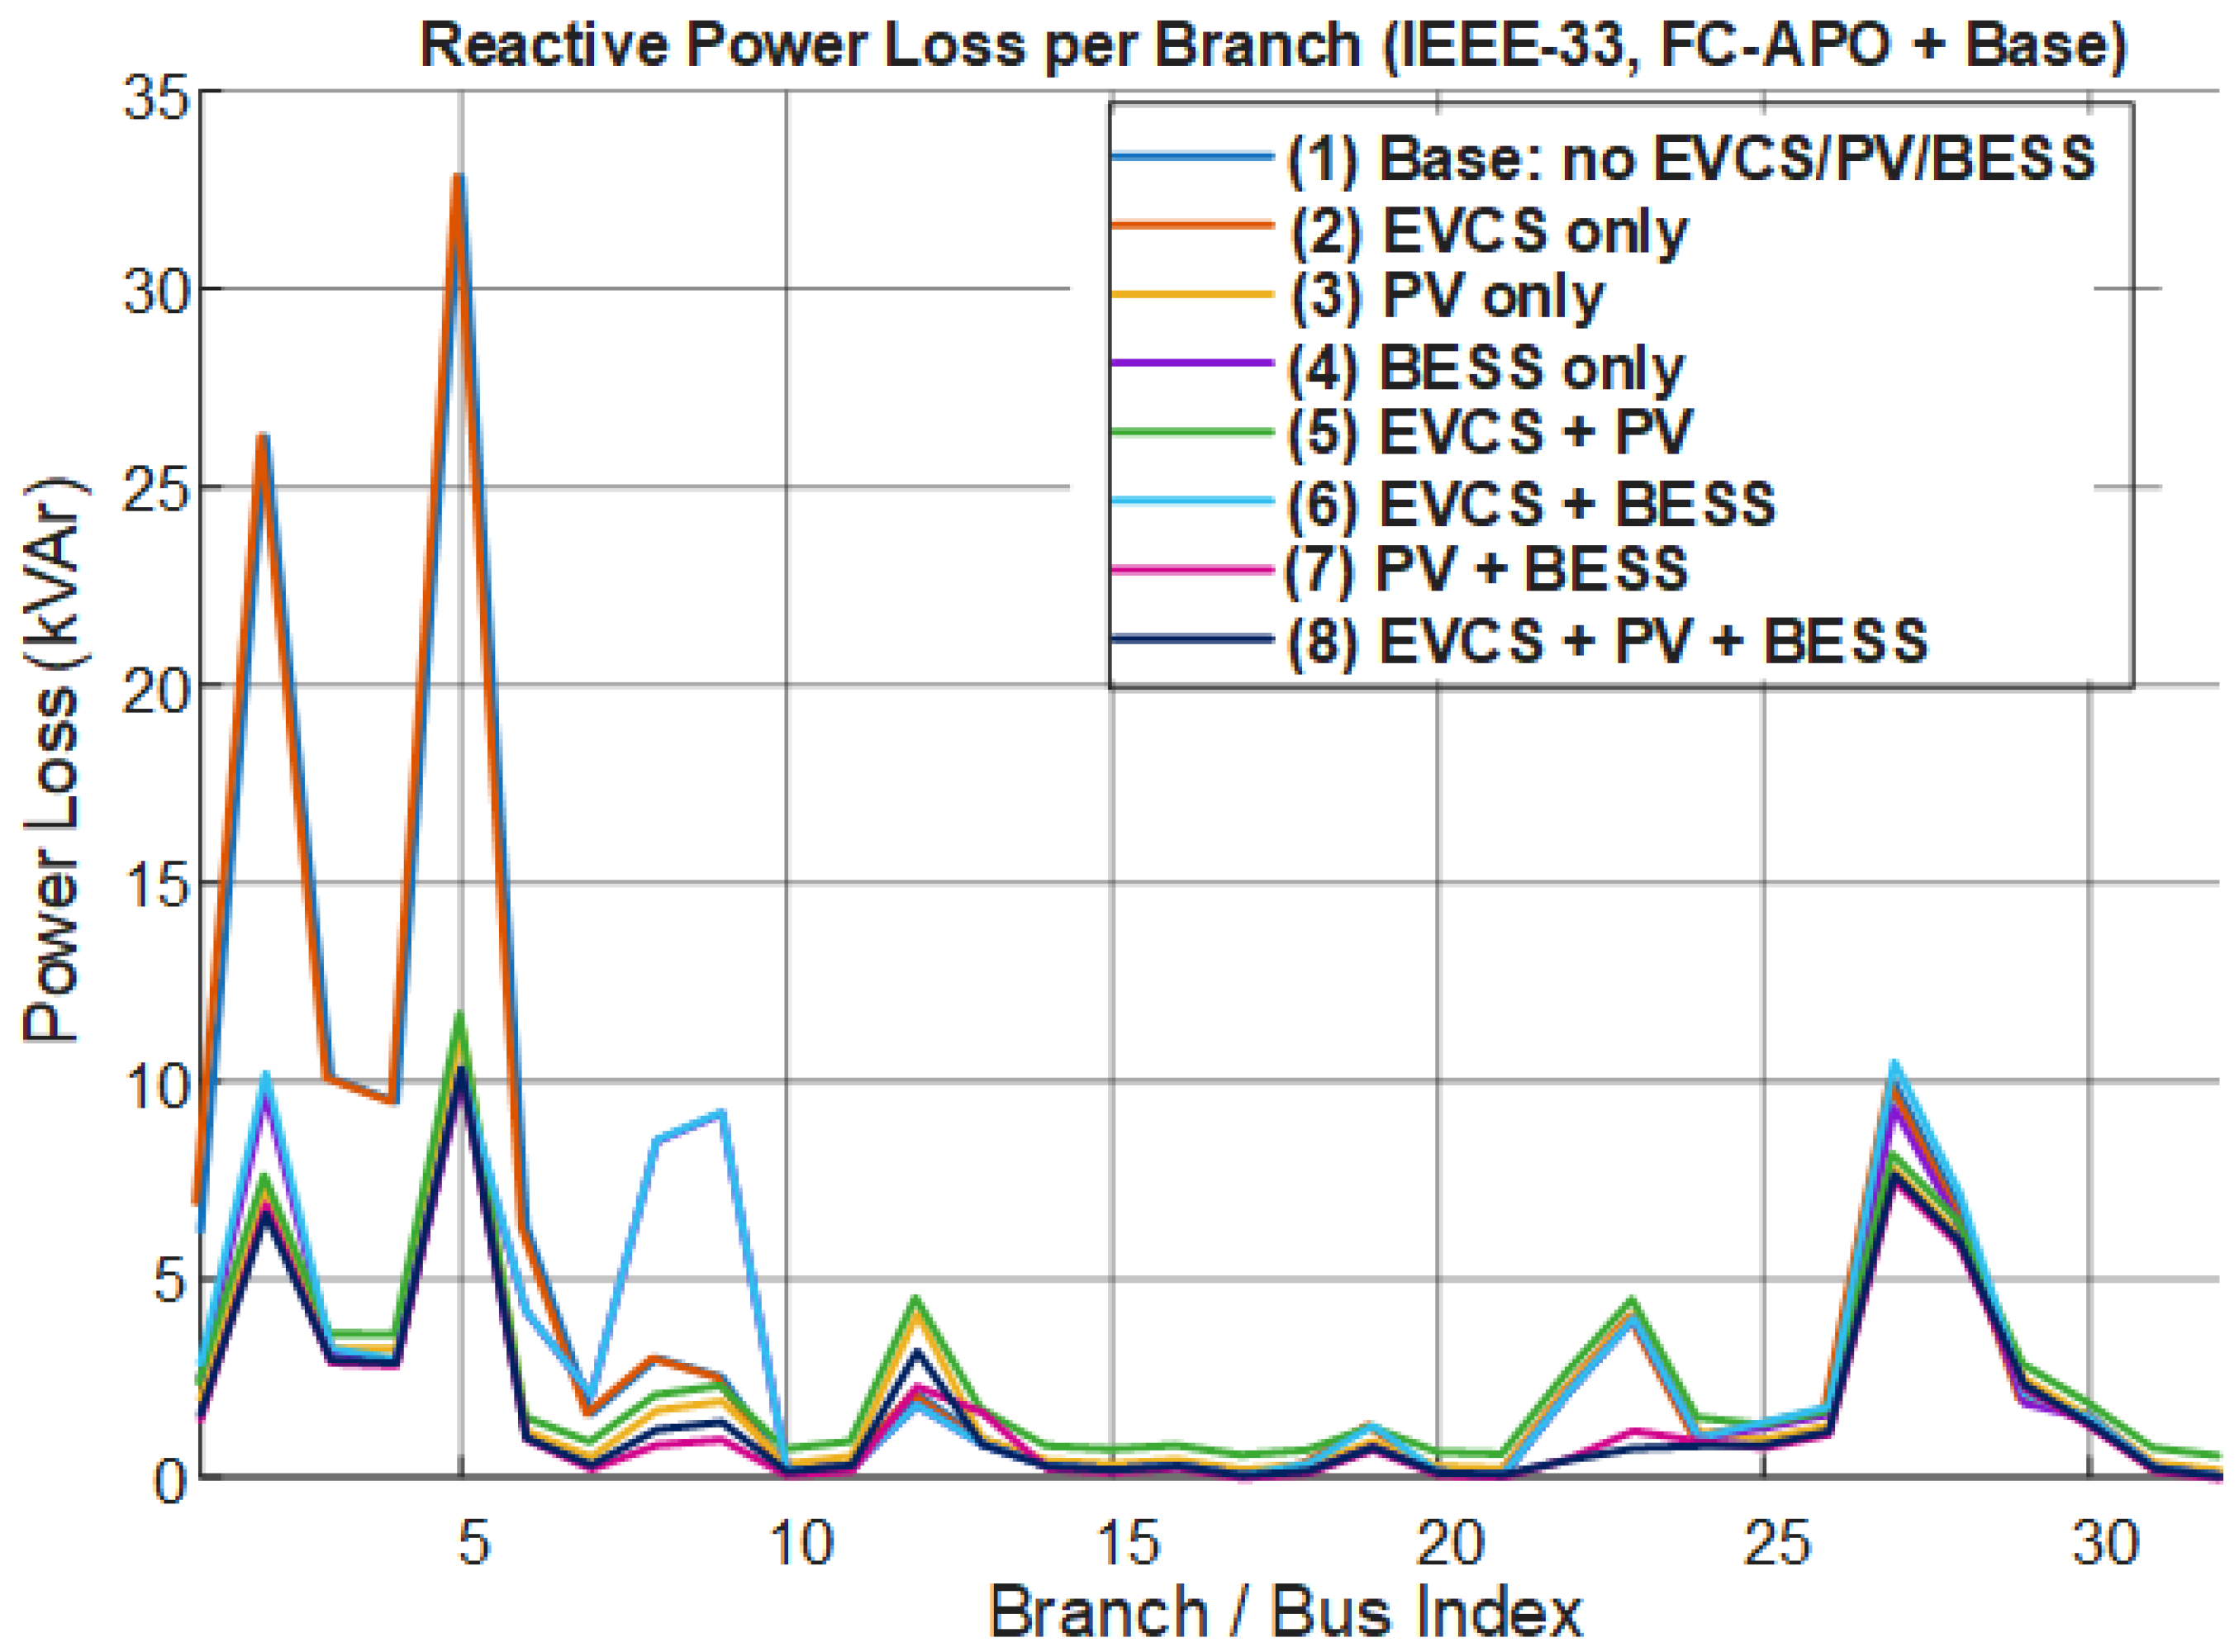
Figure 5 and Figure 6 show branch-wise real and reactive power losses obtained using the FC-APO. The highest losses occur in upstream branches (1–6) for the base and EVCS-only cases due to elevated current flow. Reactive power dissipation refers to I2X losses associated with inductive loading and voltage support requirements. The inclusion of PV and the BESS reduces both P-loss and Q-loss by lowering branch currents and improving local power balance, with the lowest losses observed in Scenarios 7 and 8.
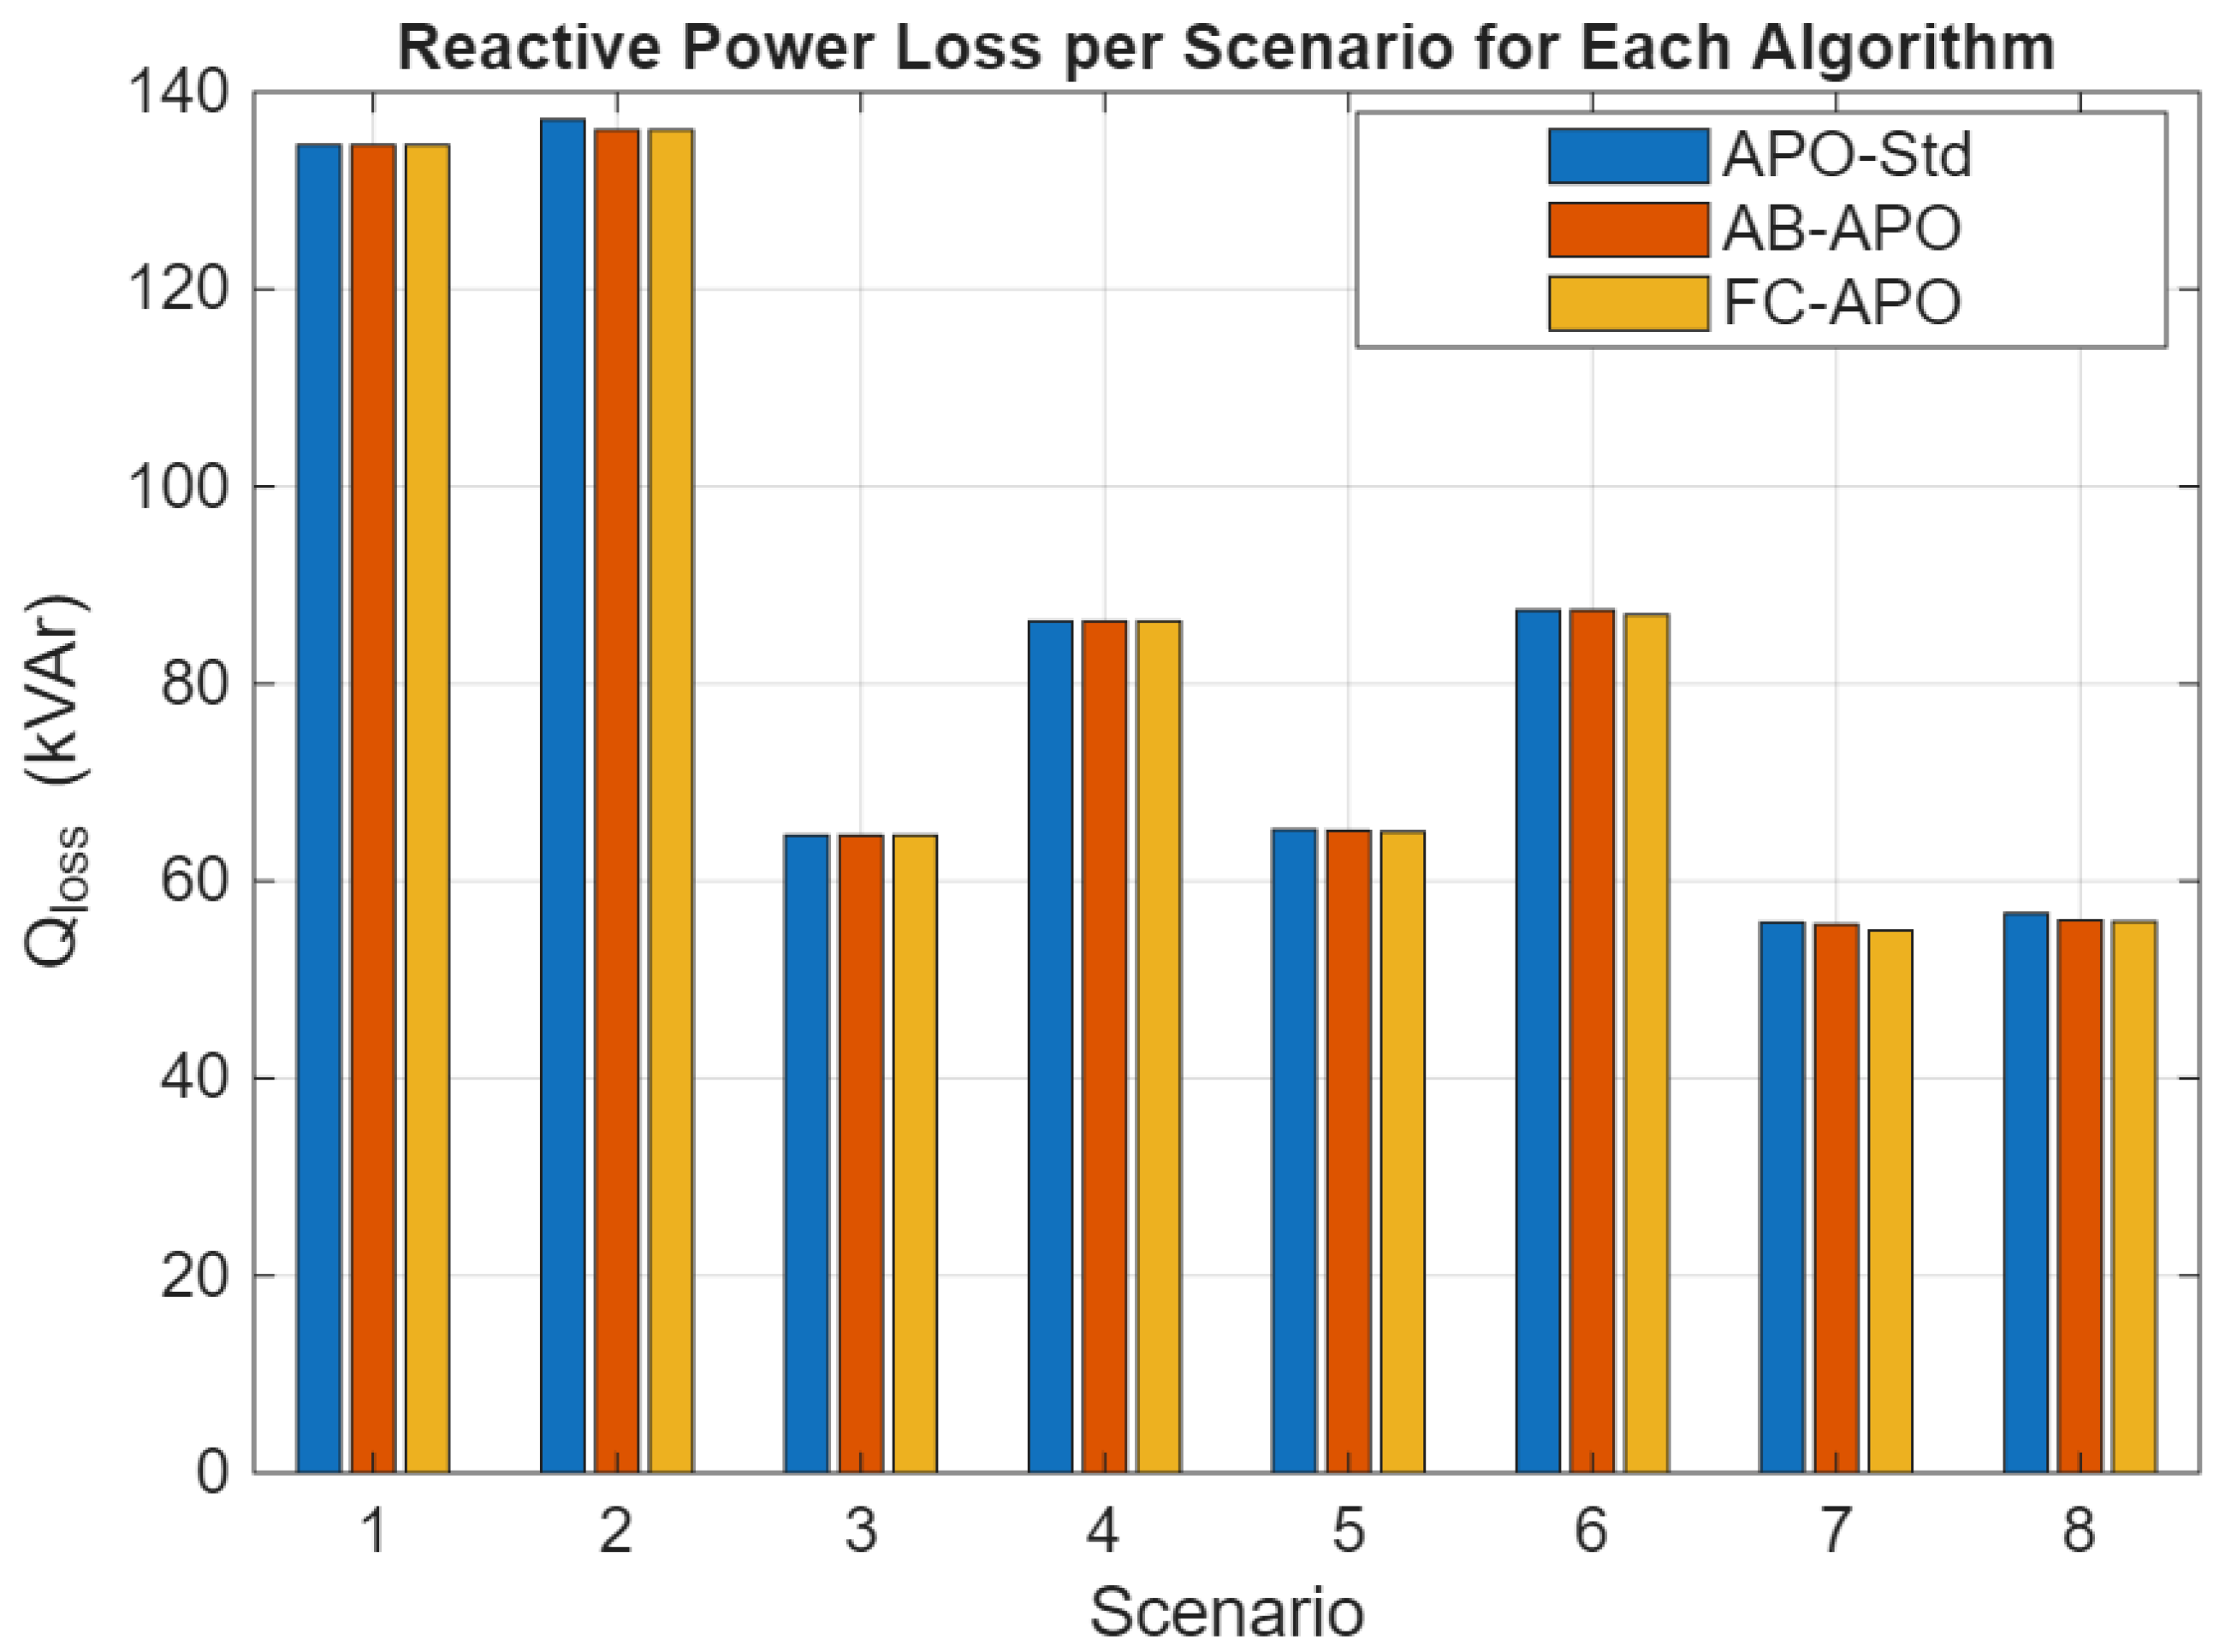
Finally, Figure 7 and Figure 8 compare algorithmic performance across scenarios. While the APO-Std remains competitive in low-dimensional cases, the AB-APO and FC-APO consistently achieve lower losses and voltage deviation in DER-rich scenarios. The adaptive balancing mechanism and fractional-order memory enable more efficient utilization of search history and population dynamics, yielding improved robustness and solution quality under complex, multi-asset planning conditions.
The convergence characteristics of the APO-Std, AB-APO, and FC-APO across Scenarios 2–8, illustrated in Figure 9a–g, demonstrate the effectiveness of the proposed enhancements. These convergence characteristics indicate that for relatively simpler planning scenarios (Scenarios 2–6) as shown in Figure 9a–e, all algorithms reach stable objective values at early stages of the search process. In these cases, the AB-APO and FC-APO typically converge within approximately 30–50 iterations, while the APO-Std stabilizes within about 50–80 iterations, with no noticeable improvement thereafter up to 1000 iterations. For Scenario 7 (PV + BESS), as shown in Figure 9f convergence is comparatively slower due to increased coupling between DERs; the APO-Std exhibits gradual, stepwise improvement and stabilizes around 500–600 iterations, whereas the AB-APO and FC-APO converge earlier within approximately 150–250 iterations. Scenario 8 (EVCS + PV + BESS), as shown in Figure 9g representing the most complex DER-rich configuration, requires a higher number of iterations for all methods, with the AB-APO and FC-APO stabilizing around 200–300 iterations and the APO-Std converging later, typically within 400–600 iterations. These results reflect the increased problem complexity rather than convergence inefficiency, consistent with planning-stage optimization objectives.
The addition of adaptive balancing and fractional-order memory enhances the search stability and improves the convergence speed in both single DERs and multi-DER environments. While the APO-Std shows slower progress and higher residual objective values in complex scenarios, the proposed variants maintain consistent convergence behavior, highlighting their robustness in handling increased DER interactions and system constraints. Overall, the results confirm that the enhanced APO variants achieve faster and more reliable convergence than the conventional APO across diverse operating conditions.

4.2. IEEE-69 RDS Results

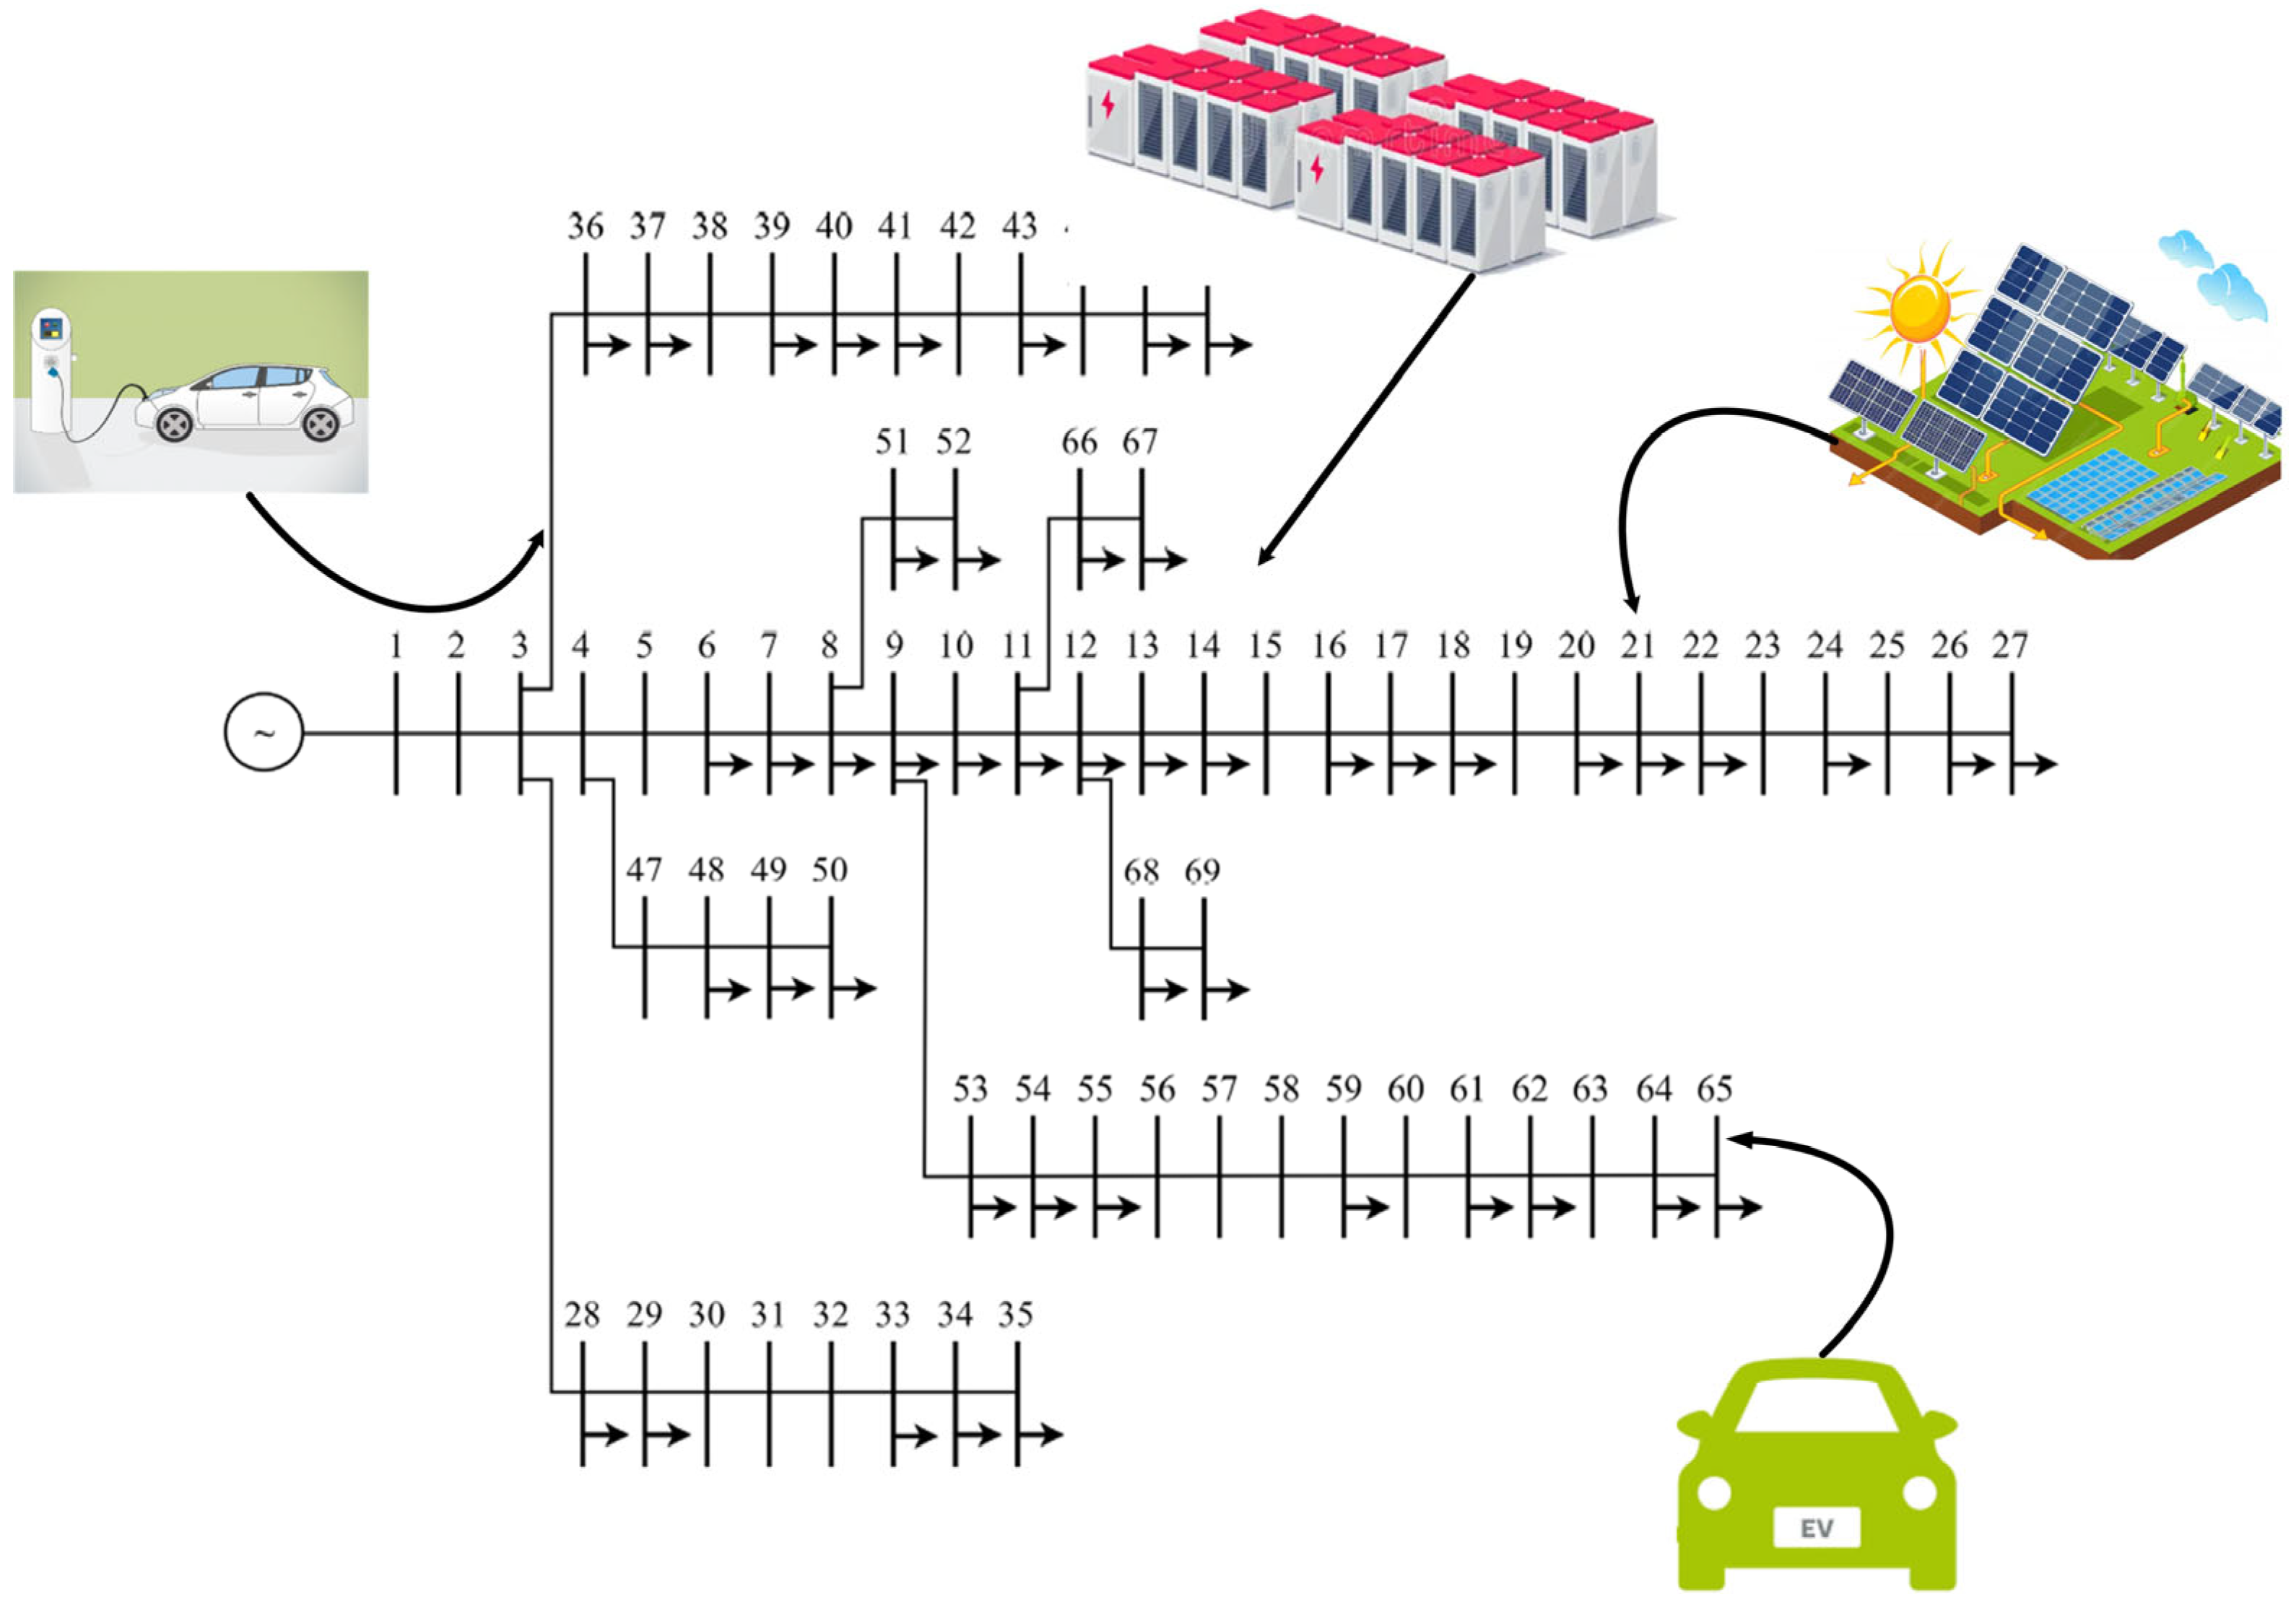
To further validate the robustness and scalability of the proposed optimization framework, the developed approach is also applied to the more complex IEEE-69 RDS. The single-line diagram of the network is depicted in Figure 10, while the corresponding value of lines and loads represented by a total of 69 buses with 68 branches is taken from the standard benchmark case reported in [56]. A base case study is first performed employing a traditional BFS-based solution approach for solving the load flow analysis. Indeed, the results show total active and reactive power loss of 224.553 kW and 102.01 kVAr, respectively. It can be observed that the voltage magnitude decreases from 1.0 p.u at the reference bus (bus 1) to a minimum value of 0.9102 p.u. at bus 65, resulting in a voltage deviation index of 9.762. These reference base case results offer a benchmark for evaluating the performance of the APO-Std, AB-APO, and FC-APO for the same eight scenarios of operation as already examined for the IEEE-33 bus system. Clearly, the isolated integration of EVCSs would further increase the loading of branches and voltage drops on the feeder. To counteract these negative effects, it is essential to deploy the above-specified optimization framework for identifying, through optimization, the coordinated allocation of EVCSs and DER units. The coordinated allocation obtained through the optimization process effectively offsets the additional charging demand, leading to noticeable improvements in voltage profile and significant reductions in both real and reactive power loss values compared with their corresponding values for the base case and EVCSs-only. Table 2 lists the performance comparisons of the APO-Std, AB-APO, and FC-APO for making coordinated allocations of EVCSs, PV, and BESS units in the IEEE-69 radial distribution system under eight planning scenarios.
Scenario 1 (base case): All three algorithms produce an equal outcome, which shows real and reactive power losses of 224.553 kW and 102.01 kVAr, minimum voltage of 0.9102 p.u., and a voltage deviation index of 9.762. This confirms the consistency of the simulation framework in the absence of optimization variables. Scenario 2 (EVCS only): Due to the introduction of charging stations, the stress condition results in an increase in system losses of around 228 kW and sustains the minimum voltage of 0.9000 p.u. Although the AB-APO and FC-APO achieve marginally lower losses than the APO-Std, the overall deterioration highlights that EVCS integration without supporting DERs adversely impacts large radial feeders.
A marked improvement is also noticed when DER units are connected. In the PV system alone (Scenario 3), the value of actual power loss is reduced to around 80 kW, reactive loss decreases to less than 38.1 kVAr, and the value of the voltage deviation index reduces to around 0.372 units. Such improvements are also observed in the case of the BESS alone (Scenario 4) confirming the effectiveness of storage in enhancing voltage, although gains are slightly less pronounced than with PV integration. The addition of hybrid systems to the existing framework results in further improvement. In Scenarios 5 and 6 (EVCS + PV and EVCS + BESS), the adverse effect caused by EV charging is reduced considerably, and the real power losses are reduced to the range of 80–82 kW, with better voltage profiles compared to Scenario 2. Among these, the AB-APO and FC-APO always perform better in terms of power losses compared to the APO-Std, indicating better coordination in terms of DER placements and sizing. The combination scheme of PV + BESS (Scenario 7) depicted one of the best results, where real power losses are reduced to about 73.4 kW, and the minimum bus voltage is settled within a range close to 0.993 p.u., along with a low value for the voltage deviation index, about 0.30. This scenario highlights the complementary interaction between distributed generation and storage in relieving feeder loading.
In the most complex case, Scenario 8 (EVCS + PV + BESS), the system maintains similarly low losses (≈74 kW) and stable voltage profiles despite the presence of EV charging demand. The AB-APO and FC-APO again outperform the APO-Std, achieving the lowest combined real and reactive losses and improved voltage deviation indices, confirming their effectiveness in DER-rich planning environments. Overall, the IEEE-69 results demonstrate that coordinated multi-DER deployment significantly enhances loss reduction and voltage stability, particularly under high EVCS penetration. Across most DER-rich scenarios, the AB-APO and FC-APO consistently outperform the APO-Std, validating the benefits of adaptive balancing and fractional-order memory in large-scale distribution network optimization.
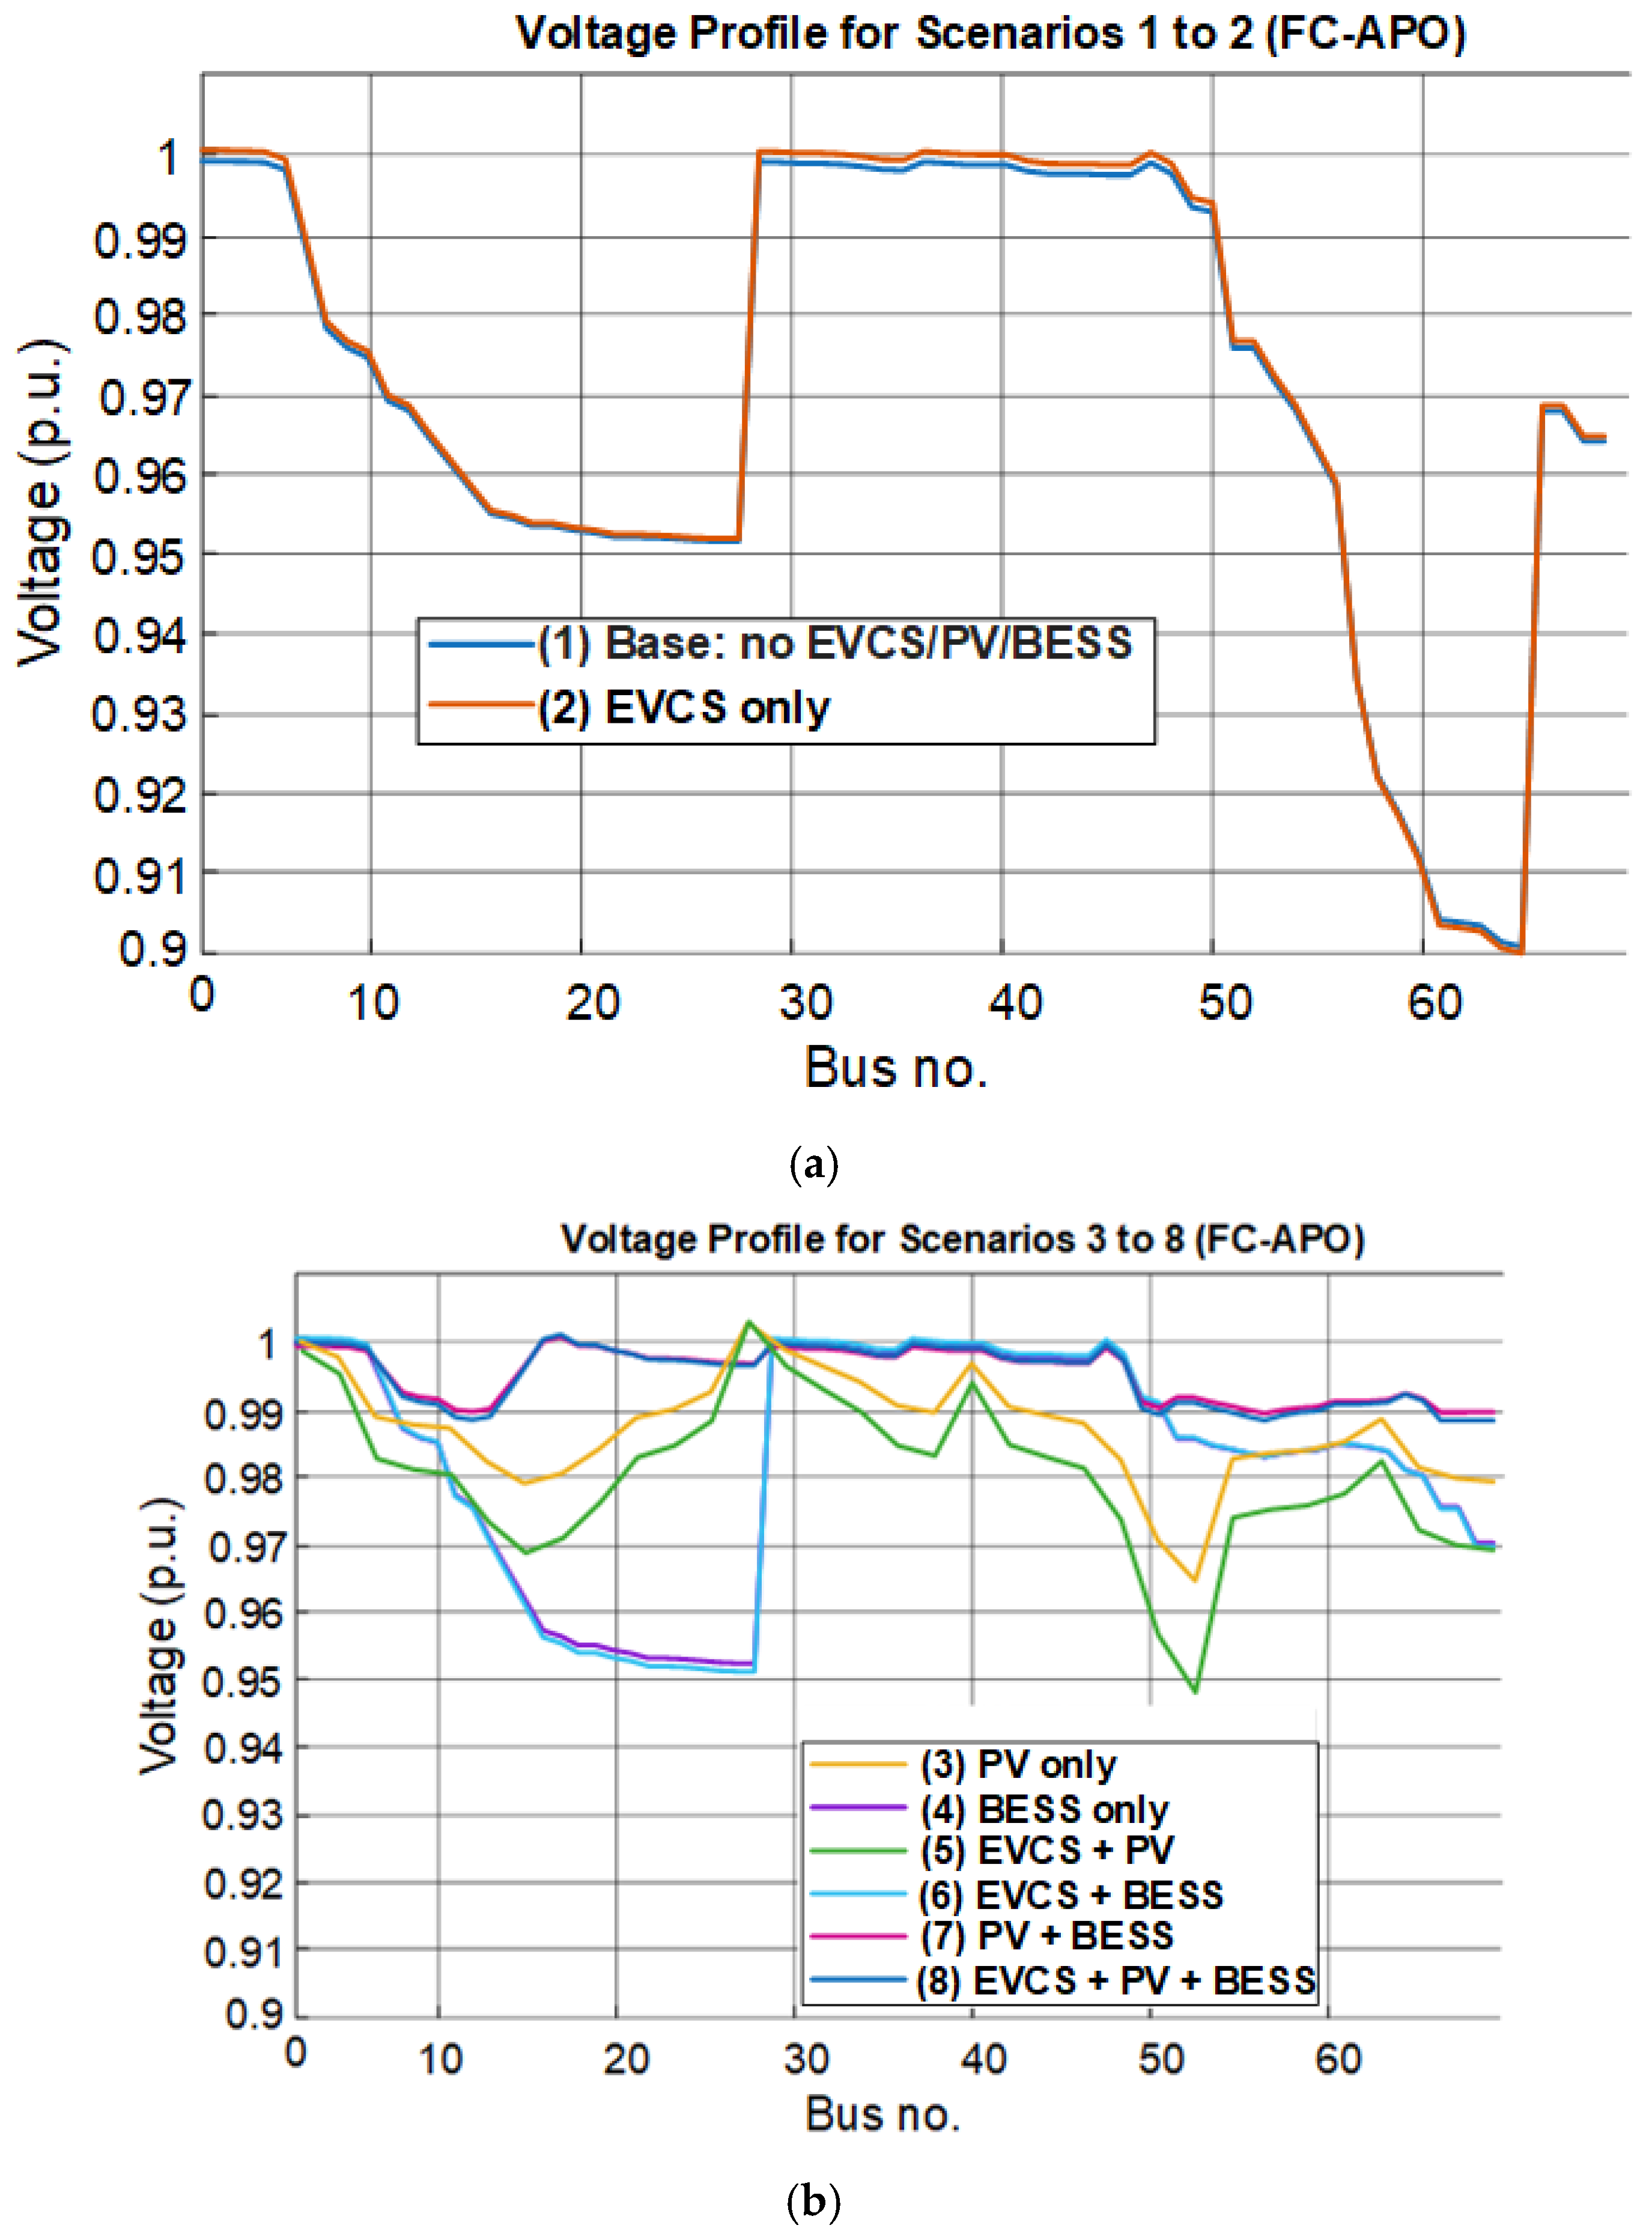
Figure 11 represents the voltage profile for the IEEE-69 bus distribution network under eight operating conditions created by the FC-APO variant. In the base case, a pronounced voltage sag is observed along the long radial feeder, particularly at the distant buses, as illustrated in Figure 11a. Scenarios 3–8 demonstrate progressive voltage recovery, with Scenario 7 (PV + BESS) achieving the closest voltage levels to 1 p.u. across most buses, while Scenario 8 remains slightly lower due to residual EVCS loading as shown in Figure 11b. Overall, the results confirm that coordinated DER placement identified by the FC-APO framework effectively mitigates EV impacts and significantly enhances voltage stability in the IEEE-69 distribution network.
Figure 12 and Figure 13 depict the real and reactive power loss distribution along the branches of the IEEE-69 radial feeder under eight operating scenarios. The base case and EVCS-only scenario exhibit the highest losses, with pronounced peaks in heavily loaded upstream and downstream branches, reflecting the adverse impact of uncoordinated EV charging on branch currents.
Scenario 3 and Scenario 4’s integration of individual PV units and BESSs significantly cuts down both the real and reactive losses due to the support of localized power and the relieving of feeder loading. This effect is further enhanced by the combined DER configurations: EVCSs + PV and EVCSs + BESSs are proven to be quite effective in mitigating EV-induced losses, especially in the mid- and downstream branches, whereas the PV + BESSs case shows a consistently low level of losses throughout the network.
Overall, the results confirm that optimized DER deployment significantly reduces power dissipation and improves operational efficiency in the IEEE-69 distribution system, especially under high EVCS penetration conditions. Figure 14 and Figure 15 compare the active and reactive power losses obtained by the APO-Std, AB-APO, and FC-APO across eight operational scenarios for the IEEE-69 radial distribution network. In the base case and EVCS-only scenario (Scenarios 1 and 2), all three algorithms yield identical or nearly identical loss values, as no distributed energy resources are present to influence power flow characteristics; this confirms the consistency of the optimization framework.
When DERs are introduced, performance differences become more evident. In the PV-only scenario (Scenario 3), both the AB-APO and FC-APO achieve lower real and reactive power losses than the APO-Std, indicating its superior capability in exploiting local generation benefits. A similar trend is observed in the BESS-only scenario (Scenario 4), where all algorithms achieve comparable improvements, reflecting the relatively low problem dimensionality.
In combined DER scenarios (Scenarios 5–8), the advantages of the enhanced variants become more pronounced. For EVCSs + PV and EVCSs + BESS configurations (Scenarios 5 and 6), the AB-APO and FC-APO consistently yield lower losses than the APO-Std by more effectively coordinating DER placement and sizing. The PV + BESS scenario (Scenario 7) achieves among the lowest loss levels overall, with both enhanced variants outperforming the standard APO. In the fully integrated EVCSs + PV + BESS case (Scenario 8), the AB-APO and FC-APO again deliver the minimum real and reactive power losses, demonstrating their robustness under high-complexity, DER-rich operating conditions. The convergence characteristics of the APO-Std, AB-APO, and FC-APO for the IEEE-69 distribution network under Scenarios 2–8 is illustrated in Figure 16a–g. In the simpler operating conditions, namely EVCS-only, PV-only, BESS-only, EVCS + PV, and EVCS + BESS (Figure 16a–e), all algorithms converge rapidly, with the AB-APO and FC-APO typically stabilizing within approximately 30–60 iterations, while the APO-Std requires around 60–100 iterations to reach similar objective values.
In the more complex DER-coupled scenarios, namely PV + BESS (Figure 16f) and EVCS + PV + BESS (Figure 16g), the convergence process becomes slower due to stronger interactions among distributed resources. In these cases, the APO-Std exhibits a stepwise convergence pattern and stabilizes after approximately 400–600 iterations, whereas the AB-APO and FC-APO converge earlier, typically within 150–300 iterations. These results confirm that the proposed adaptive balancing and fractional-order memory mechanisms enhance convergence speed and stability, particularly under highly coupled, DER-rich planning scenarios.
The incorporation of adaptive balancing and fractional-order memory functions not only promotes the stability of the search process but also leads to faster convergence, even for single and multi-DER systems. In contrast, the normal APO has a slower convergence rate for the more complicated systems. The proposed modifications show excellent robustness performance with respect to the increased number of DER interactions and network constraints with a consistent convergence process. The experiment results show that the improved APO variants achieve a quicker convergence process.

5. Conclusions

In this work, an integrated multi-DER planning framework using an APO-Std and two enhanced variants, the AB-APO and FC-APO, was proposed to optimize the allocation of EV charging stations, PV installations, and BESS units in radial distribution networks. The framework was validated on the IEEE-33 and IEEE-69 bus systems under eight representative operating scenarios. The results confirm that uncoordinated EVCS integration increases network losses and voltage deviations, while optimally allocated PV and BESS units provide meaningful improvement in voltage regulation and real/reactive power loss reduction. Real power loss reductions of up to 61.68% in the IEEE-33 system and 67.31% in the IEEE-69 system were achieved under DER-rich operating scenarios, with corresponding improvements in minimum bus voltage and voltage deviation indices across all tested cases. In this study, DER units were modeled under fixed operating power factor assumptions appropriate for planning-level analysis. Although the proposed methods show strong performance, a key limitation is that the study focuses on radial test systems and does not yet extend to meshed or large-scale real-world feeders, where additional operational constraints may influence performance. In addition, comparative benchmarking is limited to APO-based variants, as the lack of directly comparable fractional-order or memory-enhanced metaheuristics for the considered multi-DER planning problem restricts fair cross-algorithm evaluation. Furthermore, hardware-in-the-loop (HIL) validation was not conducted in this phase, and real-time field deployment is deferred to future work. To address these aspects, future research will pursue: (i) extension of the optimizers to larger IEEE-69+ scale and utility feeders, (ii) integration of probabilistic and temporal DER demand models, and (iii) experimental validation using HIL platforms compatible with MATLAB R2025b for real-time planning assessment. Additional work will also explore advanced benchmarking with well-established metaheuristics to further expose scalability and performance differentiation. Overall, the enhanced APO variants provide a reliable optimization pathway for joint DER-rich planning, offering improved loss minimization and voltage stability support for future electrified distribution grids.

Author Contributions

Conceptualization and methodology were performed by A.W., B.M.K., H.A., B.S.K., H.P., and B.O.K. Investigation was performed by A.W., B.M.K., H.A., and B.S.K. Formal analysis, data curation, resources, and software development were performed by A.W., B.M.K., H.A., and B.S.K. Validation was performed by A.W., B.M.K., H.A., B.S.K., H.P., and B.O.K. Visualization was performed by A.W. and H.A. Funding acquisition and project administration were performed by H.P. and B.O.K. Writing—original draft was performed by A.W., B.M.K., H.A., and B.S.K. Writing—review and editing was performed by all authors (A.W., B.M.K., H.A., B.S.K., H.P., and B.O.K.). All authors have read and agreed to the published version of the manuscript.

Funding

This research received no external funding.

Data Availability Statement

The original contributions presented in this study are included in the article. Further inquiries can be directed to the corresponding author.

Conflicts of Interest

The authors declare no conflicts of interest.

Nomenclature

APOArtificial Protozoa Optimizer
AB-APOAdaptive Balanced Artificial Protozoa Optimizer
FC-APOFractional calculus enhanced Artificial Protozoa Optimizer
DERsDistributed Energy Resources
MDERsMulti-distributed energy resources
EVCSsElectric vehicle charging stations
PVPhotovoltaic
BESSBattery Energy Storage System
Electric VehicleEV
FCFractional calculus
BOSbalance-of-system
GHGGreenhouse Gases
KPIskey performance indicators
VDVoltage deviation
PSOParticle Swarm Optimization
MILPMixed integer linear programming
EMSEnergy Management System
PBESPower balanced electricity system
GAGenetic algorithm
V2HVehicle-to-Home
H2GHome-to-Grid
VISvirtual inertia support
QCSHOQuasi-Oppositional Chaotic Selfish-herd Optimization
CPFContinuation power flow
Yadmittance
PActive Power
QReactive Power
DCDirect current
ACAlternating current
SOCState of charge
DODDepth of discharge
NOCTNominal operating cell temperature
HBFtTime dependent scaling factor
RDSRadial Distribution System
DNDistributed network
NEVNumber of electric vehicles
NPVNumber of photovoltaic
NBESSNumber of battery energy storage system

References

  1. Krauter, S. Simple and effective methods to match photovoltaic power generation to the grid load profile for a PV based energy system. Sol. Energy 2018, 159, 768–776. [Google Scholar] [CrossRef]
  2. Reiman, A.P.; Somani, A.; Alam, M.J.E.; Wang, P.; Wu, D.; Kalsi, K. Power factor correction in feeders with distributed photovoltaics using residential appliances as virtual batteries. IEEE Access 2019, 7, 99115–99122. [Google Scholar] [CrossRef]
  3. Khalid, M. Discussion on “Short-Term Reactive Power Planning to Minimize Cost of Energy Losses Considering PV Systems”. IEEE Trans. Smart Grid 2020, 11, 1812. [Google Scholar] [CrossRef]
  4. Ashtiani, M.Z. Challenges in Incorporating Electric Vehicles to Mitigate Greenhouse Gas Emissions. Preprints 2020. [Google Scholar] [CrossRef]
  5. Chen, Z.; Carrel, A.L.; Gore, C.; Shi, W. Environmental and economic impact of electric vehicle adoption in the US. Environ. Res. Lett. 2021, 16, 045011. [Google Scholar] [CrossRef]
  6. Hawkins, T.R.; Singh, B.; Majeau-Bettez, G.; Strømman, A.H. Comparative environmental life cycle assessment of conventional and electric vehicles. J. Ind. Ecol. 2013, 17, 53–64. [Google Scholar] [CrossRef]
  7. Nour, M.; Chaves-Ávila, J.P.; Magdy, G.; Sánchez-Miralles, Á. Review of positive and negative impacts of electric vehicles charging on electric power systems. Energies 2020, 13, 4675. [Google Scholar] [CrossRef]
  8. Wang, J.; Bharati, G.R.; Paudyal, S.; Ceylan, O.; Bhattarai, B.P.; Myers, K.S. Coordinated electric vehicle charging with reactive power support to distribution grids. IEEE Trans. Ind. Inform. 2018, 15, 54–63. [Google Scholar] [CrossRef]
  9. Pradhan, P.; Ahmad, I.; Habibi, D.; Kothapalli, G.; Masoum, M.A.S. Reducing the Impacts of Electric Vehicle Charging on Power Distribution Transformers. IEEE Access 2020, 8, 210183–210193. [Google Scholar] [CrossRef]
  10. Ahmadi, B.; Ceylan, O.; Ozdemir, A. Distributed energy resource allocation using multi-objective grasshopper optimization algorithm. Electr. Power Syst. Res. 2021, 201, 107564. [Google Scholar] [CrossRef]
  11. Pal, A.; Bhattacharya, A.; Chakraborty, A.K. Allocation of electric vehicle charging station considering uncertainties. Sustain. Energy Grids Netw. 2021, 25, 100422. [Google Scholar] [CrossRef]
  12. Zhang, Y.; Zhang, Q.; Farnoosh, A.; Chen, S.; Li, Y. GIS-based multi-objective particle swarm optimization of charging stations for electric vehicles. Energy 2019, 169, 844–853. [Google Scholar] [CrossRef]
  13. Liu, Q.; Liu, J.; Le, W.; Guo, Z.; He, Z. Data-driven intelligent location of public charging stations for electric vehicles. J. Clean. Prod. 2019, 232, 531–541. [Google Scholar] [CrossRef]
  14. Abo-Elyousr, F.K.; Sharaf, A.M.; Darwish, M.M.; Lehtonen, M.; Mahmoud, K. Optimal scheduling of DG and EV parking lots simultaneously with demand response based on self-adjusted PSO and K-means clustering. Energy Sci. Eng. 2022, 10, 4025–4043. [Google Scholar] [CrossRef]
  15. Titus, F.; Thanikanti, S.B.; Deb, S.; Kumar, N.M. Charge scheduling optimization of plug-in electric vehicle in a PV powered grid-connected charging station based on day-ahead solar energy forecasting in Australia. Sustainability 2022, 14, 3498. [Google Scholar]
  16. Martin, H.; Buffat, R.; Bucher, D.; Hamper, J.; Raubal, M. Using rooftop photovoltaic generation to cover individual electric vehicle demand—A detailed case study. Renew. Sustain. Energy Rev. 2022, 157, 111969. [Google Scholar] [CrossRef]
  17. Schettini, T.; Dell’Amico, M.; Fumero, F.; Jabali, O.; Malucelli, F. Locating and sizing electric vehicle chargers considering multiple technologies. Energies 2023, 16, 4186. [Google Scholar] [CrossRef]
  18. Domínguez-Navarro, J.A.; Dufo-López, R.; Yusta-Loyo, J.M.; Artal-Sevil, J.S.; Bernal-Agustín, J.L. Design of an electric vehicle fast-charging station with integration of renewable energy and storage systems. Int. J. Electr. Power Energy Syst. 2019, 105, 46–58. [Google Scholar] [CrossRef]
  19. Salles-Mardones, J.; Flores-Maradiaga, A.; Ahmed, M.A. Feasibility assessment of photovoltaic systems to save energy consumption in residential houses with electric vehicles in Chile. Sustainability 2022, 14, s5377. [Google Scholar] [CrossRef]
  20. Roy, P.; He, J.; Liao, Y. Cost optimization of battery and Supercapacitor Hybrid Energy Storage System for dispatching solar PV Power. In Proceedings of the 2020 IEEE Energy Conversion Congress and Exposition (ECCE), Detroit, MI, USA, 11–15 October 2020; IEEE: New York City, NY, USA, 2020; pp. 561–568. [Google Scholar]
  21. Garip, S.; Ozdemir, S. Optimization of PV and battery energy storage size in grid-connected microgrid. Appl. Sci. 2022, 12, 8247. [Google Scholar] [CrossRef]
  22. Zhou, X.; Zou, S.; Wang, P.; Ma, Z. ADMM-based coordination of electric vehicles in constrained distribution networks considering fast charging and degradation. IEEE Trans. Intell. Transp. Syst. 2020, 22, 565–578. [Google Scholar] [CrossRef]
  23. Das, C.K.; Bass, O.; Kothapalli, G.; Mahmoud, T.S.; Habibi, D. Overview of energy storage systems in distribution networks: Placement, sizing, operation, and power quality. Renew. Sustain. Energy Rev. 2018, 91, 1205–1230. [Google Scholar] [CrossRef]
  24. Arshad, A.; Lehtonen, M. A stochastic assessment of PV hosting capacity enhancement in distribution network utilizing voltage support techniques. IEEE Access 2019, 7, 46461–46471. [Google Scholar] [CrossRef]
  25. Filip, R.; Püvi, V.; Paar, M.; Lehtonen, M. Analyzing the impact of EV and BESS deployment on PV hosting capacity of distribution networks. Energies 2022, 15, 7921. [Google Scholar] [CrossRef]
  26. Al Wahedi, A.; Bicer, Y. Techno-economic optimization of novel stand-alone renewables-based electric vehicle charging stations in Qatar. Energy 2022, 243, 123008. [Google Scholar] [CrossRef]
  27. Das, S.; Das, D.; Patra, A. Operation of distribution network with optimal placement and sizing of dispatchable DGs and shunt capacitors. Renew. Sustain. Energy Rev. 2019, 113, 109219. [Google Scholar] [CrossRef]
  28. Dev, A.K.; Kumar, A. Real power loss minimisation and energy cost saving with DG and capacitor using Jaya algorithm in Radial Distribution System. In Proceedings of the International Conference on Advances in Energy Research, Mumbai, India, 7–9 July 2022; Springer Nature: Singapore, 2022; pp. 11–22. [Google Scholar]
  29. Gampa, S.R.; Das, D. Simultaneous optimal allocation and sizing of distributed generations and shunt capacitors in distribution networks using fuzzy GA methodology. J. Electr. Syst. Inf. Technol. 2019, 6, 4. [Google Scholar] [CrossRef]
  30. Huy, T.H.B.; Dinh, H.T.; Kim, D. Multi-objective framework for a home energy management system with the integration of solar energy and an electric vehicle using an augmented ε-constraint method and lexicographic optimization. Sustain. Cities Soc. 2023, 88, 104289. [Google Scholar] [CrossRef]
  31. Nouri, A.; Lachheb, A.; El Amraoui, L. Optimizing efficiency of Vehicle-to-Grid system with intelligent management and ANN-PSO algorithm for battery electric vehicles. Electr. Power Syst. Res. 2024, 226, 109936. [Google Scholar] [CrossRef]
  32. Bibak, B.; Bai, L. An optimization approach for managing electric vehicle and reused battery charging in a vehicle to grid system under an electricity rate with demand charge. Sustain. Energy Grids Netw. 2023, 36, 101145. [Google Scholar] [CrossRef]
  33. Allouhi, A.; Rehman, S.A.M.A. Grid-connected hybrid renewable energy systems for supermarkets with electric vehicle charging platforms: Optimization and sensitivity analyses. Energy Rep. 2023, 9, 3305–3318. [Google Scholar] [CrossRef]
  34. Abdullah-Al-Nahid, S.; Khan, T.A.; Taseen, M.A.; Jamal, T.; Aziz, T. A novel consumer-friendly electric vehicle charging scheme with vehicle to grid provision supported by genetic algorithm based optimization. J. Energy Storage 2022, 50, 104655. [Google Scholar] [CrossRef]
  35. Metwly, M.Y.; Ahmed, M.; Hamad, M.S.; Abdel-Khalik, A.S.; Hamdan, E.; Elmalhy, N.A. Power management optimization of electric vehicles for grid frequency regulation: Comparative study. Alex. Eng. J. 2023, 65, 749–760. [Google Scholar] [CrossRef]
  36. Hassan, S.U.; Yousif, M.; Khan, S.N.; Kazmi, S.A.A.; Imran, K. A decision-centric approach for techno-economic optimization and environmental assessment of standalone and grid-integrated renewable-powered electric vehicle charging stations under multiple planning horizons. Energy Convers. Manag. 2023, 294, 117571. [Google Scholar] [CrossRef]
  37. Liu, J.; Wu, H.; Huang, H.; Yang, H. Renewable energy design and optimization for a net-zero energy building integrating electric vehicles and battery storage considering grid flexibility. Energy Convers. Manag. 2023, 298, 117768. [Google Scholar] [CrossRef]
  38. Datta, J.; Das, D. Energy management of multi-microgrids with renewables and electric vehicles considering price-elasticity based demand response: A bi-level hybrid optimization approach. Sustain. Cities Soc. 2023, 99, 104908. [Google Scholar] [CrossRef]
  39. Barik, A.K.; Das, D.C. Integrated resource planning in sustainable energy-based distributed microgrids. Sustain. Energy Technol. Assess. 2021, 48, 101622. [Google Scholar] [CrossRef]
  40. Tchuisseu, E.B.T.; Gomila, D.; Colet, P. Reduction of power grid fluctuations by communication between smart devices. Int. J. Electr. Power Energy Syst. 2019, 108, 145–152. [Google Scholar] [CrossRef]
  41. Jia, D.; Yang, L.; Gao, X.; Li, K. Assessment of a new solar radiation nowcasting method based on FY-4A satellite imagery, the McClear model and SHapley additive exPlanations (SHAP). Remote Sens. 2023, 15, 2245. [Google Scholar] [CrossRef]
  42. Almazroui, A.; Mohagheghi, S. Coordinated control of electric vehicles and PV resources in an unbalanced power distribution system. Energies 2022, 15, 9324. [Google Scholar] [CrossRef]
  43. Deeum, S.; Janjamraj, N.; Romphochai, S.; Bhumkittipich, K. Optimal location and sizing of renewable energy power generation in peer-to-peer microgrid system based on minimized power loss. In Proceedings of the 2022 25th International Conference on Electrical Machines and Systems (ICEMS), Chiang Mai, Thailand, 29 November–2 December 2022; IEEE: New York City, NY, USA, 2022; pp. 1–4. [Google Scholar]
  44. Zjavka, L. Solar and Wind Quantity 24 h—Series Prediction Using PDE-Modular Models Gradually Developed according to Spatial Pattern Similarity. Energies 2023, 16, 1085. [Google Scholar] [CrossRef]
  45. Heidari Yazdi, S.S.; Rahimi, T.; Khadem Haghighian, S.; Gharehpetian, G.B.; Bagheri, M. Over-voltage regulation of distribution networks by coordinated operation of PV inverters and demand side management program. Front. Energy Res. 2022, 10, 920654. [Google Scholar] [CrossRef]
  46. Wang, X.; Snášel, V.; Mirjalili, S.; Pan, J.S.; Kong, L.; Shehadeh, H.A. Artificial Protozoa Optimizer (APO): A novel bio-inspired metaheuristic algorithm for engineering optimization. Knowl. Based Syst. 2024, 295, 111737. [Google Scholar] [CrossRef]
  47. Wadood, A.; Ahmed, E.; Rhee, S.B.; Sattar Khan, B. A Fractional-Order Archimedean Spiral Moth–Flame Optimization Strategy to Solve Optimal Power Flows. Fractal Fract. 2024, 8, 225. [Google Scholar] [CrossRef]
  48. Wadood, A.; Park, H. A novel application of fractional order derivative moth flame optimization algorithm for solving the problem of optimal coordination of directional overcurrent relays. Fractal Fract. 2024, 8, 251. [Google Scholar] [CrossRef]
  49. Wadood, A.; Yousaf, A.F.; Alatwi, A.M. An Enhanced Multiple Unmanned Aerial Vehicle Swarm Formation Control Using a Novel Fractional Swarming Strategy Approach. Fractal Fract. 2024, 8, 334. [Google Scholar] [CrossRef]
  50. Wadood, A.; Sattar Khan, B.; Albalawi, H.; Alatwi, A.M. Design of the Novel Fractional Order Hybrid Whale Optimizer for Thermal Wind Power Generation Systems with Integration of Chaos Infused Wind Power. Fractal Fract. 2024, 8, 334. [Google Scholar] [CrossRef]
  51. Albalawi, H.; Muhammad, Y.; Wadood, A.; Khan, B.S.; Zainab, S.T.; Alatwi, A.M. Leveraging the Performance of Integrated Power Systems with Wind Uncertainty Using Fractional Computing-Based Hybrid Method. Fractal Fract. 2024, 8, 532. [Google Scholar] [CrossRef]
  52. Teodoro, G.S.; Machado, J.T.; De Oliveira, E.C. A review of definitions of fractional derivatives and other operators. J. Comput. Phys. 2019, 388, 195–208. [Google Scholar] [CrossRef]
  53. Sabatier, J.A.T.M.J.; Agrawal, O.P.; Machado, J.T. Advances in Fractional Calculus; Springer: Dordrecht, The Netherlands, 2007; Volume 4. [Google Scholar]
  54. Altaf, M.; Yousif, M.; Ijaz, H.; Rashid, M.; Abbas, N.; Khan, M.A.; Waseem, M.; Saleh, A.M. PSO-based optimal placement of electric vehicle charging stations in a distribution network in smart grid environment incorporating backward forward sweep method. IET Renew. Power Gener. 2024, 18, 3173–3187. [Google Scholar] [CrossRef]
  55. Pamuk, N.; Uzun, U.E. Optimal allocation of distributed generations and capacitor banks in distribution systems using arithmetic optimization algorithm. Appl. Sci. 2024, 14, 831. [Google Scholar] [CrossRef]
  56. Alatwi, A.M.; Albalawi, H.; Wadood, A.; Atawi, I.E.; Alatawi, K.S.S. Novel GBest–Lévy Adaptive Differential Ant Bee Colony Optimization for Optimal Allocation of Electric Vehicle Charging Stations and Distributed Generators in Smart Distribution Systems. Energies 2025, 18, 6018. [Google Scholar] [CrossRef]
Figure 1. Diagram of a PV system with BESS to support EVCSs.
Fractalfract 10 00101 g001
Figure 2. Working methodology of the proposed optimizers.
Fractalfract 10 00101 g002
Figure 3. Single-line diagram of IEEE-33 RDS with multi-DERs.
Fractalfract 10 00101 g003
Figure 4. Voltage profile improvement: (a) base case and EVCS, (b) optimal placement of DERs for all scenarios in IEEE-33 RDS using FC-APO variant.
Fractalfract 10 00101 g004
Figure 5. Real power loss after optimal placement of DERs for all scenario in IEEE-33 RDS using FC-APO variant.
Fractalfract 10 00101 g005
Figure 6. Reactive power loss after optimal placement of DERs for all scenario in IEEE-33 RDS using FC-APO variant.
Fractalfract 10 00101 g006
Figure 7. Comparison of real power losses for all scenarios for IEEE-33 RDS.
Fractalfract 10 00101 g007
Figure 8. Comparison of reactive power losses for all scenarios for IEEE-33 RDS.
Fractalfract 10 00101 g008
Figure 9. Convergence characteristics graph across different scenarios for all variants for IEEE-33 bus system.
Fractalfract 10 00101 g009
Figure 10. Single-line diagram of IEEE-69 RDS with multi-DERs.
Fractalfract 10 00101 g010
Figure 11. Voltage profile improvement: (a) base case and EVCS, (b) optimal placement of DERs for all scenario in IEEE-69 RDS using FC-APO variant.
Fractalfract 10 00101 g011
Figure 12. Real power loss after optimal placement of DERs for all scenarios using FC-APO variant for IEEE-69 bus system.
Fractalfract 10 00101 g012
Figure 13. Reactive power loss after optimal placement of DERs for all scenarios using FC-APO variant for IEEE-69 bus system.
Fractalfract 10 00101 g013
Figure 14. Comparison of real power losses for all scenarios for IEEE-69.
Fractalfract 10 00101 g014
Figure 15. Comparison of reactive power losses for all scenarios for IEEE-69.
Fractalfract 10 00101 g015
Figure 16. Convergence characteristic graphs across different scenarios for all variants for IEEE-69 bus system.
Fractalfract 10 00101 g016
Table 1. Comparative performance of APO-Std, AB-APO, and FC-APO for optimal allocation DERs under eight planning scenarios for IEEE-33 RDS.
ScenariosALGNEVNPVNBESSP_loss (kW)Q_loss (kVAr)Vmin (pu)VDEVCSs Buses and Size (kW)PV Buses and Size (kW)BESS Bus, Size (KW)
1APO-Std000201.893134.6410.913311.640---
AB-APO000201.893134.6410.913311.640---
FC-APO000201.893134.6410.913311.640---
2APO-Std300205.137137.1980.910011.710EVCSs: [(2, 100.0), (19, 100.0), (20, 100.0)]--
AB-APO300204.187136.1490.910011.710EVCSs: [(2, 100.0), (19, 100.0), (20, 100.0)]--
FC-APO300204.187136.1490.913411.710EVCSs: [(2, 100.0), (19, 100.0), (20, 100.0)]--
3APO-Std02092.718264.62890.98040.231-PV: [(13, 1165.2), (30, 1500.0)]-
AB-APO02092.718264.61230.98040.231-PV: [(13, 1165.2), (30, 1500.0)]-
FC-APO02092.718264.60000.98040.231-PV: [(30, 1500.0), (13, 1165.6)]-
4APO-Std001124.10086.34630.97081.825--BESS: [(10, 2000)]
AB-APO001124.10086.34630.97081.825--BESS: [(10, 2000)]
FC-APO001124.10086.34630.97081.825--BESS: [(10, 2000)]
5APO-Std32093.306265.20380.96990.232EVCSs: [(19, 100.0), (14, 100.0), (29, 155.5)]PV: [(13, 1441.6), (12, 1272.0)]-
AB-APO32093.301165.10020.96990.232EVCSs: [(19, 100.0), (14, 100.0), (29, 155.5)]PV: [(13, 1441.6), (12, 1272.0)]-
FC-APO32093.301165.00000.96990.232EVCSs: [(19, 100.0), (14, 100.0), (29, 155.5)]PV: [(13, 1441.6), (12, 1272.0)]-
6APO-Std301125.60887.44770.96871.852EVCSs: [(19, 100.0), (2, 100.0), (20, 100.0)]-BESS: [(10, 2000)]
AB-APO301125.60887.44770.96871.852EVCSs: [(19, 100.0), (2, 100.0), (20, 100.0)]-BESS: [(10, 2000)]
FC-APO301124.75987.01000.96881.852EVCSs: [(19, 100.0), (2, 100.0), (20, 100.0)]-BESS: [(10, 2000)]
7APO-Std02177.659955.80050.98890.1290-PV: [(30, 1490.9), (13, 1077.6)]BESS: [(30, 1442.8)]
AB-APO02177.463355.60010.98990.1290-PV: [(30, 1490.9), (13, 1077.6)]BESS: [(30, 1442.8)]
FC-APO02177.350054.99780.98990.1290-PV: [(30, 1490.9), (13, 1077.6)]BESS: [(30, 1442.8)]
8APO-Std32179.553856.92500.98900.140EVCSs: [(7, 112.6), (15, 100.0), (19, 100.0)]PV: [(7, 1128.3), (30, 1207.5)]BESS: [(14, 957.8)]
AB-APO32179.463356.60010.98900.139EVCSs: [(7, 112.6), (15, 100.0), (19, 100.0)]PV: [(7, 1128.3), (30, 1207.5)]BESS: [(14, 957.8)]
FC-APO32179.303255.90150.98900.13801EVCSs: [(7, 112.6), (15, 100.0), (19, 100.0)]PV: [(7, 1128.3), (30, 1207.5)]BESS: [(14, 957.8)]
Table 2. Comparative performance of APO-Std, AB-APO, and FC-APO for optimal allocation DERs under eight planning scenarios for IEEE-69 RDS.
ScenarioAlgorithmNEVNPVNBESSP_loss (kW)Q_loss (kVAr)Vmin (pu)VDEVCSs Buses (kW)PV Buses (kW)BESS (bus, P)
1APO-Std000224.553102.0110.91029.762---
AB-APO000224.553102.0110.91029.762---
FC-APO000224.553102.0110.91029.762---
2APO-Std300228.056105.83370.90009.763EVCSs: [(37, 100.0), (36, 100.0), (47, 100.0)]--
AB-APO300226.5678104.0090.90009.763EVCSs: [(37, 100.0), (36, 100.0), (47, 100.0)]--
FC-APO300226.5678104.0050.90009.763EVCSs: [(37, 100.0), (36, 100.0), (47, 100.0)]--
3APO-Std02081.56338.61530.97960.376-PV: [(62, 1500.0), (12, 1500.0)]-
AB-APO02080.111538.00350.97870.372-PV: [(62, 1500.0), (12, 1500.0)]-
FC-APO02080.111538.00040.97870.372-PV: [(62, 1500.0), (12, 1500.0)]-
4APO-Std00181.928739.6540.97011.576--BESS: [(61, 2000)]
AB-APO00181.928739.65420.97011.576--BESS: [(61, 2000)]
FC-APO00181.928739.65420.97011.576--BESS: [(61, 2000)]
5APO-Std32081.974042.61530.97000.408EVCSs: [(47, 100.0), (44, 114.9), (40, 100.0)]PV: [(12, 1457.1), (61, 1500.0)]-
AB-APO32080.115341.22010.97010.399EVCSs: [(47, 100.0), (44, 114.9), (40, 100.0)]PV: [(12, 1457.1), (61, 1500.0)]-
FC-APO32080.101840.99920.97010.3899EVCSs: [(47, 100.0), (44, 114.9), (40, 100.0)]PV: [(12, 1457.1), (61, 1500.0)]-
6APO-Std30182.211042.99010.97001.577EVCSs: [(40, 100.0), (39, 100.0), (2, 100.0)]-BESS: [(61, 2000.0)]
AB-APO30181.937941.67170.97001.577EVCSs: [(40, 100.0), (39, 100.0), (2, 100.0)]-BESS: [(61, 2000.0)]
FC-APO30181.936240.87550.97001.577EVCSs: [(40, 100.0), (39, 100.0), (2, 100.0)]-BESS: [(61, 2000.0)]
7APO-Std02173.402836.4580.99300.3013-PV: [(61, 1102.0), (62, 958.5)]BESS: [(61, 1274.9)]
AB-APO02173.387236.15270.99370.3011-PV: [(61, 1102.0), (62, 958.5)]BESS: [(61, 1274.9)]
FC-APO02173.387236.15000.99370.3011-PV: [(61, 1102.0), (62, 958.5)]BESS: [(61, 1274.9)]
8APO-Std32174.879237.35320.98330.90EVCSs: [(36, 100.4), (47, 100.0), (31, 100.0)]PV: [(62, 1500.0), (18, 663.8)]BESS: [(62, 718.3)]
AB-APO32174.103237.18980.98730.8999EVCSs: [(36, 100.4), (47, 100.0), (31, 100.0)]PV: [(62, 1500.0), (18, 663.8)]BESS: [(62, 718.3)]
FC-APO32174.010336.992450.98730.8899EVCSs: [(36, 100.4), (47, 100.0), (31, 100.0)]PV: [(62, 1500.0), (18, 663.8)]BESS: [(62, 718.3)]
Disclaimer/Publisher’s Note: The statements, opinions and data contained in all publications are solely those of the individual author(s) and contributor(s) and not of MDPI and/or the editor(s). MDPI and/or the editor(s) disclaim responsibility for any injury to people or property resulting from any ideas, methods, instructions or products referred to in the content.