
Addressing Credit Card Fraud Detection Challenges with Adversarial Autoencoders


Abstract
1. Introduction
2. Related Work
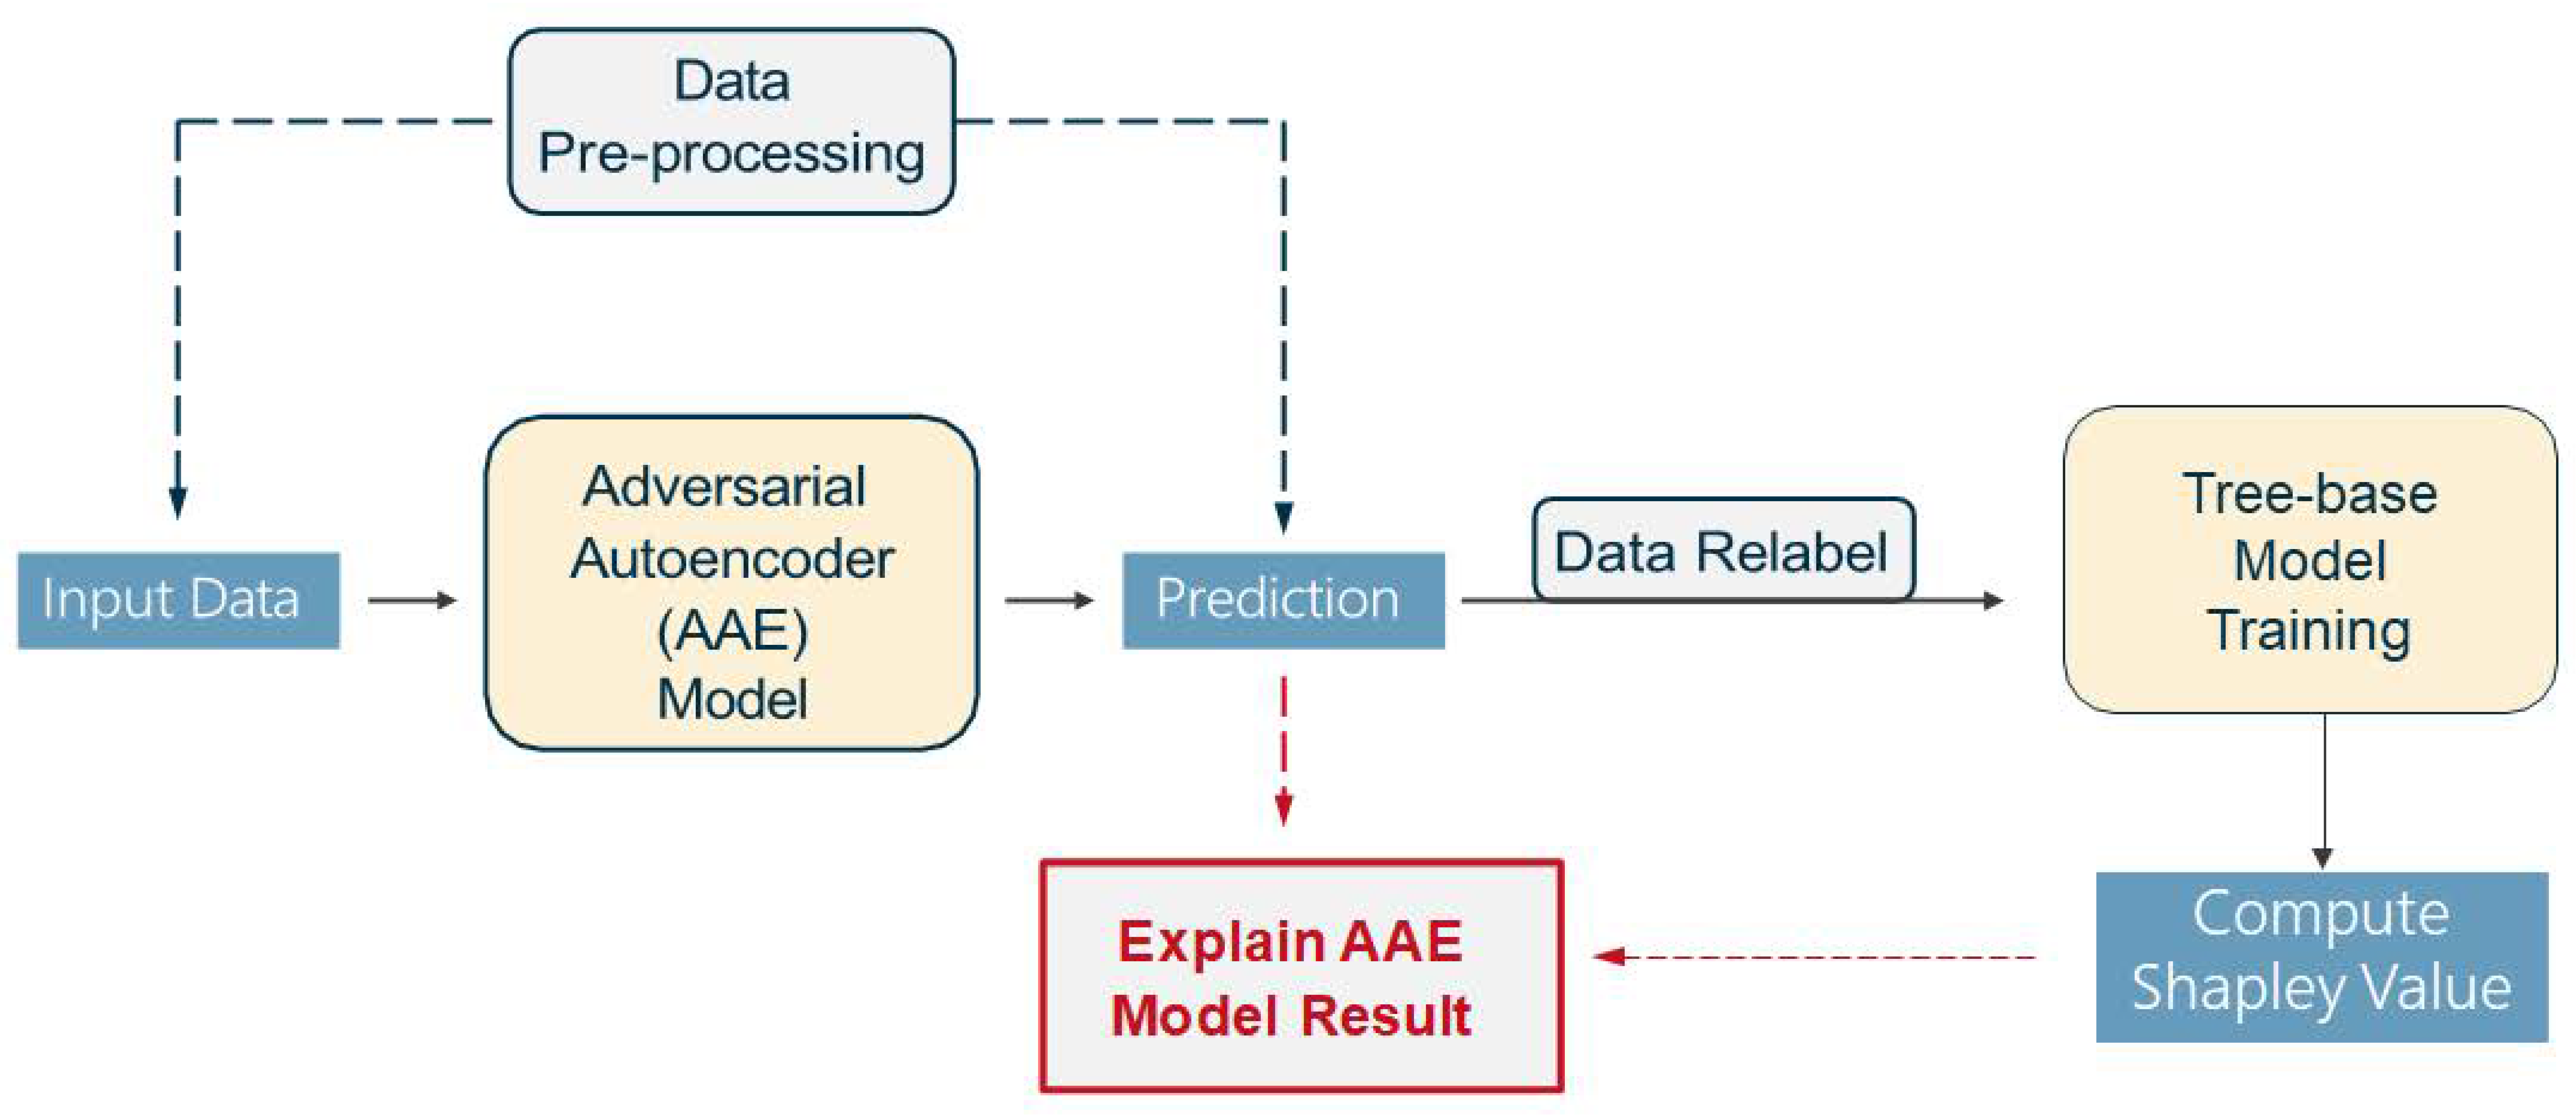
3. Methods
3.1. Autoencoder
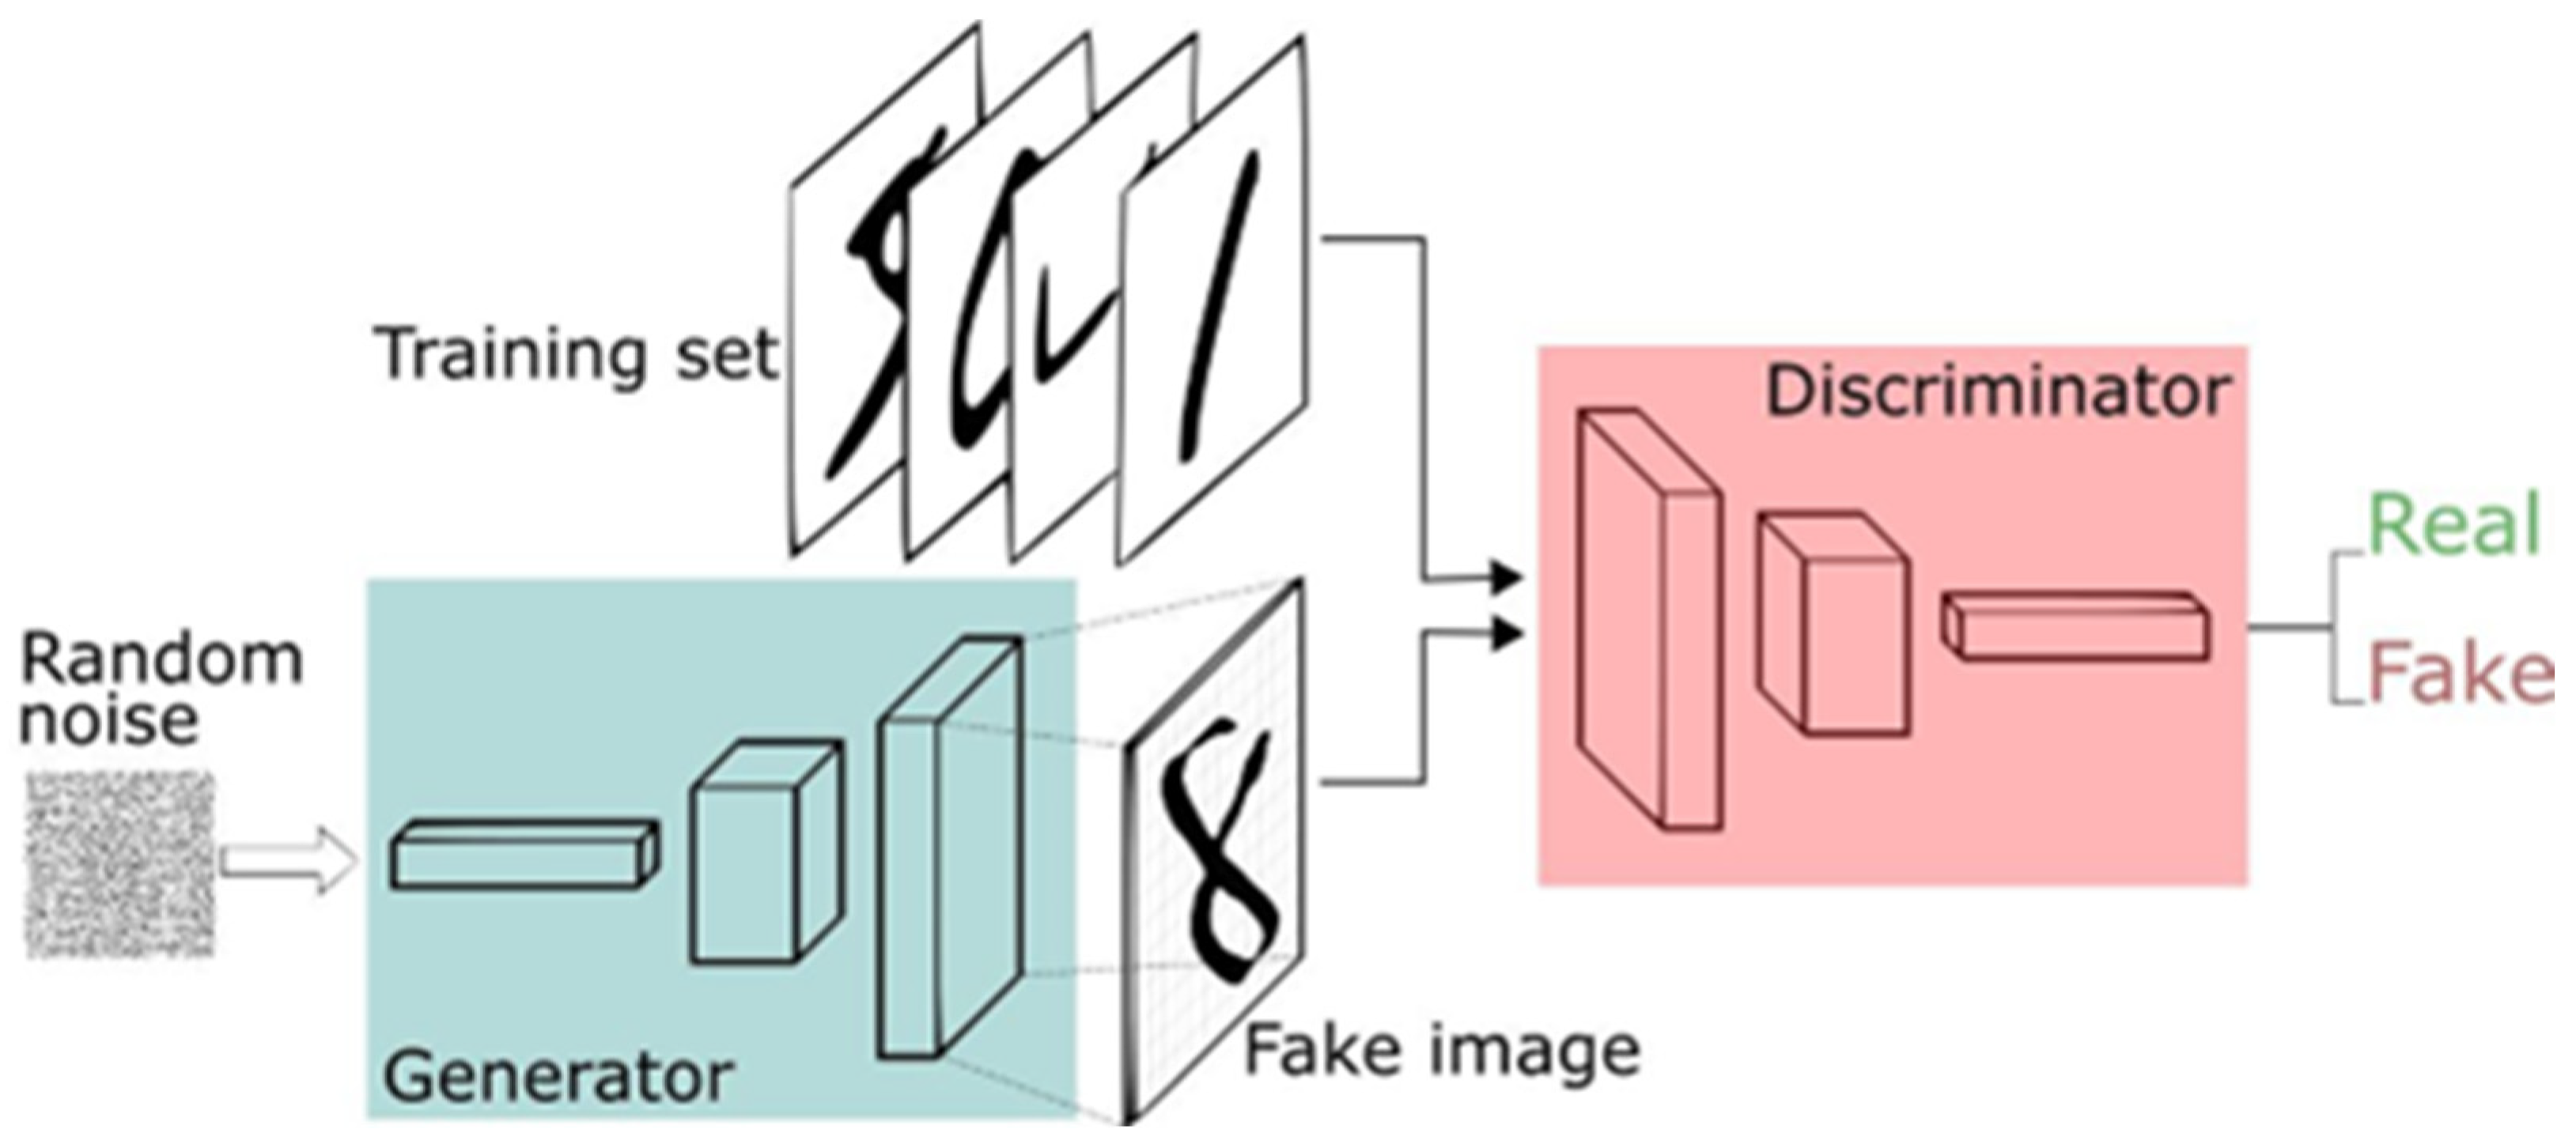
3.2. Generative Adversarial Network (GAN)
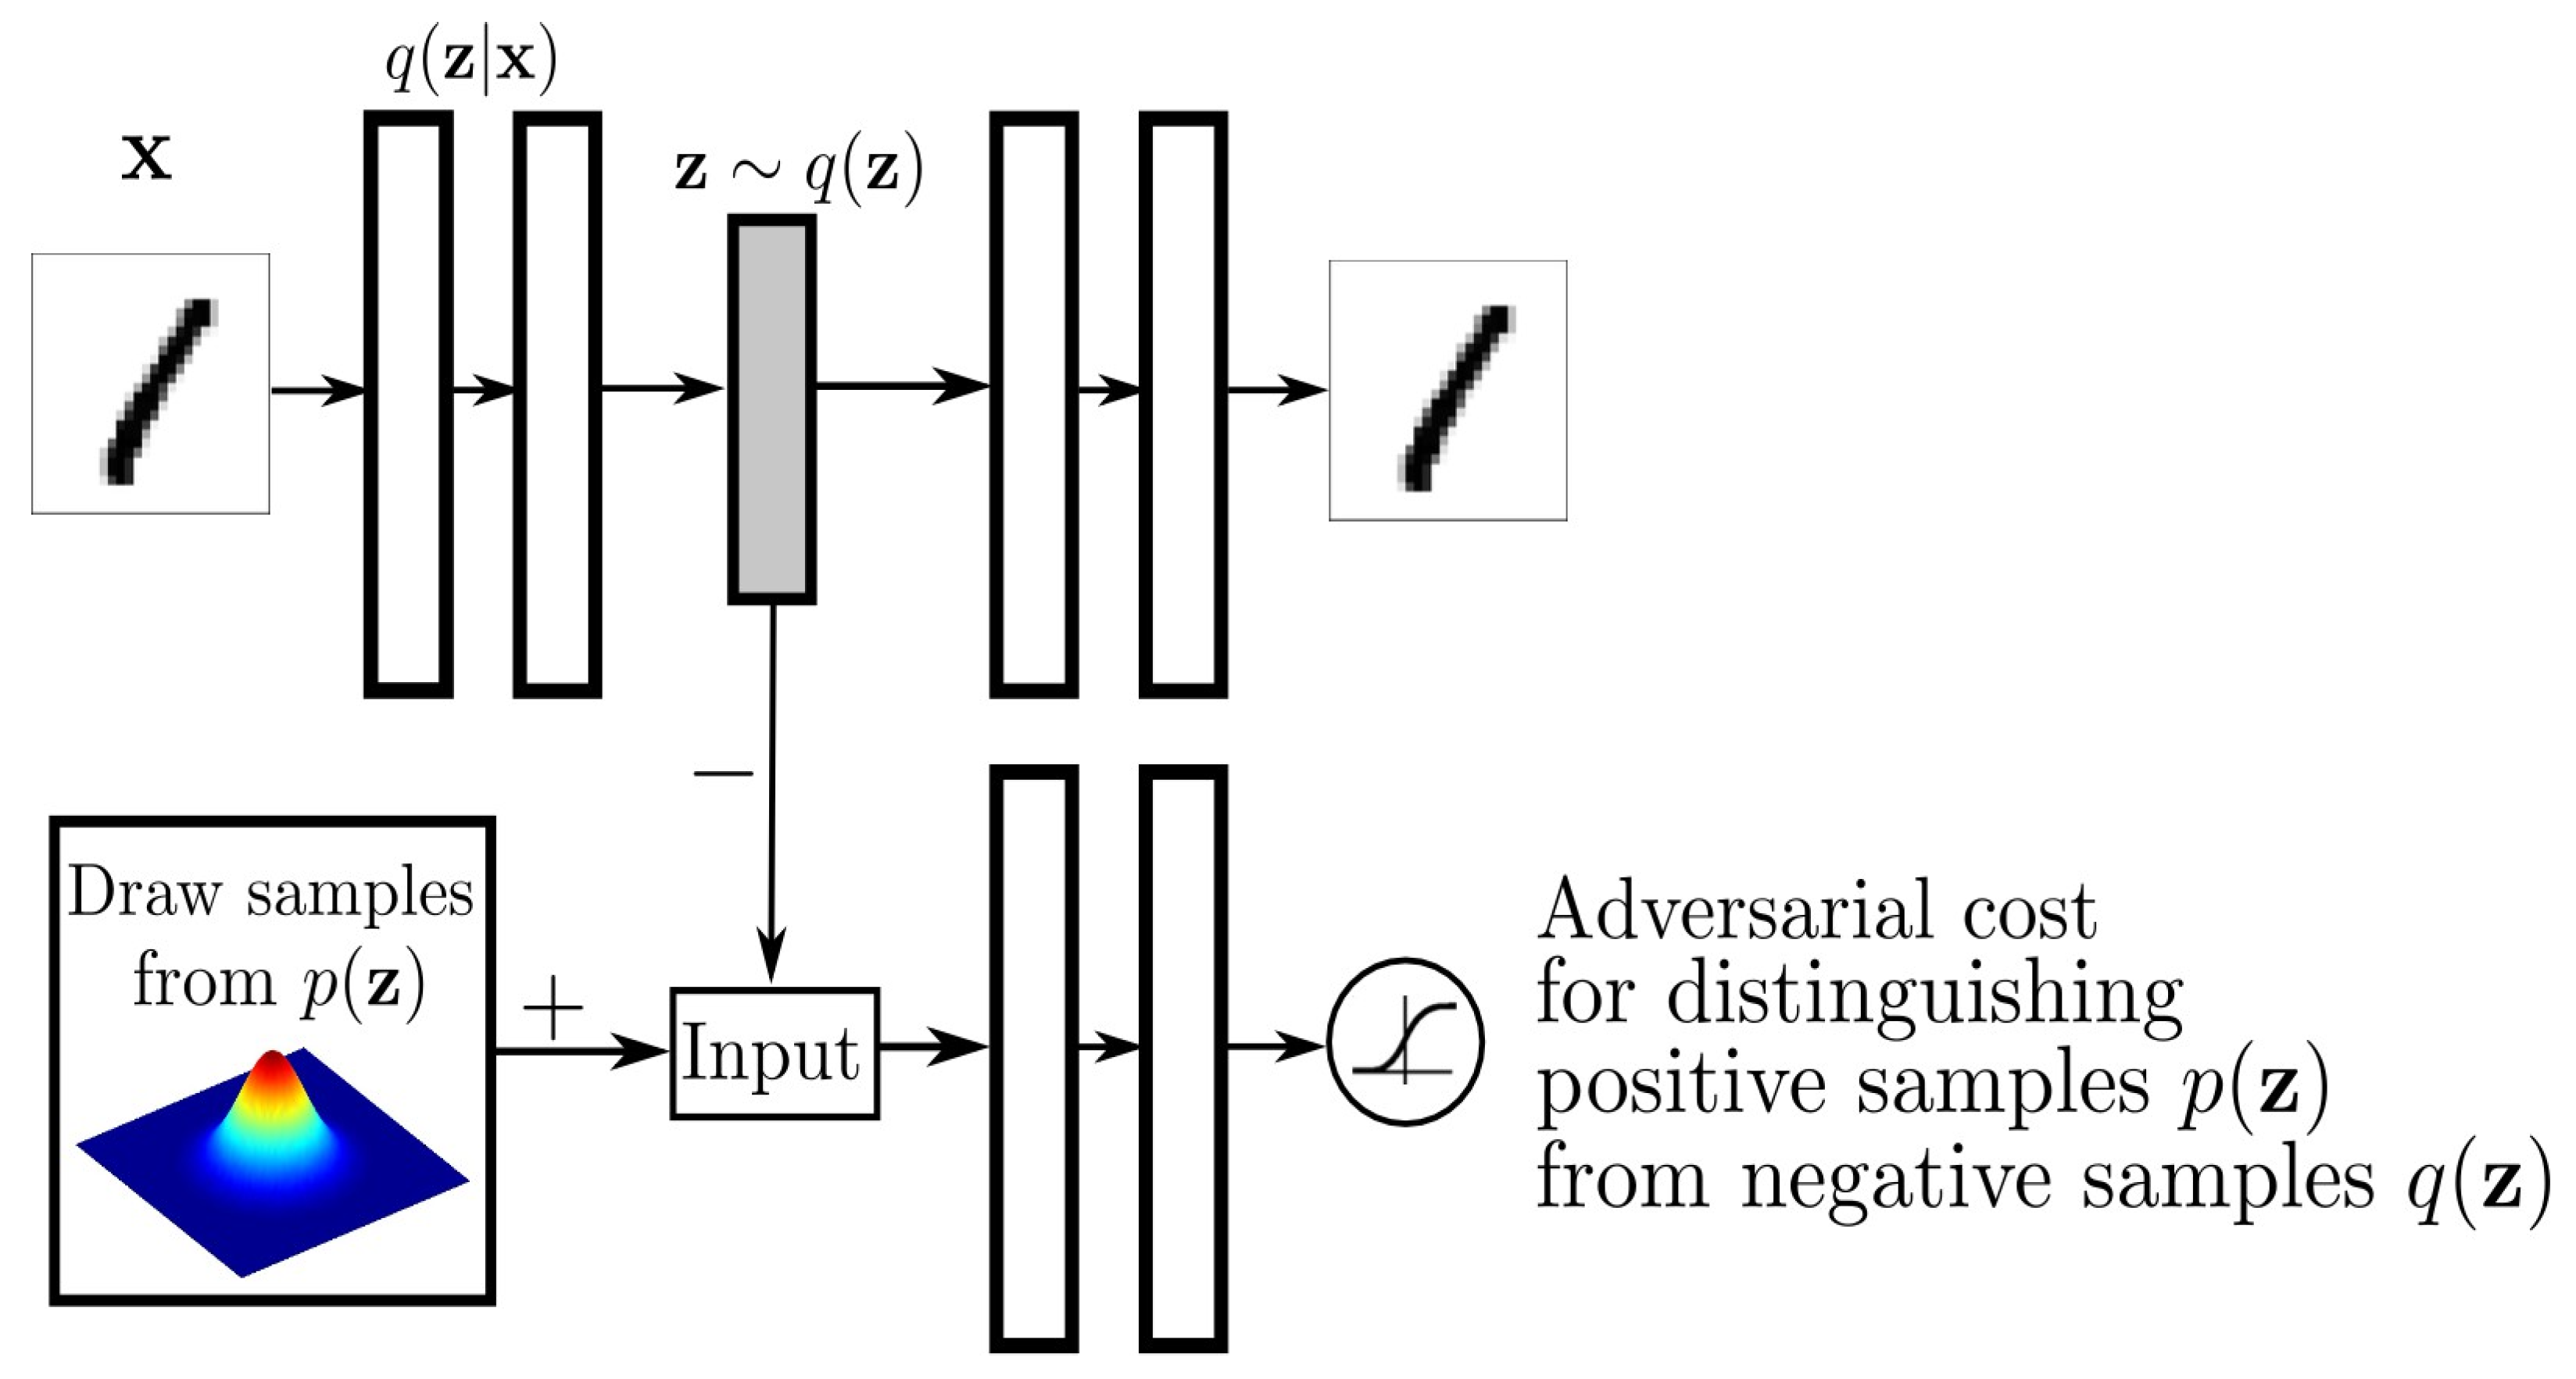
3.3. Adversarial Autoencoder
3.4. Other Unsupervised Models
- It enables unsupervised fraud detection without reliance on labeled data.
- It is robust to extreme class imbalance, as it learns exclusively from the majority (normal) class.
- It can detect emerging fraud patterns, effectively addressing concept drift by identifying deviations from learned normal behavior.
- The structured latent space enhances both anomaly separation and interpretability.
4. Experiments
4.1. Dataset
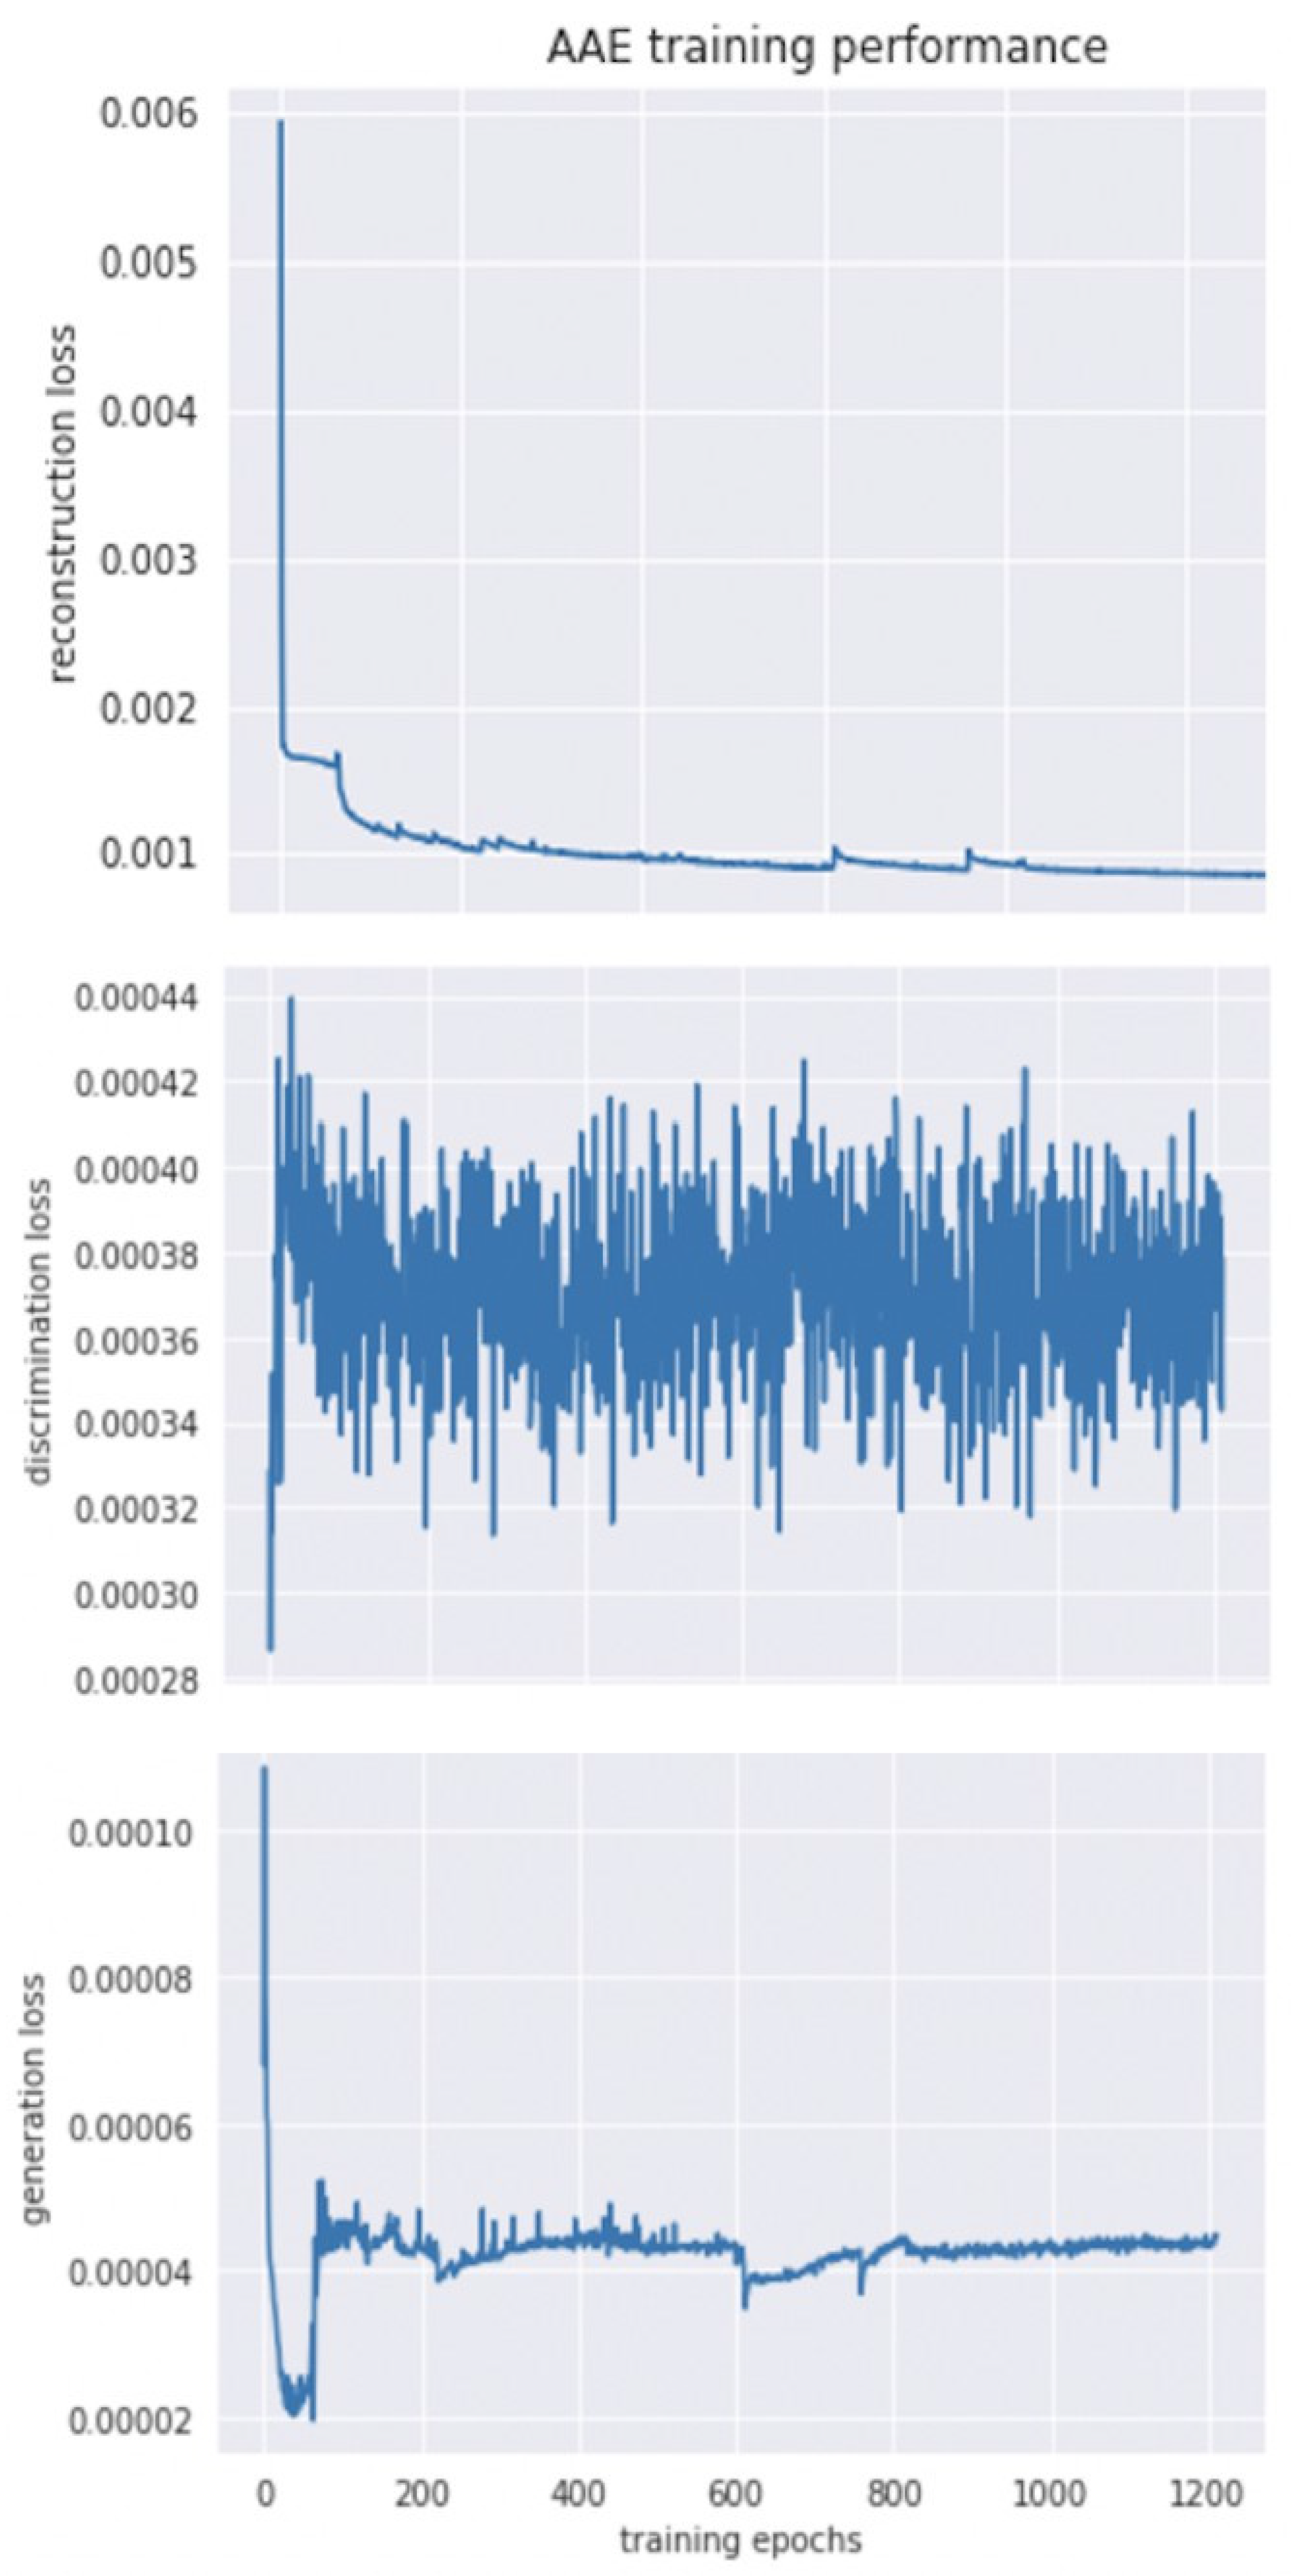
4.2. Model Optimization
- Encoder: 4 layers of 29-256-64-16-4-2,
- Decoder: 4 layers of 2-4-16-64-256-29,
- Discriminator: 4 layers of 2(hidden variable Z)-256-16-4-2-1,
- Learning rate of Encoder, Decoder and Discriminator: e−3, e−3 and e−5,
- Batch size: 128.
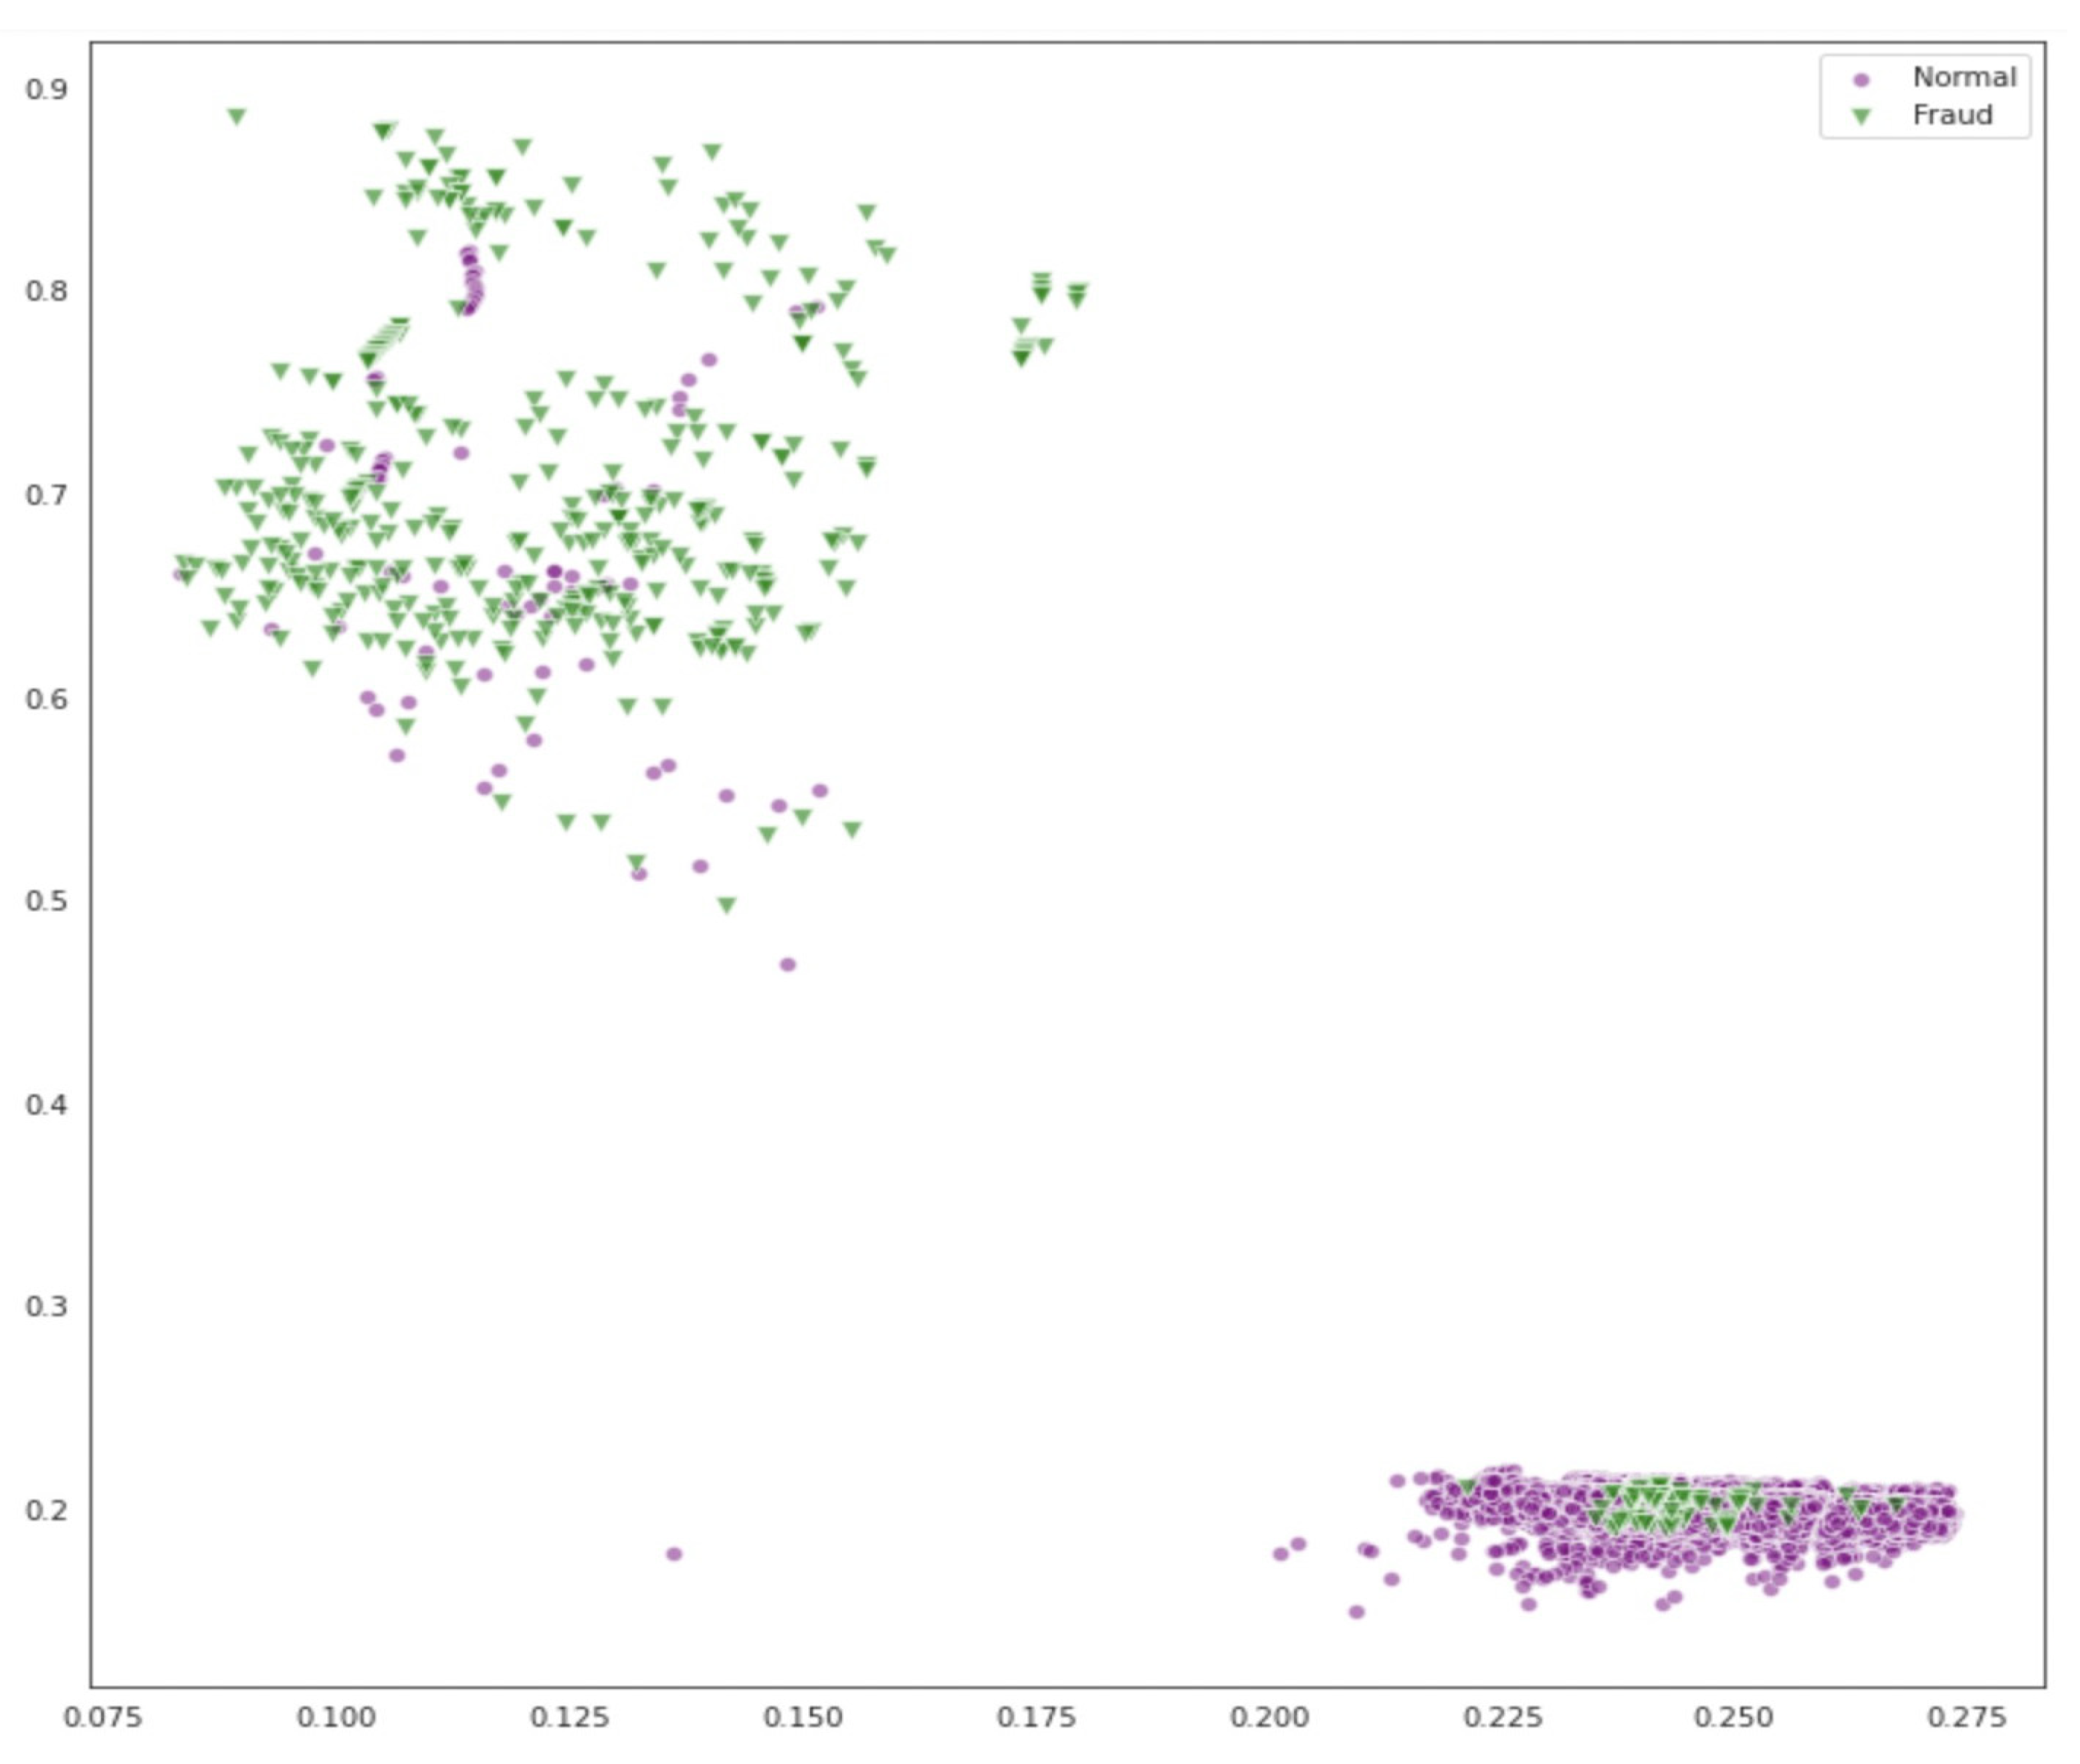
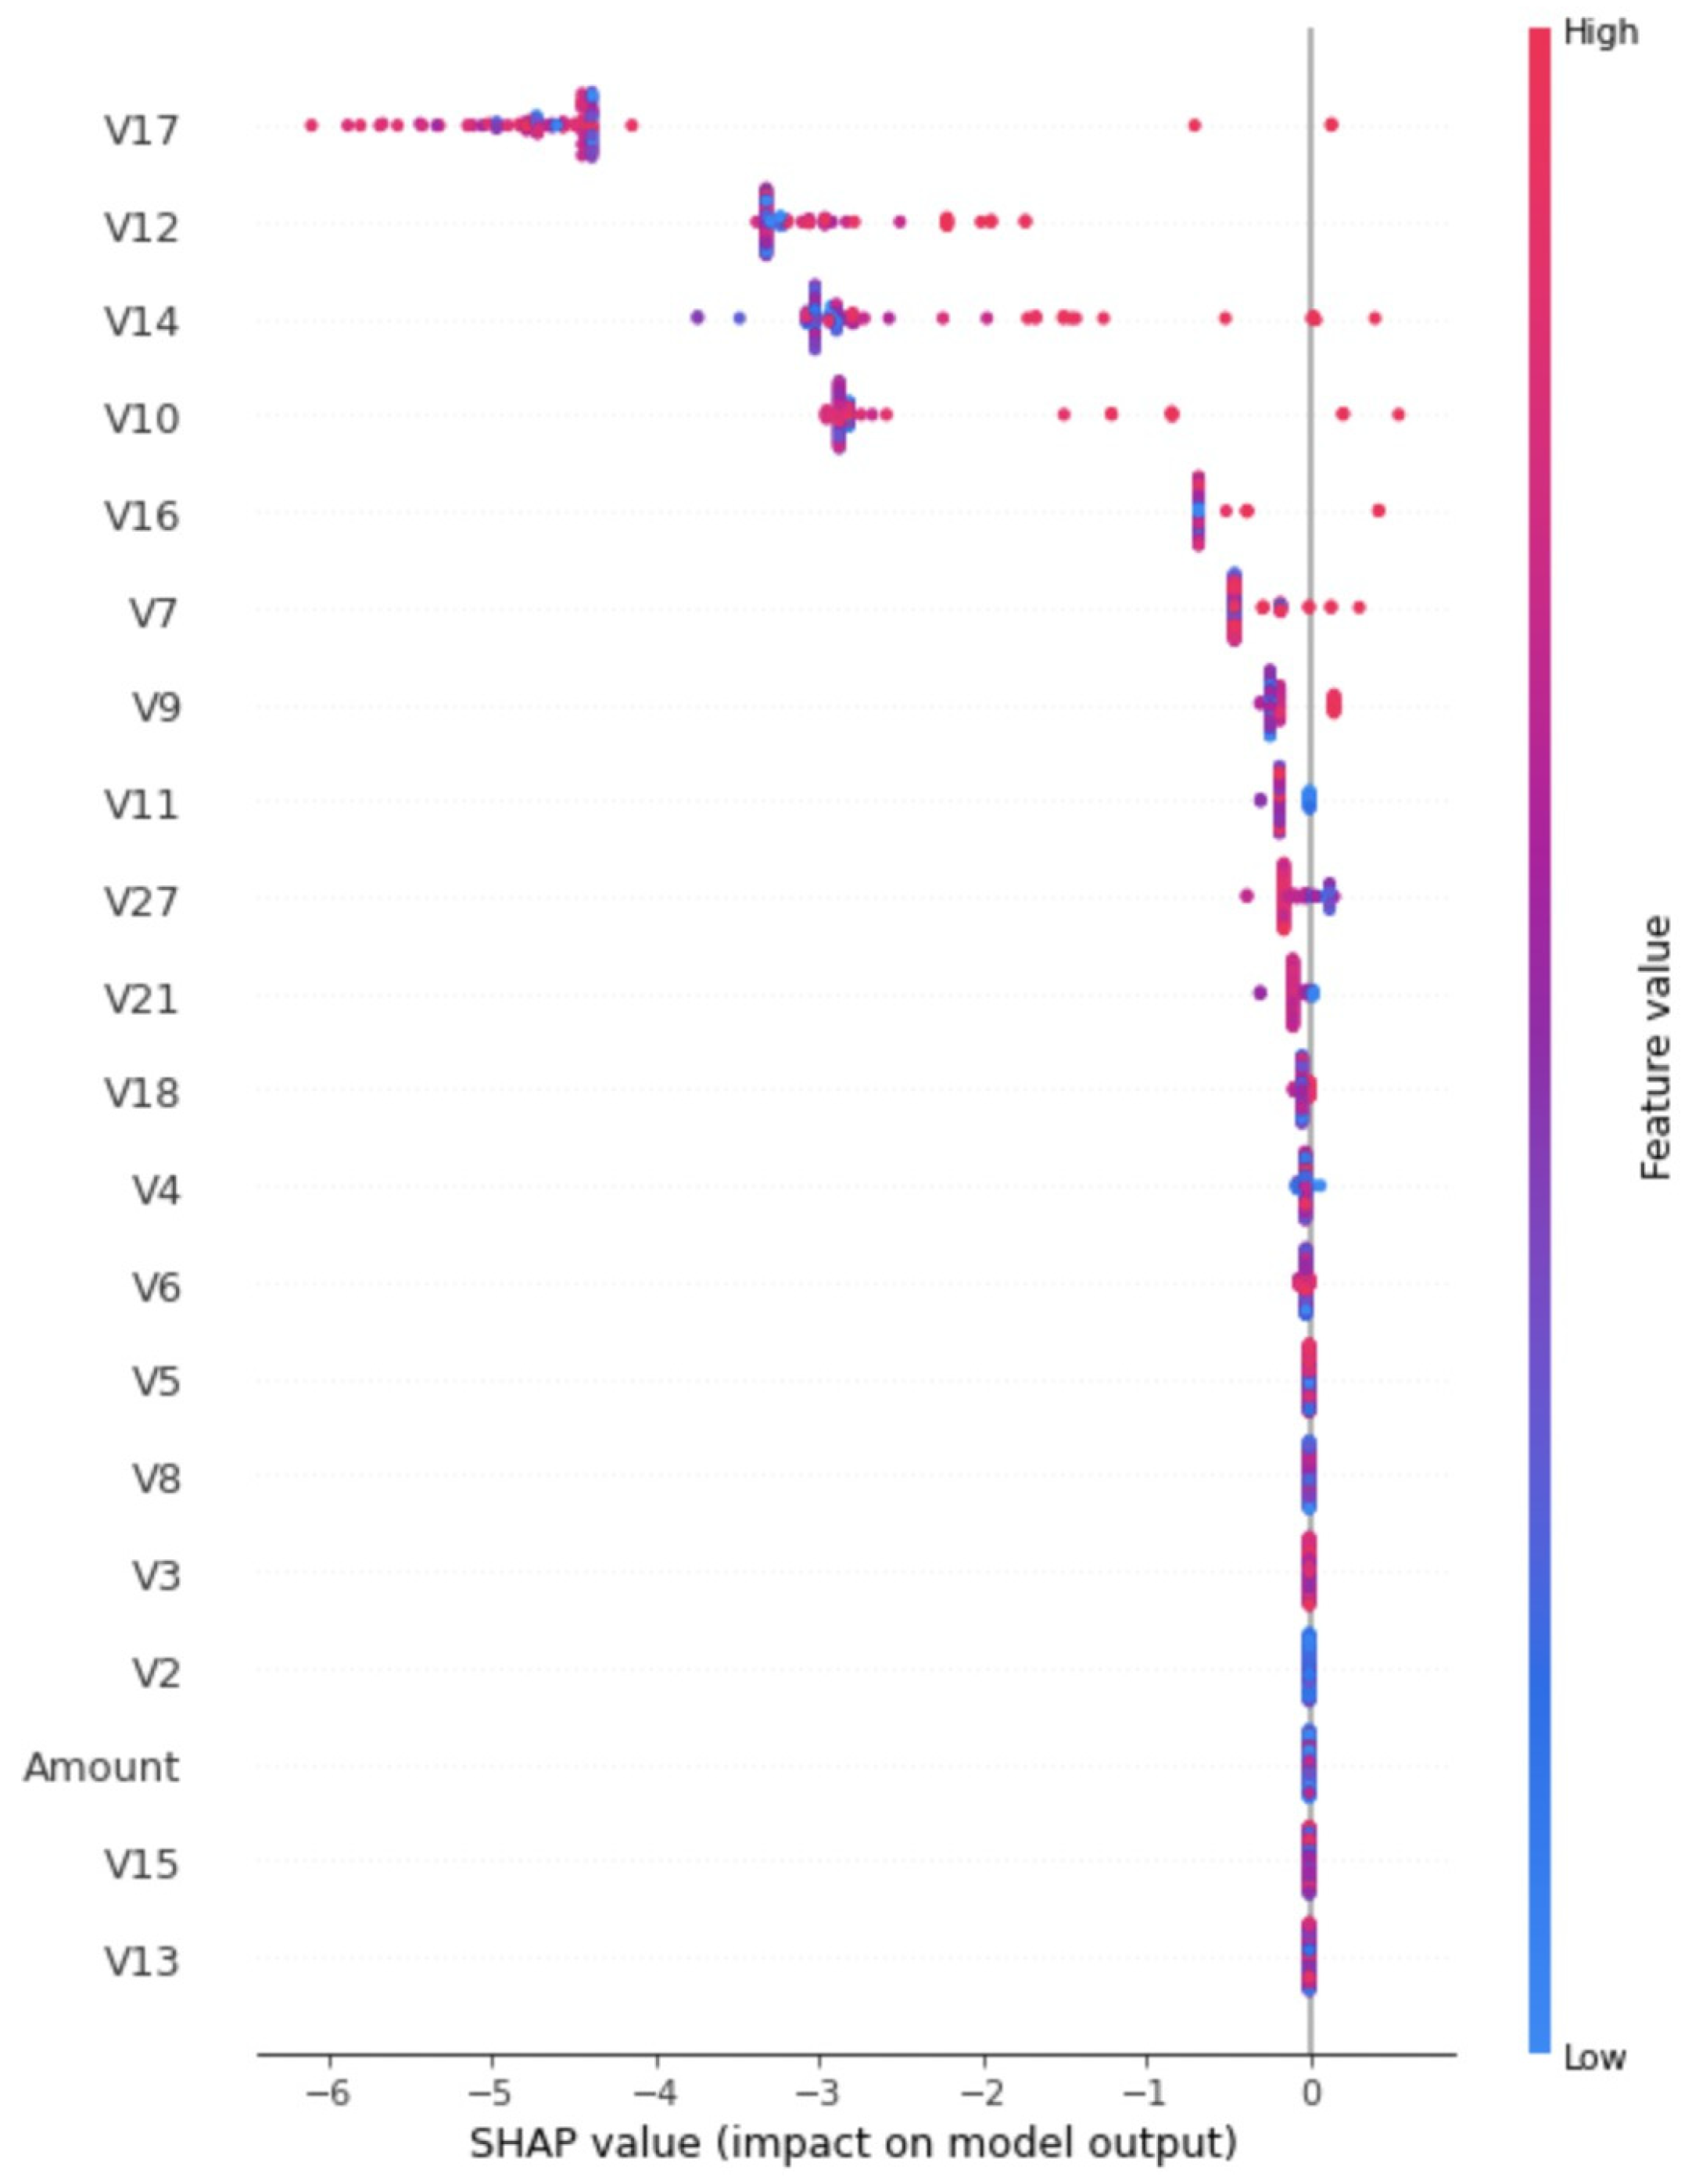
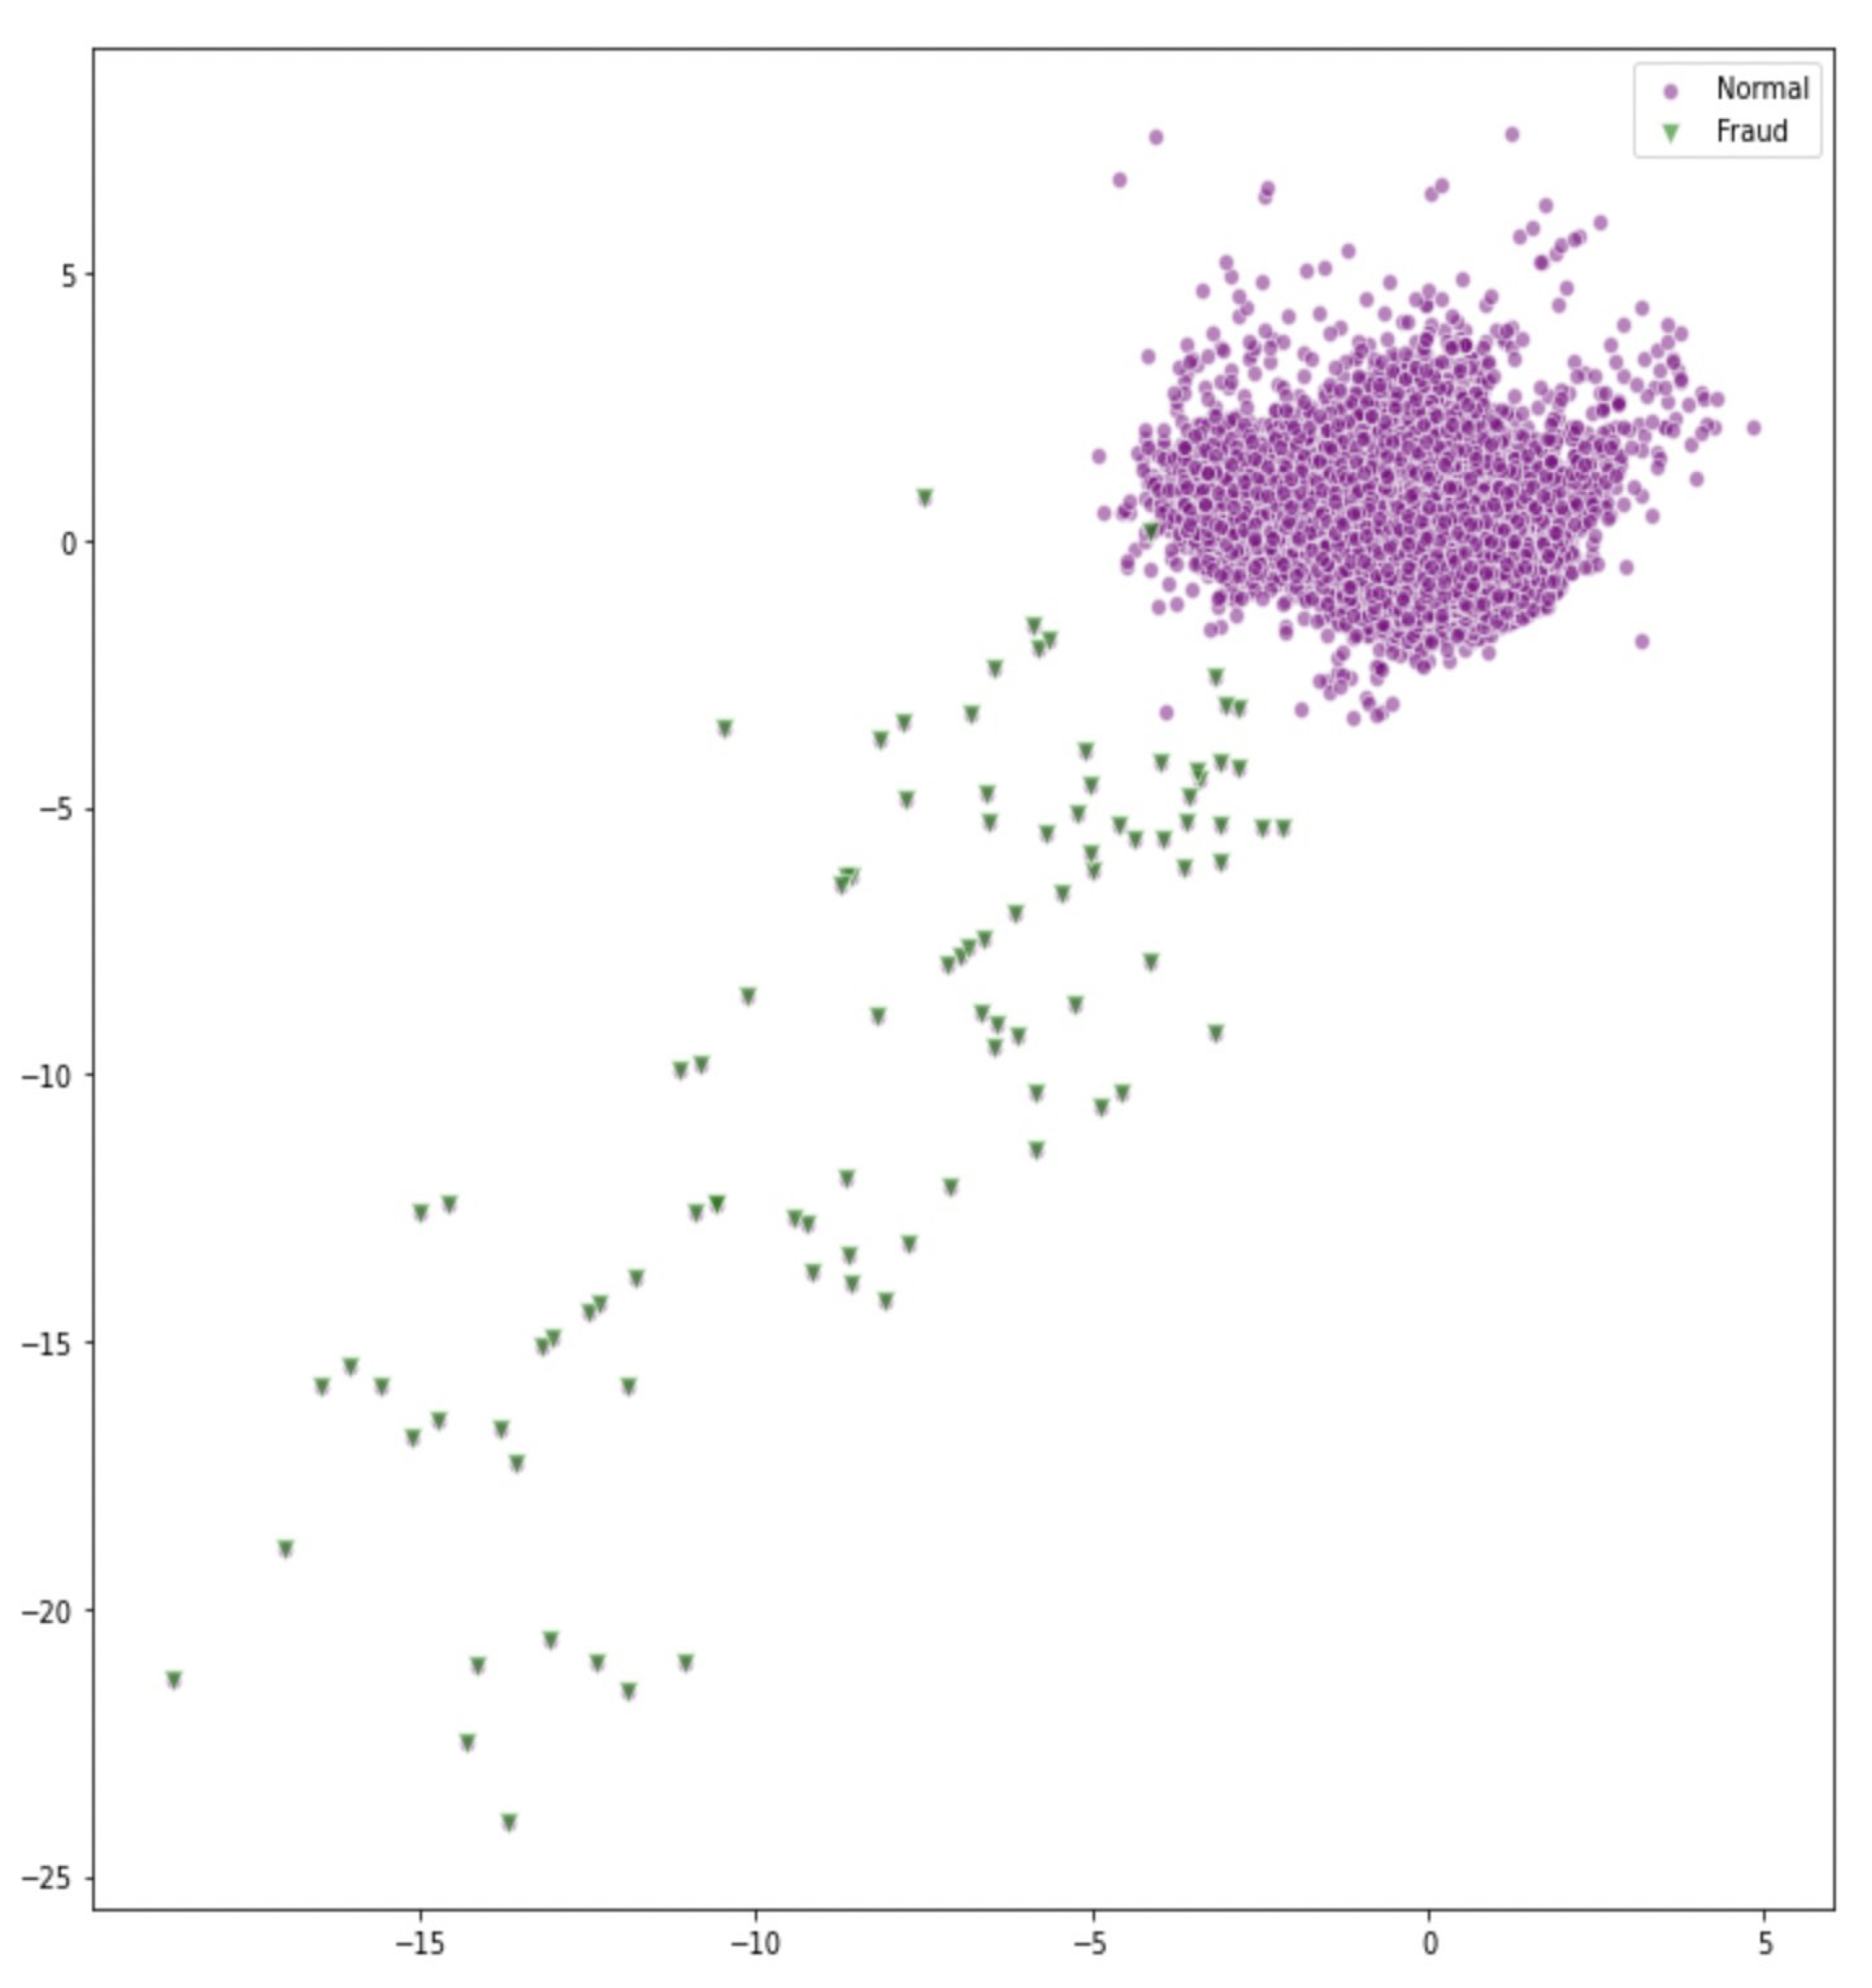
4.3. Results
5. Conclusions
Author Contributions
Funding
Data Availability Statement
Conflicts of Interest
References
- Federal Trade Commission (FTC). Consumer Sentinel Network Data Book. 2021. Available online: https://www.ftc.gov/system/files/ftc_gov/pdf/CSN+Annual+Data+Book+2021+Final+PDF.pdf (accessed on 15 June 2025).
- Bolton, R.J.; Hand, D.J. Statistical fraud detection: A review. Stat. Sci. 2002, 17, 235–255. [Google Scholar] [CrossRef]
- Carcillo, F.; Le Borgne, Y.A.; Caelen, O.; Kessaci, Y.; Oblé, F.; Bontempi, G. Combining unsupervised and supervised learning in credit card fraud detection. Inf. Sci. 2021, 517, 317–331. [Google Scholar] [CrossRef]
- Phua, C.; Lee, V.; Smith, K.; Gayler, R. A comprehensive survey of data mining-based fraud detection research. arXiv 2010, arXiv:1009.6119. [Google Scholar]
- Jha, S.; Guillen, M.; Westland, J.C. Employing transaction aggregation strategy to detect credit card fraud. Expert Syst. Appl. 2012, 39, 12650–12657. [Google Scholar] [CrossRef]
- Asha, R.B.; Suresh Kumar, K.R. Credit card fraud detection using artificial neural network. Glob. Transit. Proc. 2021, 2, 35–41. [Google Scholar]
- Ngai, E.W.; Hu, Y.; Wong, Y.H.; Chen, Y.; Sun, X. The application of data mining techniques in financial fraud detection: A classification framework and an academic review of literature. Decis. Support Syst. 2011, 50, 559–569. [Google Scholar] [CrossRef]
- Aleskerov, E.; Freisleben, B.; Rao, B. CARDWATCH: A neural network-based database mining system for credit card fraud detection. In Proceedings of the IEEE/IAFE 1997 Computational Intelligence for Financial Engineering (CIFEr), New York, NY, USA, 24–25 March 1997. [Google Scholar]
- Bahnsen, A.C.; Stojanovic, A.; Aouada, D.; Ottersten, B. Cost-sensitive credit card fraud detection using Bayes minimum risk. In Proceedings of the 2013 12th International Conference on Machine Learning and Applications, ICMLA 2013, Washington, DC, USA, 4–7 December 2013; IEEE Computer Society: Washington, DC, USA; pp. 333–338. [Google Scholar]
- Chalapathy, R.; Chawla, S. Deep Learning for Anomaly Detection: A Survey. arXiv 2019, arXiv:1901.03407. [Google Scholar]
- Fiore, U.; De Santis, A.; Perla, F.; Zanetti, P.; Palmieri, F. Using generative adversarial networks for improving classification effectiveness in credit card fraud detection. Inf. Sci. 2019, 479, 448–455. [Google Scholar] [CrossRef]
- Kaggle Credit Card Fraud Detection Dataset 2023. Available online: https://www.kaggle.com/datasets/nelgiriyewithana/credit-card-fraud-detection-dataset-2023 (accessed on 15 June 2025).
- Goodfellow, I.; Pouget-Abadie, J.; Mirza, M.; Xu, B.; Warde-Farley, D.; Ozair, S.; Courville, A.; Bengio, Y. Generative adversarial nets. Adv. Neural Inf. Process. Syst. 2014, 27. [Google Scholar] [CrossRef]
- Niu, X.; Wang, L.; Yang, X. A comparison study of credit card fraud detection: Supervised versus unsupervised. arXiv 2019, arXiv:1904.10604. [Google Scholar]
- Delamaire, L.; Abdou, H.; Pointon, J. Credit card fraud and detection techniques: A review. Banks Bank Syst. 2009, 4, 57–68. [Google Scholar]
- Hussein, A.S.; Khairy, R.S.; Najeeb, S.M.M.; Alrikabi, H.T.S. Credit card fraud detection using fuzzy rough nearest neighbor and sequential minimal optimization with logistic regression. Int. J. Interact. Mob. Technol. 2021, 15, 24–42. [Google Scholar] [CrossRef]
- Li, C.; Ding, N.; Zhai, Y.; Dong, H. Comparative study on credit card fraud detection based on different support vector machines. Intell. Data Anal. 2021, 25, 105–119. [Google Scholar] [CrossRef]
- Jeragh, M.; AlSulaimi, M. Combining auto encoders and one class support vectors machine for fraudulant credit card transactions detection. In Proceedings of the 2018 Second World Conference on Smart Trends in Systems, Security and Sustainability (WorldS4), London, UK, 30–31 October 2018; IEEE: Piscataway, NJ, USA, 2018; pp. 178–184. [Google Scholar]
- John, H.; Naaz, S. Credit card fraud detection using local outlier factor and isolation forest. Int. J. Comput. Sci. Eng. 2019, 7, 1060–1064. [Google Scholar] [CrossRef]
- Pumsirirat, A.; Yan, L. Credit card fraud detection using deep learning based on auto-encoder and restricted boltzmann machine. Int. J. Adv. Comput. Sci. Appl. 2018, 9, 18–25. [Google Scholar] [CrossRef]
- Fan, W.; Miller, M.; Stolfo, S.; Lee, W.; Chan, P. Using artificial anomalies to detect unknown and known network intrusions. Knowl. Inf. Syst. 2004, 6, 507–527. [Google Scholar] [CrossRef]
- Schreyer, M.; Sattarov, T.; Borth, D.; Dengel, A.; Reimer, B. Detection of anomalies in large scale accounting data using deep autoencoder networks. arXiv 2017, arXiv:1709.05254. [Google Scholar]
- Schreyer, M.; Sattarov, T.; Schulze, C.; Reimer, B.; Borth, D. Detection of accounting anomalies in the latent space using adversarial autoencoder neural networks. arXiv 2019, arXiv:1908.00734. [Google Scholar]
- Zheng, Y.-J.; Zhou, X.-H.; Sheng, W.-G.; Xue, Y.; Chen, S.-Y. Generative adversarial network-based telecom fraud detection at the receiving bank. Neural Netw. 2018, 102, 78–86. [Google Scholar] [CrossRef]
- Herrera, J.L.L.; Figueroa, H.V.R.; Ramírez, E.J.R. Deep fraud. A fraud intention recognition framework in public transport context using a deep-learning approach. In Proceedings of the 2018 International Conference on Electronics, Communications and Computers (CONIELECOMP), Cholula, Mexico, 21–23 February 2018; IEEE: Piscataway, NJ, USA, 2018; pp. 118–125. [Google Scholar]
- Chaudhary, K.; Yadav, J.; Mallick, B. A review of fraud detection techniques: Credit card. Int. J. Comput. Appl. 2012, 45, 39–44. [Google Scholar]
- Zou, J.; Zhang, J.; Jiang, P. Credit card fraud detection using autoencoder neural network. arXiv 2019, arXiv:1908.11553. [Google Scholar]
- Sweers, T.; Heskes, T.; Krijthe, J. Autoencoding Credit Card Fraud. Bachelor’s Thesis, Radboud University, Nijmegen, The Netherlands, 2018. [Google Scholar]
- Kazemi, Z.; Zarrabi, H. Using deep networks for fraud detection in credit card transactions. In Proceedings of the 2017 IEEE 4th International Conference on Knowledge-Based Engineering and Innovation (KBEI), Tehran, Iran, 22 December 2017; IEEE: Piscataway, NJ, USA, 2017; pp. 0630–0633. [Google Scholar]
- Misra, S.; Thakur, S.; Ghosh, M.; Saha, S.K. An autoencoder based model for detecting fraudulent credit card transactions. Procedia Comput. Sci. 2020, 167, 254–262. [Google Scholar] [CrossRef]
- Raghavan, P.; El Gayar, N. Fraud detection using machine learning and deep learning. In Proceedings of the 2019 International Conference on Computational Intelligence and Knowledge Economy (ICCIKE), Dubai, United Arab Emirates, 11–12 December 2019; IEEE: Piscataway, NJ, USA, 2019; pp. 334–339. [Google Scholar]
- Rushin, G.; Stancil, C.; Sun, M.; Adams, S.; Beling, P. Horse race analysis in credit card fraud—Deep learning, logistic regression, and gradient boosted tree. In Proceedings of the 2017 Systems and Information Engineering Design Symposium (SIEDS), Charlottesville, VA, USA, 28 April 2017; IEEE: Piscataway, NJ, USA, 2017; pp. 117–121. [Google Scholar]
- Vynokurova, O.; Peleshko, D.; Zhernova, P.; Perova, I.; Kovalenko, A. Solving fraud detection tasks based on wavelet- neuro autoencoder. In Proceedings of the International Scientific Conference “Intellectual Systems of Decision Making and Problem of Computational Intelligence”, Zalizniy Port, Ukraine, 25–29 May 2019; Springer: Berlin/Heidelberg, Germany, 2020; pp. 535–546. [Google Scholar]
- Zheng, P.; Yuan, S.; Wu, X.; Li, J.; Lu, A. One-class adversarial nets for fraud detection. In Proceedings of the AAAI Conference on Artificial Intelligence, Philadelphia, PA, USA, 25 February–4 March 2025; Volume 33, pp. 1286–1293. [Google Scholar]
- Shapley, L.S. Notes on the n-Person Game—II: The Value of an n-Person Game; RAND Corporation: Santa Monica, CA, USA, 1951. [Google Scholar]
- Takeishi, N. Shapley values reconstruction errors of pca for explaining anomaly detection. In Proceedings of the 2019 international conference on data mining workshops (icdmw), Beijing, China, 8–11 November 2019; IEEE: Piscataway, NJ, USA, 2019; pp. 793–798. [Google Scholar]
- Takeishi, N.; Kawahara, Y. On anomaly interpretation via shapley values. arXiv 2020, arXiv:2004.04464. [Google Scholar]
- Antwarg, L.; Miller, R.M.; Shapira, B.; Rokach, L. Explaining anomalies detected by autoencoders using SHAP. arXiv 2019, arXiv:1903.02407. [Google Scholar]
- Antwarg, L.; Miller, R.M.; Shapira, B.; Rokach, L. Explaining anomalies detected by autoencoders using shapley additive explanations. Expert Syst. Appl. 2021, 186, 115736. [Google Scholar] [CrossRef]
- Olsen, L.H.B.; Glad, I.K.; Jullum, M.; Aas, K. Using shapley values and variational autoencoders to explain predictive models with dependent mixed features. arXiv 2021, arXiv:2111.13507. [Google Scholar]
- Kramer, M.A. Nonlinear principal component analysis using auto associative neural networks. AIChE J. 1991, 37, 233–243. [Google Scholar] [CrossRef]
- Makhzani, A.; Shlens, J.; Jaitly, N.; Goodfel-low, I.; Frey, B. Adversarial autoencoders. arXiv 2015, arXiv:1511.05644. [Google Scholar]
- Hejazi, M.; Singh, Y.P. One-class support vector machines approach anomaly detection. Appl. Artif. Intell. 2013, 27, 351–366. [Google Scholar] [CrossRef]
- Liu, F.T.; Ting, K.M.; Zhou, Z.-H. Isolation-based anomaly detection. ACM Trans. Knowl. Discov. Data (TKDD) 2012, 6, 1–39. [Google Scholar] [CrossRef]
- Scho, B.; Williamson, R.C.; Smola, A.; Shawe-Taylor, J.; Platt, J. Support vector method for novelty detection. Adv. Neural Inf. Process. Syst. 1999, 12, 582–588. [Google Scholar]


| Evaluation Metrics | Methods | |||
|---|---|---|---|---|
| Adversarial Autoencoder | Autoencoder | Isolation Forest | One Class SVM | |
| Accuracy | 0.9994 | 0.9878 | 0.9931 | 0.9870 |
| Precision | 0.8295 | 0.322 | 0.4695 | 0.1646 |
| Recall | 0.8008 | 0.791 | 0.4695 | 0.2439 |
| F1 Score | 0.8149 | 0.458 | 0.4695 | 0.1966 |
Disclaimer/Publisher’s Note: The statements, opinions and data contained in all publications are solely those of the individual author(s) and contributor(s) and not of MDPI and/or the editor(s). MDPI and/or the editor(s) disclaim responsibility for any injury to people or property resulting from any ideas, methods, instructions or products referred to in the content. |
© 2025 by the authors. Licensee MDPI, Basel, Switzerland. This article is an open access article distributed under the terms and conditions of the Creative Commons Attribution (CC BY) license (https://creativecommons.org/licenses/by/4.0/).
Share and Cite
Ma, S.; Hargreaves, C.A. Addressing Credit Card Fraud Detection Challenges with Adversarial Autoencoders. Big Data Cogn. Comput. 2025, 9, 168. https://doi.org/10.3390/bdcc9070168
Ma S, Hargreaves CA. Addressing Credit Card Fraud Detection Challenges with Adversarial Autoencoders. Big Data and Cognitive Computing. 2025; 9(7):168. https://doi.org/10.3390/bdcc9070168
Chicago/Turabian StyleMa, Shiyu, and Carol Anne Hargreaves. 2025. "Addressing Credit Card Fraud Detection Challenges with Adversarial Autoencoders" Big Data and Cognitive Computing 9, no. 7: 168. https://doi.org/10.3390/bdcc9070168
APA StyleMa, S., & Hargreaves, C. A. (2025). Addressing Credit Card Fraud Detection Challenges with Adversarial Autoencoders. Big Data and Cognitive Computing, 9(7), 168. https://doi.org/10.3390/bdcc9070168