Article

Fusion of Sentiment and Market Signals for Bitcoin Forecasting: A SentiStack Network Based on a Stacking LSTM Architecture

1
Department of Mechanical, Aerospace and Civil Engineering, The University of Manchester, Manchester M13 9PL, UK
2
The Bartlett Faculty of the Built Environment, University College London, London WC1E 6BT, UK
3
School of Economics and Finance, Queen Mary University of London, London E1 4NS, UK
*
Authors to whom correspondence should be addressed.
These authors contributed equally to this work.
Big Data Cogn. Comput. 2025, 9(6), 161; https://doi.org/10.3390/bdcc9060161
Submission received: 11 April 2025 / Revised: 30 May 2025 / Accepted: 16 June 2025 / Published: 19 June 2025

Abstract

:
This paper proposes a comprehensive deep-learning framework, SentiStack, for Bitcoin price forecasting and trading strategy evaluation by integrating multimodal data sources, including market indicators, macroeconomic variables, and sentiment information extracted from financial news and social media. The model architecture is based on a Stacking-LSTM ensemble, which captures complex temporal dependencies and non-linear patterns in high-dimensional financial time series. To enhance predictive power, sentiment embeddings derived from full-text analysis using the DeepSeek language model are fused with traditional numerical features through early and late data fusion techniques. Empirical results demonstrate that the proposed model significantly outperforms baseline strategies, including Buy & Hold and Random Trading, in cumulative return and risk-adjusted performances. Feature ablation experiments further reveal the critical role of sentiment and macroeconomic inputs in improving forecasting accuracy. The sentiment-enhanced model also exhibits strong performance in identifying high-return market movements, suggesting its practical value for data-driven investment decision-making. Overall, this study highlights the importance of incorporating soft information, such as investor sentiment, alongside traditional quantitative features in financial forecasting models.

1. Introduction

Originally introduced in 2008 as a decentralized peer-to-peer payment system, Bitcoin [1] sought to overcome the limitations of conventional financial transactions that rely on trust. Since then, it has transformed into a widely traded digital asset, active in over 16,000 global markets. Although often promoted as an alternative to traditional currencies, Bitcoin’s role remains ambiguous. Many view it not as money but as a speculative vehicle, reminiscent of the tech-stock boom of the early 2000s [2]. Even before it began influencing mainstream financial systems, Bitcoin’s rapid growth attracted considerable attention from the public and policymakers alike.
The debate over Bitcoin’s valuation continues to revolve around two fundamental questions: What underpins its value, and what influences its price? Within the landscape of emerging financial technologies, Bitcoin’s worth is often linked to investor sentiment and perceived potential [3]. This has led to a growing body of research focused on identifying the key variables that shape its price. Given Bitcoin’s notorious volatility, predicting its price has proven to be a challenging task. While traditional equity markets have long utilized high-frequency data for forecasting, similar efforts in the context of cryptocurrencies are still evolving. Recent work has turned to machine learning to close this gap, applying models that have already demonstrated strong predictive power in sectors like finance [4] and manufacturing [5].
One of the central challenges in predictive modeling for Bitcoin is determining which features offer the most insight [6]. Previous studies [7] rely heavily on expert-driven variable selection, often overlooking broader dimensions of data. Our research aims to expand this scope by incorporating both theoretical and data-driven perspectives. For instance, metrics such as media search volume serve as useful indicators of public interest and speculative pressure. Additionally, due to its perceived similarity to gold as a store of value, we include spot gold prices to provide a comparative context. By integrating market trends, transactional data, network statistics, and macroeconomic signals, we construct a comprehensive feature set that enhances predictive depth.
The PreBit model combined a support vector machine trained on price data with a convolutional neural network that processed tweets using FinBERT embeddings, which were pretrained on financial lexicons. This architecture enabled the model to interpret tweet content in a domain-specific manner and predict extreme Bitcoin price movements [8]. FinAgent expanded on this by integrating textual, numerical, and visual data through a market intelligence module. It incorporated memory and reflection mechanisms to support adaptive decision-making and employed a tool-augmented framework that allowed interaction with trading systems and expert input to refine its strategies [9]. Chen et al. [10] developed a trading system based on multimodal deep reinforcement learning, which combined stock price data with sentiment signals extracted from financial news. This approach significantly outperformed traditional models that relied solely on price information by capturing the dynamic influence of news on market behavior. Similarly, Anbaee Farimani et al. [11] introduced an adaptive multimodal learning model that integrated market data, news content, and sentiment analysis, resulting in a substantial reduction in prediction error compared to conventional forecasting methods.
Table 1 presents a comparative evaluation of recent multimodal machine-learning models applied to cryptocurrency price prediction, highlighting consistent patterns across diverse methodological approaches. A key finding is that multimodal models substantially outperform traditional unimodal or price-only baselines. For instance, the PreBit model, which integrates Twitter sentiment data using FinBERT embeddings, significantly enhances predictive accuracy in detecting extreme price shifts, outperforming conventional models reliant on technical indicators alone [8]. Similarly, FinAgent, a foundation model equipped with multimodal memory and reflection modules, demonstrated an average of 36% improvement in profit over twelve State-of-the-Art baselines, including a 92.27% return in a specific scenario [9]. These results underscore the value of combining text, price, and blockchain data to capture the complex, non-linear dynamics of cryptocurrency markets.
The discussion reveals that models incorporating advanced deep-learning architectures and attention mechanisms—such as the Attentive and Regularized Deep-Learning (ARDL) framework and the SAM-LSTM model—achieve superior performance by effectively learning from heterogeneous data modalities [12,22]. Reinforcement learning models integrated with blockchain features, such as in the case of Shahbazi and Byun’s work on Litecoin and Monero, also showed enhanced prediction accuracy compared to classical ML techniques [21]. Moreover, sentiment analysis emerged as a pivotal component across most models, with multiple studies validating the predictive utility of Twitter and news-based sentiment scores, especially when derived from pretrained domain-specific NLP models like FinBERT and BERT [8,10,21].
However, limitations persist. Some studies note that sentiment variables, particularly those used in isolation or in linear regression settings, do not consistently explain short-term price fluctuations, suggesting the need for non-linear and time-aware modeling strategies [24]. Furthermore, model effectiveness appears sensitive to data frequency: for instance, Chen et al. found that simpler statistical models outperformed complex ML models for daily Bitcoin price predictions, whereas high-frequency datasets benefited more from LSTM and XGBoost approaches [15]. This indicates the importance of aligning model complexity with data granularity.
In Che et al. [12], attention heatmaps and model output plots highlight how tailored attention mechanisms across financial indicators, firm reports, and interfirm networks enable the model to prioritize relevant information, leading to significantly improved financial distress prediction. Daiya and Lin [13] present performance curves and portfolio value trajectories of their Trans-DiCE architecture, where the Transformer-based model achieves notable gains in prediction accuracy and Sharpe Ratio, outperforming State-of-the-Art baselines across multiple market benchmarks. Sheng et al. [14] visually demonstrate improvements in balanced accuracy and portfolio returns when market, sentiment, and graph-based data are integrated through multimodal learning, emphasizing the added value of combining textual and structural features.
In the cryptocurrency domain, Chen et al. [15] plot the differential performance of daily versus high-frequency models, revealing that simple statistical models excel on daily data, while LSTM and tree-based methods like XGBoost achieve higher accuracy on high-frequency (5-min) datasets. Lee and Yoo [16] illustrate how cross-market multimodal data fusion between the U.S. and Korean markets enhances prediction robustness, as seen in their comparative accuracy charts. Windsor and Cao [26] graph performance boosts achieved by their deep fusion of LSTM and BERT, particularly in reducing forecasting errors in USD/CNY exchange rate prediction.
Further graphical analyses by D’Amato et al. [18] show how the Jordan Neural Network (JNN) outperforms SETAR and other autoregressive models by capturing feedback loops visualized through forecast error reductions and volatility response plots. Fang et al. [19] depict how LSTM models trained on high-frequency data consistently predict mid-price changes across multiple cryptocurrencies with ~78% accuracy, as visualized through confusion matrices and ROC curves. In Chen et al. [20], accuracy curves and comparative error metrics demonstrate that incorporating economic and technological determinants into LSTM networks improves Bitcoin exchange rate forecasting beyond traditional models.
Shahbazi and Byun [21] visualize how their Reinforcement Learning model, when embedded in a blockchain environment, achieves lower prediction errors and faster convergence relative to standard machine-learning models. Kim et al. [22] illustrate the effectiveness of the SAM-LSTM model by highlighting its ability to integrate on-chain data, shown through sharp reductions in RMSE and improved directional accuracy in price forecasting. Jaquart et al. [23,24] present clear performance disparities between ensemble models (LSTM/GRU) and benchmark strategies in statistical arbitrage and short-term predictions. However, they also plot negative returns after transaction costs, supporting the efficient market hypothesis, particularly in high-frequency trading environments. Finally, Kim et al. [25] demonstrate, through feature importance and model contribution graphs, how Ethereum-specific blockchain features (e.g., gas usage, uncle blocks) substantially contribute to price prediction accuracy when compared to models using only market data.
In conclusion, the findings from Table 1 collectively emphasize that multimodal fusion—especially when leveraging advanced neural architectures, ensemble strategies, and sentiment-aware models—significantly enhances cryptocurrency market forecasting. The reviewed models demonstrate that integrating diverse inputs such as price series, macroeconomic variables, blockchain data, and sentiment signals offers superior robustness and interpretability. Future research should prioritize hybrid frameworks that combine temporal modeling (e.g., LSTM, Transformer), semantic understanding (e.g., BERT-based sentiment analysis), and model stacking for holistic market behavior analysis. Additionally, a focus on real-time adaptability and feature interpretability will be vital to improving model reliability and user trust in live trading applications. Most existing studies using social media data rely on title-level or post-level sentiment features and simple metadata such as post counts, often extracted using general tools like VADER [27], word2vec [28], or BERT [29], which struggle to interpret domain-specific financial language and contextual nuance. In contrast, this study used the DeepSeek model [30] to process full-text inputs and generate sentiment scores with polarity and intensity, enabling more accurate and context-aware sentiment analysis that improves predictive performance.
In this study, we aimed to address the following research questions: Can the integration of multimodal data, including market indicators, macroeconomic variables, and sentiment signals, significantly enhance the performance of Bitcoin price forecasting models? It was hypothesized that embedding sentiment features derived from financial news and social media enhanced the model’s responsiveness to extreme market movements, particularly sharp price movements. Additionally, it was assumed that multimodal forecasting would yield more effective real-world trading outcomes, producing higher cumulative returns and improved risk-adjusted performance relative to baseline strategies such as Buy & Hold or Random Execution. These hypotheses informed the architectural design of the proposed SentiStack framework, the configuration of the experimental setup, and the interpretation of empirical results.
In summary, this study investigates how integrating multimodal data—including market statistics, macroeconomic indicators, and sentiment analysis—can enhance the prediction of Bitcoin price dynamics using machine-learning models. Specifically, we examine the predictive contributions of distinct feature categories through a comprehensive feature ablation framework, employing both traditional ensemble models and advanced deep-learning architectures such as LSTM and Stacking-LSTM. By evaluating the performance of each feature group in isolation and in combination, we aim to identify which types of information most significantly impact forecasting accuracy. This research contributes to a better understanding of the informational drivers of cryptocurrency price movements and offers a scalable approach for optimizing feature selection in financial prediction models.

2. Methodology

2.1. Dataset

In this study, A comprehensive multidimensional dataset consisting of 2645 daily observations spanning from 1 January 2018 to 28 March 2025 was collected. It integrates market data, sentiment analysis from influential Twitter accounts, the Crypto Fear and Greed Index, macroeconomic indicators (GDP, CPI, unemployment rates), and daily real-time cryptocurrency statistics sourced from Bitstamp. This robust dataset, containing 70 distinct features, provides a rich foundation for analyzing Bitcoin price dynamics.
Macroeconomic data were obtained from the Federal Reserve Economic Data (FRED), including GDP, CPI, and unemployment rates. These indicators offered essential context on broader economic conditions that influence cryptocurrency markets. News data were sourced from major financial and crypto media outlets, such as CoinDesk and Yahoo Finance, and were aggregated through CryptoPanic to ensure coverage of time-sensitive developments.
The dataset also included real-time cryptocurrency prices and statistics from Bitstamp, providing granular price-level information. Automated content feeds and direct posts from Twitter contributed to maintaining a continuous stream of market-relevant information. This multidimensional data collection strategy integrated short-term signals from social platforms and news media with macro-level economic trends to construct a detailed and dynamic view of the factors shaping Bitcoin price behavior. This method provides a robust framework for understanding the complex interplay of internal market forces and external economic indicators in the cryptocurrency domain. The data summary is in Table 2.
The input feature set incorporated variables from three main data modalities: (1) market indicators (including Bitcoin open, high, low, close, volume, 7-day and 30-day moving averages, volatility, and momentum measures such as MACD, RSI, and Bollinger Bands); (2) macroeconomic variables (US GDP, CPI, unemployment rate, federal funds rate); and (3) sentiment scores derived from DeepSeek analysis of both Twitter and financial news text. Each feature was normalized and aligned on a daily frequency. The model architecture used three lagged observations (t − 3, t − 2, t − 1) as inputs for predicting the next day’s Bitcoin closing price. This lag structure was selected based on empirical cross-validation results, which showed that short lags captured the strongest temporal dependencies for daily price forecasting while minimizing overfitting and computational costs. Preliminary experiments with longer lag windows (e.g., 5, 10, or 30 days) did not yield improved performance and, in some cases, increased model variance. The dataset was divided into training and testing sets using a chronological 70/30 split, ensuring that all training data preceded the test data in time and that no look-ahead bias was introduced. This approach was designed to accurately reflect realistic forecasting scenarios in financial markets.
The outputs of these analyses include price predictions for future stock prices and cryptocurrency exchange rates, market trend analysis predicting trends such as rising, falling, or stability, risk assessment forecasting the possibility of market crashes or financial crises, investment decision support providing buy, hold, or sell recommendations based on prediction results, and volatility analysis forecasting the price volatility of the market or specific assets.
Figure 1 demonstrates how Bitcoin’s closing prices are correlated with their past values over different time lags. The autocorrelation of Bitcoin closing prices demonstrates a strong persistence across different time lags, indicating that past prices are a good predictor of future prices in the short term. For instance, the autocorrelation coefficient at a lag of 1 day is approximately 0.999, and it remains high (above 0.994) even at a lag of 5 days. This high level of autocorrelation suggests that Bitcoin prices are highly dependent on their immediate past values, which is typical for many financial time series, reflecting momentum and the tendency for prices to continue moving in their current direction. Such information is crucial for financial modeling and forecasting, where the assumption of a strong influence from recent past prices can significantly enhance prediction models. This initial drop is typical of the financial time series, reflecting that prices on consecutive days are highly similar but become less predictive as the gap widens.
The autocorrelation coefficient drops below zero around a lag of 500 days, suggesting that prices at this lag are inversely correlated with current prices. This could be indicative of cyclical behaviors where certain trends might repeat but inversely. The curve then oscillates around zero, which indicates no correlation. It is crucial to note that the confidence intervals (dashed lines) suggest that many of the fluctuations in autocorrelation from about 500 days onward are not statistically significant, as they fall within these bounds. The significant drop in autocorrelation as the lag increases confirms that Bitcoin’s price movements are primarily influenced by more recent events. The initial high autocorrelation for short lags indicates that Bitcoin prices are not random but rather exhibit momentum. The long-term crossing into negative values and oscillations around zero suggest that any predictive power from past prices diminishes as the timeframe extends. This analysis underpins the importance of focusing on more recent data when modeling Bitcoin prices due to their volatile and non-stationary nature. Furthermore, it highlights the challenges in using historical prices for long-term predictions in such a dynamic market.
To analyze the interrelationships between Bitcoin (BTC) prices and a range of financial, macroeconomic, and sentiment indicators, we employed a correlation heatmap methodology using Pearson correlation coefficients. This involved first selecting a subset of key numerical variables—including BTC closing prices, traditional market indices (S&P 500, DJIA), commodity prices (WTI crude oil, gold), macroeconomic metrics (GDP, Federal Funds Rate, CPI, Unemployment Rate), and sentiment scores (daily counts of positive, neutral, and negative news). All time series were aligned by date, and rows containing missing values were excluded to ensure data consistency. The correlation matrix was computed to quantify the linear relationships between variables, with values ranging from −1 (perfect negative correlation) to +1 (perfect positive correlation). The matrix was then visualized using a heatmap to highlight the strength and direction of each bivariate relationship, with annotated coefficients for interpretability. This approach enabled a comprehensive assessment of how various external factors co-move with Bitcoin, serving as a foundation for further feature selection and predictive modeling.
This heatmap Figure 2 visualizes the correlations among Bitcoin closing prices, key financial indices, macroeconomic indicators, and daily sentiment scores. The correlation heatmap analysis reveals that Bitcoin (BTC) demonstrates a moderate positive correlation with traditional equity indices like the S&P 500 and DJIA, suggesting that Bitcoin is increasingly moving in tandem with broader financial markets. This alignment may be partly explained by the adoption of Bitcoin by publicly traded companies—such as MicroStrategy and Tesla—that have integrated cryptocurrency into their balance sheets, thereby linking Bitcoin’s performance with their stock valuations. The S&P 500’s rising correlation with Bitcoin also reflects the growing institutional acceptance of Bitcoin as an alternative asset class, especially since 2017, when its price began to mirror broader equity trends more closely. In contrast, Bitcoin is negatively correlated with the VIX, a market volatility index often referred to as the “fear gauge.” This is consistent with its risk-on nature—when market fear rises (high VIX), investors typically reduce exposure to speculative assets like Bitcoin. However, Bitcoin’s behavior during volatility spikes can be erratic, acting as either a risk asset or a hedge, depending on the context.
Regarding macroeconomic indicators, GDP and CPI (CPIAUCSL) show weak to moderate correlations with Bitcoin, suggesting that while macro fundamentals like economic growth and inflation influence market sentiment, their effects on Bitcoin may be delayed or indirect. For instance, rising CPI—often interpreted as inflation—may drive investors toward Bitcoin as a potential hedge, while GDP growth might foster greater investment appetite in risk assets.
Federal Funds Rate (FEDFUNDS) and Unemployment Rate (UNRATE) show a relatively low correlation with Bitcoin, but conceptually, rising interest rates reduce the attractiveness of non-yielding assets like BTC, while higher unemployment could indicate weaker economic conditions, lowering risk tolerance for speculative assets. Finally, sentiment indicators—daily counts of positive, neutral, and negative news—exhibit low linear correlation with Bitcoin prices yet may still hold predictive power in non-linear modeling contexts. For example, sudden spikes in positive media coverage have historically triggered short-term price movement, while regulatory fears or negative headlines have led to sharp declines, underscoring the importance of sentiment as a reactive force rather than a direct linear driver of Bitcoin price behavior.
BTC and Dow Jones Industrial Average (DJIA): The observed strong correlation between BTC and DJIA may stem from several factors. Notably, some publicly traded companies have incorporated Bitcoin into their treasury reserves, effectively linking their financial performance to the cryptocurrency’s value. For instance, MicroStrategy, a business intelligence firm, has significantly invested in Bitcoin, influencing its stock performance and potentially contributing to the correlation with broader market indices like the DJIA.
Financial Times BTC and S&P 500: Similar to the DJIA, the S&P 500 has shown an increasing correlation with Bitcoin in recent years. This trend may be attributed to the growing acceptance of Bitcoin as an alternative asset class among institutional investors, leading to synchronized movements between Bitcoin and traditional equity markets. A study highlighted that since 2017, Bitcoin’s price has exhibited a stronger correlation with major stock indices, reflecting its integration into the broader financial ecosystem. BTC and Gold: Bitcoin is often referred to as “digital gold” due to its perceived store of value properties. However, studies have shown that the correlation between Bitcoin and gold has varied over time, sometimes aligning during periods of economic uncertainty as investors seek alternative assets. Nonetheless, the overall correlation remains inconsistent, suggesting that while both assets serve as hedges, they may respond differently to market dynamics. BTC and Oil Prices: The relationship between Bitcoin and oil prices appears to be minimal. Bitcoin operates independently of traditional energy markets, and while fluctuations in oil prices can influence global economic conditions, direct correlations with Bitcoin are not strongly evident. BTC and U.S. Dollar Index (USDX): An inverse relationship is often observed between Bitcoin and the U.S. Dollar Index. As the dollar weakens, investors may turn to alternative assets like Bitcoin, driving its price up. Conversely, a strengthening dollar can lead to decreased demand for Bitcoin. This dynamic reflects Bitcoin’s role as a hedge against fiat currency fluctuations. BTC and Volatility Index (VIX): The correlation between Bitcoin and VIX, which measures market volatility, is complex. During periods of high market uncertainty, Bitcoin’s behavior can be unpredictable, sometimes acting as a risk-on asset and other times as a safe haven. This inconsistent relationship indicates that Bitcoin’s response to market volatility is influenced by a multitude of factors, including investor sentiment and macroeconomic conditions. Bitcoin’s relationship with macroeconomic indicators reveals nuanced interactions that reflect broader investor behavior and market sentiment. The correlation between Bitcoin and GDP appears relatively weak; however, during periods of economic growth, investors tend to have higher risk tolerance, often allocating capital to speculative assets like Bitcoin, potentially driving its price upward. Conversely, during recessions, risk aversion typically leads investors to favor safer, more stable assets, reducing demand for cryptocurrencies. In terms of the Federal Funds Rate (FEDFUNDS), when the U.S. Federal Reserve raises interest rates, the yields on traditional financial instruments become more attractive, making non-yielding assets like Bitcoin less desirable. Lower interest rates, on the other hand, may enhance Bitcoin’s appeal as a store of value. Regarding the Consumer Price Index (CPI), which measures inflation, some investors perceive Bitcoin as a hedge against inflation. Therefore, rising CPI figures can lead to increased interest in Bitcoin as a protective asset, boosting its price. The Unemployment Rate (UNRATE) also plays a role; high unemployment typically signals economic distress, reducing risk appetite and potentially diminishing investment in volatile assets like Bitcoin. However, this relationship is often influenced by other macro and microeconomic factors and may not always be consistent. Finally, market sentiment has a pronounced effect on Bitcoin’s price. Positive sentiment and media coverage—such as Tesla’s announcement to accept Bitcoin as payment—have historically triggered price movement, while negative sentiment or regulatory concerns have led to sharp declines. These dynamics underscore the multifaceted and evolving nature of Bitcoin’s economic correlations.
To better understand the structure of Bitcoin’s price movements, we applied seasonal decomposition using a multiplicative model, which assumes the observed time series is a product of its trend, seasonal, and residual components. In Figure 3, the data was preprocessed by converting the index to daily frequency and forward-filling missing values. Using a 365-day period to capture annual seasonality, we employed centered moving averages to extract the trend, seasonal averaging to isolate recurring patterns, and calculated residuals by dividing the observed values by the product of trend and seasonal components. The results revealed a strong and clear upward trend in Bitcoin prices, especially starting in 2020, peaking in late 2021, and declining through 2022—a pattern that closely aligns with post-COVID bull markets and subsequent corrections in global financial markets. The seasonal component captured systematic intra-year changes (such as holiday effects or behavioral cycles), but in the case of Bitcoin, seasonality was relatively weak, likely because Bitcoin is a globally traded asset that operates 24/7, lacking strong calendar-based patterns like traditional equities or commodities. The residual component, which represents what remains after removing trend and seasonality, showed significant noise and volatility—this reflects unpredictable market events, news shocks, and speculative investor behavior, all of which are common in the cryptocurrency market. Overall, the decomposition indicates that Bitcoin’s price dynamics are dominated by long-term trends and irregular fluctuations, with minimal seasonal influence, suggesting that forecasting models should emphasize trend and residual behavior rather than rely on seasonality.
The stationarity test on the Bitcoin price series, using the Augmented Dickey–Fuller (ADF) test, aimed to determine its suitability for time series forecasting models that require stationary input. The initial ADF test produced a test statistic of −0.777 and a p-value of 0.826, with critical values at −3.434 (1%), −2.863 (5%), and −2.568 (10%). This high p-value, far above the common thresholds (0.01, 0.05, 0.10), and a test statistic that did not exceed (i.e., was not more negative than) any of the critical values, led to the conclusion that the Bitcoin price series was non-stationary. To correct this, we computed the first difference of the series to remove trends and stabilize the variance.
In Figure 4, visual inspection of the differenced series showed less trend and more stability around a mean of zero, indicating successful trend removal. The ADF test on the first-differenced series yielded a test statistic of −7.384544 and a p-value of approximately 8.30 × 10⁻¹¹, with critical values of −3.434 (1%), −2.863 (5%), and −2.568 (10%). This extremely low p-value and a test statistic more negative than all critical thresholds strongly support the rejection of the null hypothesis, confirming that the first-differenced series is stationary. This transformation validates the use of ARIMA-type models, ensuring that future predictive modeling is built on statistically robust foundations. The first-order difference is used in the subsequent ARIMA model.

2.2. Data Cleaning

The data cleaning process in this study was designed to handle the complexity and heterogeneity of multimodal datasets, particularly those combining numerical market data and unstructured text data from social media and news platforms as shown in Algorithm 1. A key initial method employed was forward filling or carry-forward last observation. This technique was used to address gaps in macroeconomic indicators that are often reported monthly or quarterly. By propagating the last known value forward until a new value appears, this method allowed the researchers to convert these sparse datasets into a consistent daily format. This approach is common in financial time-series forecasting, as it preserves continuity and enables alignment with daily trading data.
In the context of social media analysis, particularly Twitter, the data cleaning process was more elaborate due to the unstructured nature of the content. User metadata such as usernames, locations, and non-relevant attributes were removed, focusing solely on the tweet content. Textual preprocessing included transforming all text to lowercase and removing URLs, hashtags, mentions, and retweet markers to standardize the text for natural language processing tasks. To ensure analytical relevance, only tweets from users with a high number of followers were retained under the assumption that these accounts were more influential and less likely to contribute irrelevant or low-quality content.
Further refinement involved temporal standardization and alignment. All datasets—including social media, news articles, and market trading data—were synchronized to a daily frequency. This step was critical to ensure accurate temporal matching of sentiment indicators with corresponding price fluctuations. It enabled the model to capture real-time investor sentiment and its potential impact on market behavior with high temporal fidelity.
Finally, the cleaned and processed sentiment data were saved in structured formats such as CSV files, which facilitated downstream tasks, including model training, evaluation, and visualization. This organized and methodical cleaning framework ensured that all relevant datasets were harmonized and purified, enabling the deployment of robust, multimodal predictive models.
Algorithm 1. Workflow of data cleaning and preprocessing for Multimodal Bitcoin Price Forecasting
Inputs:
        Raw market data (Price, Volume, Technical indicators)
        Raw macroeconomic data (GDP, CPI, Unemployment, Interest Rates)
        Raw textual data (Twitter posts, Financial news)
Outputs:
        Cleaned and aligned multimodal dataset ready for modeling
Procedure:
        1. Load Raw Data:
                -Load market data from Bitstamp (prices, volumes, OHLCV)
                -Load macroeconomic data from FRED (GDP, CPI, Unemployment Rate, Interest Rate)
                -Load textual data from Twitter API and financial news platforms
        2. Market Data Cleaning:
                For each feature in market data:
                        If missing values exist:
                                -Forward-fill missing values
                                -If forward-fill impossible (no previous value), backward-fill
        3. Macroeconomic Data Cleaning:
                For each macroeconomic indicator:
                        -Convert quarterly/monthly frequency to daily:
                                For each missing daily value:
                                        -Forward-fill the last known monthly/quarterly value
                                        -Ensure all days have consistent values
        4. Textual Data Cleaning (Twitter/News):
                For each text entry (tweets/news articles):
                        -Remove URLs, special characters, emojis, hashtags, mentions
                        -Convert text to lowercase
                        -Remove posts containing promotional terms ("giveaway", "cashback", etc.)
                        -Exclude tweets from users with fewer than 10 followers
                        -Tokenize and preprocess text for DeepSeek model
                Generate sentiment embeddings:
                        -Apply DeepSeek model to cleaned texts
                        -Extract sentiment scores (polarity and intensity)
        5. Data Alignment and Synchronization:
                -Align market data, macroeconomic data, and sentiment data on a daily timestamp
                -Drop dates with incomplete data across modalities, if any remain
        6. Feature Engineering:
                -Generate lagged variables (t − 1, t − 2, t − 3) from market and macroeconomic data
                -Calculate technical indicators (e.g., SMA, EMA, RSI, MACD, Bollinger Bands)
                -Construct feature matrix with numerical and sentiment features
        7. Data Normalization:
                -Apply Min–Max scaling or Z-score normalization to numerical features
        8. Save cleaned data:
                -Export final cleaned and normalized dataset to CSV files
Return:
        Cleaned and structured dataset suitable for machine-learning models

2.3. Feature Engineering

This section outlines the engineering strategies employed to transform raw data into structured inputs. Table 3 summarizes the types of feature engineering techniques applied in this study, detailing the category, specific methods used, and their purpose within the Bitcoin forecasting framework. The Relative Strength Index (RSI) was computed to measure recent price momentum by comparing the magnitude of recent gains to losses over a fixed period (commonly 14 days), signaling overbought or oversold conditions. The Simple Moving Average (SMA) and Exponential Moving Average (EMA) were calculated to smooth price trends over time, with EMA giving more weight to recent prices. The Moving Average Convergence Divergence (MACD) and its Signal Line were generated by subtracting the 26-period EMA from the 12-period EMA and then smoothing the result with a 9-period EMA, used to identify bullish and bearish crossovers. Bollinger Bands (Upper and Lower) were constructed around a 20-day SMA with ±2 standard deviations to indicate volatility and potential price breakouts. VWAP (Volume Weighted Average Price) integrates price and volume to represent the average trading price weighted by volume, often used for intraday trend confirmation. On-Balance Volume (OBV) was derived by cumulatively adding or subtracting trading volume based on whether the closing price rose or fell, indicating buying or selling pressure. Lastly, the Average True Range (ATR) was computed to measure market volatility by averaging the true range (max of high-low, high-previous close, or low-previous close) over a defined window. All indicators were calculated using standard technical analysis formulas applied to the Bitcoin daily open, high, low, close, and volume data.
The Fear and Greed Index (FG) was included as a scalar measure reflecting market sentiment on a daily basis. This index ranges from 0 to 100, where values closer to 0 indicate extreme fear and values near 100 represent extreme greed. It is derived from a weighted aggregation of factors, including market volatility, momentum, social media sentiment, surveys, and trading volume. This indicator has been widely used as a proxy for market psychology and is particularly relevant in the context of cryptocurrency markets, where investor sentiment can drive large price movements. In parallel, we employed a news-based sentiment scoring system, which classifies financial news articles into positive, neutral, or negative categories using natural language processing techniques.
DeepSeek V2 [31] was well suited for financial sentiment analysis and fear and greed index construction due to its architecture, which combines the Multihead Latent Attention and Mixture-of-Experts modules to process long and complex financial texts with contextual precision, as illustrated in Figure 5. Its strong performance in few-shot and in-context learning, along with its ability to extract structured sentiment outputs such as polarity, intensity, and emotion vectors, enabled effective aggregation with market indicators to quantify investor sentiment [32].
In Algorithm 2, a structured pipeline was developed to perform sentiment analysis and construct a fear and greed index using the DeepSeek-v2 model, as outlined in Table 3. This pipeline processed full-text inputs from news articles, financial media, and social platforms. Initially, text preprocessing was conducted by removing URLs, emojis, mentions, and irrelevant symbols, followed by tokenization and normalization to ensure compatibility with DeepSeek’s input format. The cleaned text was then input into the DeepSeek model, generating semantic embeddings. These embeddings produced sentiment scores categorized as positive, neutral, or negative. Subsequently, sentiment scores were integrated with market indicators—including volatility measures, momentum indicators, and normalized trading volume—to calculate the Fear and Greed Index. Finally, a smoothing operation, such as a moving average, was applied to the FG values to reduce noise and more clearly highlight trends in market sentiment over time.
Algorithm 2. Workflow of preparing multimodal sentiment data from DeepSeek
Input:
        NewsCorpus ← Collection of news and social media articles (raw text)
        MarketIndicators ← Time-series data (price, volume, volatility, etc.)
Output:
        SentimentScores ← Scored sentiment signals
        FG Index ← Composite Fear & Greed index over time
1:     Initialize DeepSeek model with pretrained weights
2:     for each document in NewsCorpus do
3:             Clean the text (remove URLs, emojis, special tokens)
4:             Tokenize and normalize text for model input
5:             Feed text into DeepSeek to obtain:
6:                     sentiment_score ∈ [−1, 1]    //sentiment polarity
7:                     polarity_label ∈ {Positive, Neutral, Negative}
8:                     intensity ∈ {Mild, Moderate, Strong}
9:                     confidence ∈ [0, 1]
10:          Store results in SentimentScores table with timestamp
11: end for
12: Aggregate SentimentScores by time period (e.g., daily average)
13: Merge aggregated sentiment with MarketIndicators:
14:          -Normalize metrics (volume, RSI, MACD, volatility)
15:          -Apply weighting scheme to components
16:          -Define FG_Index_t = w1 * Sentiment_t + w2 * Volatility_t
                                                      + w3 * Momentum_t + w4 * Volume_t
17: Smooth FG_Index using moving average
18: Output FG_Index and aligned sentiment series
Return: Sentiment Scores, Fear and Greed Index

2.4. Algorithm Framework

This study employed data fusion techniques to integrate structured numerical indicators and unstructured sentiment data, enabling the model to learn complex relationships across diverse modalities for Bitcoin price forecasting.
Feature-level fusion was adopted by concatenating market, macroeconomic, technical, and sentiment features into a unified matrix, allowing models to learn joint representations across domains. This approach enabled deep architectures like LSTM and Stacking-LSTM to capture cross-modal dependencies from the start of training. Features were organized into semantic groups such as technical, macroeconomic, and sentiment features to improve interpretability and support ablation analysis of their predictive contributions.
Additionally, sentiment-enhanced fusion was implemented by incorporating sentiment features extracted from full-text financial news and social media using DeepSeek. These sentiment signals, including sentiment scores and the Fear and Greed Index, were integrated alongside traditional numerical features. This multimodal fusion enabled the model to consider both quantitative market trends and qualitative investor sentiment, providing a richer and more informative input structure for forecasting.
Late fusion was realized using a Stacking-LSTM structure, where separate LSTM models trained on different features were combined via a Ridge regression meta-learner to capture complementary patterns and enhance robustness.
The combined use of early fusion, late fusion, and multimodal integration provided a robust and flexible modeling framework. They enabled the proposed system to leverage the full informational depth of diverse data sources, resulting in improved forecasting accuracy and more consistent performance across backtesting scenarios. The schematic graph is shown in Figure 6.
Table 4 presents a comparative overview of the machine-learning and deep-learning models used for forecasting Bitcoin prices, highlighting their types, key hyperparameters, and tuning strategies. The models include traditional algorithms like Random Forest and XGBoost and more complex neural architectures, such as LSTM (Long Short-Term Memory), LSTM with Attention, and Stacking LSTM ensembles. The traditional Random Forest and XGBoost models were fine-tuned using GridSearchCV with 10-fold time-series cross-validation, allowing robust parameter selection in a structured environment. They offer good interpretability and are generally faster to train than deep-learning models. On the other hand, the LSTM variants were trained using the Keras API with Keras Tuner for automated hyperparameter optimization in more advanced configurations. While LSTM models can capture temporal dependencies well, they are more sensitive to hyperparameter choices and require proper normalization and sequence shaping.
Prior to model training, features were normalized to ensure effective integration into our predictive models. We utilized ensemble learning strategies such as Bagging, Boosting, and Stacking to integrate predictions from base models, including Random Forests, eXtreme Gradient Boosting (XGBoost) Machines, and Long Short-Term Memory.
In conclusion, traditional models like XGBoost provide a strong baseline with less complexity, while LSTM-based models offer deeper temporal insight but demand more careful tuning. The inclusion of attention mechanisms or stacking improves LSTM performance marginally but with increased computational cost.
The pseudocode Algorithm 3 outlines a comprehensive, multi-model backtesting workflow designed for forecasting Bitcoin prices using machine learning. The algorithm starts by setting a random seed to maintain reproducibility. It then processes the dataset by cleaning and forward-filling missing values, followed by the creation of lagged features to capture temporal dependencies. Technical indicators such as Simple Moving Average (SMA), Exponential Moving Average (EMA), and volatility are computed to enrich the feature set. Categorical features, particularly sentiment data, are encoded to make them compatible with machine-learning algorithms. The data is split into features and the target variable (Bitcoin closing price), excluding date and target from the predictors.
The dataset is divided chronologically into training and testing sets in a 70/30 ratio to reflect the temporal nature of the financial time series. A model is then selected from a diverse pool that includes both traditional (Random Forest, XGBoost) and deep-learning models (LSTM variants with and without attention and stacking ensembles). Model optimization involves a thorough process of hyperparameter tuning using GridSearchCV combined with a TimeSeriesSplit for validation. The input data is normalized and reshaped appropriately, particularly for LSTM-based models that require a specific 3D input format. After training, predictions are made and inverse-transformed to original price scales for evaluation.
Model performance is assessed using standard regression metrics: Root Mean Squared Error (RMSE), Mean Absolute Error (MAE), Mean Absolute Percentage Error (MAPE), and R-squared (R2). Beyond these, the algorithm also evaluates the model’s capability to predict a 5% movement in price, simulates trading strategies based on those signals, and computes associated returns. These strategies range from threshold-based rules to more complex Multi-Factor models and baseline approaches like Buy & Hold and Random Strategies. Cumulative returns from each strategy are visualized to compare their effectiveness over time.
Finally, a feature ablation study is conducted to determine the relative importance of different feature groups—namely Market, Technical, Sentiment, Macro, and Index variables. By rerunning models on these subsets and evaluating their performance using the same regression metrics, the workflow identifies which types of information contribute most to model accuracy. These results are visualized through horizontal bar plots, providing clear insights into the value of each feature category. This entire workflow ensures a robust, interpretable, and data-driven approach to forecasting and strategizing within the volatile landscape of Bitcoin trading.
Algorithm 3. Workflow for back testing and finding the optimal machine-learning model
1:     Set random seed to ensure reproducibility
2:     Load dataset, clean and forward-fill missing values
3:     Create lagged features (t − 1, t − 2, t − 3)
4:     Compute technical indicators: SMA, EMA, Volatility
5:     Encode categorical features (e.g., Sentiment)
6:     Split data:
          └─ Features ← All columns except Date & btc Close
          └─Target        ← btc Close
7:     Chronologically split into training and testing sets (70%/30%)
8:     Select model from:
          {‘random_forest’, ‘xgboost’, ‘lstm’, ‘lstm_attention_model’,
            ‘stacking_lstm’, ‘lstm_attention_tuned’}
9:     model optimization:
              └─ Perform GridSearchCV with TimeSeriesSplit (10-fold)
              └─ Normalize and reshape to (samples, timesteps, features)
              └─ Build and train the architecture
              └─ Predict and inverse transform
10:  Evaluate model on test set using:
              └─ RMSE, MAE, R2
11:  Compute:
              └─ 5% movement prediction accuracy
              └─ Strategy returns from 5% signal and multi-factor rules
                └─ Strategy returns from multi-factor rules
12:  Simulate and compare multiple strategies:
              └─ Movement Threshold-based, Multi-factor, Buy & Hold, Random, Stratified
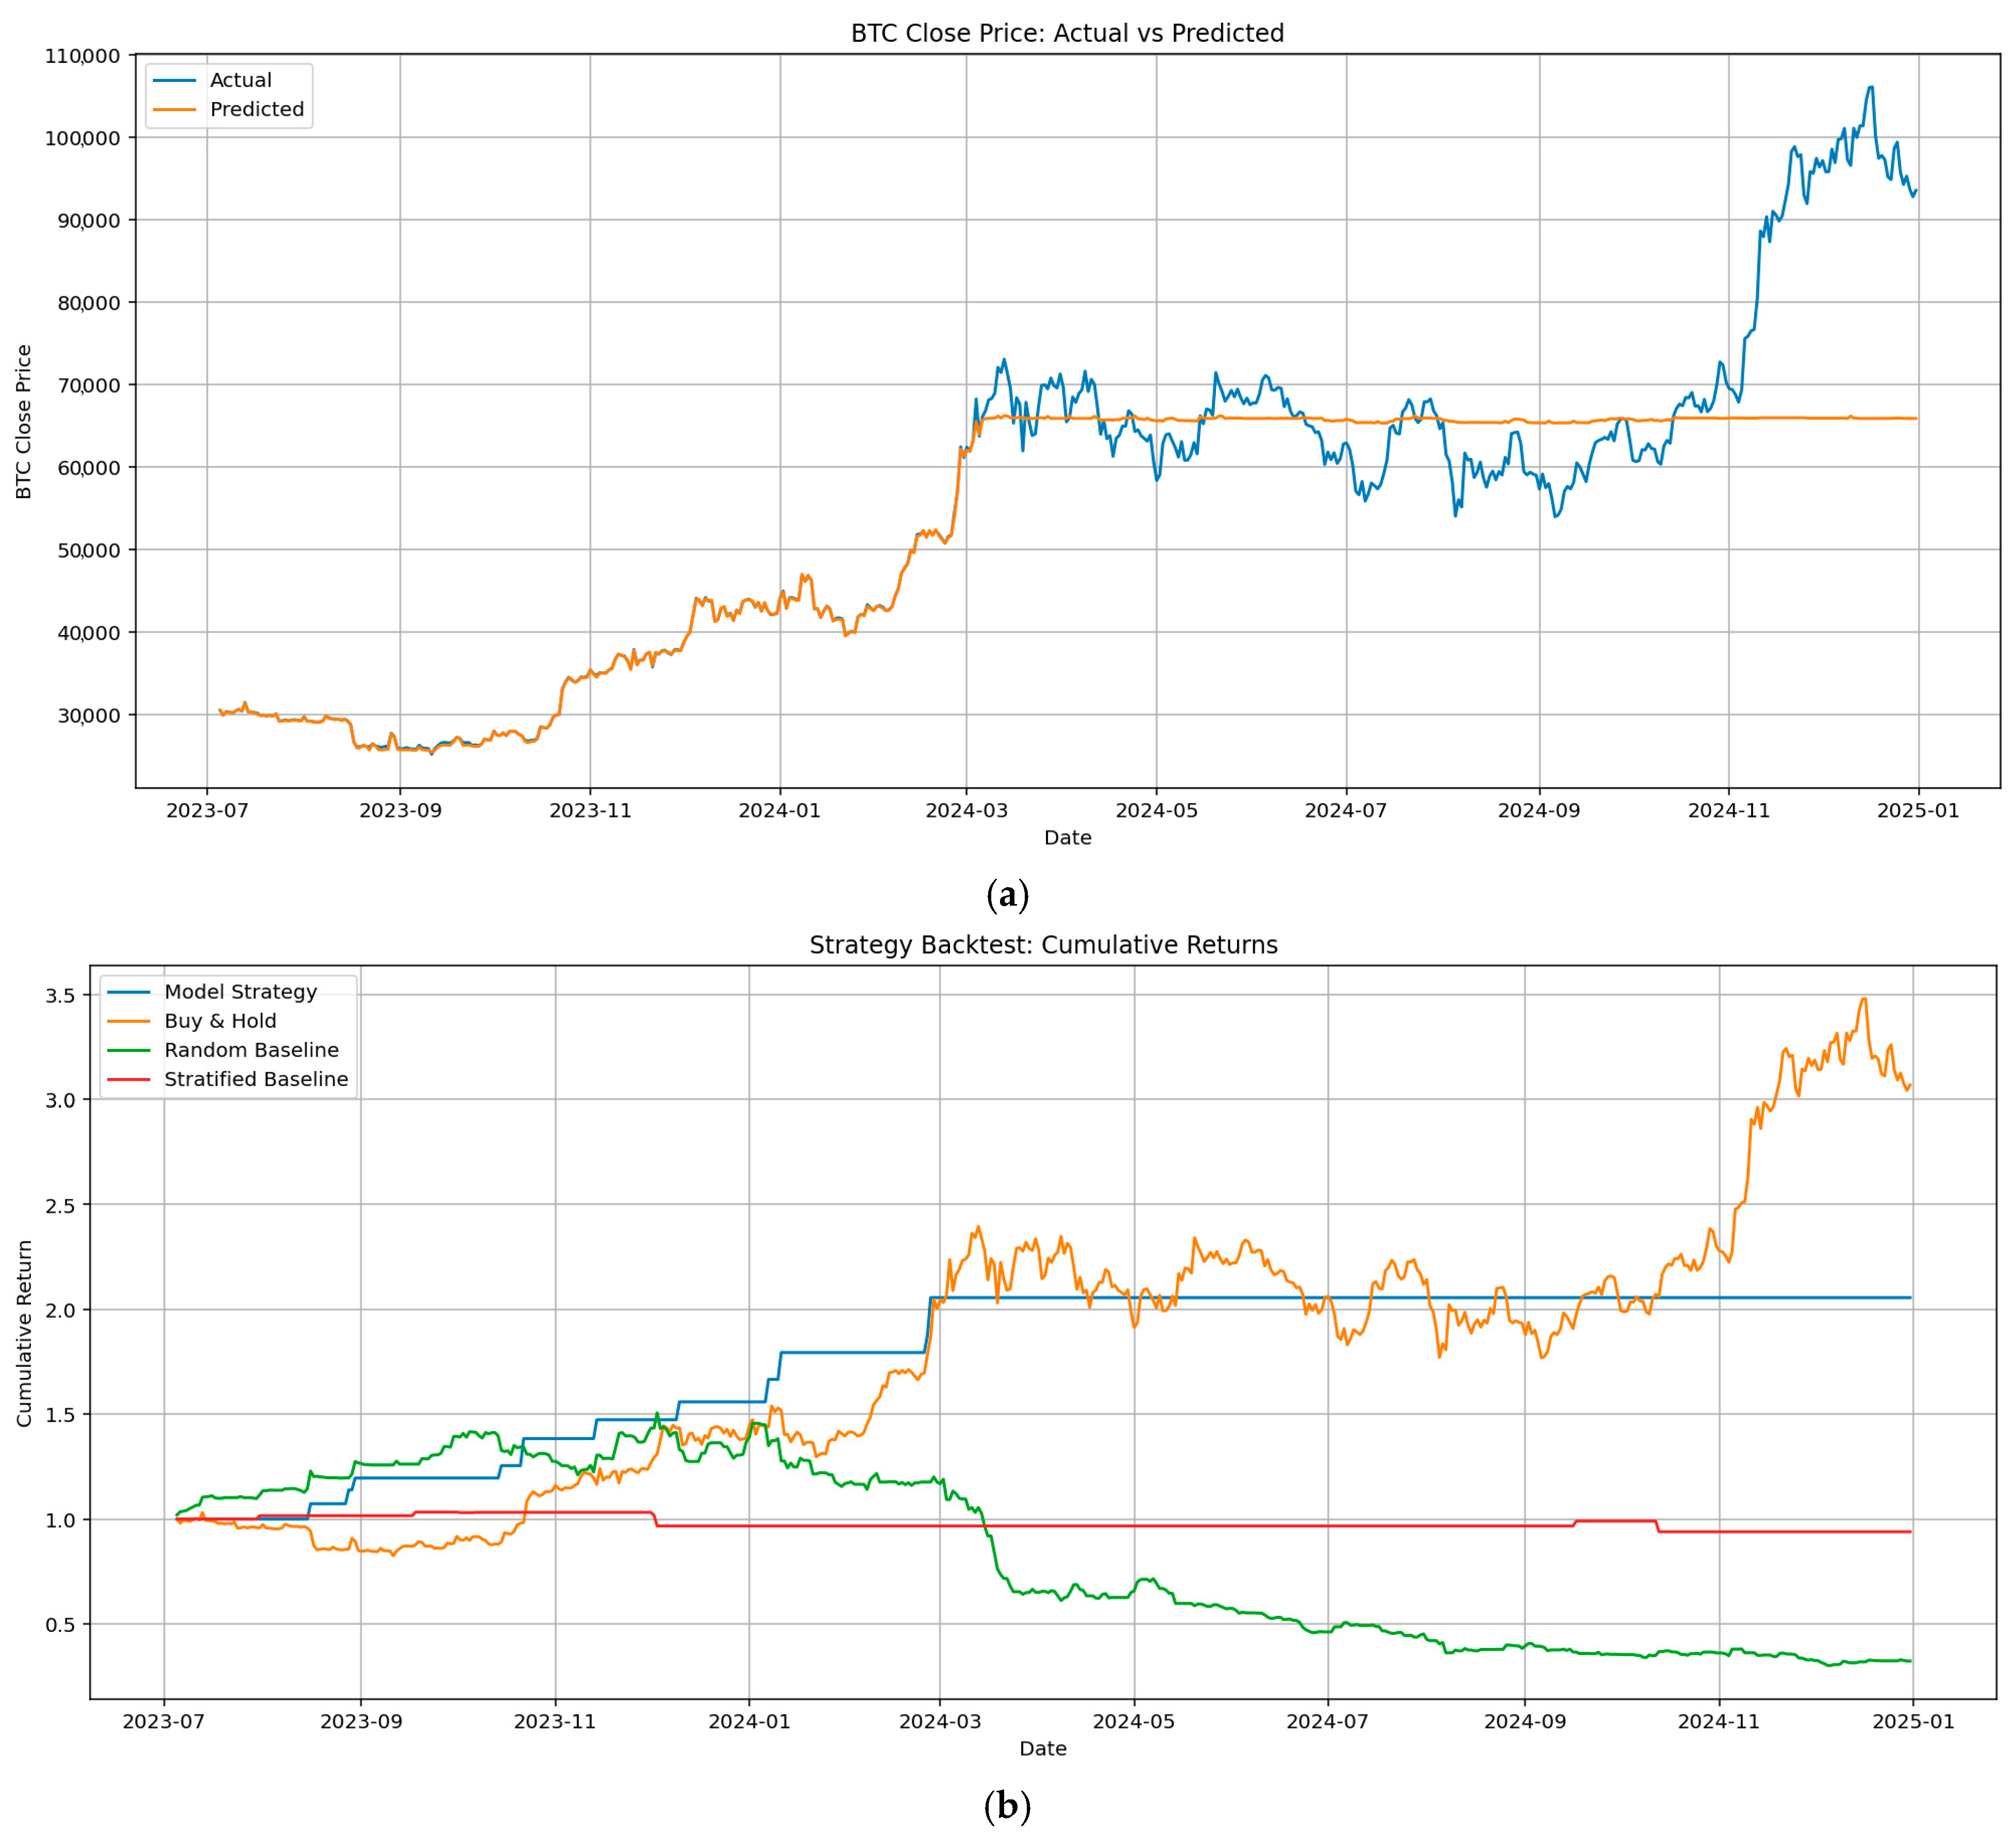
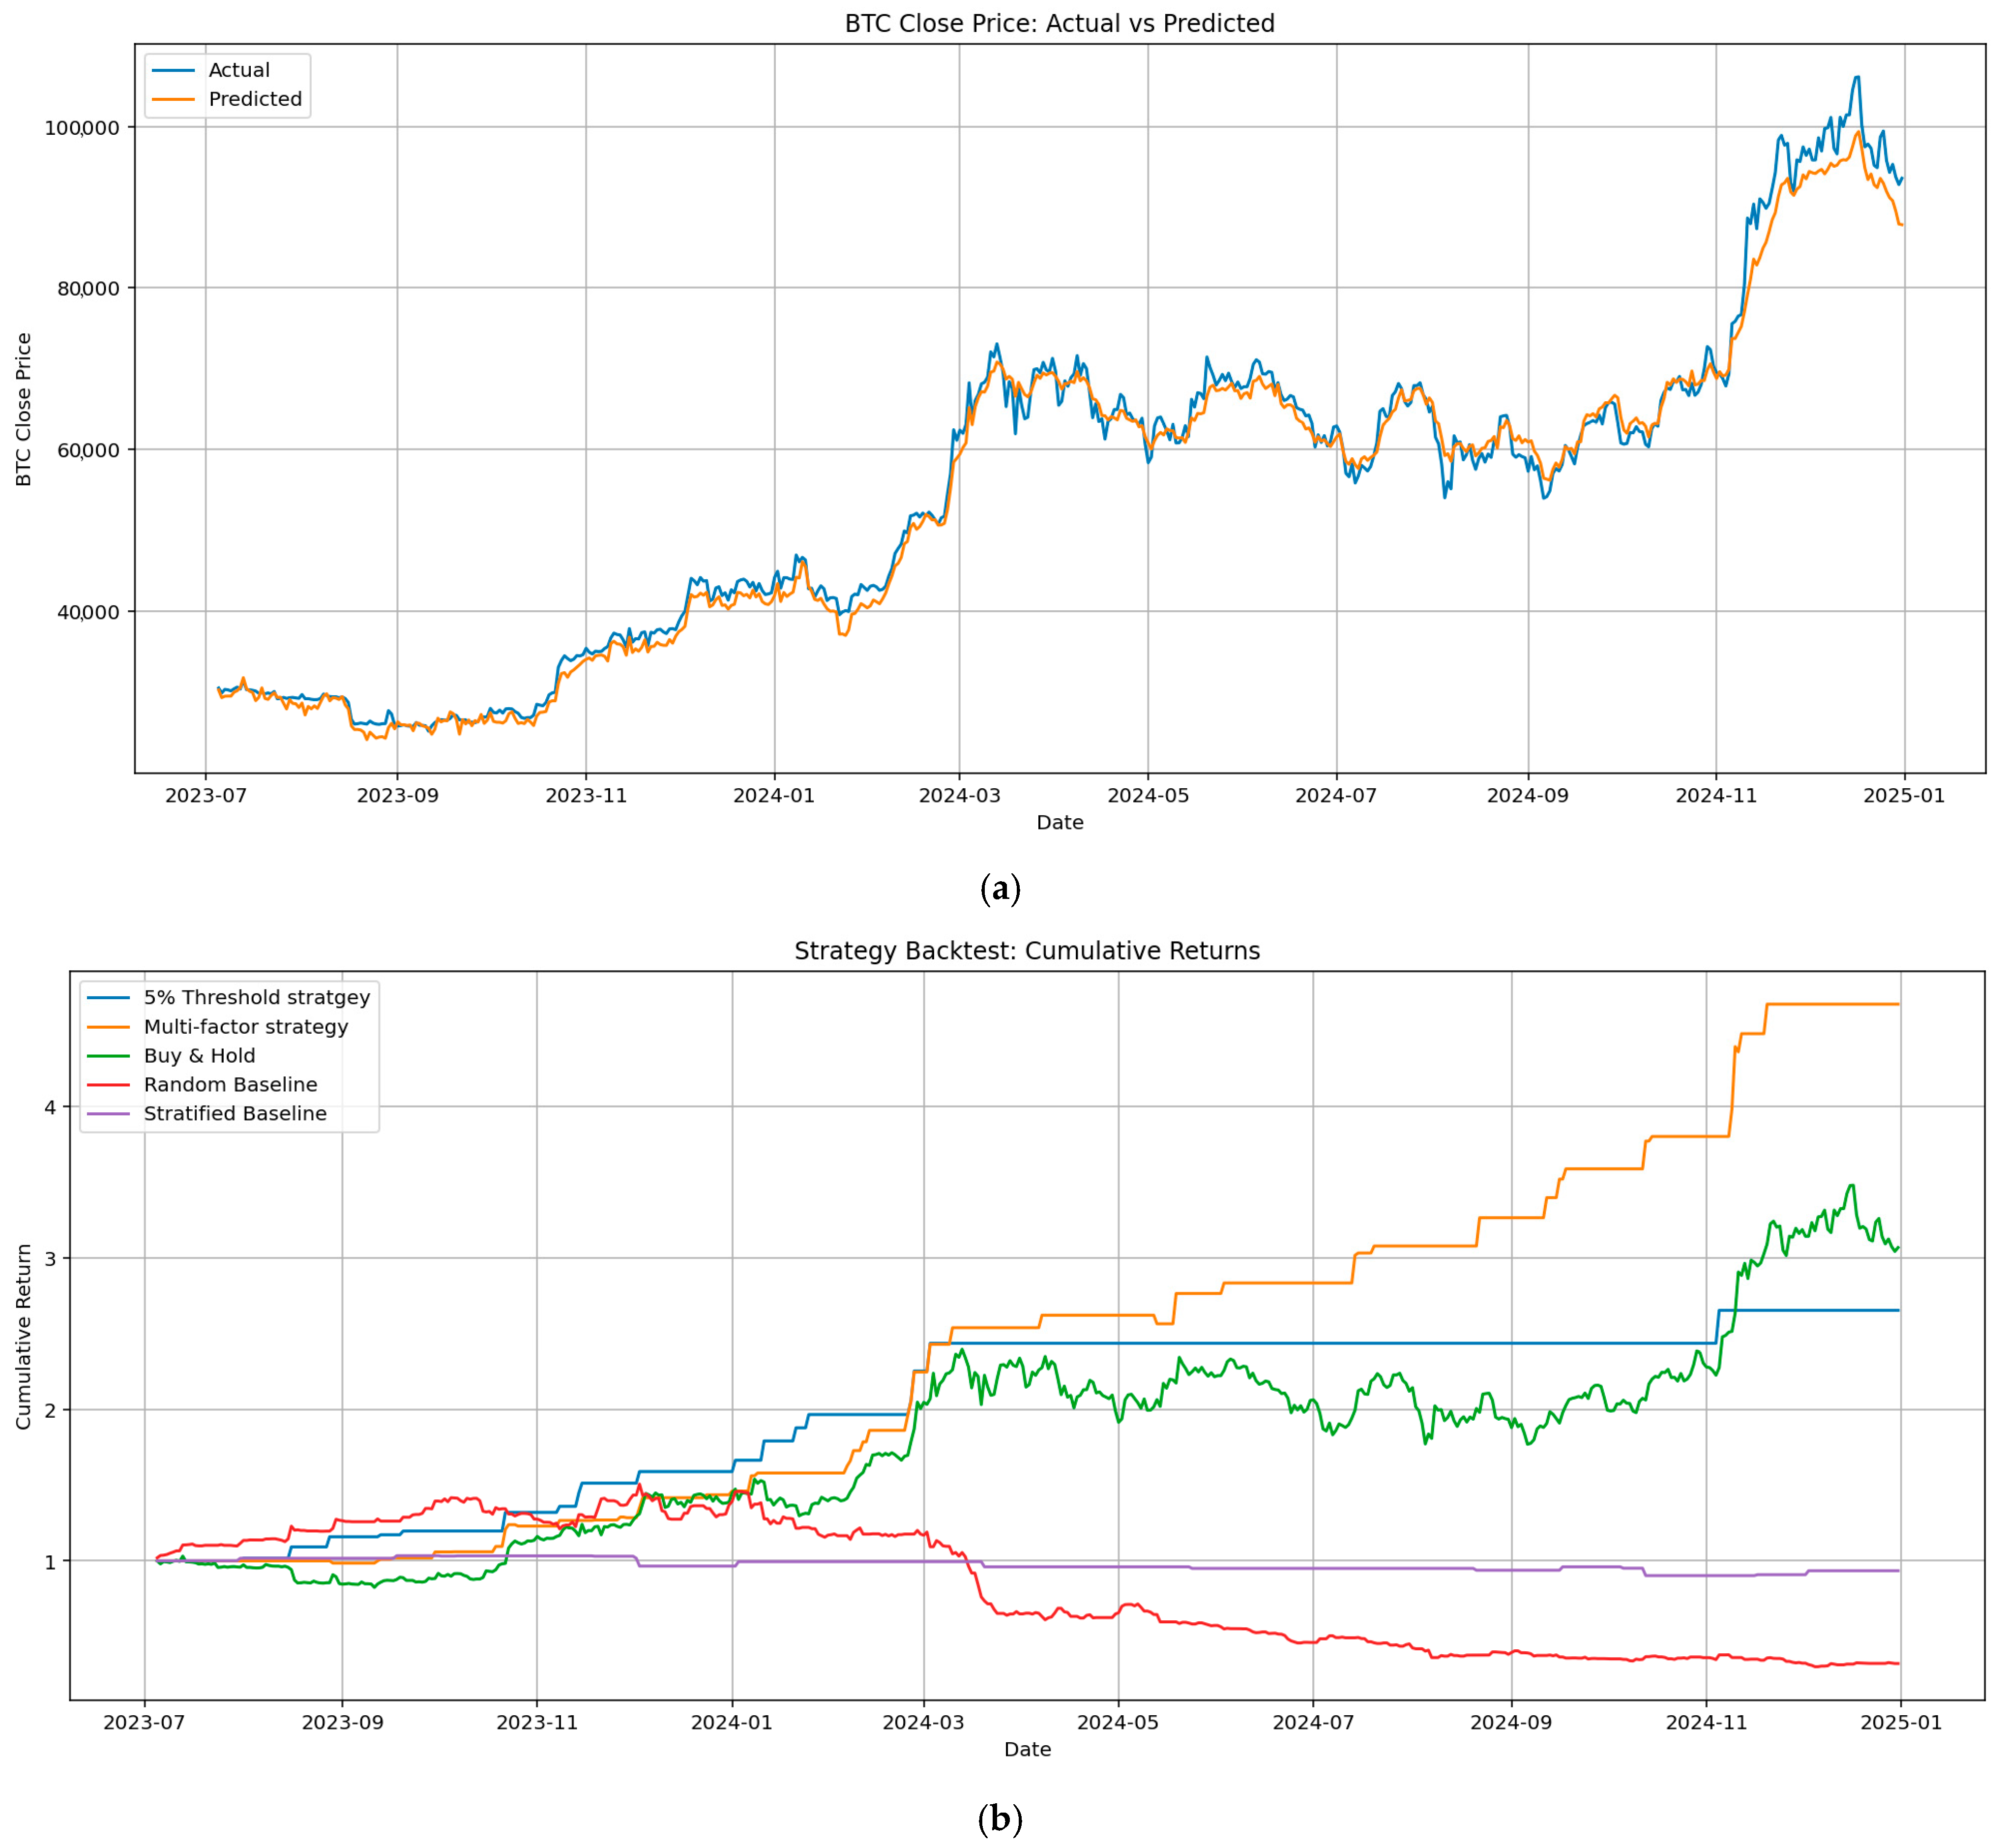
13:  Visualize cumulative returns across strategies
14:  Perform Feature Ablation Study:
              └─ Run models on subsets: Market, Technical, Sentiment, Macro, Index
              └─ Compare results using RMSE, MAE, R2
15:  Visualize ablation metrics with horizontal bar plots

2.5. Trading Strategy

To evaluate the effectiveness of our Bitcoin price prediction model in a practical trading context, we implemented and compared five trading strategies: Buy & Hold, Random, Stratified Random, 5% Movement Threshold, and Multi-Factor. These strategies were backtested using daily returns over the out-of-sample period, with each strategy generating trading signals that dictate whether to take a long (+1), short (−1), or neutral (0) position based on model predictions or predefined rules.
The Buy & Hold strategy served as the passive benchmark, representing the return from purchasing Bitcoin at the beginning of the test period and holding it without any intervention until the end. This approach reflects the baseline performance of a non-active investor and establishes a point of comparison for the value added by model-driven trading.
Our primary model-driven strategy was the 5% Movement Threshold strategy, which relies directly on the predicted price movements. A buy signal is issued when the model forecasts a next-day return exceeding 5%, and a sell signal is triggered if a decrease of more than 5% is predicted. If the predicted return falls within this range, the position is held. This rule-based method filters out minor fluctuations and aims to capitalize on significant predicted price swings, aligning model confidence with actionable thresholds.
To test against a naive baseline, we also implemented a Random Strategy, in which trading signals were assigned purely at random with equal probability for buy, hold, or sell actions. This method ignores any market information and provides a useful lower bound for expected performance. However, to allow a more balanced comparison with structured strategies, we additionally introduced a Stratified Random Strategy. This variant maintains the same distribution of trading signals—long, neutral, and short—as observed in the model-driven 5% threshold strategy. Signals are randomly generated but with probabilities matched to those of the empirical strategy, ensuring structural similarity without leveraging market information.
Finally, we constructed a Multi-Factor strategy that refines signal generation by incorporating additional market indicators. A buy signal is issued only when three conditions are met: (1) the predicted return exceeds 2%, (2) the current price is above its 10-day simple moving average (SMA), and (3) short-term volatility, as measured by the 5-day rolling standard deviation of returns, is below 5%. This strategy aims to enhance robustness by requiring alignment between predictive output and favorable technical and volatility conditions, thereby increasing the likelihood of capturing sustainable upward trends while avoiding trades in unstable market conditions.
By comparing the cumulative and risk-adjusted performance of these five strategies, we gain a comprehensive view of the predictive model’s practical utility and the added value of incorporating data-driven, multidimensional filtering mechanisms into algorithmic trading systems.

3. Results

Table 5 compares the performance of various machine-learning models for Bitcoin price forecasting and their effectiveness in predicting a 5% daily price movement (extreme market events, which included both surges and crashes), a task relevant to strategic trading. Evaluation metrics include Root Mean Square Error (RMSE), Mean Absolute Error (MAE), R-squared (R2), and the accuracy of detecting 5% daily price movements. Among all models, the SentiStack model achieves the best overall forecasting accuracy, with the lowest RMSE (2003) and MAE (1488), an exceptional R2 of 0.99, and the highest accuracy (83.33%) in predicting 5% daily price movement. This indicates that the ensemble approach significantly improves the ability to capture the complex dynamics of Bitcoin’s market behavior. The reported R2 value of 0.99 for the Stacking-LSTM model was obtained on the test set, which consisted of the final 300 days (from July 2023 to December 2024). This confirms the model’s strong generalization performance on out-of-sample data and indicates that overfitting was not observed.
Interestingly, the basic LSTM model also performs remarkably well, with an R2 of 0.9883 and an RMSE of 2179. This shows LSTM’s strength in temporal sequence learning and detecting price spikes, even without additional ensemble complexity. XGBoost and Random Forest models perform reasonably well in terms of overall regression metrics, though they slightly trail the LSTM-based models in movement prediction accuracy. Notably, LSTM with attention, while offering strong regression performance, underperforms in the 5% daily price movement prediction task (54.55%), suggesting that attention mechanisms may require more refined tuning or more data to outperform standard LSTM in this specific context. Random Baseline, by comparison, yields poor forecasting accuracy (R2 of −2.41) but surprisingly achieves 72% in the 5% movement prediction task, likely due to chance or noise correlation rather than learned behavior.
Table 6 evaluates the financial performance of various trading strategies based on the predictions from the models in Table 5. Key metrics include Profit Percentage, Sortino Ratio, Sharpe Ratio, Maximum Drawdown, Win Rate, and Number of Trades. The Random Baseline strategy shows extremely poor performance, with a −67.69% return, negative Sortino (−1.582) and Sharpe ratios (−1.456), and a maximum drawdown of nearly 80%, indicating high risk and unprofitable trading behavior. This benchmark illustrates the danger of non-strategic or noise-driven trades in volatile markets like crypto.
Although full details for all strategies are not listed in the visible portion of Table 6, from the cumulative return chart previously analyzed, we know that the Multi-Factor strategy had the highest profitability and risk-adjusted return, outperforming others in both consistency and total return. The 5% Movement Threshold strategy also performed decently, though more conservatively, with a lower drawdown and consistent gains. Buy & Hold generated moderate profits, which is expected given Bitcoin’s bullish trend in 2024, while Stratified Baseline produced minimal returns with low-risk exposure. The Multi-Factor trading strategy based on the Stacking-LSTM model achieved a cumulative return of 367%, with a Sharpe ratio of 3.63 and a Sortino ratio of 7.15, outperforming all baseline and benchmark strategies. However, it should be noted that these backtest results were based on idealized conditions and did not include transaction costs, slippage, or market impact.
In conclusion, the results from Table 5 and Table 6 demonstrate the effectiveness of deep-learning-based forecasting models, particularly LSTM and its ensemble variant Stacking-LSTM, for accurate Bitcoin price prediction. These models not only minimize forecasting errors but also significantly enhance the precision of trading signals, especially for detecting price movement. When coupled with intelligent strategy design—as seen in the Multi-Factor and 5% Movement strategies—these predictions translate into strong financial returns and risk-adjusted performances. In contrast, naive or random strategies yield substantial losses and high volatility. The findings emphasize the necessity of robust predictive modeling paired with well-structured trading logic for successful algorithmic trading in cryptocurrency markets.
Table 7 highlights the architectural and methodological distinctions between SentiStack and existing Bitcoin forecasting models, particularly sentiment-fusion systems such as PreBit and ensembles models. Unlike PreBit, which applies a CNN-SVM fusion strategy limited to tweet sentiment and technical indicators, SentiStack integrates a broader range of inputs—including macroeconomic variables and high-dimensional sentiment embeddings from DeepSeek—within a stacked LSTM framework that employs both early and late fusion. While PreBit targets binary movement classification with modest accuracy (F1 = 0.38), SentiStack achieves high predictive precision across both regression and classification tasks (R2 = 0.99; 5% movement accuracy = 83%) and further demonstrates real-world viability through robust backtested trading performance (Sharpe = 3.91; Profit = +395%). In contrast to traditional ensemble regressors like BoostStack or macro-focused models like Random Forest [35], SentiStack uniquely fuses heterogeneous modalities through temporal modeling and a meta-learning layer, enabling more stable and adaptive forecasting across volatile periods.
Random Forest regression is an ensemble learning method that builds multiple decision trees during training and outputs the average of their predictions. Each tree partitions the feature space into regions based on the structure of the training data and assigns the average target value of samples in each region to make a prediction. Importantly, decision trees are non-parametric models—they do not extrapolate beyond the range of values seen during training. Instead, they interpolate; they can only predict within the boundaries of the training data distribution. As a result, when test data contains feature values that fall outside the range encountered during training, Random Forest cannot make sensible projections. Rather than “guessing” higher or lower values, the model assigns the closest possible known value, usually from the nearest leaf node in each tree. When all trees in the forest behave similarly—hitting the limits of what they have seen—the ensemble output becomes a stable, averaged prediction. This leads to the model producing flat or nearly constant predictions, especially when price levels or market behavior deviate sharply from historical norms.
In this case, the BTC price in the test period from March 2024 to January 2025 increases significantly beyond the training data range in Figure 7. Because Random Forest has never seen such high prices, it cannot extrapolate upward. Instead, it defaults to predicting values close to the maximum it saw during training—effectively flattening the forecast into a horizontal line. This phenomenon is common in tree-based models when deployed in non-stationary or rapidly evolving environments. To address this limitation, one could incorporate models that are more capable of extrapolation, such as neural networks (e.g., LSTM) or gradient boosting methods like XGBoost, possibly in combination with Random Forest for stability. Additionally, transforming features (e.g., using returns instead of raw prices) or expanding the training data to cover a broader range of behaviors can significantly improve generalization.
Figure 8a presents the performance of a stacking-LSTM model in predicting the closing prices of Bitcoin over time. The blue line denotes the actual BTC prices, while the orange line illustrates the model’s predicted prices. From July 2023 through January 2025, the model captures the overall trends and directionality of the market with impressive accuracy. The predictions closely align with actual values, especially during both bullish and bearish phases, such as the sharp rise from early 2024 to late 2024 and the dip thereafter. While minor deviations are observed—particularly during rapid price changes—the model demonstrates strong temporal learning capability, affirming the value of incorporating memory-based structures like LSTM and ensemble techniques via stacking to capture the non-linear, high-volatility behaviour of Bitcoin prices.
Figure 8b depicts a backtest of five trading strategies based on the model’s predictions. The strategies compared include a 5% Movement Threshold strategy, Multi-Factor strategy, Buy & Hold, Random Baseline, and Stratified Baseline. The Multi-Factor strategy significantly outperforms others, generating a cumulative return exceeding 4.5× over the test period, indicating superior risk-adjusted decision-making when combining model outputs with multiple market indicators. In contrast, the Random Baseline strategy steadily declines, resulting in heavy losses and a max drawdown of nearly 80%. The 5% Movement Threshold strategy and Buy & Hold yield moderate returns, with Buy & Hold performing better than expected, given the strong uptrend in BTC during 2024. Stratified Baseline remains nearly flat, offering minimal returns and reflecting its passive structure.
Figure 9 presents a comprehensive feature ablation analysis of Bitcoin price forecasting using a Stacking-LSTM model. The evaluation metrics include Root Mean Square Error (RMSE), Mean Absolute Error (MAE), and the coefficient of determination (R2). The goal of this analysis is to assess the individual and combined contributions of different feature groups—namely, crypto market data, technical indicators, sentiment, macroeconomic variables, and market index factors—on model performance.
The results revealed that using all five feature groups together produced the most accurate predictions, with the lowest RMSE (2717.47) and MAE (1749.20), along with the highest R2 value of 0.98. This demonstrates that combining crypto-specific data with broader economic and sentiment signals creates a synergistic effect that improves the LSTM model’s ability to capture BTC price dynamics. Notably, the combination of Crypto Market and Sentiment features alone achieved nearly comparable results, indicating that market psychology plays a significant role in price forecasting and can be effectively modeled through news sentiment and fear-greed indicators.
Adding Technical Indicators to the crypto market data also yielded strong performance, with an R2 of 0.97 and relatively low prediction errors, suggesting that traditional time-series features such as SMA, EMA, and MACD continue to provide valuable signals. In contrast, the inclusion of Macroeconomic and Market Index features without supportive crypto-centric data led to weaker performance. These groups, when added in isolation, increased both RMSE and MAE while reducing R2 to 0.90–0.91, likely due to their indirect or lagging influence on BTC’s short-term movements.
From the results, it is evident that the inclusion of sentiment features significantly improves predictive accuracy. Specifically, when sentiment is added to the baseline crypto market data, the MAE drops sharply from 1823.67 to 1746.95, demonstrating a noticeable improvement. This suggests that market sentiment, as derived from news and media texts (e.g., via models like DeepSeek), provides valuable forward-looking information that complements historical price and volume data. Furthermore, when sentiment is included as part of the full feature set, the model achieves the best overall performance across all three metrics: the lowest RMSE (2717.47), the lowest MAE (1749.20), and the highest R2 (0.98).
In contrast, adding only macroeconomic indicators or market index data to the crypto market features yields less impressive results, with much higher error values and lower R2 scores. This reinforces the importance of sentiment signals in short- to medium-term price forecasting, where investor psychology and media narratives often precede market movements. The high R2 values (above 0.97) across most configurations indicate that the Stacking-LSTM model captures a substantial portion of the variance in the target variable, but it is the addition of sentiment that sharpens its precision.
In conclusion, the feature ablation analysis confirms that sentiment features play a critical role in enhancing the performance of deep-learning models for cryptocurrency forecasting. The marked reduction in MAE when sentiment is incorporated validates its predictive power. The findings underscore the value of integrating textual data into quantitative modeling frameworks, particularly when using advanced architectures like Stacking-LSTM.

4. Conclusions and Future Work

This study developed and evaluated SentiStack, a novel multimodal ensemble learning framework for Bitcoin price forecasting that integrates market indicators, macroeconomic variables, and sentiment features derived from social media and news. The empirical results demonstrated that SentiStack outperformed established benchmark models—including LSTM, Random Forest, and XGBoost—in both predictive accuracy and trading simulation. Specifically, SentiStack achieved the highest R2 (0.99) and Sharpe ratio (3.63), with an overall profit exceeding 367% in backtested trading scenarios. These findings indicated that the integration of heterogeneous data sources and the use of stacking-based architecture substantially improved forecast robustness and profitability compared to traditional unimodal or shallow ensemble models.
The model comparison further highlights the innovation of this study. While traditional machine-learning models such as Random Forest and XGBoost provide acceptable results, they fall short in both predictive accuracy and trading performance, especially in periods of rapid market shifts. The basic Long Short-Term Memory model performs well in capturing temporal patterns but is outperformed by the stacking ensemble that incorporates sentiment and macroeconomic signals. In comparison with recent benchmark models like PreBit, which focuses on tweet-level sentiment and achieves limited classification performance, SentiStack stands out by integrating full-text sentiment analysis and a broader range of input features. Feature ablation experiments confirm that the addition of sentiment and macroeconomic variables leads to significant reductions in prediction error and enhances the model’s responsiveness to market extremes.
The innovation of this work lies in the systematic fusion of multimodal signals using a stacking ensemble of LSTM base learners combined with a Ridge regression meta-learner. This design enabled the effective exploitation of diverse feature modalities and temporal dependencies, distinguishing the framework from previous sentiment-fusion and stacking-LSTM approaches. Comparative evaluation against recent multimodal models further validated the superiority of SentiStack in capturing extreme price movements and adapting to volatile market conditions.
Although the SentiStack model demonstrated strong performance in forecasting Bitcoin prices, its evaluation was limited to a single asset. Bitcoin was chosen for its extensive trading history, high volatility, and comprehensive data availability, which offered a robust environment for testing multimodal modeling strategies. However, the model was not empirically applied to other cryptocurrencies or traditional financial assets such as equities or commodities. The framework also depended on the quality and timeliness of data feeds, particularly for sentiment and macroeconomic indicators. Additionally, while backtest results were promising, they did not account for transaction costs, slippage, or liquidity constraints, which could affect real-world trading profitability. Extending and validating the model in diverse markets and under practical operational conditions remained important directions for future research.
For future work, the study could be extended by exploring real-time prediction capabilities and adaptive learning strategies that updated model parameters dynamically as new data became available. Incorporating reinforcement learning could allow the model to learn optimal trading strategies through market interaction. Applying the SentiStack framework to other cryptocurrencies, stock indices, and commodity markets would be essential to test its generalizability and to refine feature engineering for various financial contexts. Efforts to improve model interpretability, such as through explainable artificial intelligence techniques, could also provide deeper insights into the factors driving forecasts and enhance decision-making support for end users.

Author Contributions

Z.Z. conceived the concept and carried out the experimental work—including methodology, data analysis, preparation of the original manuscript—directed and technically supervised the research. C.J. assisted with data collection, data curation, methodology, writing—review & editing. M.L. focused on writing—review & editing, investigation, methodology and supervision. All authors have read and agreed to the published version of the manuscript.

Funding

This research received no external funding.

Data Availability Statement

The data that support the findings of this study are available from third-party sources. Restrictions apply to the availability of these data, which were used under license for this study. Data are available from the authors upon reasonable request, with the permission of the respective data providers, including Bitstamp, FRED, Yahoo Finance, TradingEconomics.com, Twitter, CryptoPanic, and CoinDesk.

Conflicts of Interest

The authors declare that they have no known competing financial interests or personal relationships that could have appeared to influence the work reported in this paper.

References

  1. Nakamoto, S.; Bitcoin, A. A Peer-to-Peer Electronic Cash System. 2008. Available online: https://bitcoin.org/bitcoin.pdf (accessed on 15 June 2025).
  2. Yermack, D. Is Bitcoin a real currency? An economic appraisal. In Handbook of Digital Currency; Elsevier: Amsterdam, The Netherlands, 2024; pp. 29–40. [Google Scholar]
  3. Mai, F.; Shan, Z.; Bai, Q.; Wang, X.; Chiang, R.H.L. How does social media impact Bitcoin value? A test of the silent majority hypothesis. J. Manag. Inf. Syst. 2018, 35, 19–52. [Google Scholar] [CrossRef]
  4. Le, H.H.; Viviani, J.-L. Predicting bank failure: An improvement by implementing a machine-learning approach to classical financial ratios. Res. Int. Bus. Financ. 2018, 44, 16–25. [Google Scholar] [CrossRef]
  5. García Nieto, P.J.; García-Gonzalo, E.; Álvarez Antón, J.C.; González Suárez, V.M.; Mayo Bayón, R.; Mateos Martín, F. A comparison of several machine learning techniques for the centerline segregation prediction in continuous cast steel slabs and evaluation of its performance. J. Comput. Appl. Math. 2018, 330, 877–895. [Google Scholar] [CrossRef]
  6. Patel, N.P.; Parekh, R.; Thakkar, N.; Gupta, R.; Tanwar, S.; Sharma, G.; Davidson, I.E.; Sharma, R. Fusion in Cryptocurrency Price Prediction: A Decade Survey on Recent Advancements, Architecture, and Potential Future Directions. IEEE Access 2022, 10, 34511–34538. [Google Scholar] [CrossRef]
  7. Wang, J.; Ma, F.; Bouri, E.; Guo, Y. Which factors drive Bitcoin volatility: Macroeconomic, technical, or both? J. Forecast. 2023, 42, 970–988. [Google Scholar] [CrossRef]
  8. Zou, Y.; Herremans, D. PreBit—A multimodal model with Twitter FinBERT embeddings for extreme price movement prediction of Bitcoin. Expert Syst. Appl. 2023, 233, 120838. [Google Scholar] [CrossRef]
  9. Zhang, W.; Zhao, L.; Xia, H.; Sun, S.; Sun, J.; Qin, M.; Li, X.; Zhao, Y.; Zhao, Y.; Cai, X.; et al. A Multimodal Foundation Agent for Financial Trading: Tool-Augmented, Diversified, and Generalist. arXiv 2024, arXiv:2402.18485. [Google Scholar]
  10. Chen, Y.-F.; Huang, S.-H. Sentiment-influenced trading system based on multimodal deep reinforcement learning. Appl. Soft Comput. 2021, 112, 107788. [Google Scholar] [CrossRef]
  11. Anbaee Farimani, S.; Jahan, M.V.; Milani Fard, A. An Adaptive Multimodal Learning Model for Financial Market Price Prediction. IEEE Access 2024, 12, 121846–121863. [Google Scholar] [CrossRef]
  12. Che, W.; Wang, Z.; Jiang, C.; Abedin, M.Z. Predicting financial distress using multimodal data: An attentive and regularized deep learning method. Inf. Process. Manag. 2024, 61, 103703. [Google Scholar] [CrossRef]
  13. Daiya, D.; Lin, C. Stock Movement Prediction and Portfolio Management via Multimodal Learning with Transformer. In Proceedings of the ICASSP 2021—2021 IEEE International Conference on Acoustics, Speech and Signal Processing (ICASSP), Toronto, ON, Canada, 6–11 June 2021; IEEE: Toronto, ON, Canada, 2021; pp. 3305–3309. [Google Scholar] [CrossRef]
  14. Sheng, Y.; Qu, Y.; Ma, D. Stock price crash prediction based on multimodal data machine learning models. Financ. Res. Lett. 2024, 62, 105195. [Google Scholar] [CrossRef]
  15. Chen, Z.; Li, C.; Sun, W. Bitcoin price prediction using machine learning: An approach to sample dimension engineering. J. Comput. Appl. Math. 2020, 365, 112395. [Google Scholar] [CrossRef]
  16. Lee, S.I.; Yoo, S.J. Multimodal deep learning for finance: Integrating and forecasting international stock markets. J. Supercomput. 2020, 76, 8294–8312. [Google Scholar] [CrossRef]
  17. Mutemi, A.; Bacao, F. A numeric-based machine learning design for detecting organized retail fraud in digital marketplaces. Sci. Rep. 2023, 13, 12499. [Google Scholar] [CrossRef]
  18. D’Amato, V.; Levantesi, S.; Piscopo, G. Deep learning in predicting cryptocurrency volatility. Phys. Stat. Mech. Its Appl. 2022, 596, 127158. [Google Scholar] [CrossRef]
  19. Fang, F.; Chung, W.; Ventre, C.; Basios, M.; Kanthan, L.; Li, L.; Wu, F. Ascertaining price formation in cryptocurrency markets with machine learning. Eur. J. Financ. 2024, 30, 78–100. [Google Scholar] [CrossRef]
  20. Chen, W.; Xu, H.; Jia, L.; Gao, Y. Machine learning model for Bitcoin exchange rate prediction using economic and technology determinants. Int. J. Forecast. 2021, 37, 28–43. [Google Scholar] [CrossRef]
  21. Shahbazi, Z.; Byun, Y.-C. Improving the Cryptocurrency Price Prediction Performance Based on Reinforcement Learning. IEEE Access 2021, 9, 162651–162659. [Google Scholar] [CrossRef]
  22. Kim, G.; Shin, D.-H.; Choi, J.G.; Lim, S. A Deep Learning-Based Cryptocurrency Price Prediction Model That Uses On-Chain Data. IEEE Access 2022, 10, 56232–56248. [Google Scholar] [CrossRef]
  23. Jaquart, P.; Köpke, S.; Weinhardt, C. Machine learning for cryptocurrency market prediction and trading. J. Financ. Data Sci. 2022, 8, 331–352. [Google Scholar] [CrossRef]
  24. Jaquart, P.; Dann, D.; Weinhardt, C. Short-term bitcoin market prediction via machine learning. J. Financ. Data Sci. 2021, 7, 45–66. [Google Scholar] [CrossRef]
  25. Kim, H.-M.; Bock, G.-W.; Lee, G. Predicting Ethereum prices with machine learning based on Blockchain information. Expert Syst. Appl. 2021, 184, 115480. [Google Scholar] [CrossRef]
  26. Windsor, E.; Cao, W. Improving exchange rate forecasting via a new deep multimodal fusion model. Appl. Intell. 2022, 52, 16701–16717. [Google Scholar] [CrossRef] [PubMed]
  27. Elbagir, S.; Yang, J. Twitter Sentiment Analysis Using Natural Language Toolkit and VADER Sentiment. In Proceedings of the International MultiConference of Engineers and Computer Scientists 2019, Hong Kong, China, 13–15 March 2019. [Google Scholar]
  28. Acosta, J.; Lamaute, N.; Luo, M.; Finkelstein, E.; Cotoranu, A. Sentiment Analysis of Twitter Messages Using Word2Vec. In Proceedings of the 2019 Sixth International Conference on Social Networks Analysis, Management and Security (SNAMS), Granada, Spain, 22–25 October 2019. [Google Scholar]
  29. Sun, M.; Huang, X.; Ji, H.; Liu, Z.; Liu, Y. (Eds.) Lecture Notes in Computer Science. In Proceedings of the Chinese Computational Linguistics: 18th China National Conference, CCL 2019, Kunming, China, 18–20 October 2019; Springer International Publishing: Cham, Switzerland, 2019; Volume 11856. [Google Scholar] [CrossRef]
  30. Lu, H.; Liu, W.; Zhang, B.; Wang, B.; Dong, K.; Liu, B.; Sun, J.; Ren, T.; Li, Z.; Yang, H.; et al. DeepSeek-VL: Towards Real-World Vision-Language Understanding. arXiv 2024, arXiv:2403.05525. [Google Scholar] [CrossRef]
  31. Vaswani, A.; Shazeer, N.; Parmar, N.; Uszkoreit, J.; Jones, L.; Gomez, A.N.; Kaiser, L.; Polosukhin, I. Attention Is All You Need (Nips). arXiv 2017, arXiv:1706.03762. [Google Scholar]
  32. Dai, D.; Deng, C.; Zhao, C.; Xu, R.; Gao, H.; Chen, D.; Li, J.; Zeng, W.; Yu, X.; Wu, Y. Deepseekmoe: Towards ultimate expert specialization in mixture-of-experts language models. arXiv 2024, arXiv:2401.06066. [Google Scholar]
  33. Liu, A.; Feng, B.; Wang, B.; Wang, B.; Liu, B.; Zhao, C.; Dengr, C.; Ruan, C.; Dai, D.; Guo, D. Deepseek-v2: A strong, economical, and efficient mixture-of-experts language model. arXiv 2024, arXiv:2405.04434. [Google Scholar]
  34. Zhao, L.; Lai, Y.; Shi, S.; Cheng, G.; Qiu, Z.; Xie, Z. Research on Financial Time Series Prediction Based on LSTM and Attention Mechanism. In Proceedings of the 2025 Asia-Europe Conference on Cybersecurity, Internet of Things and Soft Computing (CITSC), Rimini, Italy, 10–12 January 2025; IEEE: New York, NY, USA, 2025; pp. 347–351. [Google Scholar]
  35. Shakri, I.H. Time series prediction using machine learning: A case of Bitcoin returns. Stud. Econ. Financ. 2022, 39, 458–470. [Google Scholar] [CrossRef]
  36. Saheed, Y.K.; Ayobami, R.M.; Orje-Ishegh, T. A comparative study of regression analysis for modelling and prediction of bitcoin price. In Blockchain Applications in the Smart Era; Springer: Cham, Switzerland, 2022; pp. 187–209. [Google Scholar]
Figure 1. Autocorrelation of Bitcoin daily closing prices across multiple time lags. The dashed lines mark the confidence intervals, within which fluctuations are statistically insignificant.
Bdcc 09 00161 g001
Figure 2. Correlation heatmap of Bitcoin, financial markets, macroeconomic indicators, and sentiment factors.
Bdcc 09 00161 g002
Figure 3. Seasonal Decomposition of Bitcoin Daily Closing Prices: (a) Observed Series, (b) Trend Component, (c) Seasonal Component, (d) Residuals.
Bdcc 09 00161 g003
Figure 4. First Difference of the Bitcoin Price Series.
Bdcc 09 00161 g004
Figure 5. The architecture of DeepSeek-v2: Multihead Latent Attention and Mixture-of-Experts mechanisms for efficient financial sentiment analysis, adapted with permission from ref. [33], Springer Publishing, CC BY 4.0.
Bdcc 09 00161 g005
Figure 6. SentiStack: Multimodal Stacking-LSTM Framework for Bitcoin Price Forecasting and Trading Strategy.
Bdcc 09 00161 g006
Figure 7. (a) Bitcoin close price: actual vs. predicted trends via Random Forest model. (b) Cumulative returns of Random Forest model strategy vs. baseline strategies.
Bdcc 09 00161 g007
Figure 8. (a) BTC close price forecasting using the SentiStack model: actual vs. predicted. (b) Strategy backtest for Bitcoin: cumulative returns across trading strategies.
Bdcc 09 00161 g008
Figure 9. Feature ablation study on BTC price prediction: impact of different feature groups on forecasting performance using the SentiStack model.
Bdcc 09 00161 g009
Table 1. Comparison of multimodal machine-learning models for cryptocurrency price prediction.
Model/Architecture Data TypesNovelty/Pros and ConsRef
PreBit Multimodal Hybrid ModelTweets, OHLCV, technical indicators, Ethereum, gold pricesCombines FinBERT and SVM; complex to train[8]
FinAgent Multimodal LLM Trading AgentPrice, news, charts, indicators, expert guidanceMultimodal, tool-augmented, explainable; complex, stock-focused[9]
Multimodal Deep Reinforcement LearningPrice data, news sentiment Adds influence model; robust, real-time, complex, limited interpretability[10]
ABM-BCSIM Adaptive Fusion ModelNews, mood, indicators, prices, sentiment scores40% error drop; adaptive, accurate, high computational cost[11]
Attentive Regularized Deep LearningFinancial ratios, current reports, interfirm network dataAttention mechanisms, entropy regularization; accurate, complex, yet highly interpretable[12]
Transformer Dilated Convolution Event NetworkFinancial indicators, news articles, event embeddings, technical indicator dataMultimodal Transformer improves accuracy; effective, interpretable, computationally intensive, complex training[13]
LightGBM Multimodal Graph Data ModelMarket data, graph data, textual sentiment data, technical indicatorsEnhanced accuracy; innovative graph integration; profitable, interpretable, handles imbalance[14]
Logistic Regression, LSTM, RFBitcoin daily, high-frequency, gold price, Google/Baidu trends dataSample dimension engineering improves prediction; different methods per frequency[15]
Multimodal Deep Neural NetworksStock indices data (U.S./Korea), opening/high/low/closing market pricesMultimodal fusion enhances accuracy; highly effective, complex model integration[16]
Numeric-based ML Fraud DetectionBuyer/seller behaviors, transaction numeric data from digital retail marketplacesDetects organized retail fraud; highly accurate, scalable, handles imbalance[17]
Jordan Recurrent Neural NetworkCryptocurrency returns: Bitcoin, Ethereum, Ripple daily price volatility dataHigh predictability in cryptocurrency volatility; parsimonious, superior to traditional methods[18]
LSTM Multilabel Cryptocurrency PredictorCryptocurrency tick-level mid-price, order-book data from multiple currenciesHigh accuracy on tick prediction; lean model; requires frequent retraining[19]
ANN-RF-LSTM Hybrid ModelEconomic indicators, blockchain data, Google trends, tweets, currency ratiosIntegrates economic determinants; superior accuracy, non-linear factor importance evaluation[20]
Reinforcement Learning Prediction ModelBlockchain data, Litecoin, Monero historical price and transaction informationReinforcement learning enhances prediction; transparent, secure, better volatility[21]
SAM-LSTM Cryptocurrency Price PredictorOn-chain Bitcoin data (transactions, mining, difficulty, blocks), historical pricesNovel attention-LSTM structure, excellent performance; computationally intensive, complex training[22]
LSTM-GRU Crypto Trading EnsembleCrypto daily prices, market capitalization, returns, transaction data, risk-free rate.Technical indicators, market capitalization, historical price of 100 cryptocurrencies[23]
GRU-GB Classifier Bitcoin PredictionBlockchain features, sentiment data, technical indicators, asset-based informationHighly accurate short-term predictions; profits before fees, fees negate returns[24]
Ethereum Blockchain ML PredictorEthereum-specific blockchain (gas, uncle blocks), economic, Bitcoin blockchain dataEthereum-specific blockchain analysis; accurate predictions; comprehensive, insightful factors identified[25]
Table 2. Summary of datasets for BTC price forecasting, including market, macroeconomic, and sentiment data sources.
Data NameSourceTypeFrequency
Bitcoin OHLCV PricesBitstamp APINumericalDaily
Bitcoin Trading VolumeBitstamp APINumericalDaily
S&P 500 Index, DJIAYahoo FinanceNumericalDaily
Gold PriceYahoo FinanceNumericalDaily
Crude Oil Price (WTI)TradingEconomics.comNumericalDaily
GDP (U.S.)FREDMacroeconomic IndicatorQuarterly
CPI (Consumer Price Index)FREDMacroeconomic IndicatorMonthly
Unemployment Rate (U.S.)FREDMacroeconomic IndicatorMonthly
Federal Funds RateFREDMacroeconomic IndicatorMonthly
Twitter Sentiment DataTwitter APITextual/SentimentDaily (aggregated)
Financial News SentimentCryptoPanic, CoinDesk, Yahoo FinanceTextual/SentimentDaily (aggregated)
Table 3. Summary of feature engineering techniques applied in the dataset.
CategoryFeature Engineering MethodDescription
Temporal FeaturesLagged FeaturesCreated btc_Close_t − 1, t − 2, t − 3 to include past price dynamics.
Statistical TransformationReturns and VolatilityComputed 1-day return (Return_1d) and 5-day rolling volatility (Volatility_5).
Technical IndicatorsSMA, EMA, RSI, MACD, Bollinger Bands, VWAP, OBV, ATRExtracted multiple standard technical indicators from Bitcoin OHLC data.
NormalizationMinMaxScalerScaled input features for LSTM and stacking models.
Sentiment FeaturesFear & Greed Index, News SentimentIncorporated sentiment category scores (positive, neutral, negative) and FG Index as behavioral signals.
Categorical EncodingLabelEncoderConverted Sentiment column into numerical form for model input.
Feature AblationGrouped Feature TestingEvaluated the impact of removing feature groups (e.g., sentiment, macro) on model performance.
Table 4. Comparative summary of machine-learning models for Bitcoin price forecasting.
Model NameTypeKey ParametersTuning Method
Random ForestRandomForestRegressorn_estimators = [50, 100]
max_depth = [10]
min_samples_split = [5]
min_samples_leaf = [1]
GridSearchCV (10-fold TSCV)
LSTMSequential (Keras)LSTM(50, activation = ‘relu’)
Dense(1)
epochs = 50
batch_size = 32
GridSearchCV (10-fold TSCV)
LSTM + AttentionFunctional API (Keras)LSTM(50, return_sequences = True)
Attention()
Dense(50, relu)
epochs = 50
batch_size = 32
RandomSearch (Keras Tuner, 10-fold TSCV)
SentiStack NetworkEnsemble (3 LSTMs + Ridge)Base: LSTM(32/64/128)
Meta: Ridge()
epochs = 30
batch_size = 32
GridSearchCV (10-fold TSCV)
XGBoostXGBRegressorn_estimators = [50, 100]
max_depth = [5, 10]
learning_rate = [0.05, 0.1]
subsample = [0.8, 1.0]
GridSearchCV (10-fold TSCV)
Table 5. Comparative evaluation of the SentiStack model and benchmark model performance metrics.
ModelsRMSEMAER2MAPE5% Daily Price Movement Accuracy
Random Baseline Model45,73737,316−2.4153.19%72%
RandomForest988445960.765.79%71.43%
LSTM + Attention918768050.795.65%54.55%
XGBOOSTRegressor969346280.775.95%77.78%
SentiStack Network200314880.992.68%83.33%
LSTM217916840.98833.19%58.33%
Table 6. Performance comparison of trading strategies from benchmark models in BTC backtest: profit, risk, and trade statistics.
StrategyProfit %SortinoSharpMax Drawdown %Win Rate of Total Trades %Number of Trades
Random Baseline−67.69−1.58−1.45679.96443.25115
Buy & Hold2062.361.482651.71
SentiStack Network (5% daily price Movement Event-driven Trading Backtest)165No loss2.65010016
SentiStack Network (Multi-Factor strategy)3677.153.632.1689.5837
LSTM (5% Movement Event-driven Trading Backtest)64.95No loss1.7101006
LSTM (Multi-Factor strategy)233.642.702.846.5173.4739
LSTM + attention [34] (5% Movement Event-driven Trading Backtest)92.35inf2.121.5093.3312
LSTM + attention [34] (Multi-Factor strategy)220.237.823.022.2883.7833
Random Forest (5% Movement Event-driven Trading Backtest)105No loss2.2010011
XGBOOSTRegressor
(5% Movement Event-driven Trading Backtest)
122No loss2.31010011
Table 7. Comparative analysis of SentiStack and State-of-the-Art Bitcoin forecasting models across architectures, modalities, and performance metrics.
ModelArchitectureInput ModalitiesKey InnovationsTask TypePerformance Metrics
SentiStack 3 × LSTM → Ridge Regression (Stacking Ensemble)Market, sentiment (DeepSeek), macroeconomicStacked LSTM, sentiment, macro data, real trading strategyRegression + Trading StrategyR2 = 0.99, MAE = 1402, RMSE = 1935, MAPE = 2.68%, Sharpe = 3.91, Sortino = 7.49, 5% classification Accuracy = 83%;
PreBit [8]CNN + SVM + meta-SVMPrice, Twitter (FinBERT)Movement prediction (±5%); FinBERT; ensemble classifierClassification (±5%)F1 = 0.38; Accuracy = 66.2%; Trading profit ≈ +56%
LSTM [19]LSTM + Autoencoder + DenseTick-level order book data, trades, market microstructureTick-level retraining, volatilityMultilabel classificationAccuracy = 78%; Precision = 0.79; F1 = 0.78
Random Forest [35]RF, MLR, MLP, AMT, M5 TreeEconomic indicators, exchange rates, gold/oil/S&P returnsMacro inputs, ML benchmarkRegressionBest model: RF with R2 = 0.9883, MAE = 272.5, RMSE = 611.35
BoostStack-Regressor [36]Ensemble of the six regressors Bitcoin historical data (2014–2020)Multi-model regression ensembleRegressionR2 = 0.92; MAE = 41.5; RMSE = 66.2; MAPE = 8.1%; RMSLE = 0.025
Disclaimer/Publisher’s Note: The statements, opinions and data contained in all publications are solely those of the individual author(s) and contributor(s) and not of MDPI and/or the editor(s). MDPI and/or the editor(s) disclaim responsibility for any injury to people or property resulting from any ideas, methods, instructions or products referred to in the content.

