Article

Predicting the Damage of Urban Fires with Grammatical Evolution

by
Constantina Kopitsa
,
Ioannis G. Tsoulos
*,
Andreas Miltiadous
and
Vasileios Charilogis
Department of Informatics and Telecommunications, University of Ioannina, Kostaki Artas, 47150 Artas, Greece
*
Author to whom correspondence should be addressed.
Big Data Cogn. Comput. 2025, 9(6), 142; https://doi.org/10.3390/bdcc9060142
Submission received: 10 April 2025 / Revised: 1 May 2025 / Accepted: 15 May 2025 / Published: 22 May 2025

Abstract

Fire, whether wild or urban, depends on the triad of oxygen, fuel, and heat. Urban fires, although smaller in scale, have devastating impacts, as evidenced by the 2018 wildfire in Mati, Attica (Greece), which claimed 104 lives. The elderly and children are the most vulnerable due to mobility and cognitive limitations. This study applies Grammatical Evolution (GE), a machine learning method that generates interpretable classification rules to predict the consequences of urban fires. Using historical data (casualties, containment time, and meteorological/demographic parameters), GE produces classification rules in human-readable form. The rules achieve over 85% accuracy, revealing critical correlations. For example, high temperatures (>35 °C) combined with irregular building layouts exponentially increase fatality risks, while firefighter response time proves more critical than fire intensity itself. Applications include dynamic evacuation strategies (real-time adaptation), preventive urban planning (fire-resistant materials and green buffer zones), and targeted awareness campaigns for at-risk groups. Unlike “black-box” machine learning techniques, GE offers transparent human-readable rules, enabling firefighters and authorities to make rapid informed decisions. Future advancements could integrate real-time data (IoT sensors and satellites) and extend the methodology to other natural disasters. Protecting urban centers from fires is not only a technological challenge but also a moral imperative to safeguard human lives and societal cohesion.

1. Introduction

While fires can be triggered by various causes, significant fires frequently result from the following disasters: storms, transportation accidents, criminal activity/terrorism, droughts, hazardous material spills [1], and forest fires. Also, urban fires are predominantly attributed to negligent cooking practices, whereas rural fires often stem from faulty electrical installations, malfunctions in heating systems, or even natural causes such as lightning strikes [2]. Small-scale urban fires often do not have a significant impact on an area; nevertheless, on the other hand, they are still equally hazardous to human life, the socioeconomic stability of a community, and they even contribute to increased insurance premiums [1].
Referring to human lives, let us examine the numerical data provided by the Hellenic Fire Service, which are available as open data in accordance with European Union Directive (2013/37/EE), aimed at enhancing transparency [3]. Consequently, as presented in Figure 1, an increase in fatalities associated with urban fires has been observed since 2020, with a slight decline in this trend in 2023.
Beyond this, it is observed that, in 2018, the human casualties from the devastating fire in Mati, Attica, were not accounted for, as previously mentioned in the Abstract [4,5]. This is likely due to the classification of this particular fire as a wildfire rather than an urban fire.
According to a study conducted in America by the National Fire Protection Association (NFPA), there was an approximate 4% rise in residential fires and a 13% increase in deliberately ignited structural fires in 2018 [2]. Thus, based on the official fire situation report, Fire Loss in the United States During 2017, published by the National Fire Protection Association, fire departments across the United States responded to an estimated 1,319,500 fire incidents in 2017. These incidents led to approximately 3400 civilian fatalities, 14,670 civilian injuries, and an estimated USD 23 billion in direct property damage [2].
Additionally, the World Health Organization (WHO) estimated that three million fires occur globally each year, resulting in approximately 180,000 fatalities [6]. Moreover, the majority of these disasters take place in major urban centers within low-income countries, where various economic, social, and environmental factors contribute to increased risk of fire incidents.
Nevertheless, this conclusion does not exempt powerful nations from the impacts of climate change and natural disasters. Accordingly, Table 1 is introduced.
The climate change projections indicate that urban environments may face increasing fire hazards [15]. A stark example of the interconnectedness between climate change and forest fires is evident in the fires that occurred in Los Angeles in January 2025, and in Japan in February of the same year.
From these real events, it is inferred that an unpredictable natural disaster, such as a wildfire, does not discriminate between low- and high-socioeconomic areas. Furthermore, they highlight the precarious balance (sword of Damocles) between climate change and urban expansion into forested regions. This underscores the critical importance of our research in predicting the impact of urban fire damage.
Next, we will refer to relevant studies focused on the field of urban fire prediction, which employ statistical techniques, Geographic Information System spatial and temporal analyses, subjective evaluations through the Analytical Hierarchy Process (AHP), multi-criteria decision-making, and probabilistic machine learning.
A team of researchers used data from the Ankara region of Turkey for the analysis of the spatial and temporal patterns of residential fires, which can enable decision-makers to strategically allocate resources for fire management based on the intensity of fire clustering over time and across different locations [16]. Subsequently, the following study builds upon the methodology and effectiveness of a firefighter-led public education campaign on fire prevention that successfully decreased both the frequency and severity of residential structure fires in high-risk areas of Surrey, British Columbia [17]. Subsequently, some studies have used GIS methods to analyze the fire risk in urban areas. In Turkey, a study examined fires that occurred in various locations across Turkey, including cold storage facilities, factories, and manufacturing plants. The case data were utilized to calculate risk scores using Geographic Information System (GIS), Analytical Hierarchy Process (AHP), and Inverse Distance Weight (IDW) methods [18]. In China, in order to select the most suitable fire brigade zone, the following were analyzed: fire risk areas, traffic congestion, land cover, and location. They employed various methods, including Geographic Information System (GIS), multi-criteria decision-making (MCDM), and Location–Allocation (L–A) techniques, along with multi-source geospatial data, such as land cover, points of interest, drive time, and statistical yearbooks. Additionally, they used the Analytical Hierarchy Process (AHP) to thoroughly assess undeveloped areas based on factors such as location, topography, and potential fire risk zones [19]. Afterwards, a study sought to assess fire risk in urban areas by analyzing 19 factors related to economic, social, and built environment aspects, as well as past fire incidents. It employed multi-criteria decision-making (MCDM) techniques, specifically the Analytical Hierarchy Process (AHP), to determine the significance and weighting of each criterion. To illustrate the method’s effectiveness, the research developed an urban vulnerability index map for Ardabil, Iran, using the Fuzzy-VIKOR approach within a Geographic Information System (GIS) framework [20]. Building upon the Analytical Hierarchy Process, a paper from Taiwan evaluated the severity of building fires across 17 villages in Taishan District, New Taipei City. A comprehensive literature review was conducted to examine the influence of fire severity assessment criteria, which served as the foundation for identifying key factors and developing evaluation items within the AHP framework [21]. Turkish colleagues proposed a group decision-making (GDM) approach, integrating the recently developed Best–Worst Method (BWM) [22], a multi-criteria decision-making (MCDM) technique [23], with the Geographic Information System (GIS) to identify optimal locations for new emergency facilities in Istanbul. Their analysis incorporated the input of two decision-makers [24]. The next study aimed to expand the limited empirical research on urban fires in the Global South by analyzing their causes and dynamics. Focusing on disaggregated fire incident data from Kathmandu Metropolitan City (KMC), Nepal, the research identified key contributing factors and examined both the spatial and temporal distributions of urban fires [25]. Subsequently, we present studies that employed techniques belonging to the broader family of probabilistic machine learning. Studies from Japan integrated the earthquake factor as a cause of urban fires. The following article introduced the development of a stochastic model designed for time-series forecasting of post-earthquake fire ignitions in buildings, aiming to enhance post-earthquake fire risk assessment [26]. The same researcher also developed a physics-based urban fire spread model that incorporates the stochastic occurrence of spot fires in the wooden residential areas of Itoigawa City. Utilizing the Monte Carlo method, they compared the simulated results with the actual fire damage recorded in 2016 [27]. Concluding with Japan, a probabilistic approach was introduced to evaluate the cascading risks associated with ground shaking and post-earthquake fires on a regional scale [28].
We will proceed with related studies that make use of machine learning, and, more specifically, supervised learning techniques. The first study examined the existing research on the social, economic, and building stock characteristics associated with residential fire risk in urban neighborhoods [29]. A paper from Australia in 2010 utilized the Bayesian approach to produce detailed spatial forecasts of residential household fires across metropolitan Southeast Queensland [30]. Also from Australia, a study employed a Markov chain approach to estimate the likelihood of residential fire occurrences based on historical fire data. Utilizing fire incident records collected over a decade in Melbourne, Australia, the spatially integrated fire risk model forecasted potential fire events by incorporating spatial and temporal variables as key predictive factors [31]. The next study was conducted in Greece to develop a fire risk estimation model that integrates recent land cover changes alongside other critical risk factors. They implemented a Support Vector Machine (SVM) algorithm [32] combined with the Analytical Hierarchy Process (AHP) within a Geographic Information System (GIS) platform. This approach allowed for a more precise assessment of fire-prone areas. As a case study, they applied this methodology to the Dadia–Lefkimi–Soufli National Forest Park, ensuring a comprehensive evaluation of the fire risk in the region [33]. Moreover, American researchers introduced two machine learning models, utilizing random forest [34,35] and Extreme Gradient Boosting (XGBoost) [36] to forecast future service demand in urban areas based on spatial data analysis, in collaboration with the Victoria Fire Department, USA [37]. Moving forward, another fire risk model was implemented within the Pittsburgh Bureau of Fire (PBF), and an initial risk model was developed for predicting residential property fire risk [38]. Furthermore, the subsequent study incorporated a novel deep sequence learning model, referred to as the Fire Situation Forecasting Network (FSFN), to enhance the processing of information and the analysis of spatiotemporal correlations within regional urban fire alarm datasets [39]. The following study, conducted in Iran, sought to apply machine learning algorithms to enhance the accuracy of predicting firefighting operation duration in urban areas while also identifying the key factors that significantly impact this timeframe [40]. Moreover, the next study investigated urban fire incidents in Austin, Texas, by employing machine learning techniques, specifically random forest and time-series modeling through the autoregressive integrated moving average (ARIMA) approach. The analysis revealed that ARIMA models generally perform better in forecasting most categories of fires, with the exception of vehicle-related fires. Furthermore, the findings underscored considerable variation in model accuracy across different urban districts, suggesting that localized factors significantly influence fire incidence prediction [41]. Building upon the need to address both the spatial and temporal dimensions of urban fire risk, the following study introduced a deep neural network (DNN) framework designed to generate 30-day cumulative fire occurrence maps at a spatial resolution of 2.5 km × 2.5 km for the metropolitan area of Hangzhou, China. Drawing on a rich dataset spanning nine years (2015–2023), the proposed approach synthesized diverse data sources—including meteorological variables, urban land use information, and historical daily fire incident records—to enhance predictive accuracy and provide a holistic view of urban fire dynamics [42].
In an effort to advance the understanding of fire risks in urban residential settings, the next paper introduced a predictive framework that integrates tree-based machine learning algorithms (random forest, AdaBoost, XGBoost, and CatBoost) with resampling strategies to estimate the likelihood of damage and casualties resulting from residential building fires. However, XGBoost was the most time-efficient [43]. The following study was conducted in Oregon and involved the analysis of over 48,000 reported structure fire incidents that occurred between January 2012 and August 2023. The dataset comprised 2136 fires resulting in civilian casualties, including 317 confirmed fatalities. To assess the severity of injuries, bagged decision tree classifiers utilizing the random forest algorithm were employed. These models were used to evaluate the relative importance of various contributing factors, including socioeconomic conditions, population demographics, structural and behavioral incident characteristics, and the availability of local infrastructure [44]. Furthermore, colleagues from Seoul, Korea applied machine learning to predict fire-related property damage and analyze the contributing factors using three years of spatial fire data. Using k-fold cross-validation, the random forest algorithm achieved 83% accuracy in forecasting property damage [45].
Closing the Introduction, brief reference will also be made to machine learning, which employs unsupervised learning techniques. With this in mind, a weighted fire risk calculation method was developed, incorporating the frequency of fire occurrences, direct economic losses, and fire-related casualties. According to this approach, and with enhancements to the K-means clustering algorithm [46], this study introduced a fire risk K-means clustering model. This model offers an improved solution for the automated classification of fire risk levels [47]. The subsequent paper employed an unsupervised deep learning (DL) approach to categorize hazard levels at fire sites and utilized an autoregressive integrated moving average (ARIMA) model to predict temperature variations, leveraging the extrapolation capabilities of a random forest regressor [48]. In a related effort, the next article introduced a methodology for forest fire detection utilizing unsupervised location-expert autoencoders in conjunction with Sentinel-1 SAR time-series data. The models were trained on multitemporal SAR imagery from a designated reference period and used to identify anomalous time series within the same region during a test period. Three variations of the autoencoder were presented, incorporating either temporal or spatiotemporal features, and their performance was compared against that of a state-of-the-art supervised autoencoder [49]. Aligned with similar methodologies, the following research may represent a pioneering effort in applying clustering analysis to explore the fire response of reinforced concrete (RC) columns. The results clearly demonstrate that unsupervised machine learning can yield valuable insights for fire engineering—insights that are often overlooked by conventional supervised learning approaches [50].
Following this approach, the subsequent study applied two unsupervised learning techniques, Principal Component Analysis (PCA) and K-means clustering utilizing Sentinel 2 satellite imagery, elevation data, and the Zagros Grass Index (ZGI), to detect areas at high risk of wildfire in the increasingly vulnerable Kurdo Zagrosian forests. Among the two, PCA outperformed K-means by accurately identifying 80% of the areas burned between 2021 and 2023 as falling within moderate- to high-risk fire zones [51].
This paper proposes the use of modern machine learning techniques based on Grammatical Evolution [52] to predict the potential damage caused by urban fires. This prediction was based on data that have been collected and subsequently digitized by the Greek Fire Service. After digitizing the original data, three categories were created depending on the size of the disaster: small-scale disaster, medium-scale disaster, and large-scale disaster. Therefore, the problem of predicting the magnitude of the disaster was transformed into a classification problem so that machine learning techniques could be applied to it. The techniques used in the conducted experiments include the construction of neural networks [53,54], the feature construction of artificial features from the original ones using Grammatical Evolution, and the production of classification rules. The obtained results are compared against the results from various traditional machine learning methods, and a discussion is provided in Section 3 of this manuscript. The methods utilized here include the construction of artificial features from the original ones, the construction of neural networks, and the production of classification rules. These techniques cover a wide range of machine learning techniques that have been presented in recent years and have shown high performance when applied to a variety of problems from various research areas. Furthermore, they can be used to effectively identify the most critical features of a problem, drastically reducing the number of inputs necessary for the efficient training of machine learning models. A key problem with classical machine learning techniques is the excessive number of features that a dataset can have in relation to the number of patterns that accompany it. The techniques used in this work can significantly reduce this number and select the most important ones for the effective training of machine learning techniques. Furthermore, in many cases, some of the inputs to the problem may not contribute to the effective training of machine learning models and should be omitted.
The rest of this manuscript is divided as follows: in Section 2, the proposed methods are presented in detail. In Section 3, the experiments are illustrated and discussed. Finally, in Section 4, some conclusions are presented.

2. Materials and Methods

This section begins with a detailed description of the used datasets and continues with a brief presentation of the Grammatical Evolution technique, concluding with the full description of the used techniques.

2.1. The Used Datasets

The dataset utilized in this research was sourced from the Hellenic Fire Service in compliance with open data guidelines established by European Union Directive (2013/37/EU), aiming to promote transparency and open access to governmental records. The dataset contains comprehensive records detailing urban fire incidents specifically for the calendar years 2014–2023. These datasets were downloaded from https://www.fireservice.gr/el_GR/synola-dedomenon (accessed on 29 April 2025).
For each urban fire event documented, detailed information was systematically collected, including the date and precise time of occurrence, allowing for temporal analysis and identification of patterns over various time intervals. The geographic location for each incident was also reported with a municipality code. In addition, specific characteristics relevant to each fire event were captured, including the probable cause or origin of the fire, which helps in identifying common fire risk factors within urban settings. Data regarding the structural properties involved, such as building type or property classification, were also documented, contributing to a comprehensive risk profile for urban infrastructure.
Furthermore, human casualty data detailing the number of fatalities and injuries associated with each incident were recorded. The dataset indicated an average of 0.002 fatalities per incident, with a maximum of 2 fatalities observed in a single event. Injuries averaged at approximately 0.0008 per incident, with a maximum of 1 injury recorded per event. Additionally, instances of burn injuries were relatively infrequent, averaging around 0.002 per incident, with a maximum count of 2 burn cases reported.
Information on the resources deployed was also comprehensively documented. On average, each incident involved approximately 1.65 firefighting vehicles, with a maximum of 24 vehicles responding to the most severe incidents. Personnel deployment averaged about 4.18 firefighters per incident, with an interquartile range from 2 to 5 firefighters, and up to 67 personnel attending a single event in extreme cases.
The dataset underwent thorough preprocessing procedures to ensure high-quality data for analysis. These procedures included validation checks for data accuracy, consistency, completeness, and the removal or correction of any identified errors or inconsistencies. Such rigorous preprocessing steps were critical for enhancing the reliability and validity of the analytical processes that followed. A review of data preprocessing techniques for neural networks is provided in the work of Nawi et al. [55].
Based on data from the Hellenic Fire Service, we isolated and processed the pre-registered categories of small, medium, and large fires, excluding other categories that were not relevant to the scope of our research. The classification of a fire as small, medium, or large may be determined in the field by firefighters, particularly when additional flammable materials are present in the surrounding area, when chemical substances that can accelerate the fire are involved, or when there is an exceptional risk to human lives. Furthermore, according to our data, urban fires have been recorded at 146 distinct locations, each assigned a unique identification number (code). For example, as an indicative reference, in 2023, the fire department responded to 21,606 fire incidents in apartment buildings (code 18), 9,106 on streets (code 22), 5219 in single-family homes (code 39), 4971 in vacant lots (code 35), 2389 in vehicles (code 6), 1322 in duplex houses (code 37), and 1270 in waste disposal areas (code 54). Beyond these, some unusual locations were also recorded, including 140 firefighting interventions in wells (code 143), 38 in cemeteries (code 82), 106 in marine areas (code 69), 4 in public toilets (code 112), and so forth. Table 2 depicts the features used in this dataset.
Hence, the problem of predicting the extent of damage caused by urban fires can be considered as a classification problem, where any optimization method can be used to minimize the following training error:
E M x , p = i = 1 K M x i , p t i 2
where the function M x , p represents a machine learning model and the vector p represents the parameters of the model that should be estimated by any optimization method. The set T = x 1 , t 1 , x 2 , t 2 , , x K , t K represents the training set of the input problem, where the vectors x i stand for the input patterns and the values t i are the expected outputs. The constant K represents the number of patterns in the train set.

2.2. Grammatical Evolution

The algorithm of Grammatical Evolution can be considered as a genetic algorithm where the chromosomes, which are series of positive integer values, denote production rules of any given BNF (Backus–Naur form) grammar [56]. The method has been incorporated in various cases from real-world applications, such as data fitting [57,58], solutions of trigonometric equations [59], composition of music [60], neural network construction [61,62], producing numeric constraints [63], video games [64,65], energy problems [66], combinatorial optimization [67], cryptography [68], etc. The BNF grammars are used to describe the syntax of programming languages and can be defined as sets G = N , T , S , P , where
  • The set N represents the non-terminal symbols of the grammar. Each non-terminal symbol can be replaced with a series of terminal symbols with the assistance of some associated production rules.
  • The set T contains the terminal symbols.
  • S is considered as the start symbol of the grammar with the assumption S N .
  • The set P contains the production rules of the grammar, used to replace non-terminal symbols with series of terminal ones.
The production procedure of Grammatical Evolution starts from the symbol S and through a series of steps creates valid programs by replacing non-terminal symbols with series of terminal symbols following the selected rules. Every production rule is is selected using the following steps:
  • Obtain the next element V from the chromosome that is processed.
  • Select the production rule as Rule = V mod R, where R defines the total number of production rules for the non-terminal symbol that is under processing.

2.3. Neural Network Construction Using Grammatical Evolution

The neural network construction method was initially presented in the paper of Tsoulos et al. [69], and it is used to determine the optimal architecture of artificial neural networks as well as the optimal set of parameters for the network. The neural network construction mechanism utilizes the Grammatical Evolution procedure in order to produce artificial neural networks in the form
N x , w = i = 1 H w ( d + 2 ) i ( d + 1 ) σ j = 1 d x j w ( d + 2 ) i ( d + 1 ) + j + w ( d + 2 ) i
In this equation, the term H represents the number of processing units (weights) of the network. The function σ ( x ) stands for the sigmoid function. The grammar used by Grammatical Evolution to produce neural networks in the form of Equation (2) is outlined in Figure 2, which has been in the initial work for neural network construction with Grammatical Evolution [69]. This method has been incorporated in problems such as chemistry problems [70], estimation of solutions of differential equations [71], etc.
The main steps of the algorithm used to produce neural networks are outlined below:
  • Initialization Step.
    (a)
    Set as N c the number of chromosomes and as N g the number of allowed generations.
    (b)
    Set as p s the selection rate with p s 1 and as p m the mutation rate with p m 1 .
    (c)
    Initialize randomly each chromosome c i , i = 1 , , N c as a set of randomly selected integers.
    (d)
    Set  k = 0 as the generation counter.
  • Fitness Calculation Step.
    (a)
    For  i = 1 , , N c , do
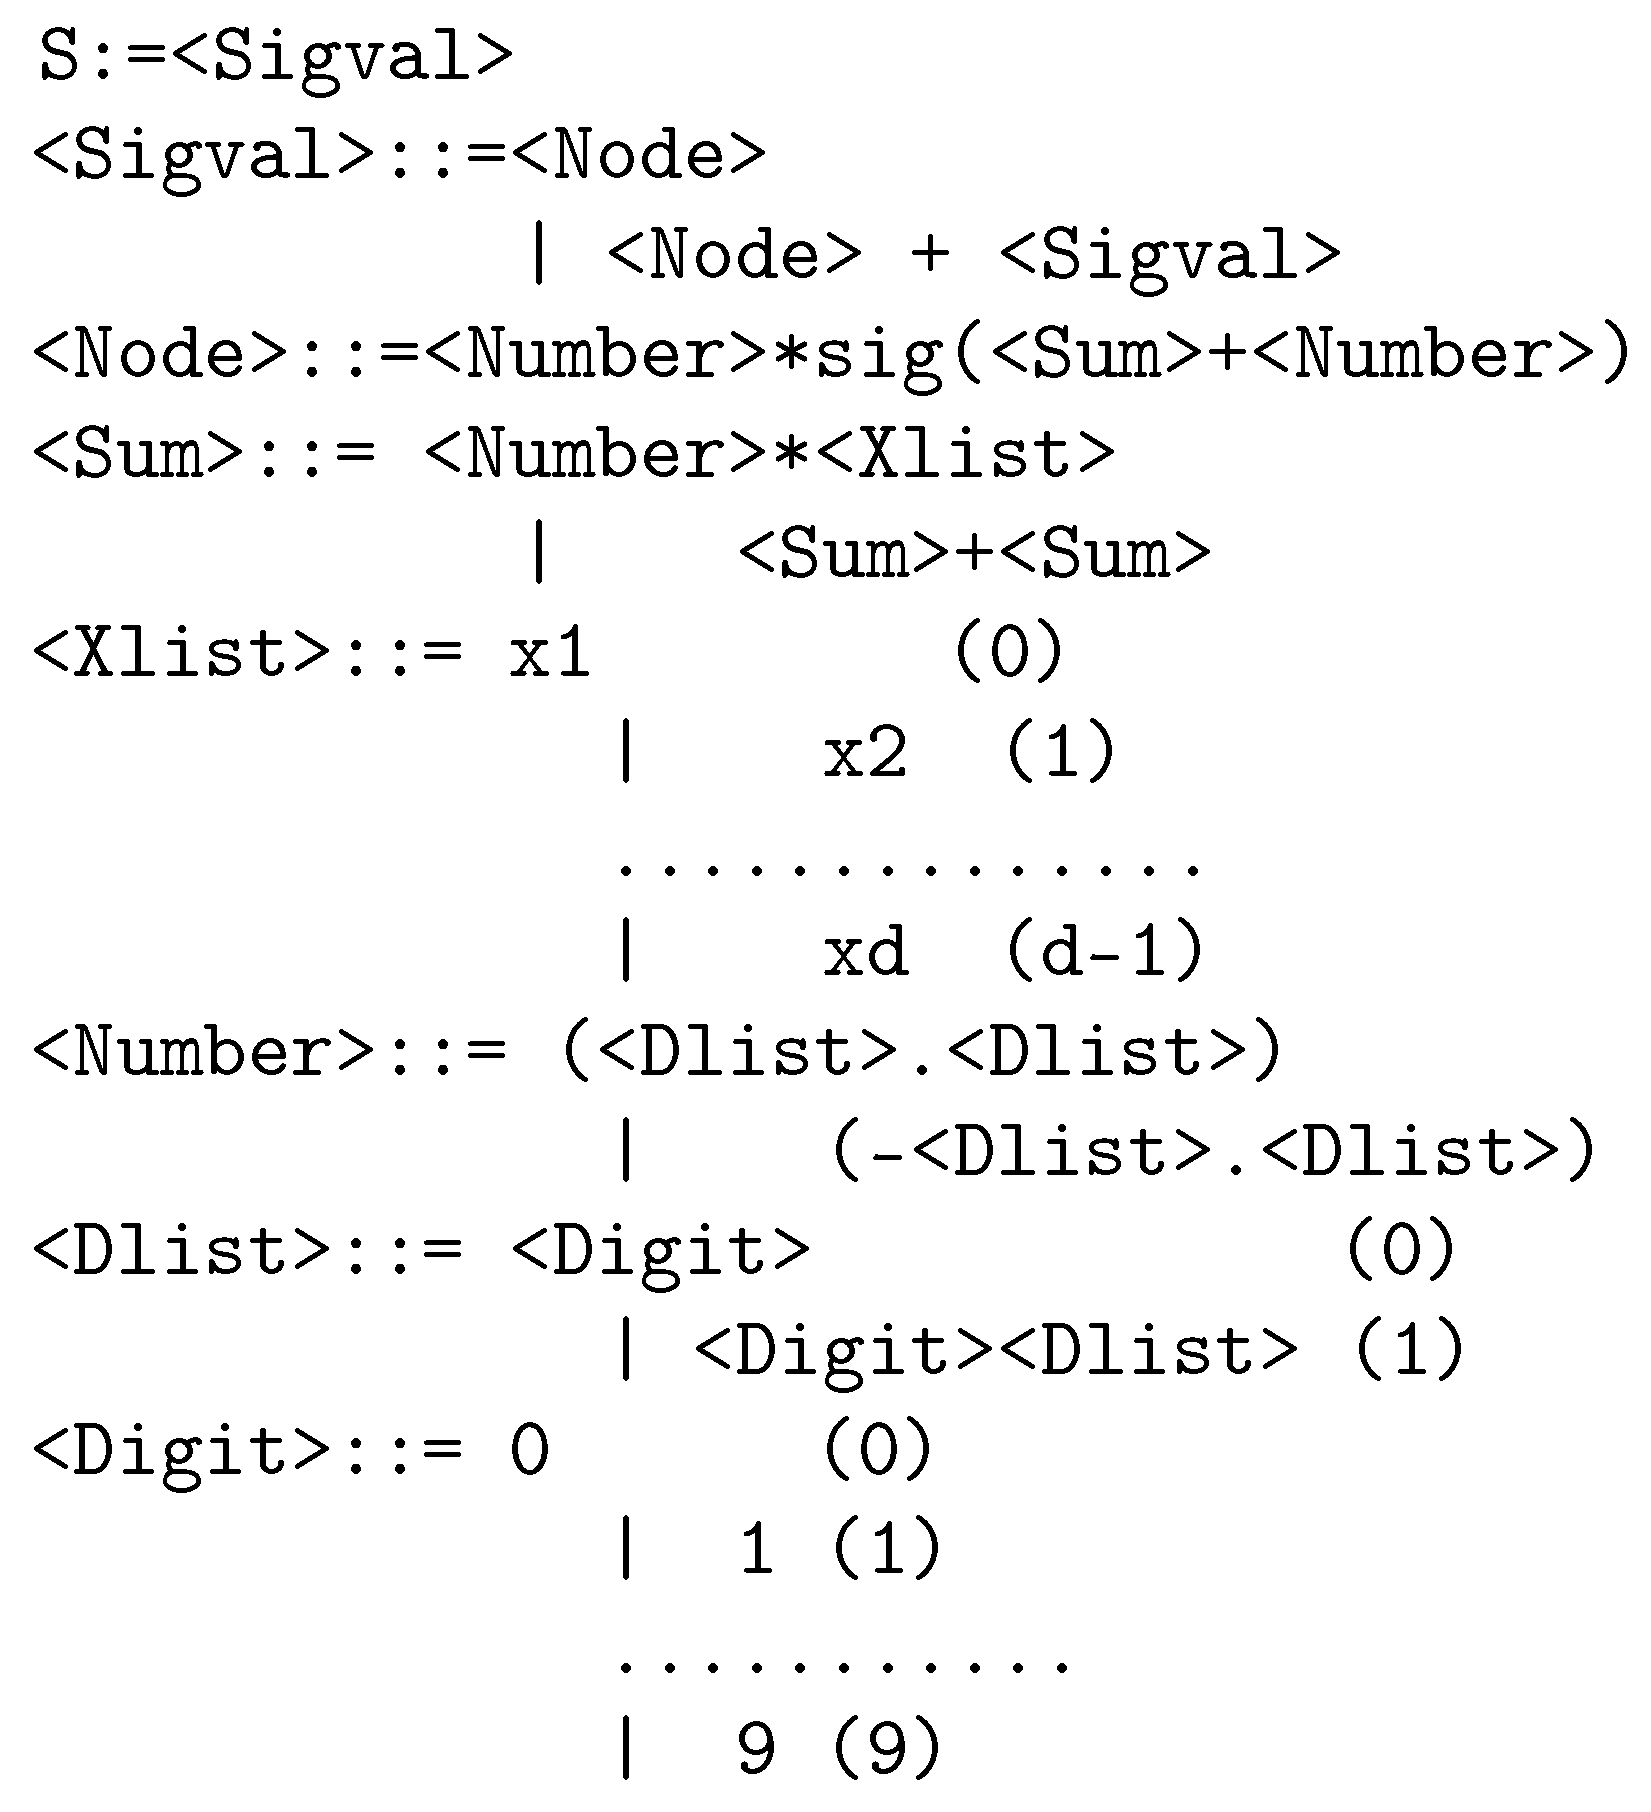
    • Create using the grammar of Figure 2 the corresponding neural network N i ( x ) for the chromosome c i .
    • Set as the fitness f i of the chromosome g i the training error of neural network N i ( x ) .
    (b)
    End For
  • Application of Genetic Operations.
    (a)
    Application of selection. The best p s × N c chromosomes are copied to the next generation. The remaining are substituted by chromosomes produced during crossover and mutation.
    (b)
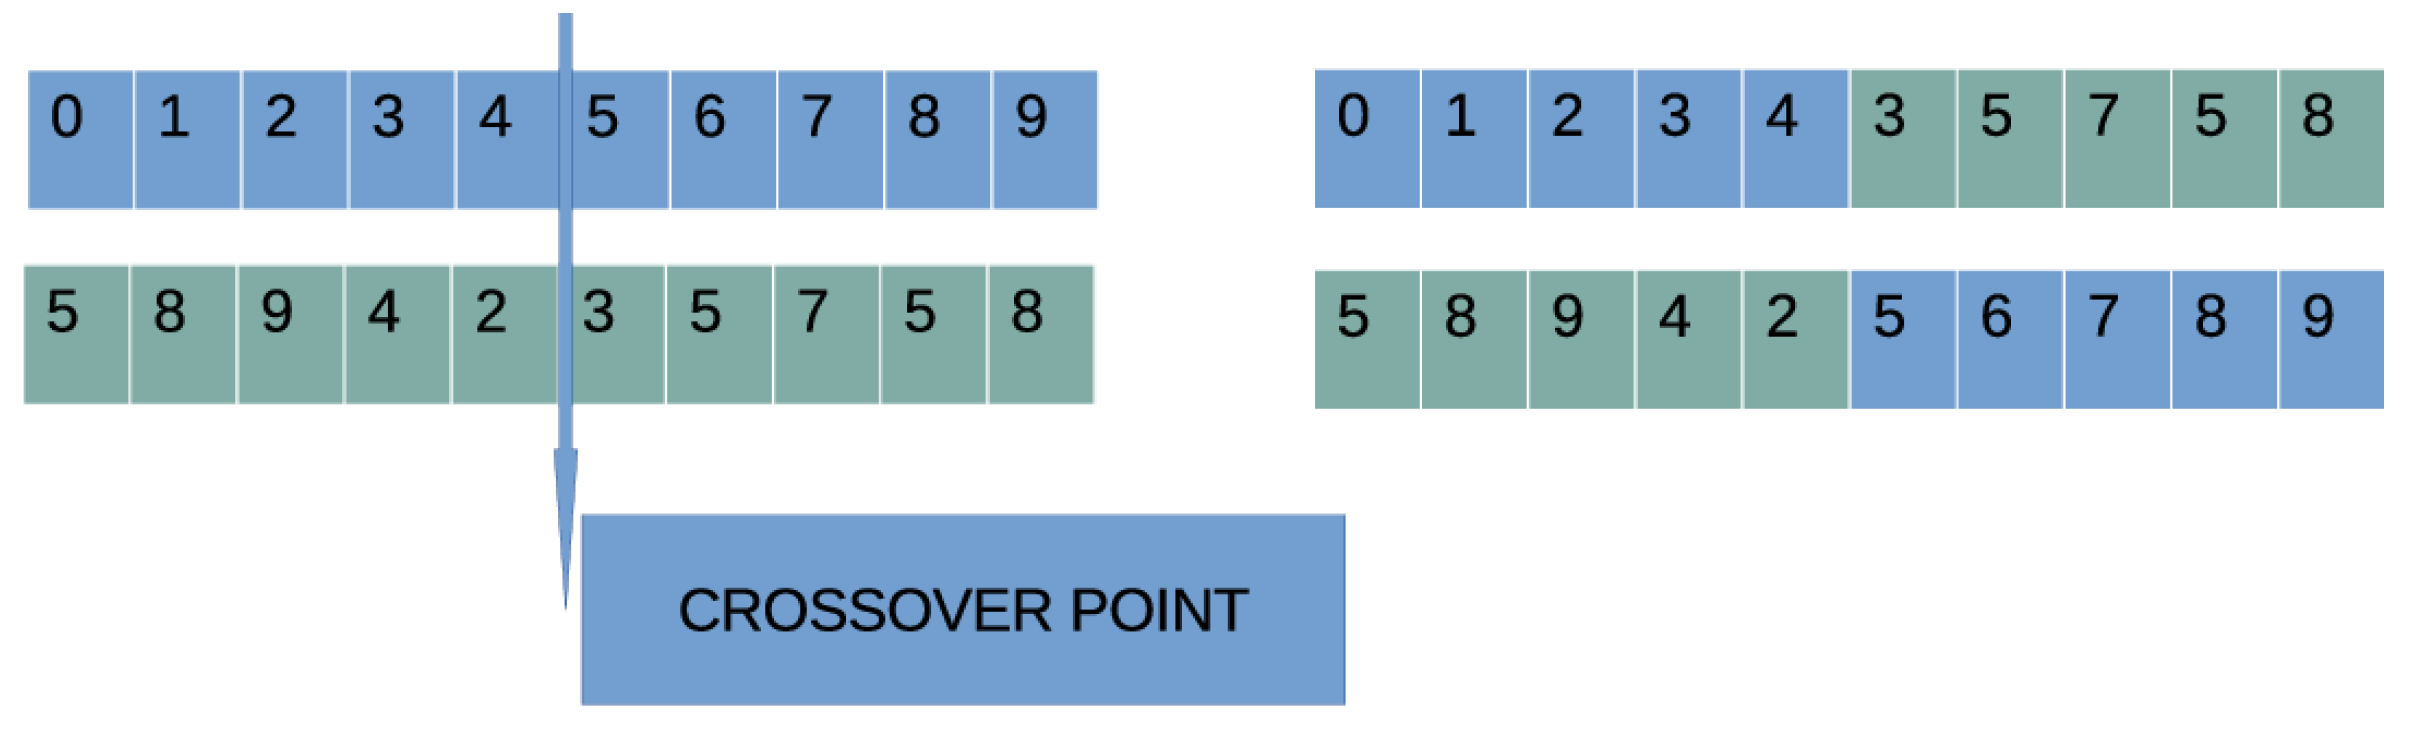
    Application of crossover. During this procedure, new chromosomes will be created from selected chromosomes from the current generation. For each pair z , w of produced chromosomes, two chromosomes p 1 and p 2 will be selected from the current population using tournament selection. The new chromosomes will be produced using one-point crossover [72], which is graphically illustrated in Figure 3.
    (c)
    Application of mutation. For every element of each chromosome, a random number r 1 is drawn. The corresponding element is altered randomly when r p m .
  • Termination Check Step.
    (a)
    Set  k = k + 1
    (b)
    If  k < N g , then go to fitness calculation step.
  • Testing step.
    (a)
    Obtain the chromosome c * with the lowest fitness value in the population.
    (b)
    Create the corresponding neural network N * ( x ) and apply it to the test set and report the associated error.

2.4. Feature Construction Using Grammatical Evolution

The next method used in the performed experiments is the feature construction technique, initially presented in the work of Gavrilis et al. [73]. The method utilizes the Grammatical Evolution procedure to create artificial features from the original ones and hence can be used to enhance the effectiveness of any applied machine learning model to the artificial data. The artificial features are non-linear mappings of the original ones, and the grammar used by the method to construct such features is shown in Figure 4, which also was initially presented in the original work of the feature construction method [73].
The features produced by this procedure can be evaluated using any machine learning method, although the Radial Basis Function (RBF) networks [74,75] were used due to the speed of their corresponding training procedure. The main steps of this procedure are the following:
  • Initialization step.
    (a)
    Define as N c the number of chromosomes and as N g the number of allowed generations.
    (b)
    Define the selection rate p s and the mutation rate p m .
    (c)
    Define as N f the number of constructed features.
    (d)
    Initialize the c i , i = 1 , , N c chromosomes as vectors of randomly selected integers.
    (e)
    Set  k = 0 , the generation counter.
  • Fitness calculation step.
    (a)
    For  i = 1 , , N c , do
    • Create  N f artificial features y 1 , y 2 , , y N f for the chromosome c i . The production is performed using the grammar of Figure 4.
    • Modify the train set of the objective problem using the features y 1 , y 2 , , y N f .
    • Apply a machine learning model to the modified set and define as the fitness value f i the corresponding training error.
    (b)
    End For
  • Application of genetic operations. Apply the same genetic operations as in the case of Neural Construction method of Section 2.3.
  • Termination check step.
    (a)
    Set  k = k + 1 .
    (b)
    If  k < N g , go to fitness calculation step.
  • Testing step.
    (a)
    Obtain the chromosome c * with the lowest fitness value.
    (b)
    Produce the features y 1 * , y 2 * , , y N f * for this chromosome.
    (c)
    Modify the test set of the objective problem using the previously created features.
    (d)
    Apply any machine learning model to the test set and report the associated error.

2.5. Create Classification Rules Using Grammatical Evolution

The third method used in the conducted experiments based on Grammatical Evolution is the method that produces classification rules [76]. This method has also been published as a software recently [77]. The BNF grammar used by this method is shown in Figure 5. The main steps of this method are as follows:
  • Initialization step.
    (a)
    Define as N c the total number of chromosomes and with N g the allowed number of generations.
    (b)
    Define the selection rate p s and the mutation rate p m .
    (c)
    Initialize as vectors of randomly selected integers the chromosomes c i , i = 1 , , N c .
    (d)
    Set  k = 0 , the generation counter.
  • Fitness calculation step.
    (a)
    For  i = 1 , , N c , do
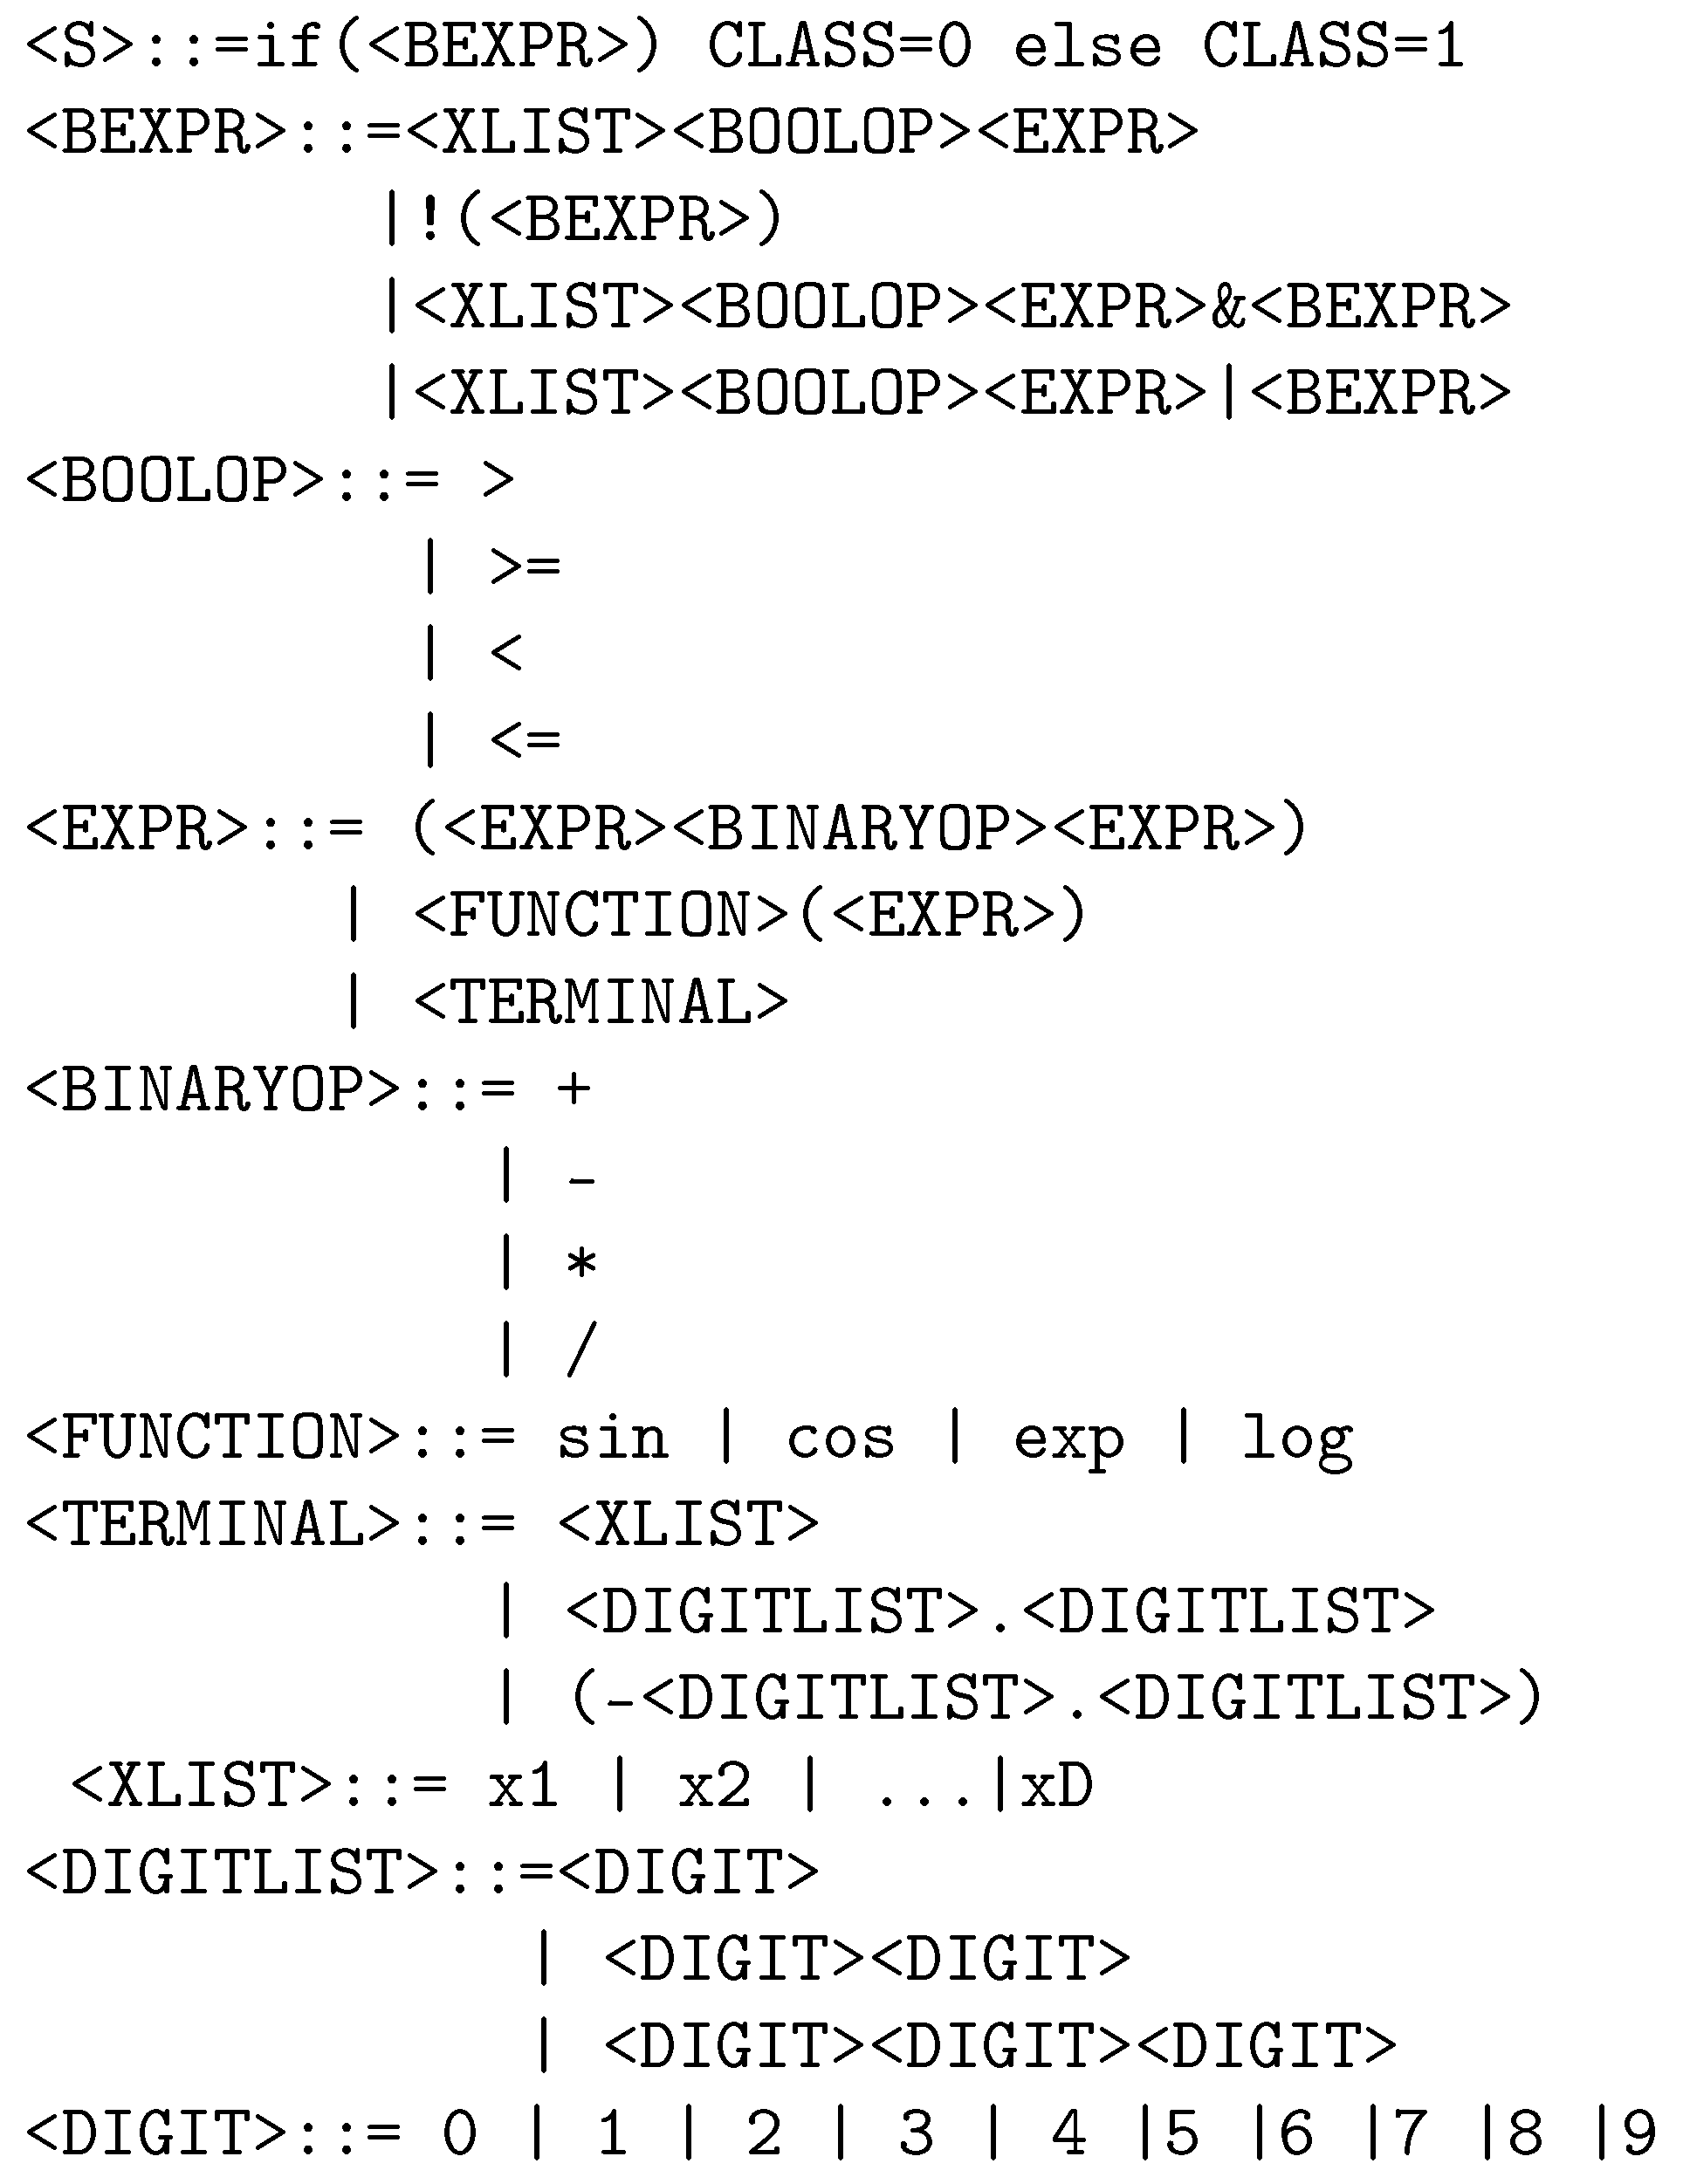
    • Create using the Grammatical Evolution procedure and the grammar depicted in Figure 5 a classification program G i for the corresponding chromosome c i .
    • Set the fitness f i as
      f i = j = 1 M G i x j t j 2
      for the corresponding training set T = x 1 , t 1 , x 2 , t 2 , , x M , t M . The values x i denote the input patterns and the value t i the expected outcome for pattern x i .
    (b)
    End For
  • Genetic operation step. Apply the same genetic operations as in the case of Neural Construction method of Section 2.3.
  • Termination check step.
    (a)
    Set  k = k + 1 .
    (b)
    If  k < N g , then go to fitness calculation step.
  • Testing step.
    (a)
    Obtain the best chromosome c * and produce the associated classification program G * .
    (b)
    Apply the classification program to the test set of the problem and report the result.
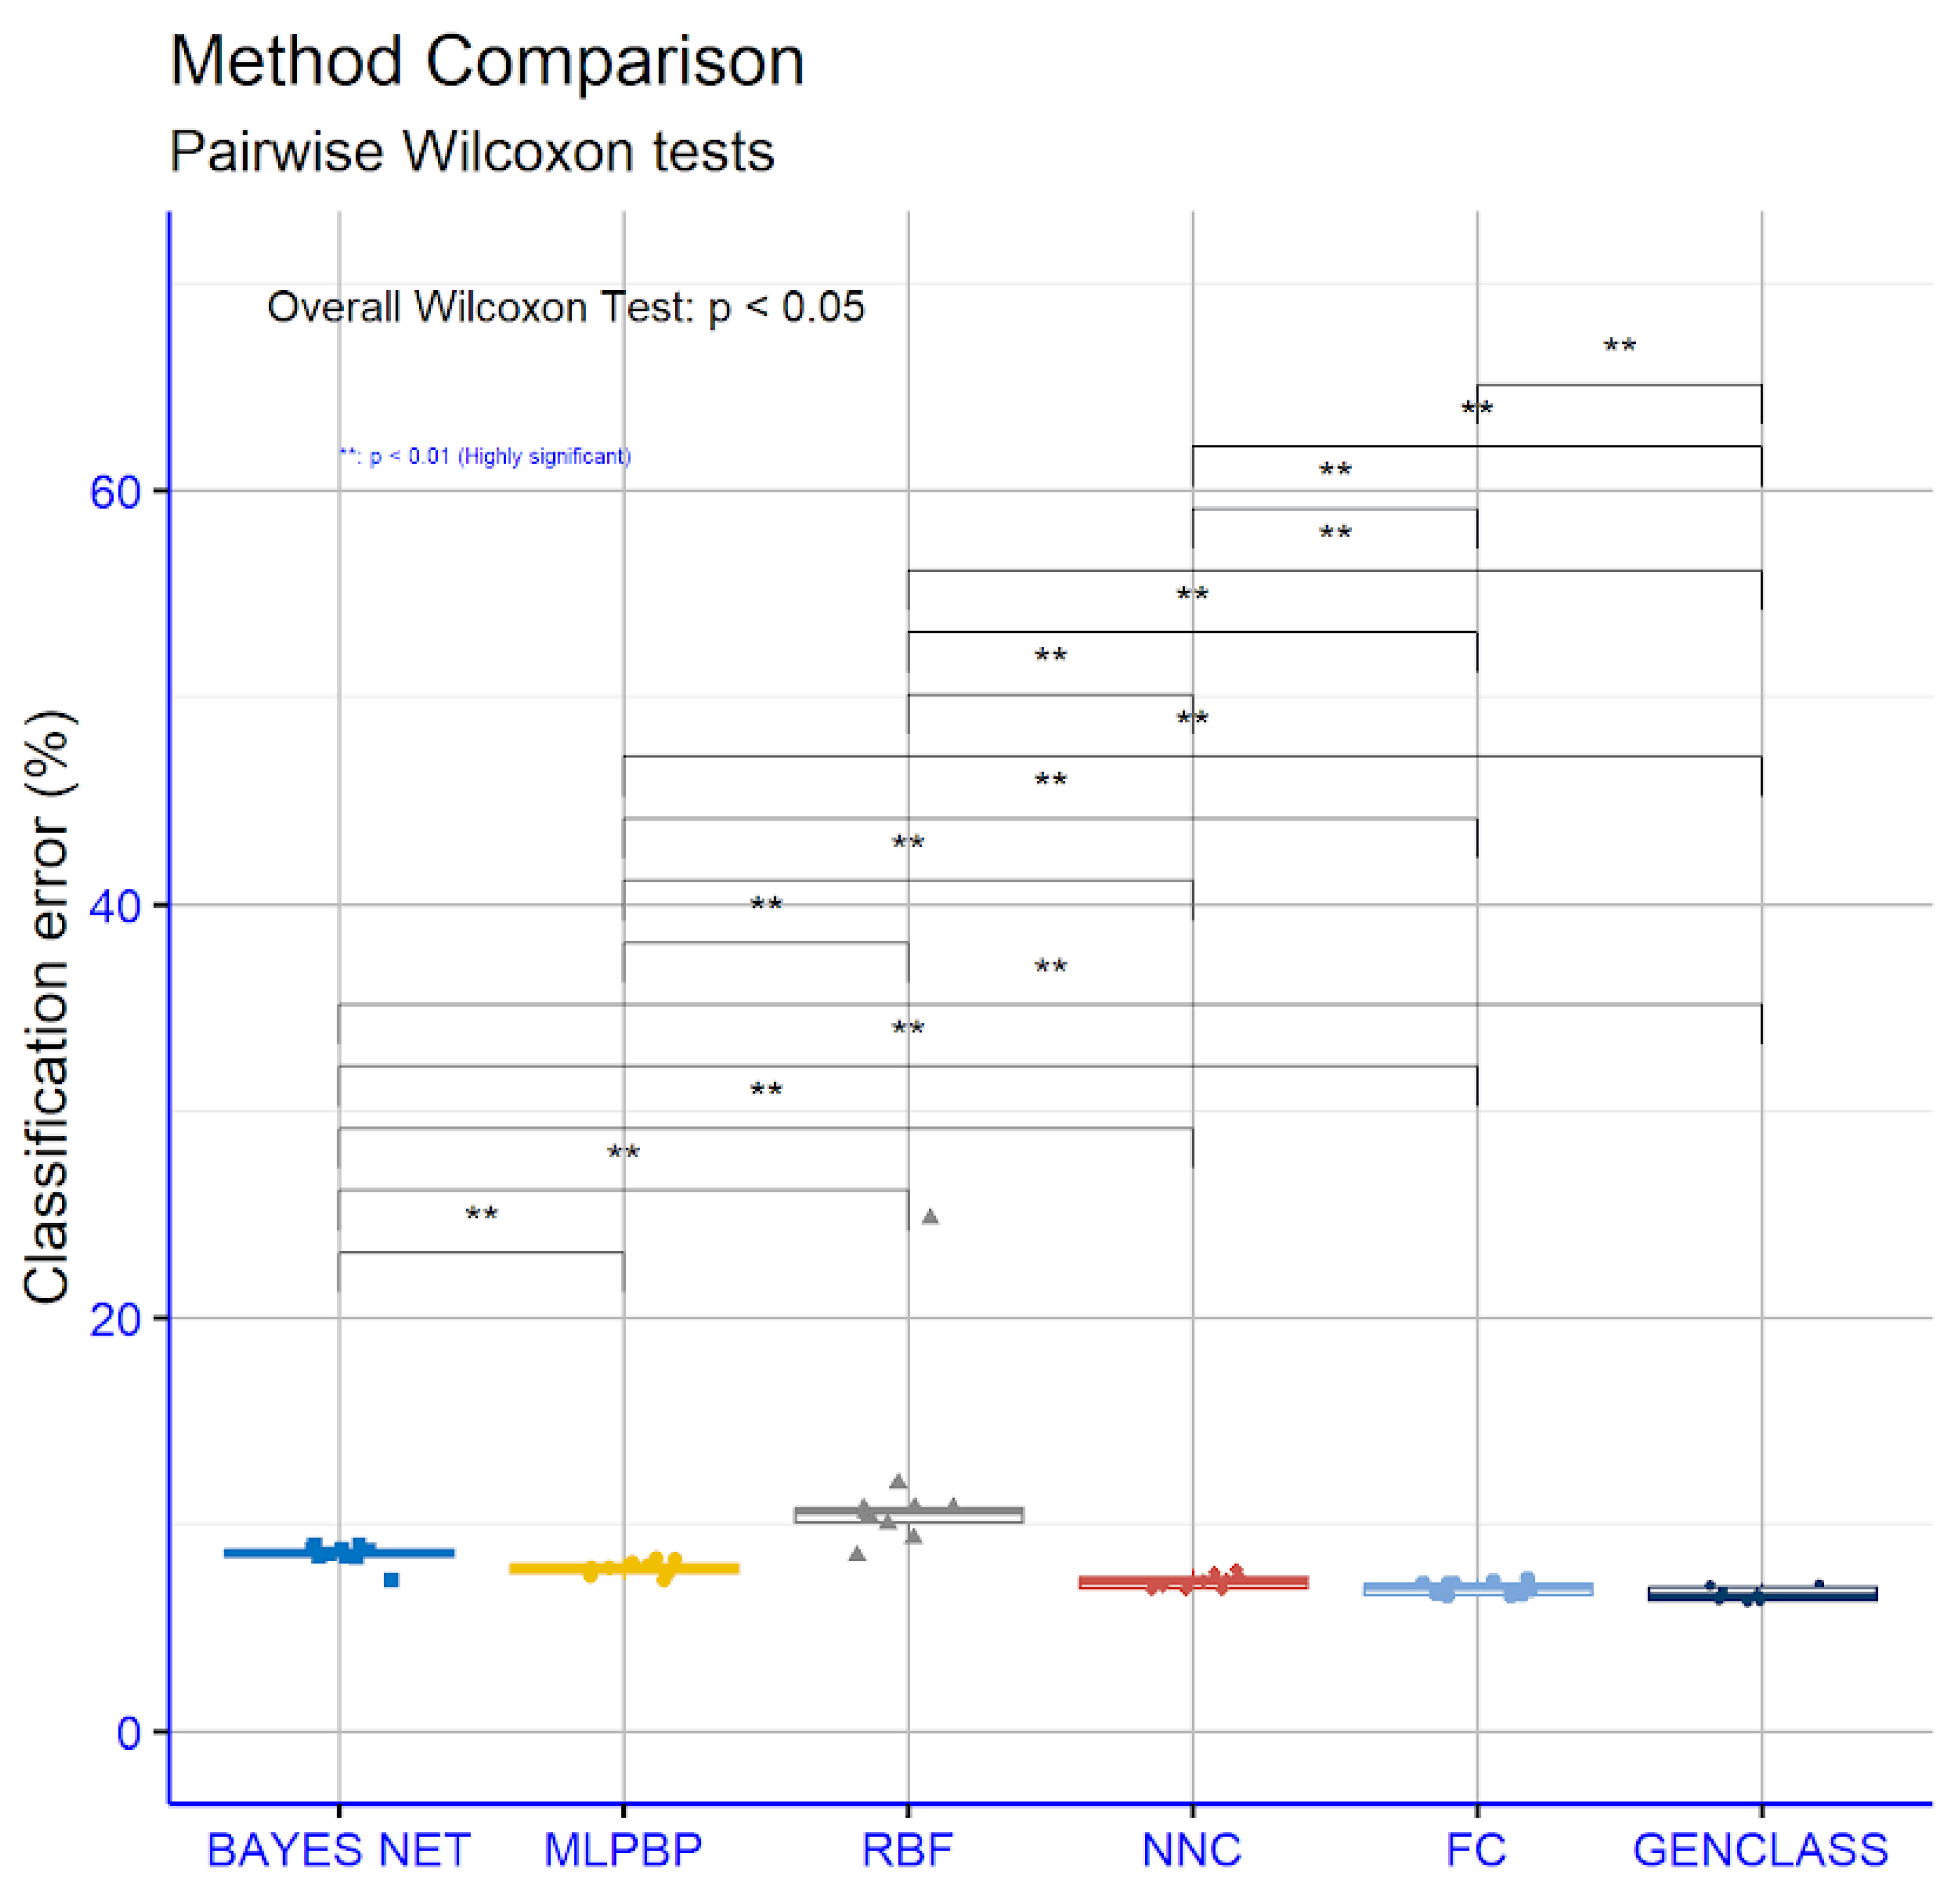
3. Results

The code used in the experiments was implemented in C++ programming language with the assistance of Optimus optimization environment, freely available from https://github.com/itsoulos/GlobalOptimus/ (accessed on 2 April 2025). Also, the freely available programming tool of WEKA [78] was used for some of the experiments, which can also be downloaded freely from https://ml.cms.waikato.ac.nz/weka/(accessed on 2 April 2025). For the validation of the experiments, the method of ten-fold cross-validation was incorporated. All the experiments were conducted on a machine running Debian Linux with 128 GB of RAM. The values for the experimental settings are shown in Table 3.
Also, Table 4 contains the experimental results where the following notations are used:
  • The year column denotes the year for which the methods were applied.
  • The patterns column denotes the number of patterns in the test set for every year.
  • The BAYES NET column denotes the application of the Bayesian Network method [79,80].
  • The MLP column represents the incorporation of an artificial neural network with H = 10 processing nodes, which was trained using the Back Propagation method [81,82].
  • The RBF column denotes the use of a Radial Basis Function network with H = 10 processing nodes.
  • The NNC column represents the use of the neural network construction method described in Section 2.3.
  • The FC column stands for the use of the feature construction method provided in Section 2.4.
  • The GENCLASS column denotes the use of the method that creates classification rules, described in Section 2.5.
  • The final row, average, represents the average classification error for all the years between 2014 and 2023.
In Table 4, GENCLASS demonstrates the lowest average classification error (6.62%), making it the most reliable model for wildfire prediction. This method presents better results compared to other techniques as it can isolate the necessary features of the problem but also identify hidden correlations that could lead to lower classification errors through the automatic creation of classification rules. It is followed by FC with an average error of 6.90% and NNC with 7.23%. Traditional models such as BAYES NET (8.54%) and MLP(BP) (7.87%) exhibit higher error rates, while RBF performs the worst, with an average error of 11.78%, including an exceptionally high value in 2019 (24.81%), likely due to overfitting or sensitivity to outliers. GENCLASS not only has the lowest error but also shows consistent improvement over time. Starting at 7.03% in 2014, it decreased to 6.20% in 2023, with minor fluctuations in between. FC and NNC also display a declining trend but with greater variability. In contrast, MLP(BP) and BAYES NET show no clear improvement, with BAYES NET even experiencing a slight increase in error in 2022–2023. RBF, despite improving after 2019, remains unstable and less reliable. When comparing the top three models (GENCLASS, FC, and NNC), GENCLASS consistently outperforms the others in all the years except 2019, where FC had a marginally better performance. NNC, while superior to the traditional methods, lags behind GENCLASS and FC. The remaining models (BAYES NET, MLP(BP), and RBF) appear less competitive in accuracy compared to the newer techniques. The data strongly support GENCLASS as the optimal model for wildfire prediction due to its consistently low and stable error rate, as well as its progressive improvement over time. FC and NNC remain viable alternatives with good performance, but GENCLASS maintains a clear advantage. The other models, particularly RBF, may require further optimization to enhance reliability. The steady performance of GENCLASS makes it the safest choice for practical applications.
Within the framework of statistical analysis, R language scripts were executed to extract significance levels (p-values) for performance differences between the classification models. The results, shown in Figure 6, reveal statistically significant differences between the compared models. Specifically, all the pairwise model comparisons yielded p-values below the standard significance threshold (typically p < 0.05), indicating statistically significant performance differences [83]. The comparison between BAYES NET and MLP(BP) produced p = 0.0098, while BAYES NET’s comparisons with RBF, NNC, FC, and GENCLASS showed even smaller values (p = 0.0039 and p = 0.002), confirming that BAYES NET differs significantly from the other models. Similarly, the MLP(BP) comparisons with RBF, NNC, FC, and GENCLASS all resulted in p = 0.002, demonstrating high statistical significance in their performance differences. The same holds true for RBF’s comparisons with NNC, FC, and GENCLASS (p = 0.002), as well as for the comparisons between NNC, FC, and GENCLASS. The fact that all the p-values are very small (p ≤ 0.0098) confirms that the models do not perform equally and that statistically significant differences exist between them. This is particularly evident in the comparisons involving GENCLASS, which—as previous analysis has shown—stands out for its high accuracy. These results reinforce the conclusion that certain models (such as GENCLASS and FC) are clearly superior to others (like BAYES NET and RBF), a finding that should be considered in practical machine learning applications.
Also, as an example, consider the plot of Figure 7, where the train and test errors for year 2016 are presented using the GENCLASS method.
As shown in this graph, the error in the training set gradually decreases as the generations increase, and the error in the test set initially decreases to reach a constant value after some generations of the genetic algorithm.

4. Conclusions

This study implements the innovative technique of Grammatical Evolution to predict the consequences of urban fires, utilizing a decade of data from the Hellenic Fire Service. The results demonstrate the clear superiority of the GENCLASS method over other machine learning approaches, both in terms of accuracy and interpretability. The method’s ability to generate human-readable classification rules constitutes a significant advantage over traditional “black-box” machine learning models. These rules reveal complex correlations between factors such as meteorological conditions, urban layout, and human activity, providing valuable insights for fire prevention and management. However, the research does face certain limitations that warrant discussion. The reliance on historical data reduces predictive capability in extreme or unprecedented scenarios, such as those caused by climate change. Additionally, the performance of some models, like RBF, shows significant instability in certain cases, likely due to overfitting or sensitivity to outliers. This underscores the need for further algorithm optimization and the integration of additional data to enhance reliability.
The findings of this research confirm that Grammatical Evolution, particularly the GENCLASS method, offers a robust solution for predicting the impacts of urban fires. This method not only achieves the lowest average classification error but also provides transparent interpretable rules that can be directly utilized by fire departments and urban planners. The generated rules uncover critical dependencies, such as the influence of temperature, emergency response times, and demographic characteristics on the extent of damage. This paves the way for developing dynamic evacuation strategies, implementing preventive measures in vulnerable areas, and raising public awareness of fire risks. Moreover, the consistent improvement in GENCLASS’s performance over time suggests its adaptability to changing conditions and its potential for enhancement with new data. However, it is important to recognize that the effectiveness of any predictive method depends heavily on the quality and completeness of the available data, as well as the ability to account for new and unforeseen factors, such as climate change.
To further develop the findings of this research and strengthen their practical application, several directions for future exploration are proposed. First, the integration of real-time data from sensors and satellite systems could significantly improve the accuracy and timeliness of predictions, enabling dynamic model adjustments and rapid responses to emerging threats. Second, extending the method to other geographic regions with different urban and climatic characteristics could explore the generalizability of the findings and identify new factors influencing fire risk. Third, combining Grammatical Evolution with advanced deep learning techniques, such as neural networks for spatiotemporal analysis, could enhance predictive capabilities in complex scenarios involving multiple simultaneous hazards. Finally, developing simulations that account for the long-term impacts of climate change and urban expansion could provide valuable insights for designing more resilient and safer urban environments. These directions have the potential to transform the research findings into practical tools for safeguarding human lives and urban infrastructure.

Author Contributions

C.K., V.C. and I.G.T. conceived the idea and the methodology; C.K. and V.C. implemented the corresponding software; C.K. conducted the experiments, employing objective functions as test cases, and provided the comparative experiments; A.M. performed the necessary statistical tests. All authors have read and agreed to the published version of the manuscript.

Funding

This research has been funded by the European Union: Next Generation EU through the Program Greece 2.0 National Recovery and Resilience Plan, under the call RESEARCH–CREATE–INNOVATE, project name “iCREW: Intelligent small craft simulator for advanced crew training using Virtual Reality techniques” (project code: TAEDK-06195).

Institutional Review Board Statement

Not applicable.

Informed Consent Statement

Not applicable.

Data Availability Statement

Data are contained within the article.

Conflicts of Interest

The authors declare no conflicts of interest.

References

  1. Fires—Wildfires and Urban Fires. Juniata County Appendix CMulti-Jurisdictional Hazard Mitigation Plan Hazard Profiles. 2008, pp. 15–19. Available online: https://juniataco.org/docs/hmp/Appendix%20C%20-%2004-Fire-Urban%20and%20Rural.pdf (accessed on 7 March 2025).
  2. Hossain, M.R.; Smirnov, O. Analyzing the risk factors of residential fires in urban and rural census tracts of Ohio using panel data analysis. Appl. Geogr. 2023, 151, 102863. [Google Scholar] [CrossRef]
  3. Hellenic Fire Service. Open Data. Incident Record. Available online: https://www.fireservice.gr/el_GR/synola-dedomenon (accessed on 7 March 2025).
  4. Greek Wikipedia. The Trial Regarding MATI’s Wildfire. Available online: https://el.wikipedia.org/wiki/%CE%94%CE%AF%CE%BA%CE%B7_%CE%B3%CE%B9%CE%B1_%CF%84%CE%BF_%CE%9C%CE%AC%CF%84%CE%B9 (accessed on 27 February 2025).
  5. Xanthopoulos, G.; Athanasiou, M. Uniting Our Global Wildfire Community; Wildfire, International Association of Wildland Fire: Missoula, MT, USA, 2019; Volume 28.2. [Google Scholar]
  6. World Health Organization (WHO). Burns. 13 October 2023. Available online: https://www.who.int/news-room/fact-sheets/detail/burns (accessed on 13 March 2025).
  7. Natural Hazards Research Australia. Understanding the Black Summer Bushfires Through Research: A Summary of Key Finding from the Bushfire and Natural Hazards CRC. January 2023. Available online: https://www.naturalhazards.com.au/sites/default/files/2023-01/Understanding%20the%20Black%20Summer%20bushfires%20through%20research_final_web_NHRA.pdf (accessed on 13 March 2025).
  8. Australian Government; Australian Public Service Commission. Black Summer. State of the Service Report 2019–20. Available online: https://www.apsc.gov.au/state-service/state-service-report-2019-20/chapter-1-commitment-service/black-summer (accessed on 13 March 2025).
  9. NASA Earth Observatory. Fires Char the Siberian Arctic. 10 July 2024. Available online: https://earthobservatory.nasa.gov/images/153087/fires-char-the-siberian-arctic (accessed on 17 March 2025).
  10. NASA. Landsat Image Gallery. Available online: https://landsat.visibleearth.nasa.gov/view.php?id=153087 (accessed on 17 March 2025).
  11. Latypova, L. Raging Wildfires Devastate Russia’s Far East Sakha Republic. The Moscow Times. 23 July 2024. Available online: https://www.themoscowtimes.com/2024/07/23/raging-wildfires-devastate-russias-far-east-sakha-republic-a85802 (accessed on 17 March 2025).
  12. Sommer, L. Here’s How Climate Change Fueled the Los Angeles Fires. National Public Radio. 29 January 2025. Available online: https://www.npr.org/2025/01/29/nx-s1-5273676/la-fires-climate-change-rainfall-extreme-weather (accessed on 17 March 2025).
  13. McCarthy, J.; Richter, J. Graphics Explain Los Angeles. Rare and Devastating January Fires. World Resources Institute. Wri org. 5 February 2025. Available online: https://www.wri.org/insights/los-angeles-fires-january-2025-explained (accessed on 17 March 2025).
  14. NASA Earth Observatory. Fire Grows Unusually Large in Japan. Available online: https://earthobservatory.nasa.gov/images/154008/fire-grows-unusually-large-in-japan (accessed on 17 March 2025).
  15. Keun-tae, P. Cities Face Rising Fire Risks from Climate Change Without Emission Cuts. ChosunBiz. 3 March 2025. Available online: https://biz.chosun.com/en/en-science/2025/03/05/FXRLKFRXJJB5LK4YXKPLVETVJM/ (accessed on 17 March 2025).
  16. Ceyhan, E.; Ertugay, K.; Duzgun, S. Exploratory and inferential methods for spatio-temporal analysis of residential fire clustering in urban areas. Fire Saf. J. 2013, 58, 226–239. [Google Scholar] [CrossRef]
  17. Clare, J.; Garis, L.; Plecas, D.; Jennings, C. Reduced frequency and severity of residential fires following delivery of fire prevention education by on-duty fire fighters: Cluster randomized controlled study. J. Saf. Res. 2012, 43, 123–128. [Google Scholar] [CrossRef]
  18. Alkis, S.; Aksoy, E.; Akpinar, K. Risk Assessment of Industrial Fires for Surrounding Vulnerable Facilities Using a Multi-Criteria Decision Support Approach and GIS. Fire 2021, 4, 53. [Google Scholar] [CrossRef]
  19. Jiang, Y.; Lv, A.; Yan, Z.; Yang, Z. A GIS-Based Multi-Criterion Decision-Making Method to Select City Fire Brigade: A Case Study of Wuhan, China. Int. J. Geo-Inf. ISPRS 2021, 10, 777. [Google Scholar] [CrossRef]
  20. Noori, S.; Mohammadi, A.; Ferreira, T.; Miguel, G.; Gilandeh, A.; Ghaffari, M.; Ardabili, S.; Seyed, J. Modelling and Mapping Urban Vulnerability Index against Potential Structural Fire-related Risks: An Integrated GIS-MCDM Approach. Fire 2023, 6, 107. [Google Scholar] [CrossRef]
  21. Lee, C.-A.; Sung, Y.-C.; Lin, Y.-S.; Hsiao, G.K.-K. Evaluating the severity of building fires with the analytical hierarchy process, big data analysis, and remote sensing. Nat. Hazards 2020, 103, 1843–1856. [Google Scholar] [CrossRef]
  22. Pamučar, D.; Ecer, F.; Cirovic, G.; Arlasheedi, M.A. Application of improved best worst method (BWM) in real-world problems. Mathematics 2020, 8, 1342. [Google Scholar] [CrossRef]
  23. Taherdoost, H.; Madanchian, M. Multi-criteria decision making (MCDM) methods and concepts. Encyclopedia 2023, 3, 77–87. [Google Scholar] [CrossRef]
  24. Nyimbili, P.H.; Erden, T. Comparative evaluation of GIS-based best—Worst method (BMW) for emergency facility planning: Perspectives from two decision-maker groups. Nat. Hazards 2021, 105, 1031–1067. [Google Scholar] [CrossRef]
  25. KC, K.; Ardianto, R.; Chhetri, P.; Corcoran, J. Geographic patterns of urban fires in the global south: The case of Kathmandu, Nepal. GeoJournal 2024, 89, 137. [Google Scholar] [CrossRef]
  26. Nishino, T.; Hokugo, A. A stochastic model for time series prediction of the number of post—Earthquake fire ignition in buildings based on the ignition record for the 2011 Tohoku Earthquake. Earthq. Spectra 2019, 36, 232–249. [Google Scholar] [CrossRef]
  27. Nishino, T. Physics-based urban fires spread simulation coupled with stochastic occurrence of spot fires. Stoch. Environ. Res. Risk Assess. 2019, 33, 451–463. [Google Scholar] [CrossRef]
  28. Nishino, T. Probabilistic urban cascading multi-hazard risk assessment methodology for ground shaking and post-earthquake fires. Nat. Hazards 2023, 116, 3165–3200. [Google Scholar] [CrossRef]
  29. Jennings, C.R. Social and economic characteristics as determinants of residential fire risk in urban neighborhoods: A review of the literature. Fire Saf. J. 2013, 62, 13–19. [Google Scholar] [CrossRef]
  30. Rohde, D.; Corcoran, J.; Chhetri, P. Spatial forecasting of residential urban fires: A Bayesian approach. Comput. Environ. Urban Syst. 2010, 34, 58–69. [Google Scholar] [CrossRef]
  31. Ardianto, R.; Chhetri, P. Modeling Spatial-Temporal Dynamic of Urban Residential Fire Risk Using a Markov Chain Technique. Int. J. Disaster Risk Sci. 2019, 10, 57–73. [Google Scholar] [CrossRef]
  32. Suthaharan, S. Support vector machine. In Machine Learning Models and Algorithms for Big Data Classification: Thinking with Examples for Effective Learning; Springer: Boston, MA, USA, 2016; pp. 207–235. [Google Scholar]
  33. Maniatis, Y.; Doganis, A.; Chatzigeorgiadis, M. Fire Risk Probability Mapping Using Machine Learning Tools and Multi-Criteria Decision Analysis in the GIS Environment: A Case Study in the National Park Forest Dadia-Lefkimi-Soufli, Greece. Appl. Sci. 2022, 12, 2938. [Google Scholar] [CrossRef]
  34. Breiman, L. Random forests. Mach. Learn. 2001, 45, 5–32. [Google Scholar] [CrossRef]
  35. Rigatti, S.J. Random forest. J. Insur. 2017, 47, 31–39. [Google Scholar] [CrossRef]
  36. Chen, T.; Guestrin, C. Xgboost: A scalable tree boosting system. In Proceedings of the 22nd ACM Sigkdd International Conference on Knowledge Discovery and Data Mining, San Francisco, CA, USA, 13–17 August 2016; pp. 785–794. [Google Scholar]
  37. Dey, A.; Heger, A.; England, D. Urban Fire Station Planning using Predicted Demand and Service Quality Index; Springer Nature: Berlin/Heidelberg, Germany, 2021. [Google Scholar]
  38. Walia, B.S.; Hu, Q.; Chen, J.; Chen, F.; Lee, J.; Kuo, N.; Narang, P.; Batts, J.; Arnold, G.; Madaio, M. A Dynamic pipeline for Spatio-Temporal Fire Risk Prediction. In Proceedings of the 24th ACM SIGKDD International Conference on Knowledge Discovery & Data Mining, London, UK, 19–23 August 2018; pp. 764–773. [Google Scholar]
  39. Jin, G.; Wang, Q.; Zhu, C.; Feng, Y.; Huang, J.; Hu, X. Urban Fire Situation Forecasting: Deep sequence learning with Spatio–temporal dynamics. Appl. Soft Comput. 2020, 97, 106730. [Google Scholar] [CrossRef]
  40. Sahebi, A.; Havasy, B.; Veisani, Y. Predicting firefighting operation time in urban areas using machine learning: Identifying key determinants for improved emergency response. Discov. Appl. Sci. 2025, 7, 250. [Google Scholar] [CrossRef]
  41. Yuan, Y.; Wylie, A.G. Comparing Machine Learning and Time Series Approaches in Predictive Modeling of Urban Fire Incidents: A Case Study of Austin, Texas. ISPRS Int. J. Geo-Inf. 2024, 13, 149. [Google Scholar] [CrossRef]
  42. Zhou, Y.; Lin, P.; Wang, N. A deep neural network approach for regional-scale 30-day accumulated urban fire occurrence forecast. Fire Saf. J. 2025, 152, 104331. [Google Scholar] [CrossRef]
  43. Liu, Z.; Zhuang, Y. An investigation using resampling techniques and explainable machine learning to minimize fire losses in residential buildings. J. Build. Eng. 2024, 95, 110080. [Google Scholar] [CrossRef]
  44. Schmidt, A.; Gemmil, E.; Hoskins, R. Machine Learning Based Risk Analysis and Predictive Modeling of Structure Fire Related Casualties. Mach. Learn. Appl. 2025, 20, 100645. [Google Scholar] [CrossRef]
  45. Seo, M.S.; Castillo-Osorio, E.E.; Yoo, H.H. Fire Risk Prediction Analysis Using Machine Learning Techniques. Sens. Mater. 2023, 35, 3241–3255. [Google Scholar] [CrossRef]
  46. MacQueen, J. Some methods for classification and analysis of multivariate observations. Berkeley Symp. Math. Statist. Prob. 1967, 1967, 281–297. [Google Scholar]
  47. Lizhi, W.; Aizhu, R. Urban Fire Risk Clustering Method Based on Fire Statistics. Tsinghua Sci. Technol. 2008, 13, 418–422. [Google Scholar]
  48. Ishola, A.A.; Valles, D. Enhancing safety and Efficiency in Firefighting Operations via Deep Learning and Temperature Forecasting Modeling in Autonomous Unit. Sensors 2023, 23, 4628. [Google Scholar] [CrossRef]
  49. Di Martino, T.; Le Saux, B.; Guinvarc’h, R.; Thirion-Lefevre, L.; Colin, E. Detection of forest fires through deep unsupervised learning modeling of Sentinel-1 time series. ISPRS Int. J. Geo-Inf. 2023, 12, 332. [Google Scholar] [CrossRef]
  50. Çiftçioğlu, A.Ö.; Naser, M.Z. Unsupervised Machine Learning for Fire Resistance Analysis. In Proceedings of the International Conference on Science, Engineering Management and Information Technology, Ankara, Turkey, 2–3 February 2022; Springer Nature: Cham, Switzerland, 2022; pp. 211–221. [Google Scholar]
  51. Rahimi, I.; Duarte, L.; Teodoro, A.C. Unsupervised Image Classification Algorithms Applied to Fire-Prone Area Detection. In Proceedings of the 11th International Conference on Geographical Information Systems Theory, Applications and Management (GISTAM 2025), Porto, Portugal, 1–3 April 2025. [Google Scholar]
  52. O’Neill, M.; Ryan, C. Grammatical evolution. IEEE Trans. Evol. Comput. 2001, 5, 349–358. [Google Scholar] [CrossRef]
  53. Bishop, C. Neural Networks for Pattern Recognition; Oxford University Press: Oxford, UK, 1995. [Google Scholar]
  54. Cybenko, G. Approximation by superpositions of a sigmoidal function. Math. Control Signals Syst. 1989, 2, 303–314. [Google Scholar] [CrossRef]
  55. Nawi, N.M.; Atomi, W.H.; Rehman, M.Z. The effect of data pre-processing on optimized training of artificial neural networks. Procedia Technol. 2013, 11, 32–39. [Google Scholar] [CrossRef]
  56. Backus, J.W. The Syntax and Semantics of the Proposed International Algebraic Language of the Zurich ACM-GAMM Conference. In Proceedings of the International Conference on Information Processing, UNESCO, Paris, France, 15–20 June 1959; pp. 125–132. [Google Scholar]
  57. Ryan, C.; Collins, J.; O’Neill, M. Grammatical evolution: Evolving programs for an arbitrary language. In Genetic Programming; Banzhaf, W., Poli, R., Schoenauer, M., Fogarty, T.C., Eds.; EuroGP 1998. Lecture Notes in Computer Science; Springer: Berlin/Heidelberg, Germany, 1998; Volume 1391. [Google Scholar]
  58. O’Neill, M.; Ryan, M.C. Evolving Multi-line Compilable C Programs. In Genetic Programming; Poli, R., Nordin, P., Langdon, W.B., Fogarty, T.C., Eds.; EuroGP 1999. Lecture Notes in Computer Science; Springer: Berlin/Heidelberg, Germany, 1999; Volume 1598. [Google Scholar]
  59. Ryan, C.; O’Neill, M.; Collins, J.J. Grammatical evolution: Solving trigonometric identities. In Proceedings of the Mendel 1998: 4th International Mendel Conference on Genetic Algorithms, Optimisation Problems, Fuzzy Logic, Neural Networks, Rough Sets, Brno, Czech Republic, 24–26 June 1998; Volume 98. [Google Scholar]
  60. Puente, A.O.; Alfonso, R.S.; Moreno, M.A. Automatic composition of music by means of grammatical evolution. In Proceedings of the APL ’02: Proceedings of the 2002 Conference on APL: Array Processing Languages: Lore, Problems, and Applications, Madrid, Spain, 22–25 July 2002; pp. 148–155. [Google Scholar]
  61. De Campos, L.M.L.; de Oliveira, R.C.L.; Roisenberg, M. Optimization of neural networks through grammatical evolution and a genetic algorithm. Expert Syst. Appl. 2016, 56, 368–384. [Google Scholar] [CrossRef]
  62. Soltanian, K.; Ebnenasir, A.; Afsharchi, M. Modular Grammatical Evolution for the Generation of Artificial Neural Networks. Evol. Comput. 2022, 30, 291–327. [Google Scholar] [CrossRef]
  63. Dempsey, I.; Neill, M.O.; Brabazon, A. Constant creation in grammatical evolution. Int. J. Innov. Appl. 2007, 1, 23–38. [Google Scholar] [CrossRef]
  64. Galván-López, E.; Swafford, J.M.; O’Neill, M.; Brabazon, A.; PacMan, E.a.M. Controller Using Grammatical Evolution. In Applications of Evolutionary Computation. EvoApplications 2010; Lecture Notes in Computer Science; Springer: Berlin/Heidelberg, Germany, 2010; Volume 6024. [Google Scholar]
  65. Shaker, N.; Nicolau, M.; Yannakakis, G.N.; Togelius, J.; O’Neill, M. Evolving levels for Super Mario Bros using grammatical evolution. In Proceedings of the 2012 IEEE Conference on Computational Intelligence and Games (CIG), Granada, Spain, 11–14 September 2012; pp. 304–331. [Google Scholar]
  66. Martínez-Rodríguez, D.; Colmenar, J.M.; Hidalgo, J.I.; Micó, R.J.V.; Salcedo-Sanz, S. Particle swarm grammatical evolution for energy demand estimation. Energy Sci. Eng. 2020, 8, 1068–1079. [Google Scholar] [CrossRef]
  67. Sabar, N.R.; Ayob, M.; Kendall, G.; Qu, R. Grammatical Evolution Hyper-Heuristic for Combinatorial Optimization Problems. IEEE Trans. Evol. Comput. 2013, 17, 840–861. [Google Scholar] [CrossRef]
  68. Ryan, C.; Kshirsagar, M.; Vaidya, G.; Cunningham, A.; Sivaraman, R. Design of a cryptographically secure pseudo random number generator with grammatical evolution. Sci. Rep. 2022, 12, 8602. [Google Scholar] [CrossRef]
  69. Tsoulos, I.G.; Gavrilis, D.; Glavas, E. Neural network construction and training using grammatical evolution. Neurocomputing 2008, 72, 269–277. [Google Scholar] [CrossRef]
  70. Papamokos, G.V.; Tsoulos, I.G.; Demetropoulos, I.N.; Glavas, E. Location of amide I mode of vibration in computed data utilizing constructed neural networks. Expert Syst. Appl. 2009, 36, 12210–12213. [Google Scholar] [CrossRef]
  71. Tsoulos, I.G.; Gavrilis, D.; Glavas, E. Solving differential equations with constructed neural networks. Neurocomputing 2009, 72, 2385–2391. [Google Scholar] [CrossRef]
  72. Poli, R.; Langdon, W.B. Genetic Programming with One-Point Crossover; Springer: London, UK, 1998; pp. 180–189. [Google Scholar]
  73. Gavrilis, D.; Tsoulos, I.G.; Dermatas, E. Selecting and constructing features using grammatical evolution. Pattern Recognit. Lett. 2008, 29, 1358–1365. [Google Scholar] [CrossRef]
  74. Park, J.; Sandberg, I.W. Universal Approximation Using Radial-Basis-Function Networks. Neural Comput. 1991, 3, 246–257. [Google Scholar] [CrossRef]
  75. Yu, H.; Xie, T.; Paszczynski, S.; Wilamowski, B.M. Advantages of Radial Basis Function Networks for Dynamic System Design. IEEE Trans. Ind. Electron. 2011, 58, 5438–5450. [Google Scholar] [CrossRef]
  76. Tsoulos, I.G. Creating classification rules using grammatical evolution. Int. J. Comput. Intell. Stud. 2020, 9, 161–171. [Google Scholar]
  77. Anastasopoulos, N.; Tsoulos, I.G.; Tzallas, A. GenClass: A parallel tool for data classification based on Grammatical Evolution. SoftwareX 2021, 16, 100830. [Google Scholar] [CrossRef]
  78. Hall, M.; Frank, F.; Holmes, G.; Pfahringer, B.; Reutemann, P.; Witten, I.H. The WEKA data mining software: An update. ACM SIGKDD Explor. Newsl. 2009, 11, 10–18. [Google Scholar] [CrossRef]
  79. Ben-Gal, I. Bayesian Networks. In Encyclopedia of Statistics in Quality and Reliability; Ruggeri, F., Kenett, R.S., Faltin, F.W., Eds.; John Wiley & Sons, Inc.: Hoboken, NJ, USA, 2008. [Google Scholar]
  80. Koski, T.; Noble, J. Bayesian Networks: An Introduction; John Wiley & Sons: Hoboken, NJ, USA, 2011. [Google Scholar]
  81. Rumelhart, D.E.; Hinton, G.E.; Williams, R.J. Learning representations by back-propagating errors. Nature 1986, 323, 533–536. [Google Scholar] [CrossRef]
  82. Chen, T.; Zhong, S. Privacy-Preserving Backpropagation Neural Network Learning. IEEE Trans. Neural Netw. 2009, 20, 1554–1564. [Google Scholar] [CrossRef] [PubMed]
  83. Wilcoxon, F. Individual Comparisons by Ranking Methods. Int. Biom. Soc. 1945, 1, 80–83. [Google Scholar] [CrossRef]
Figure 1. A graph presenting the deaths from fires in Greece for a period from 2014 to 2023.
Bdcc 09 00142 g001
Figure 2. The proposed grammar neural network construction procedure.
Bdcc 09 00142 g002
Figure 3. An example of the one-point crossover procedure. The arrow indicates the random position selected to exchange the parts of the chromosomes.
Bdcc 09 00142 g003
Figure 4. The grammar used in feature construction method.
Bdcc 09 00142 g004
Figure 5. The grammar used by the method that produces classification rules using Grammatical Evolution.
Bdcc 09 00142 g005
Figure 6. Statistical comparison of the experimental results obtained by various machine learning methods.
Bdcc 09 00142 g006
Figure 7. An example plot for the GENCLASS method.
Bdcc 09 00142 g007
Table 1. How climate change and natural disasters affect powerful nations.
CountryYearCauses of Forest FiresCarbon EmissionsHectaresCasualties
Australia (Black Summer) [7,8]2019–2020Dry winters, drought900 million tons19 million33 people 3000 Houses and Buildings Billions of wild animals
Russia (Arctic fires) [9,10,11]2019–2020Dryer surface, higher temperature31.1 megatons24 millionNone reported
USA (LA) [12,13]2025High temperature4.4 megatons57,00030 people 2,000,000 evacuated 16,000 houses burnt
Japan (Ofunato) [14]2025High temperatureNone reported29001 person 4000 evacuated 210 buildings damaged
Table 2. The used features.
FeatureMin ValueMax Value
Fire station1275
Region code151
Month code112
Season code14
Area (Building type)1147
Persons involved1
Number of injuries0
Number of Burnt Victims0
Number of Fatalities0
Number of Vehicles involved1
Firefighters involved1
Table 3. The values used for the experimental settings.
ParameterMeaningValue
N c Number of chromosomes500
N g Maximum number of generations200
p s Selection rate0.10
p m Mutation rate0.05
N f Number of produced features2
HNumber or processing nodes10
Table 4. Experimental results using various machine learning techniques. Numbers in cells represent average classification error as measured on the corresponding test set.
YearPatternsBAYES NETMLPRBFNNCFCGENCLASS
201412879.01%8.34%11.97%7.82%7.35%7.03%
201516868.75%7.63%10.79%7.13%6.78%6.65%
201617358.99%8.13%10.73%7.48%7.10%7.05%
201717368.43%8.29%10.78%7.68%7.24%7.13%
201816378.38%7.99%9.33%7.30%7.11%6.74%
201919717.31%7.78%24.81%7.33%7.15%6.26%
202019908.70%7.86%10.03%6.99%6.66%6.47%
202118838.58%7.88%10.37%6.87%6.55%6.39%
202220368.80%7.29%8.45%6.86%6.52%6.32%
202319788.46%7.50%10.56%6.87%6.58%6.20%
Average 8.54%7.87%11.78%7.23%6.90%6.62%
Disclaimer/Publisher’s Note: The statements, opinions and data contained in all publications are solely those of the individual author(s) and contributor(s) and not of MDPI and/or the editor(s). MDPI and/or the editor(s) disclaim responsibility for any injury to people or property resulting from any ideas, methods, instructions or products referred to in the content.

