Article

Identifying Influential Nodes in Complex Networks via Transformer with Multi-Scale Feature Fusion

Laboratory for Big Data and Decision, College of Systems Engineering, National University of Defense Technology, Deya Road, Changsha 410073, China
*
Author to whom correspondence should be addressed.
Big Data Cogn. Comput. 2025, 9(5), 129; https://doi.org/10.3390/bdcc9050129
Submission received: 25 March 2025 / Revised: 7 May 2025 / Accepted: 9 May 2025 / Published: 14 May 2025
(This article belongs to the Special Issue Advances in Complex Networks)

Abstract

In complex networks, the identification of critical nodes is vital for optimizing information dissemination. Given the significant role of these nodes in network structures, researchers have proposed various identification methods. In recent years, deep learning has emerged as a promising approach for identifying key nodes in networks. However, existing algorithms fail to effectively integrate local and global structural information, leading to incomplete and limited network understanding. To overcome this limitation, we introduce a transformer framework with multi-scale feature fusion (MSF-Former). In this framework, we construct local and global feature maps for nodes and use them as input. Through the transformer module, node information is effectively aggregated, thereby improving the model’s ability to recognize key nodes. We perform evaluations using six real-world and three synthetic network datasets, comparing our method against multiple baselines using the SIR model to validate its effectiveness. Experimental analysis confirms that MSF-Former achieves consistently high accuracy in the identification of influential nodes across real-world and synthetic networks.

1. Introduction

Determining node importance represents a core challenge in network science, aiming to identify nodes with the most significant impact on the structure and function of a network [1]. Designing robust and precise algorithms for critical node identification holds considerable value across theoretical research and real-world scenarios. For example, in viral spreading networks, interventions targeting critical nodes can effectively reduce the spreading rate and contain the spread of infections [2,3]. In transportation networks, identifying key nodes such as major traffic hubs or high-flow road segments and optimizing their operation can help alleviate congestion, improve traffic efficiency, and improve resilience in the face of emergencies. Similarly, in power supply networks, recognizing and reinforcing the stability of critical nodes can mitigate the risk of network failures, enhance power spreading reliability, and reduce the likelihood of large-scale blackouts, thereby ensuring the stable functioning of society. Therefore, complex network theory not only advances insights into the structural principles governing networks but also serves a crucial function in improving design, increasing operational efficiency, and reducing potential risks [4].
A variety of metrics have been introduced in the literature to identify important nodes in networks, such as degree [5], betweenness [6], and closeness centrality [7], as well as the H-index [8] and K-core measures [9]. However, these traditional methods typically rely on heuristic algorithms based on a single metric, which may be effective for certain types of networks, such as those with simple structures or relatively homogeneous properties. In contrast, for networks with complex structures or high heterogeneity, such single-metric algorithms often perform poorly and fail to comprehensively capture node importance. In response to these limitations, machine learning and deep learning approaches have been employed to learn customized node representations, enhancing the accuracy of identifying important nodes. Machine learning methods for identifying key nodes include least-squares support vector machines (LSSVM) [10], ensemble learning (EL) [11], and K-nearest neighbor (KNN) [12]. Deep learning methods encompass reinforcement learning (RL) [13], convolutional neural networks (CNNs) [14], and graph neural networks (GNNs) [15]. However, many existing learning-based methods tend to focus exclusively on either local or global structural features, and often lack an effective mechanism for integrating both. This limitation reduces their applicability to real-world networks with intricate topologies. For instance, in highly modular social or biological networks, local metrics such as degree or H-index may identify nodes with strong immediate influence but overlook their role in cross-community connectivity or long-range information diffusion. Conversely, global metrics such as betweenness or closeness centrality may capture overall structural positioning but fail to reflect subtle structural variations in dense subgraphs. Likewise, deep learning models that rely solely on local convolutions may inadequately represent long-range dependencies, while those that emphasize global embeddings are prone to over-smoothing, diminishing the discriminative power of node features. Since the relative importance of local and global information varies across network environments, insufficient fusion of both types of features significantly constrains the expressive power and generalizability of existing models. Therefore, a key challenge in current research lies in how to effectively integrate both local and global features to improve the robustness and accuracy of key node identification.
In recent years, multimodal techniques have achieved remarkable progress in various domains, including image segmentation [16,17], video retrieval [18,19], and image classification [20]. By integrating data from multiple modalities, these approaches demonstrate significant advantages in understanding complex scenes, enhancing model generalization, and improving information representation. At the same time, transformer models [21], which are based on attention mechanisms, have increasingly become the dominant paradigm due to their powerful feature fusion capabilities, excelling in multimodal tasks. Inspired by multimodal techniques and transformer architectures, this paper both explores complex network analysis and proposes a transformer framework with multi-scale feature fusion (MSF-Former). This integration enables more effective assessment of node influence within the network.
The primary contributions of this paper can be summarized as follows:
(1)
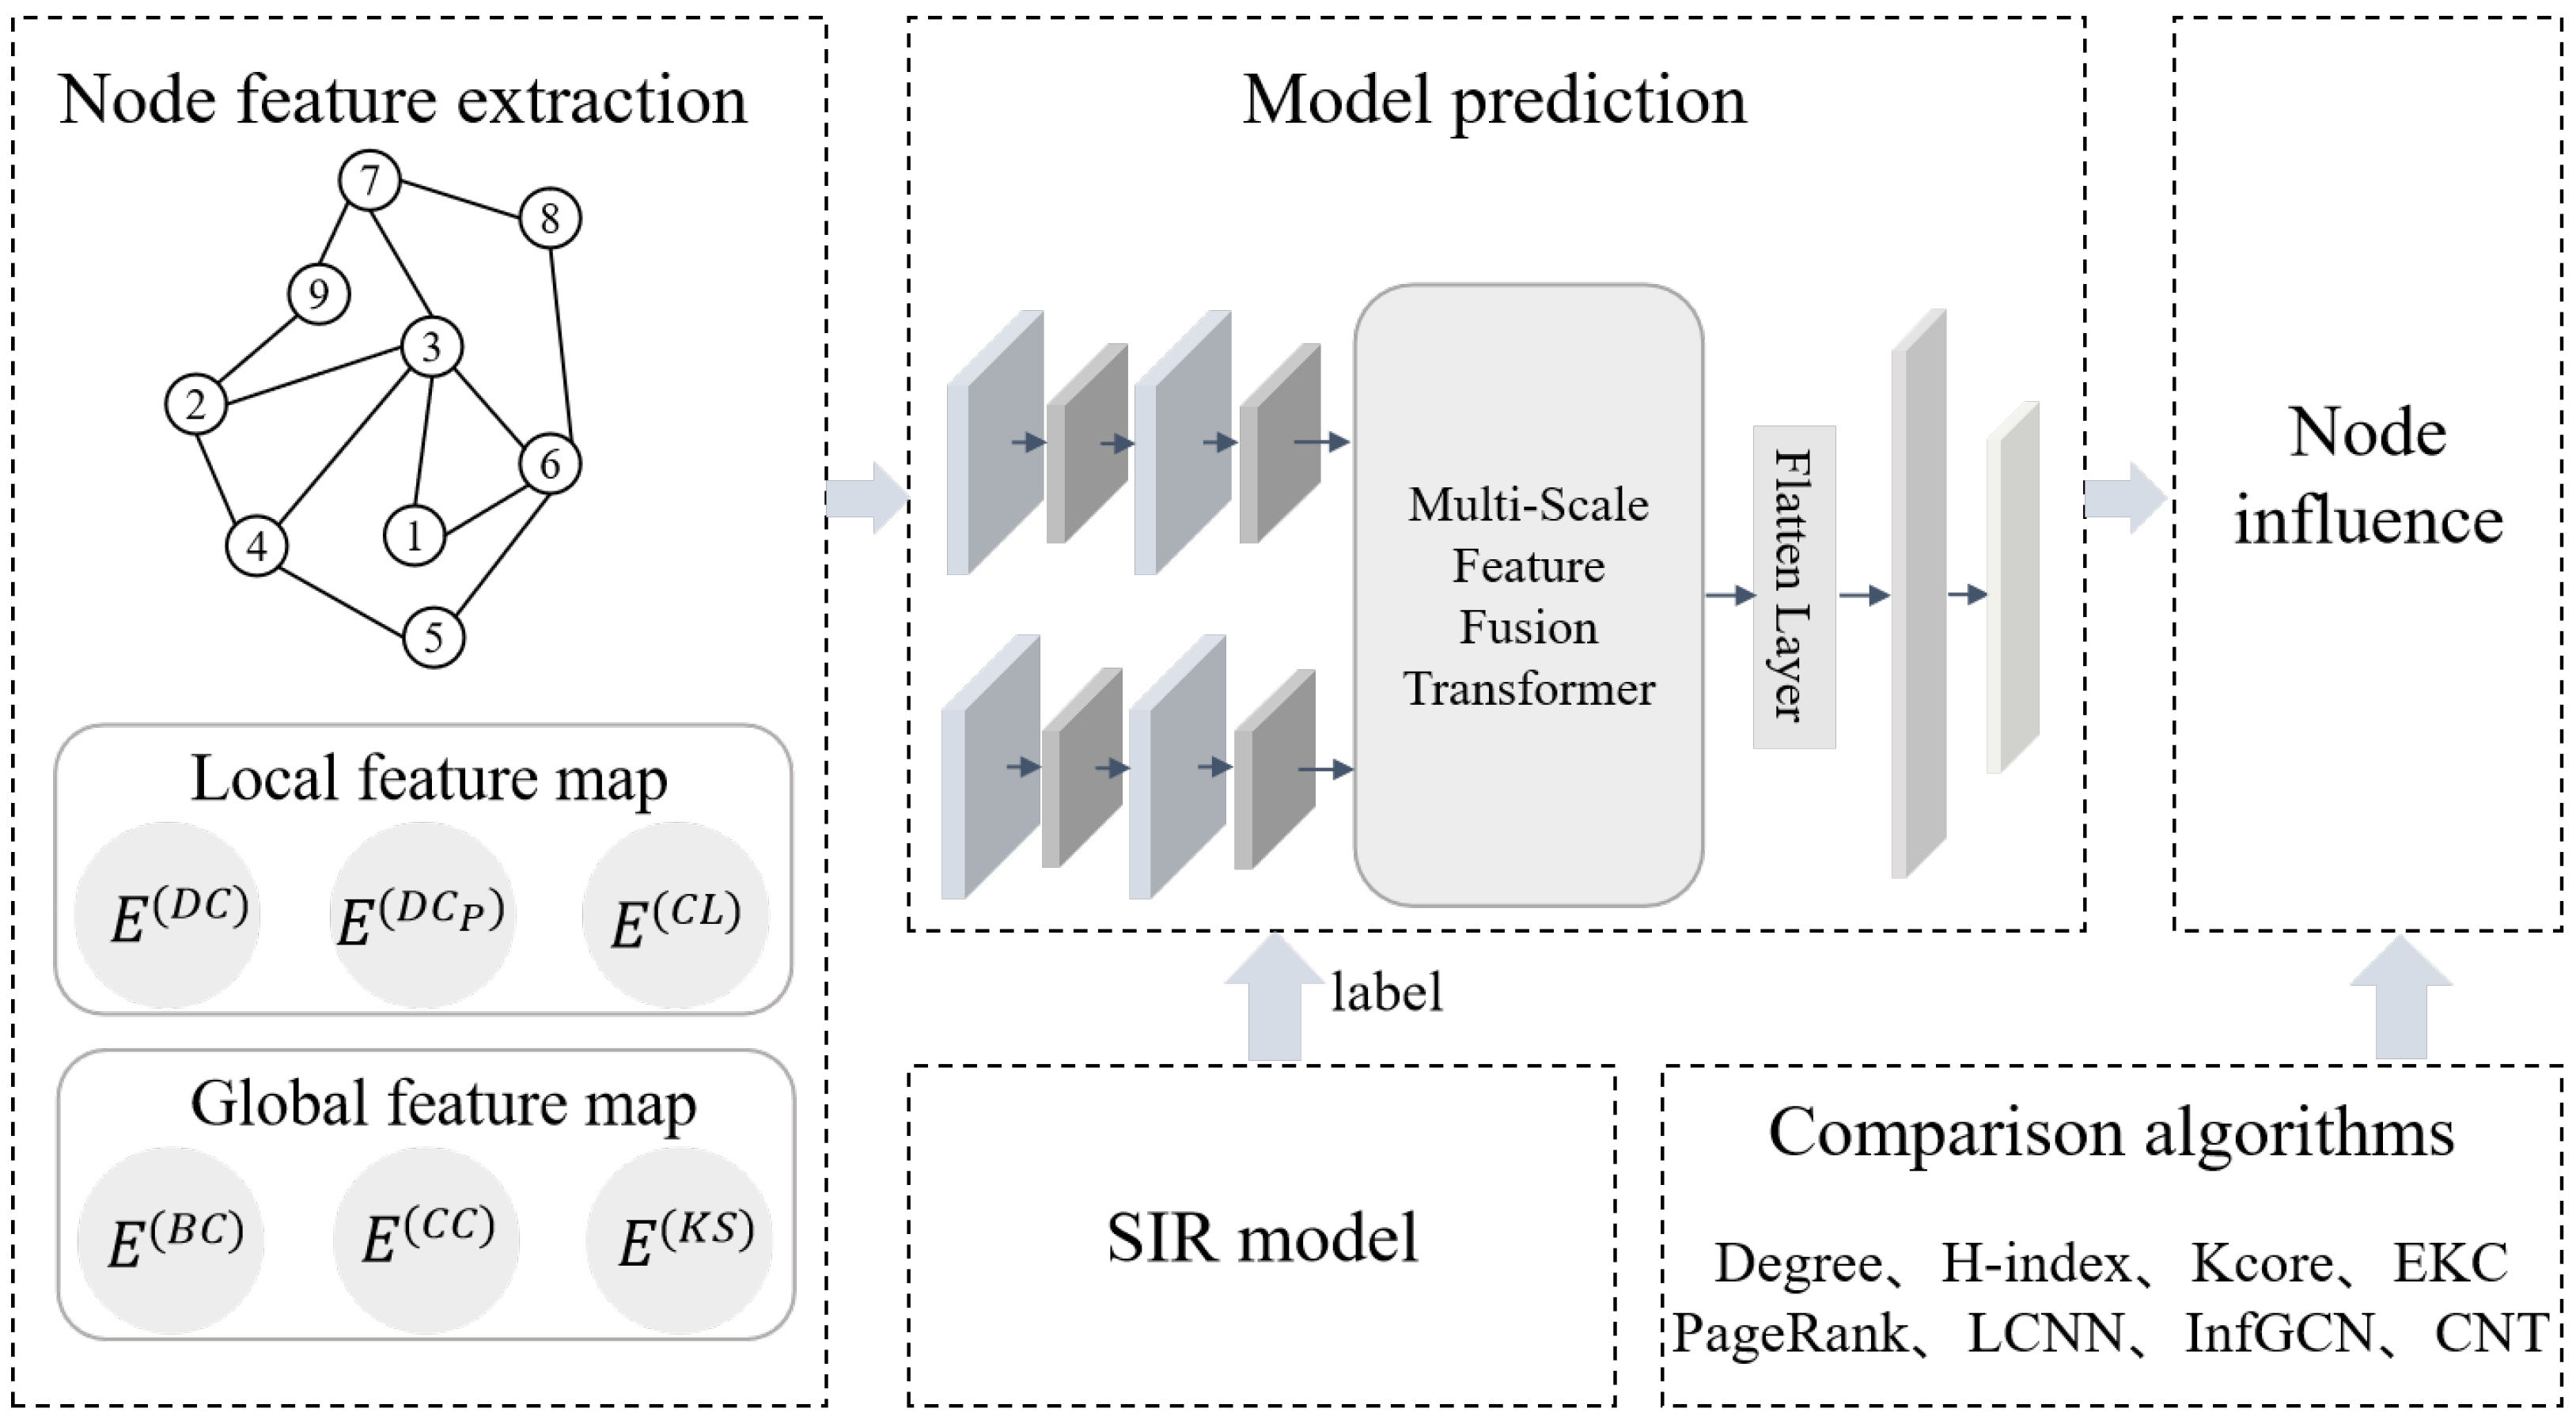
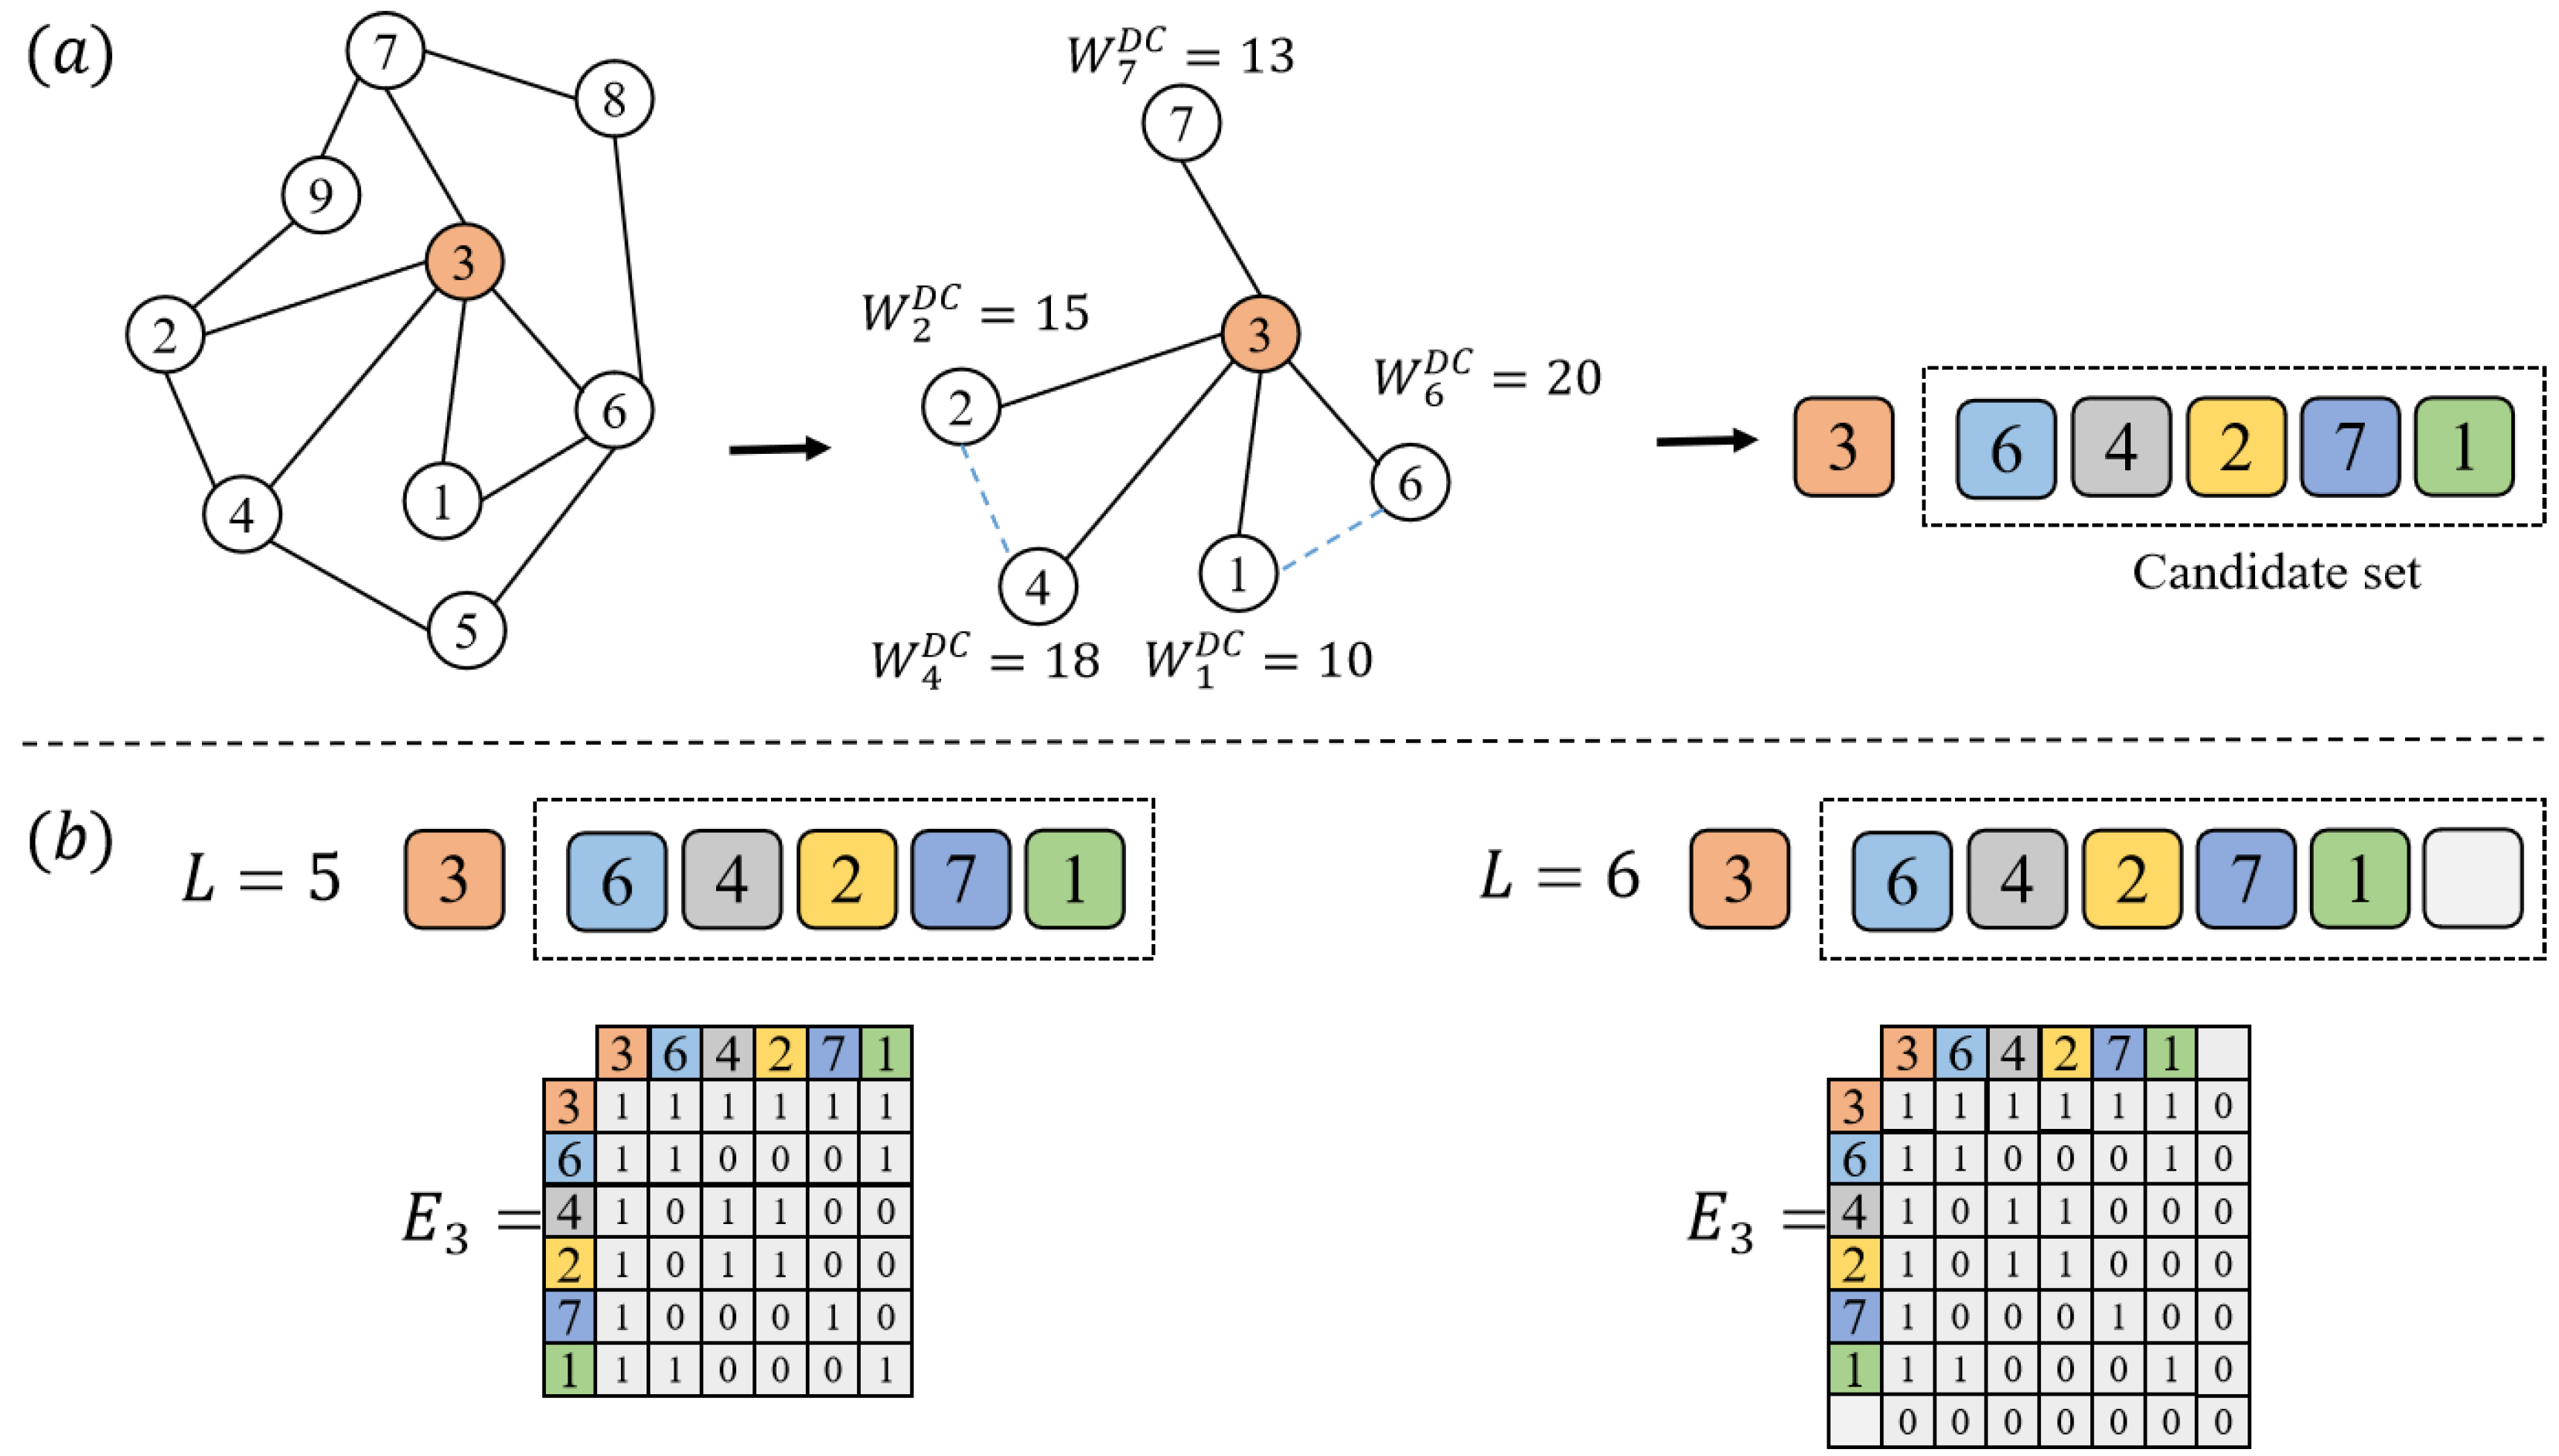
We construct global and local feature maps based on node-level global and local metrics, as well as their one-hop adjacency matrix, enabling multi-scale feature input.
(2)
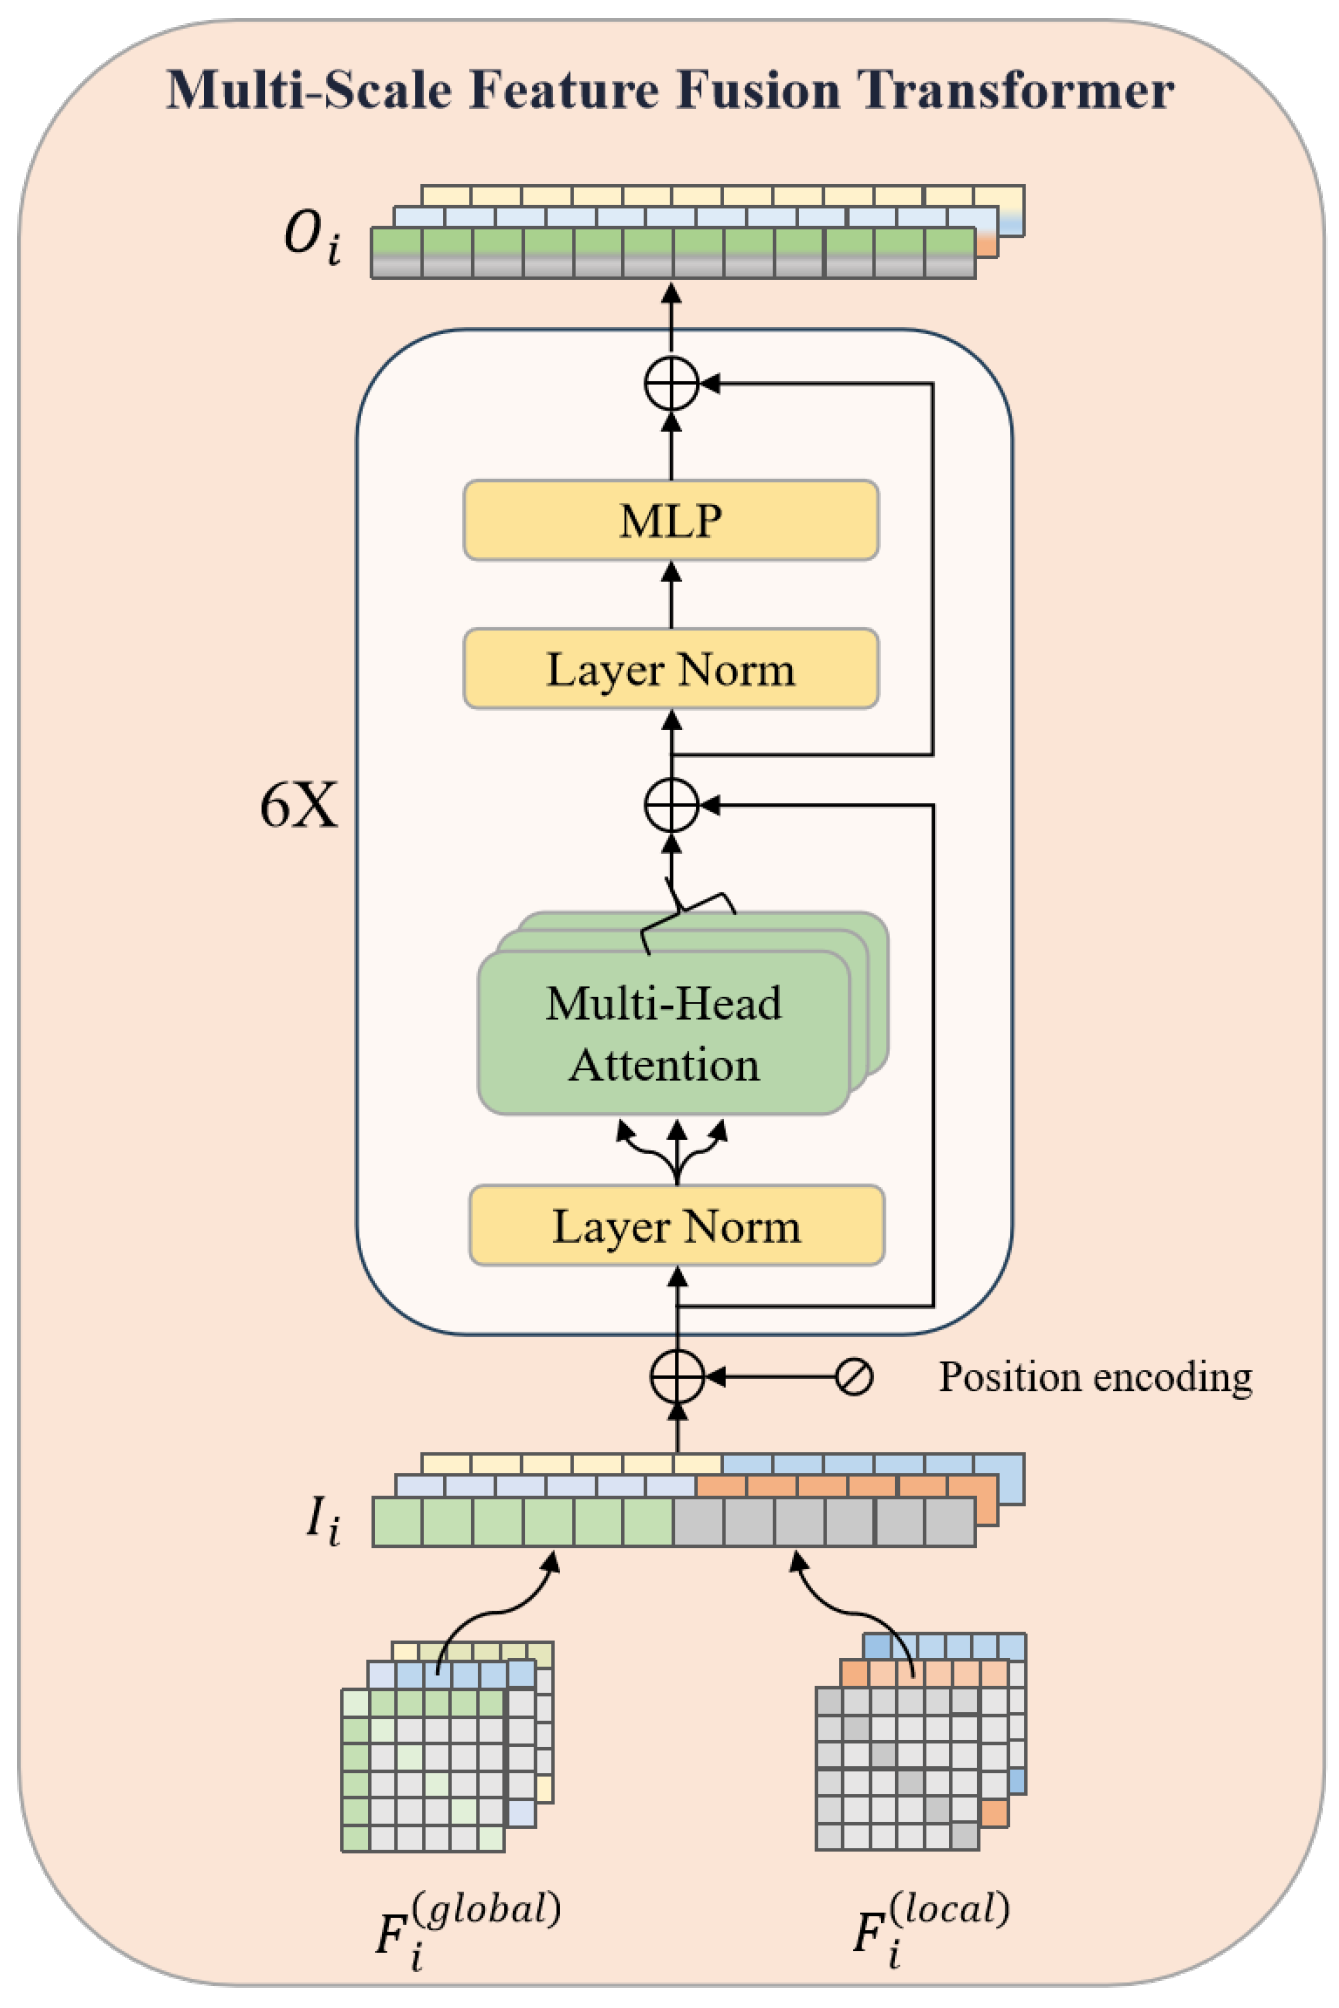
We introduce a multi-scale fusion transformer module for feature analysis, combining both global and local node information to achieve more precise identification of node influence.
(3)
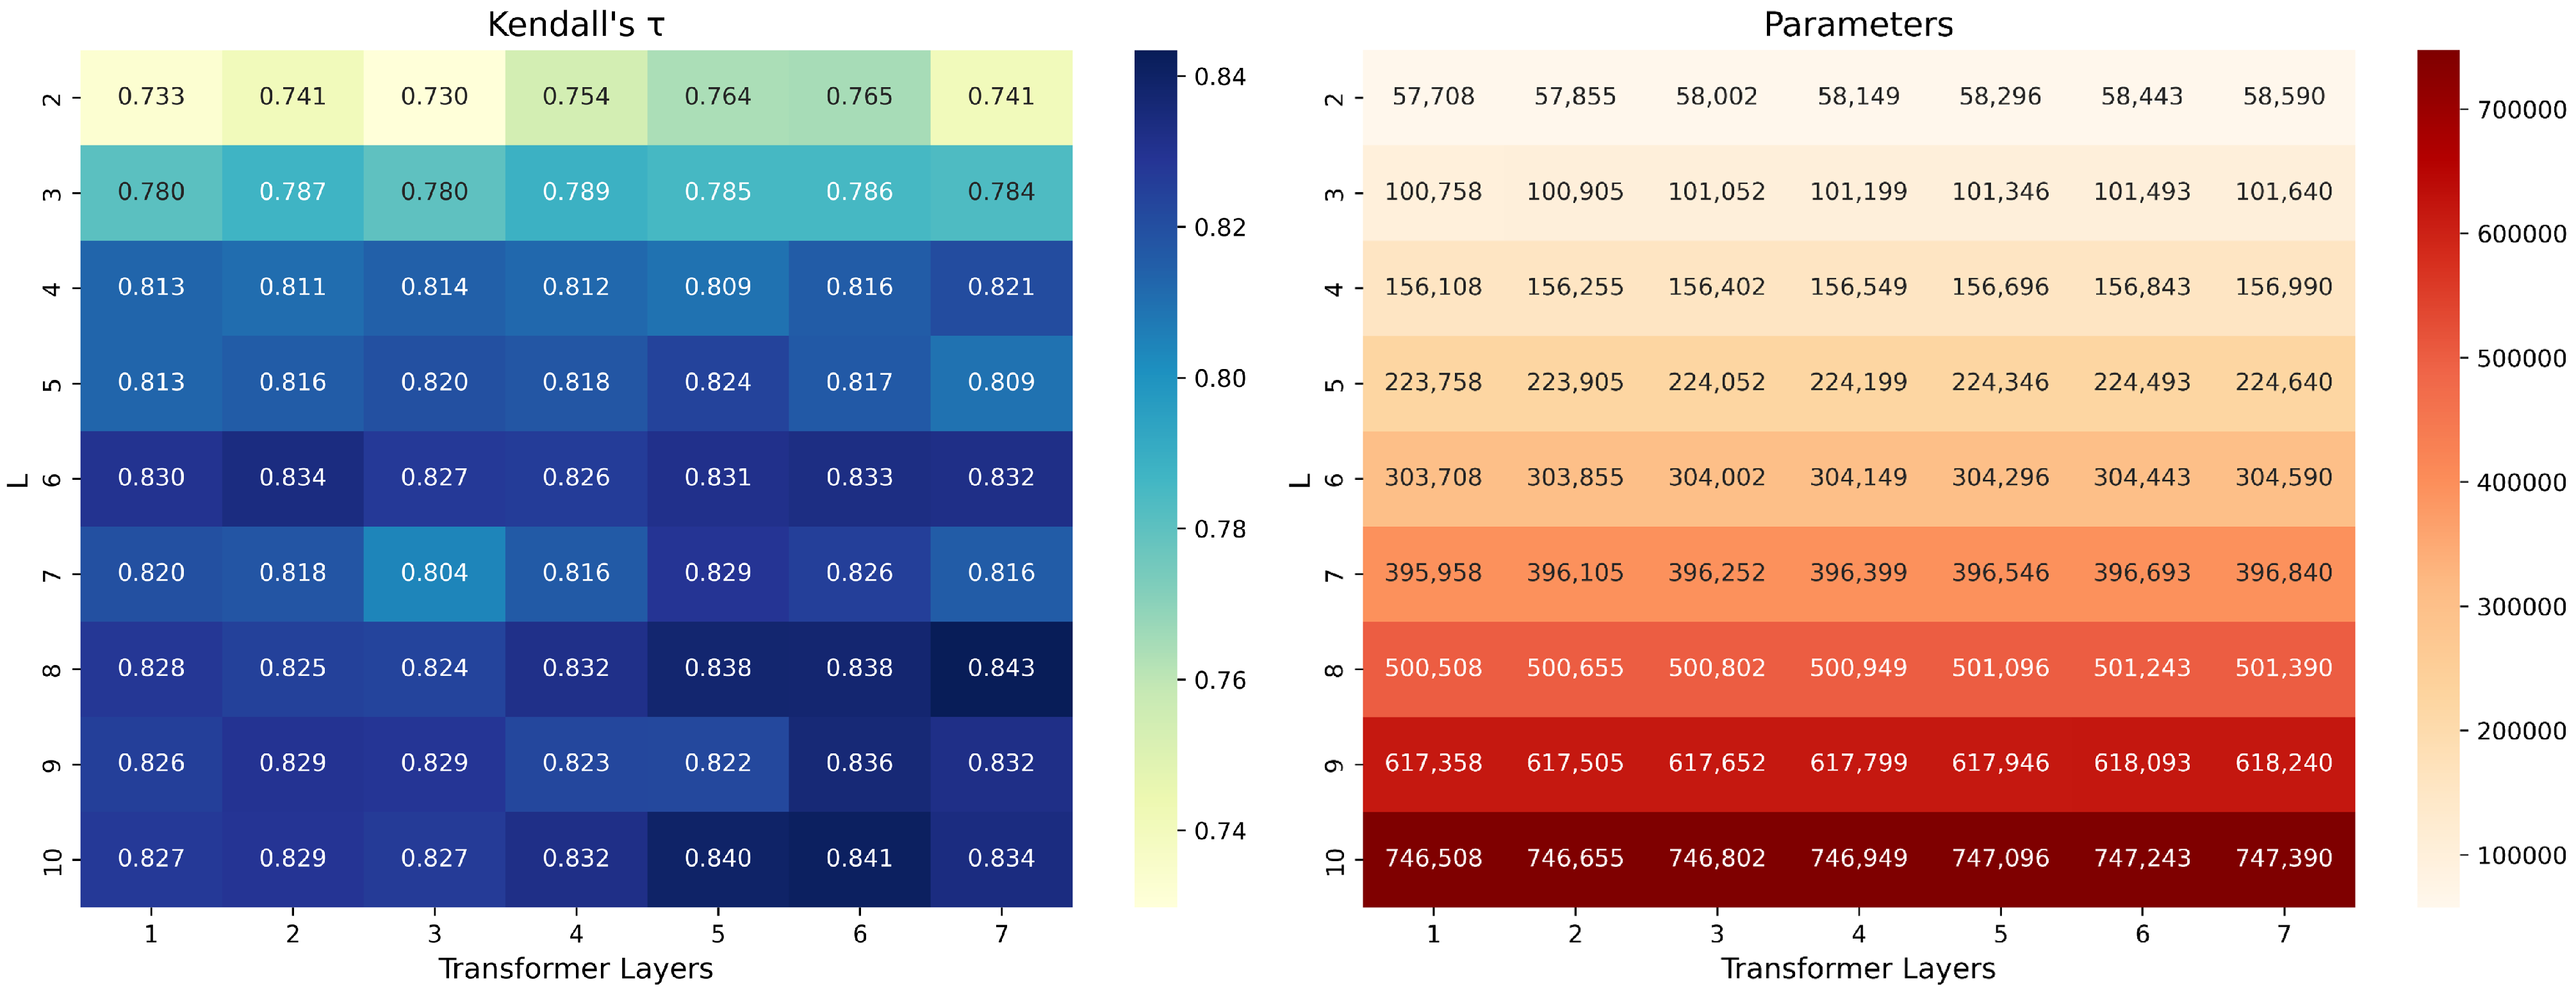
We conduct parameter optimization analysis to determine the optimal configuration that balances model performance with computational cost, improving prediction accuracy.
(4)
We evaluate MSF-Former on nine distinct network datasets (three synthetic, six real-world), and the experimental findings reveal that it outperforms seven baseline approaches in identifying influential nodes under diverse infection scenarios.

2. Notations and Acronyms

To enhance the readability of the manuscript and facilitate reference for readers, this section provides a list of the main notations and acronyms used throughout the paper, as shown in Table 1. This overview enables readers to better understand the definitions of various indicators and methods, ensuring smoother comprehension of the subsequent sections.

3. Related Works

Assessing node importance in complex networks holds substantial research significance and finds broad application in numerous real-world contexts. The existing body of work can be broadly divided into centrality-based approaches, machine learning approaches, and deep learning approaches.

3.1. Centrality-Based Approaches

Centrality-based approaches are formulated by leveraging the topological characteristics of networks and can be classified into methods that use a local network structure, global network structure, and a combined local and global network structure. (1) Local network structure-based methods include degree centrality and clustering coefficient [23]. Bonacich [28] proposed eigenvector centrality, which measures node influence based on its connectivity to multiple key nodes. Xu et al. [29] introduced the adjacency information entropy method, which assesses node importance based on its adjacency degree. (2) Global network structure-based methods include betweenness centrality and closeness centrality. These methods often employ iterative computations of neighboring node influence to capture global structural characteristics, and after convergence, determine the final influence. Brin et al. [30] proposed PageRank, which ranks nodes using a random walk process. Lü et al. [31] proposed LeaderRank, an optimization of the PageRank framework. It introduces ground nodes and connects all nodes via bidirectional links, which improves the ranking performance and enhances robustness to noisy data, making it more stable and accurate than PageRank. (3) Methods combining both local and global network structure include the random walk gravity (RRWG) algorithm proposed by Curado et al. [32], which extracts local information using an effective distance metric and acquires global information through communication probability estimation. Ullah et al. [33] proposed local-and-global-centrality (LGC), which combines normalized degree to model local features with shortest path and neighbor degree to reflect global network properties. Liu et al. [34] introduced semi-local-global centrality (SLGC), which extracts local information using generalized energy entropy and combines shortest path length and clustering coefficient to represent global features. Aman Ullah et al. [35] proposed a graph embedding-based hybrid centrality (GEHC) method, which utilizes deepwalk to embed the network into a low-dimensional vector space, captures node proximity through Euclidean distances, and combines node degree and k-shell index to construct initial importance weights. The method evaluates node influence based on distance-weighted aggregation over local neighbors.

3.2. Machine Learning- and Deep Learning-Based Approaches

Advancements in machine learning and deep learning have driven innovation across various fields, offering new methodologies for evaluating node importance. Rezaei et al. [36] introduced the machine learning approach, which applies support vector regression (SVR) to estimate node influence based on partial network training. Li et al. [11] introduced the EL algorithm, which is used to analyze network robustness and identify critical nodes. Zhao et al. [24] proposed the InfGCN framework, a deep learning model that incorporates four network features and neighborhood graph structures to enhance the precision of node influence assessment. Yu et al. [14] employed CNN to reformulate key node identification as a regression problem, utilizing features derived from the adjacency matrix and node degrees, with infection scale as the predicted output. Zhang et al. [37] proposed a method that constructs a feature matrix through a contraction matrix, followed by the application of both GCN and GNN models to estimate node influence.
In summary, centrality-based approaches rely on low-level features to assess node influence, which limits their effectiveness due to the restricted information dimensions. While machine learning- and deep learning-based approaches have demonstrated superior performance in node influence identification, they still face challenges in integrating local and global information. This limitation hinders the comprehensive modeling of complex network topologies, thereby constraining the generalization capability of such methods across diverse network settings.

4. Methodology

This paper addresses the multi-scale information fusion challenge in key node identification within complex networks by proposing a transformer framework with multi-scale feature fusion (MSF-Former). Unlike most existing methods that rely solely on either local or global network information for node importance assessment, this paper integrates global and local structural information to provide a more complete representation of node characteristics. Accordingly, a multi-channel feature extraction mechanism is introduced, which separates and reconstructs structural metrics along local and global dimensions, resulting in physically interpretable feature maps. This approach not only preserves the topological interpretability of the metric system but also enhances the expressive power of the feature space. Furthermore, a multi-scale fusion transformer module is designed to enable cross-scale feature association modeling, thereby improving the model’s capability to extract structural features from complex networks. An overview of the process is presented in Figure 1.

4.1. Node Feature Extraction

In complex network analysis, many measurement methods evaluate nodes according to distinct structural properties, but they vary in computational cost, and relying on a single feature is often insufficient to fully capture a node’s importance. Therefore, we select degree [5], weighted degree [22], and clustering coefficient [23] as local indicators to provide a more comprehensive depiction of the role of individual nodes. Degree centrality measures a node’s influence by tallying its direct connections, disregarding the significance or centrality of adjacent nodes; weighted degree centrality further differentiates connection quality, allowing the identification of whether a node is connected to highly influential neighbors, thereby more accurately assessing the actual influence of a node rather than merely its number of connections. Specifically, in this study, the weighted degree centrality is defined as the product of a node’s degree and the average degree of its neighboring nodes, which reflects not only the number of direct connections but also the structural importance of its local neighborhood; the clustering coefficient describes the density of the local structure surrounding a node, reflecting the connectivity within a community and its potential for information propagation. The integration of these three indicators allows the analysis to extend beyond direct connectivity, capturing a node’s influence and structural role within its local network, thereby achieving a more precise characterization of local features in complex networks.
Meanwhile, we select betweenness [6], closeness [7], and K-shell value [9], which are employed as global metrics to comprehensively evaluate node roles across the whole network. Betweenness centrality evaluates a node’s significance based on its presence in shortest paths, highlighting nodes that act as bridges and facilitate communication between distinct network regions; closeness centrality assesses how accessible a node is by computing the reciprocal of its average shortest distance to all other nodes, thereby reflecting its efficiency in disseminating information; K-shell value, based on the core-periphery hierarchical decomposition method, identifies the core nodes of a network, assessing their stability and influence in the overall structure. The combination of these three indicators allows the analysis to not only identify key hub nodes but also evaluate information spreading efficiency and the core structure of the network, thus providing a more comprehensive characterization of global network features.
Taking a comprehensive approach, we extract the following node features: betweenness centrality W B C , closeness centrality W C C , K-shell value W K S , degree centrality W D C , weighted degree centrality W D C P , and clustering coefficient W C L . These features not only provide a more comprehensive reflection of node importance but also incur relatively low computational costs, achieving a good balance between cost and performance.
After obtaining the node features, we designed a method for generating the adjacency matrix E. The detailed steps are presented below: (1) construct a candidate set by extracting the immediate neighbors of each node; (2) arrange the adjacent nodes in decreasing order based on their degree; (3) connect to the top L nodes with the greatest degrees. In the generated adjacency matrix E, connected node pairs are marked as 1, while non-connected pairs are marked as 0. To maintain dimensional consistency, zero-padding is used when the number of neighbors falls below L. Figure 2 illustrates the process of generating the adjacency matrix E for a given node.
After computing the adjacency matrix associated with each node, we embed the extracted metrics into the one-hop adjacency matrix, creating six feature matrices for each node:
E i ( Y ) = a n m W Π ( n ) Y n = m a 0 m W Π ( m ) Y n = 0 , m 0 a n 0 W Π ( n ) Y n 0 , m = 0 a n m otherwise , n , m [ 0 , L ]
where Y B C , C C , K S , D C , D C P , C L , E i ( Y ) denotes the one-hop adjacency feature matrix constructed for node i under a specific network metric Y. a n m denotes the binary adjacency relationship: a n m = 1 if the n-th and m-th neighbors are directly connected in the original network, and a n m = 0 otherwise. Meanwhile, Π ( n ) represents the original node index corresponding to the n-th neighbor after sorting. These six feature matrices are then divided into two groups: the global feature map F i ( g l o b a l ) = E i ( B C ) , E i ( C C ) , E i ( K S ) and the local feature map F i ( l o c a l ) = E i ( D C ) , E i ( D C P ) , E i ( C L ) . These feature maps are used as input to train the model.

4.2. Label

This paper investigates the dissemination of node influence using the susceptible–infected–recovered (SIR) model [38], a widely adopted framework for modeling diverse social processes such as epidemics, information diffusion, and rumor propagation. The SIR model represents the process of infection and recovery through a three-state framework—susceptible, infected, and recovered—while assessing the probability of epidemic emergence. Infected nodes propagate the infection to adjacent susceptible nodes at a spreading rate represented by β . After becoming infected, a node recovers with probability λ and becomes immune to further infection. The propagation process concludes once all infected nodes have transitioned to other states and none remain in the network. In all experiments in this paper, we set the recovery rate to λ = 1 in order to simplify the diffusion process, improve simulation efficiency, and ensure a stable correspondence between node features and influence labels. The ability of a node to propagate influence is quantified based on M independent SIR simulations, as described below:
Φ ( i ) = 1 M m = 1 M Φ ( i )
where Φ ( i ) denotes the total number of recovered nodes at the conclusion of a single SIR simulation, with node i serving as the only initial source of infection.
To prevent an excessively high infection probability from allowing a single node to dominate the entire network and exert a disproportionate influence [39], the parameter β representing infection probability, is calibrated to the propagation threshold β t h to facilitate extensive network spread.
β t h = k / k 2
where k and k 2 represent the average degree and the second-order average degree of the network. Finally, we use Φ ( i ) as the label for the respective node to facilitate model training.

4.3. Model Prediction

This section primarily introduces the prediction process of the transformer framework with multi-scale feature fusion that we designed.
Specifically, we obtain the global feature map F i ( g l o b a l ) and the local feature map F i ( l o c a l ) from the multi-channel feature construction module. These two feature maps are sequentially processed through two convolutional layers, with each layer subsequently connected to a max pooling layer. This process enhances key features while preserving essential spatial information, providing a more compact and efficient input representation for subsequent processing. In this process, we employ LeakyReLU as the activation function [40], which can be expressed as follows:
LeakyReLU ( X ) = X ( X > 0 ) α X ( X 0 )
where α denotes a small constant, empirically set to 0.1.
Then, we perform tensor serialization on the global feature map F i ( global ) R C × H × W and the local feature map F i ( l o c a l ) R C × H × W extracted by the convolutional neural network. Through spatial flattening and dimension permutation operations, the three-dimensional feature maps are reconstructed into two-dimensional feature sequences I i ( g l o b a l ) R H W × C and I i ( l o c a l ) R H W × C . These two feature sequences are then concatenated, and a learnable positional encoding matrix is introduced, resulting in a transformer input sequence I i R 2 H W × C with spatial awareness. The embedding of the positional encoding matrix enables the model to distinguish spatial information across different tokens during training. Subsequently, the input sequence I i is projected onto three weight matrices to compute Q, K, and V.
Q = I i W Q , K = I i W K , V = I i W V ,
where W Q , W K , and W V denote the projection matrices. The self-attention mechanism calculates attention scores via the scaled dot-product of Q and K, followed by a multiplication with V to produce the final output:
Attention ( Q , K , V ) = softmax Q K T D K V
To extract contextual information from multiple positions in the input and represent intricate dependencies across distinct feature dimensions, we employ the multi-head attention mechanism. This mechanism calculates self-attention by employing multiple sets of weight matrices, denoted as W Q , W K , and W V , and the final representation is obtained by concatenating the resulting output matrices. Subsequently, the output sequence O i is computed through a two-layer feedforward network with fully connected layers, where GELU [41] is employed as the intermediate activation function. Finally, the shape of O i remains consistent with that of the input sequence I i . The multi-scale feature fusion transformer module is illustrated in Figure 3.
After obtaining the feature sequence O i , it is flattened into a one-dimensional sequence and passed through a fully connected layer, ultimately producing a single-dimensional prediction value that represents the propagation influence of the node. To improve predictive consistency, the MSE loss is utilized during training to minimize the discrepancy between model outputs and label values generated by the SIR model. A learning rate of 0.001 is adopted to ensure convergence stability and training efficiency.

5. Experiment

This section presents comprehensive experiments to evaluate the effectiveness of MSF-Former. During training, the model is provided with a BA network [42] comprising 1000 nodes and an average degree of four, with labels derived from an SIR simulation conducted at an infection rate of β = 1.5 β t h . The BA network is widely used as a benchmark in complex network studies due to its power-law degree distribution, a feature commonly found in real-world networks. Kendall correlation coefficient [43] is adopted as the evaluation metric, and performance comparisons are conducted on three synthetic network types and six real-world networks against eight baseline approaches. Finally, the simulation results are discussed, and the model’s performance is analyzed.

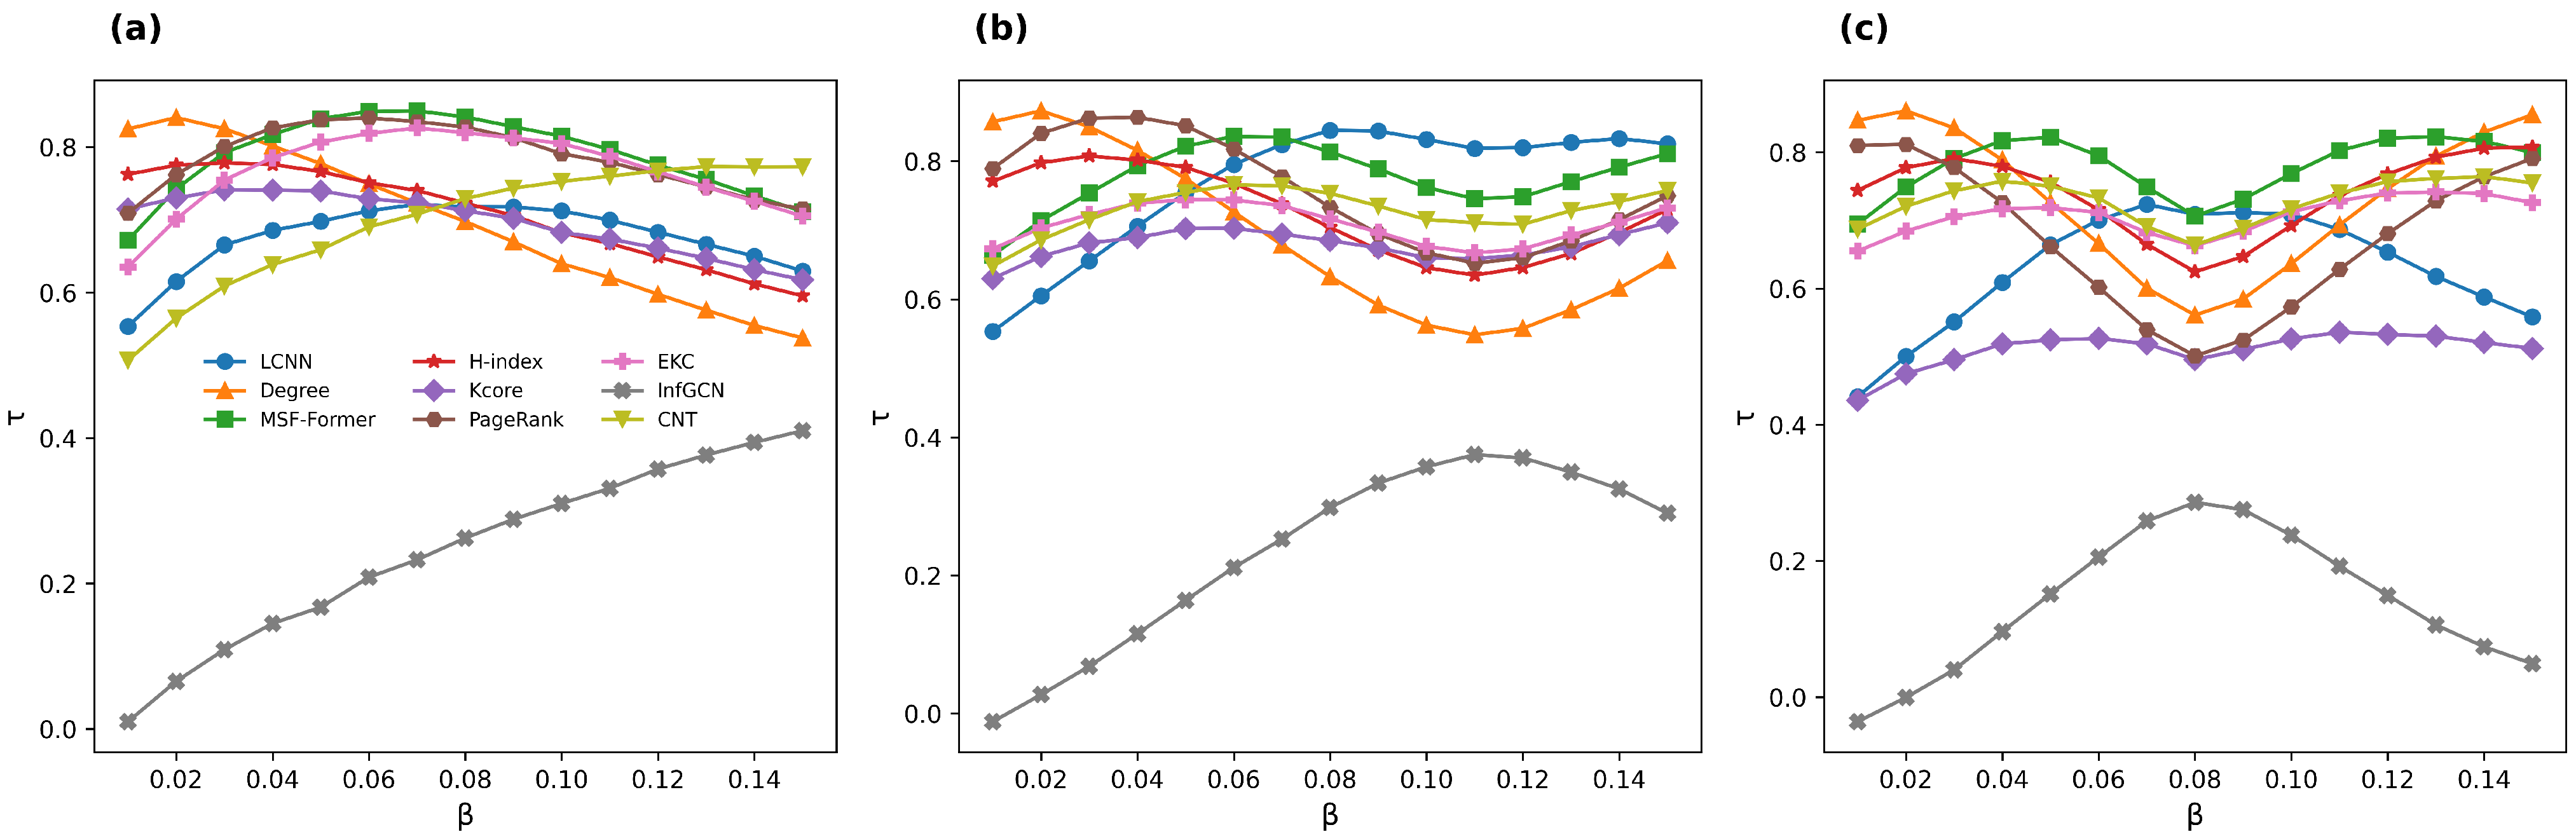
5.1. Kendall Correlation Coefficient

This paper adopts the Kendall correlation coefficient to assess the consistency between node importance rankings and influence-based rankings derived from the SIR model and various metrics. The Kendall coefficient τ ranges from −1 to 1, where a value of 1 means the rankings are identical, −1 indicates a perfect inverse relationship, and 0 implies the absence of any consistent order between the rankings.

5.2. Datasets

In order to thoroughly assess the performance of MSF-Former, we conducted experiments on a variety of real-world and synthetic networks, all represented as undirected and unweighted graphs. We generated the synthetic networks based on the Lancichinetti–Fortunato–Radicchi (LFR) [44]. By adjusting the LFR parameters, we constructed three networks with distinct topological characteristics. Table 2 summarizes the statistical properties of the synthetic networks.
In Table 2, N represents the total number of nodes in each network, E denotes the total number of edges, d indicates the average shortest path length, β t h represents the infection probability threshold, β is the infection probability set for this paper, k denotes the average degree of the network, C represents the clustering coefficient, and k s m a x indicates the maximum degree value in the network.
We employed six real-world networks of varying scales, each corresponding to a different network category or application domain, including scientific collaboration networks, social networks, infectious disease spreading networks, and biological networks. These networks are (1) netscience [45], a collaborative network describing the relationships among network scientists; (2) Facebook [46], a social network capturing the friendship connections; (3) infectious [47], a diffusion network that models the dynamics of population infection spread; (4) yeast [48], a protein interaction network; (5) protein [49], a biological network representing interactions among proteins; and (6) CA-GrQc [50], an academic collaboration network published on a preprint platform. All six networks are treated as undirected and unweighted graphs to simplify the modeling and analysis process. Since real-world networks are not always fully connected and may consist of multiple connected components, we preprocess the six datasets to extract the largest connected subgraph from each network. This step helps reduce the impact of isolated nodes or anomalies, ensuring that the experimental results are more statistically meaningful. Table 3 presents the statistical properties of the real-world networks.

5.3. Benchmark Methods

(1)
Degree centrality
The degree of a node is determined by the number of its direct connections, as shown in the following formula:
d i = j = 1 N a i j
The more neighboring nodes a node has, the greater its degree d i .
(2)
K-core centrality
K-core centrality is a node importance measure based on network hierarchical decomposition. The calculation process is as follows: Initially, nodes with a degree smaller than the current k-value are iteratively excluded until all remaining nodes possess a degree greater than or equal to k. Subsequently, k is incrementally increased, and the process is repeated to determine the final retained k-value for each node. Nodes with higher K-core values are generally considered to exert greater influence in the network.
(3)
H-index
The H-index is a measure of scholarly productivity, defined by the number of publications that have received at least H citations. A higher H-index indicates a higher level of academic influence. The calculation of the H-index involves first sorting publications by citation count in descending order, and then selecting the rank at which the citation count is at least equal to the rank.
(4)
PageRank centrality
PageRank, designed for ranking web pages, holds that the value of a page is determined by the number and quality of its inbound links. By factoring in the influence of neighboring nodes, the algorithm assesses node significance, relying on iterative global computations to converge and ensure precise results. PageRank’s iterative approach underscores its focus on the entire network structure, contributing to its robustness and widespread adoption in evaluating node significance in complex networks.
(5)
EKC
The EKC method [25] builds upon K-shell decomposition by incorporating the K-core values of neighboring nodes to enhance the assessment of node influence. Traditional K-shell methods focus solely on the global hierarchical structure of the network, whereas the EKC method enhances accuracy by calculating a weighted sum of the node’s K-core value and those of its neighbors, leading to a more precise identification of core nodes within the network.
E K C ( i ) = k i + α j N ( i ) k j
where k i represents the K-core value of node i, N ( i ) denotes the set of neighboring nodes, and α is a tuning parameter.
(6)
InfGCN
InfGCN [24] is an extended version of a graph convolutional network, which includes an input layer, GCN layers, three fully connected layers, and an output layer. This model utilizes four centrality measures—degree, closeness, betweenness, and clustering coefficient—to represent node features. The node features are processed through a GCN layer with an ELU activation function, while incorporating residual connections and dropout techniques. Next, a series of three fully connected layers is applied to the node representations, incorporating ELU activation functions after the initial two layers. Finally, the model processes the results using a LogSoftmax classifier for classification.
(7)
LCNN
The LCNN model [27] is an influential node ranking algorithm based on CNN and consists of multiple components: an input layer, two independent CNN subnetworks, a global average pooling layer, and a fully connected layer. To represent nodes, LCNN utilizes two network metrics, degree centrality and H-index, and constructs a local feature channel set based on the adjacency matrix. The extracted features are then processed through two independent CNN branches, where each branch learns feature representations separately. These representations are subsequently integrated using the global average pooling layer. At the final stage, the node representations are input into two fully connected layers to generate predictions. The first fully connected layer is followed by a LeakyReLU activation function, and the second fully connected layer computes the final node influence score.
(8)
CNT
The CNT model [26] is a transformer-based algorithm designed for identifying influential nodes in complex networks. It consists of an input layer, two transformer encoder layers, and a fully connected layer. In terms of node representation, CNT utilizes the degree information of each node along with its neighboring nodes and constructs a dynamic input sequence that includes the features of the target node, its first-order neighbors, and second-order neighbors. The sequence length is adaptively adjusted according to the degree distribution of the network to ensure scalability across networks of different sizes. During feature extraction, CNT employs two transformer encoder layers without position encoding, where each layer incorporates multi-head self-attention mechanisms, feed-forward neural networks, residual connections, and normalization operations. This design enables the model to effectively aggregate information from neighboring nodes. At the output stage, CNT extracts the representation from the first position of the transformer output sequence and feeds it into a fully connected layer for regression, yielding the final node influence scores. The model is trained by minimizing the MSE loss, with parameters optimized using the RMSprop algorithm.

5.4. Implementation Details

The experiments were conducted using Python 3.7 on an NVIDIA GeForce RTX 4060 GPU within a CUDA 12.5 environment, utilizing the PyTorch deep learning framework. To ensure a fair performance evaluation, the datasets used for training were matched in terms of network type and scale with those employed for training LCNN, InfGCN, and CNT.

5.5. Model Parameter Analysis

This section presents a parameter analysis to evaluate the performance of MSF-Former under different neighbor counts L and transformer layer configurations. In the experiments, we selected the training network as the model input and used the SIR model to generate node influence labels. Based on the training performance on this network, we tested various combinations of neighbor counts L ranging from 2 to 10 and transformer layers ranging from one to seven, recording the corresponding Kendall τ coefficients and the total number of model parameters for each configuration.
As shown in Figure 4, when the neighbor count is set to L = 6 and the number of transformer layers is six, MSF-Former achieves a good balance between Kendall’s τ coefficient and model complexity, demonstrating excellent performance with a relatively low parameter count. Although the configuration with L = 6 and two transformer layers also achieves comparable performance with fewer parameters, considering that deeper network structures generally enable richer feature extraction and enhance the model’s expressive capacity and potential generalization ability, we ultimately selected the configuration with L = 6 and six transformer layers as the final setting for MSF-Former.

5.6. Experimental Results

In this section, we aim to demonstrate the effectiveness of MSF-Former in enhancing the accuracy of influential node identification within complex networks. To evaluate its ranking performance, we compare MSF-Former with several baseline methods using Kendall’s τ coefficient as the evaluation metric. The comparison is conducted across six real-world networks and three synthetic networks to ensure robustness and generalizability of the results.

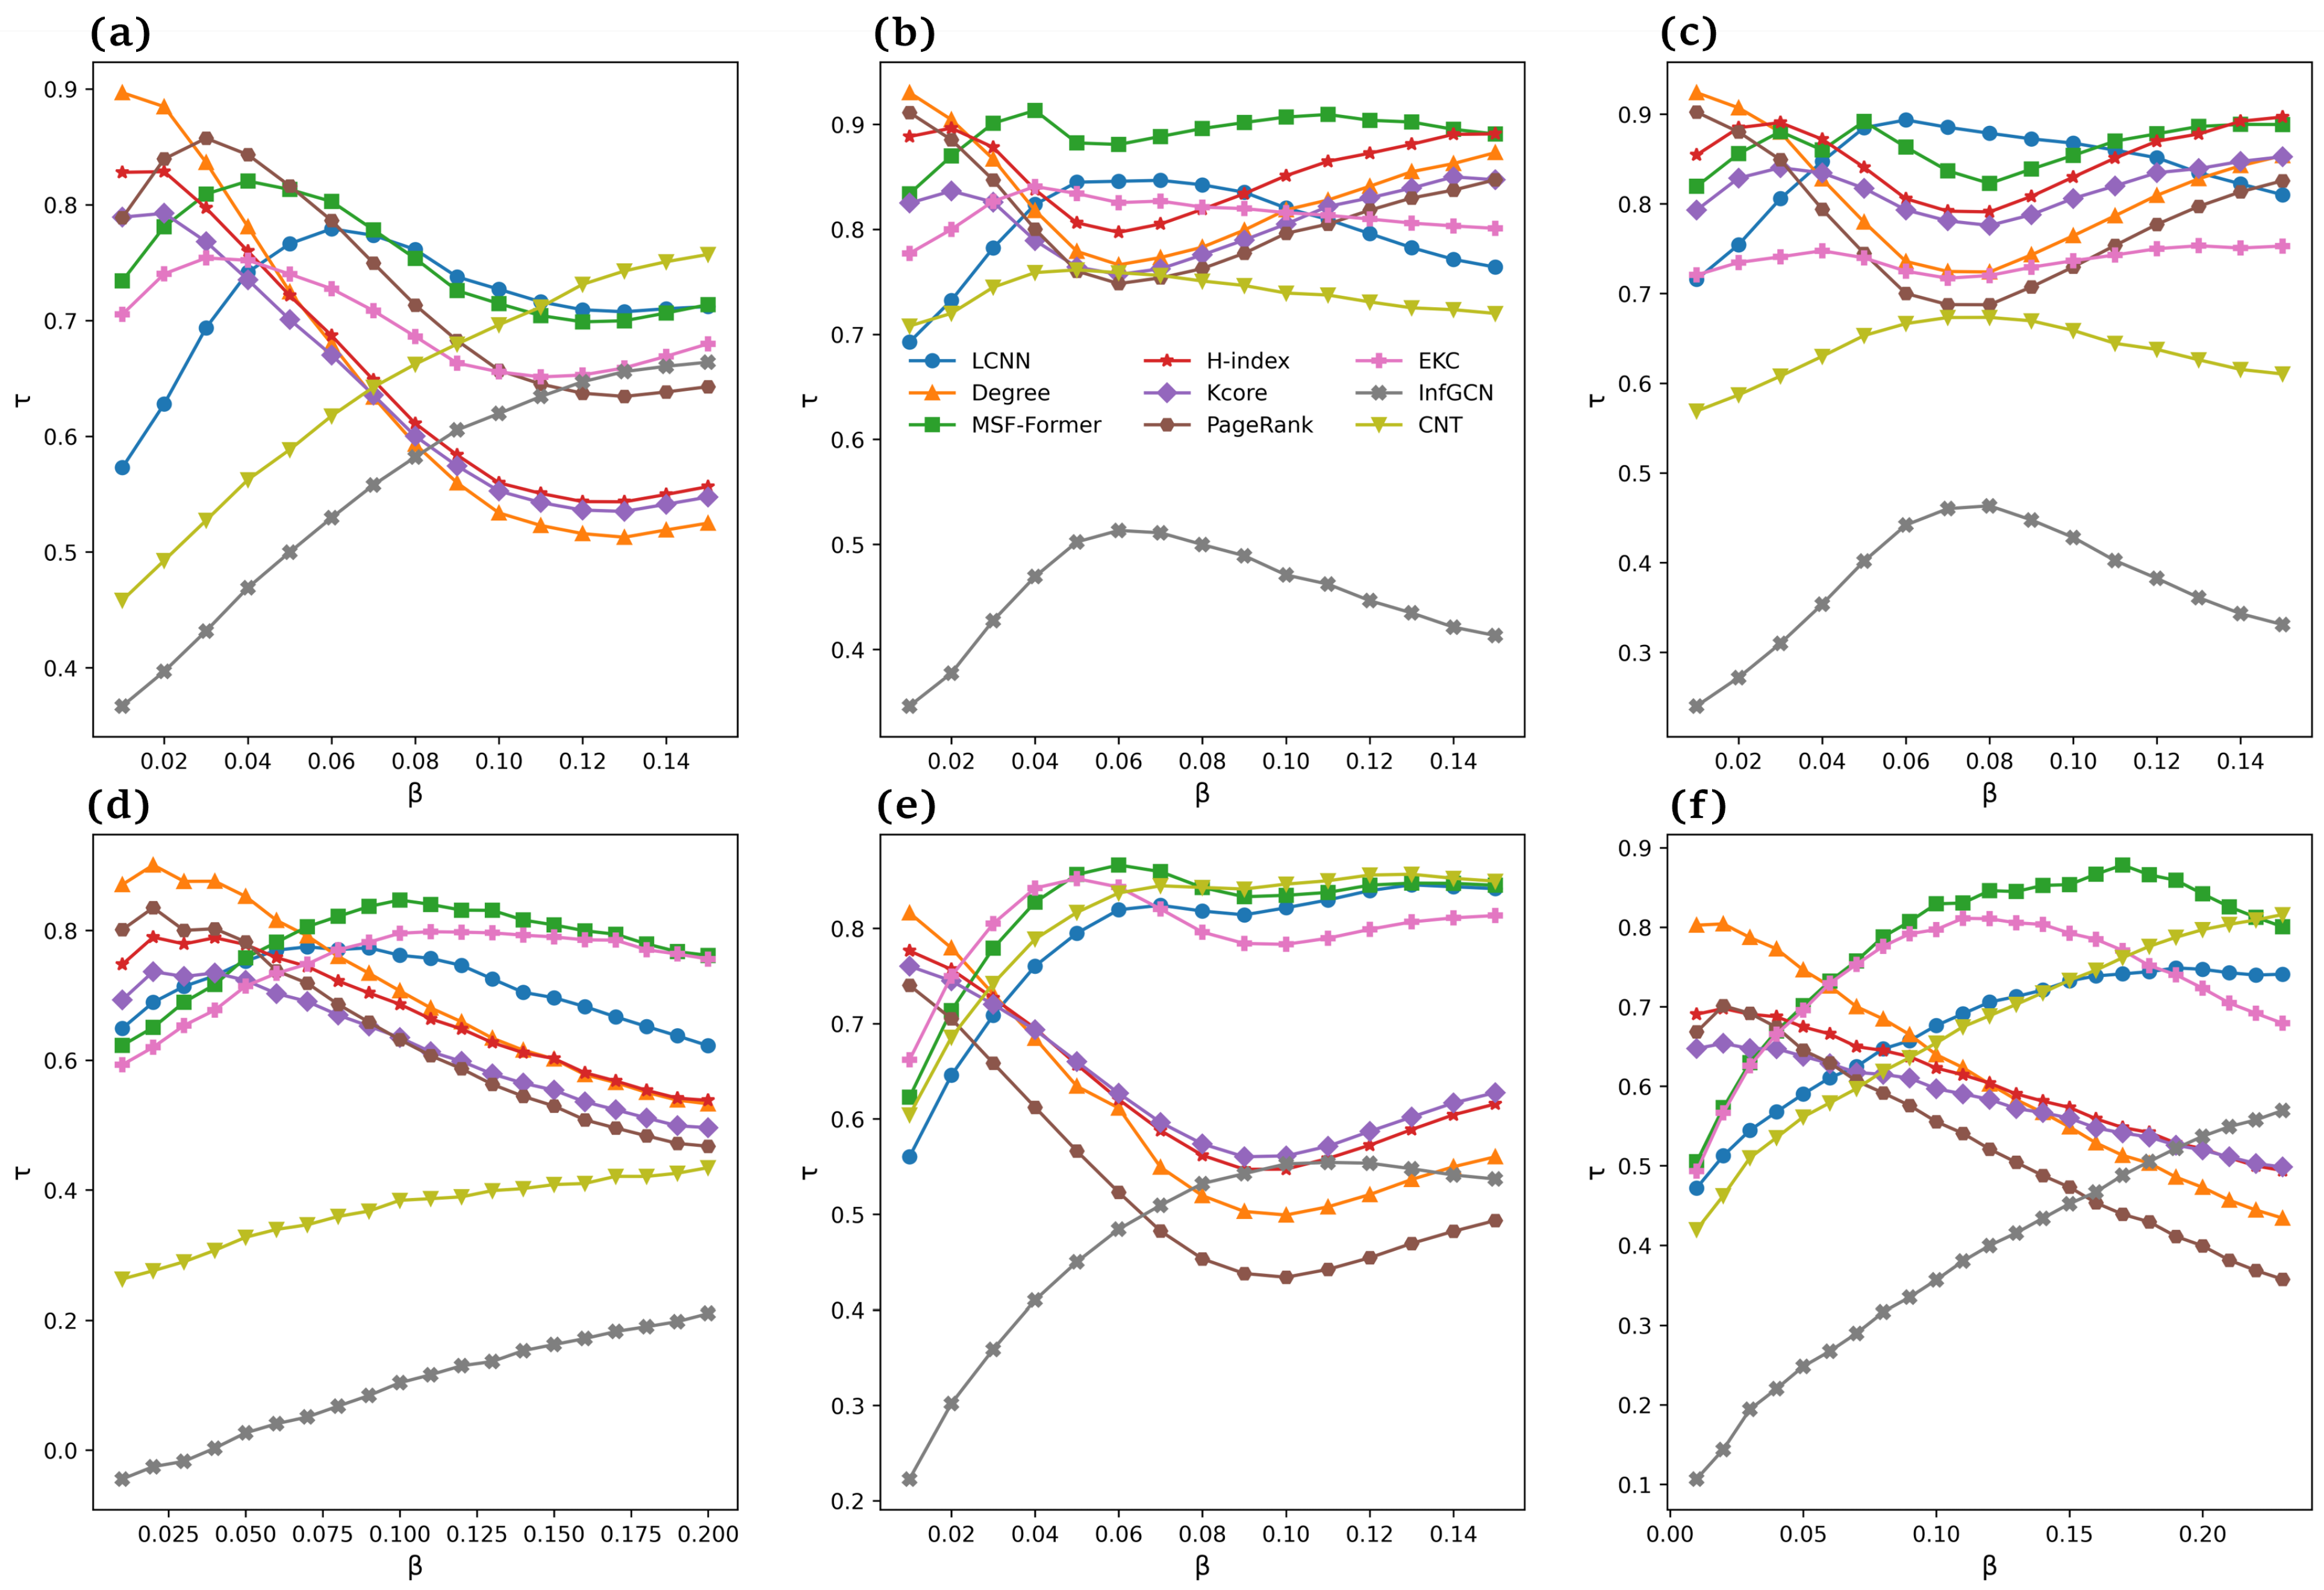
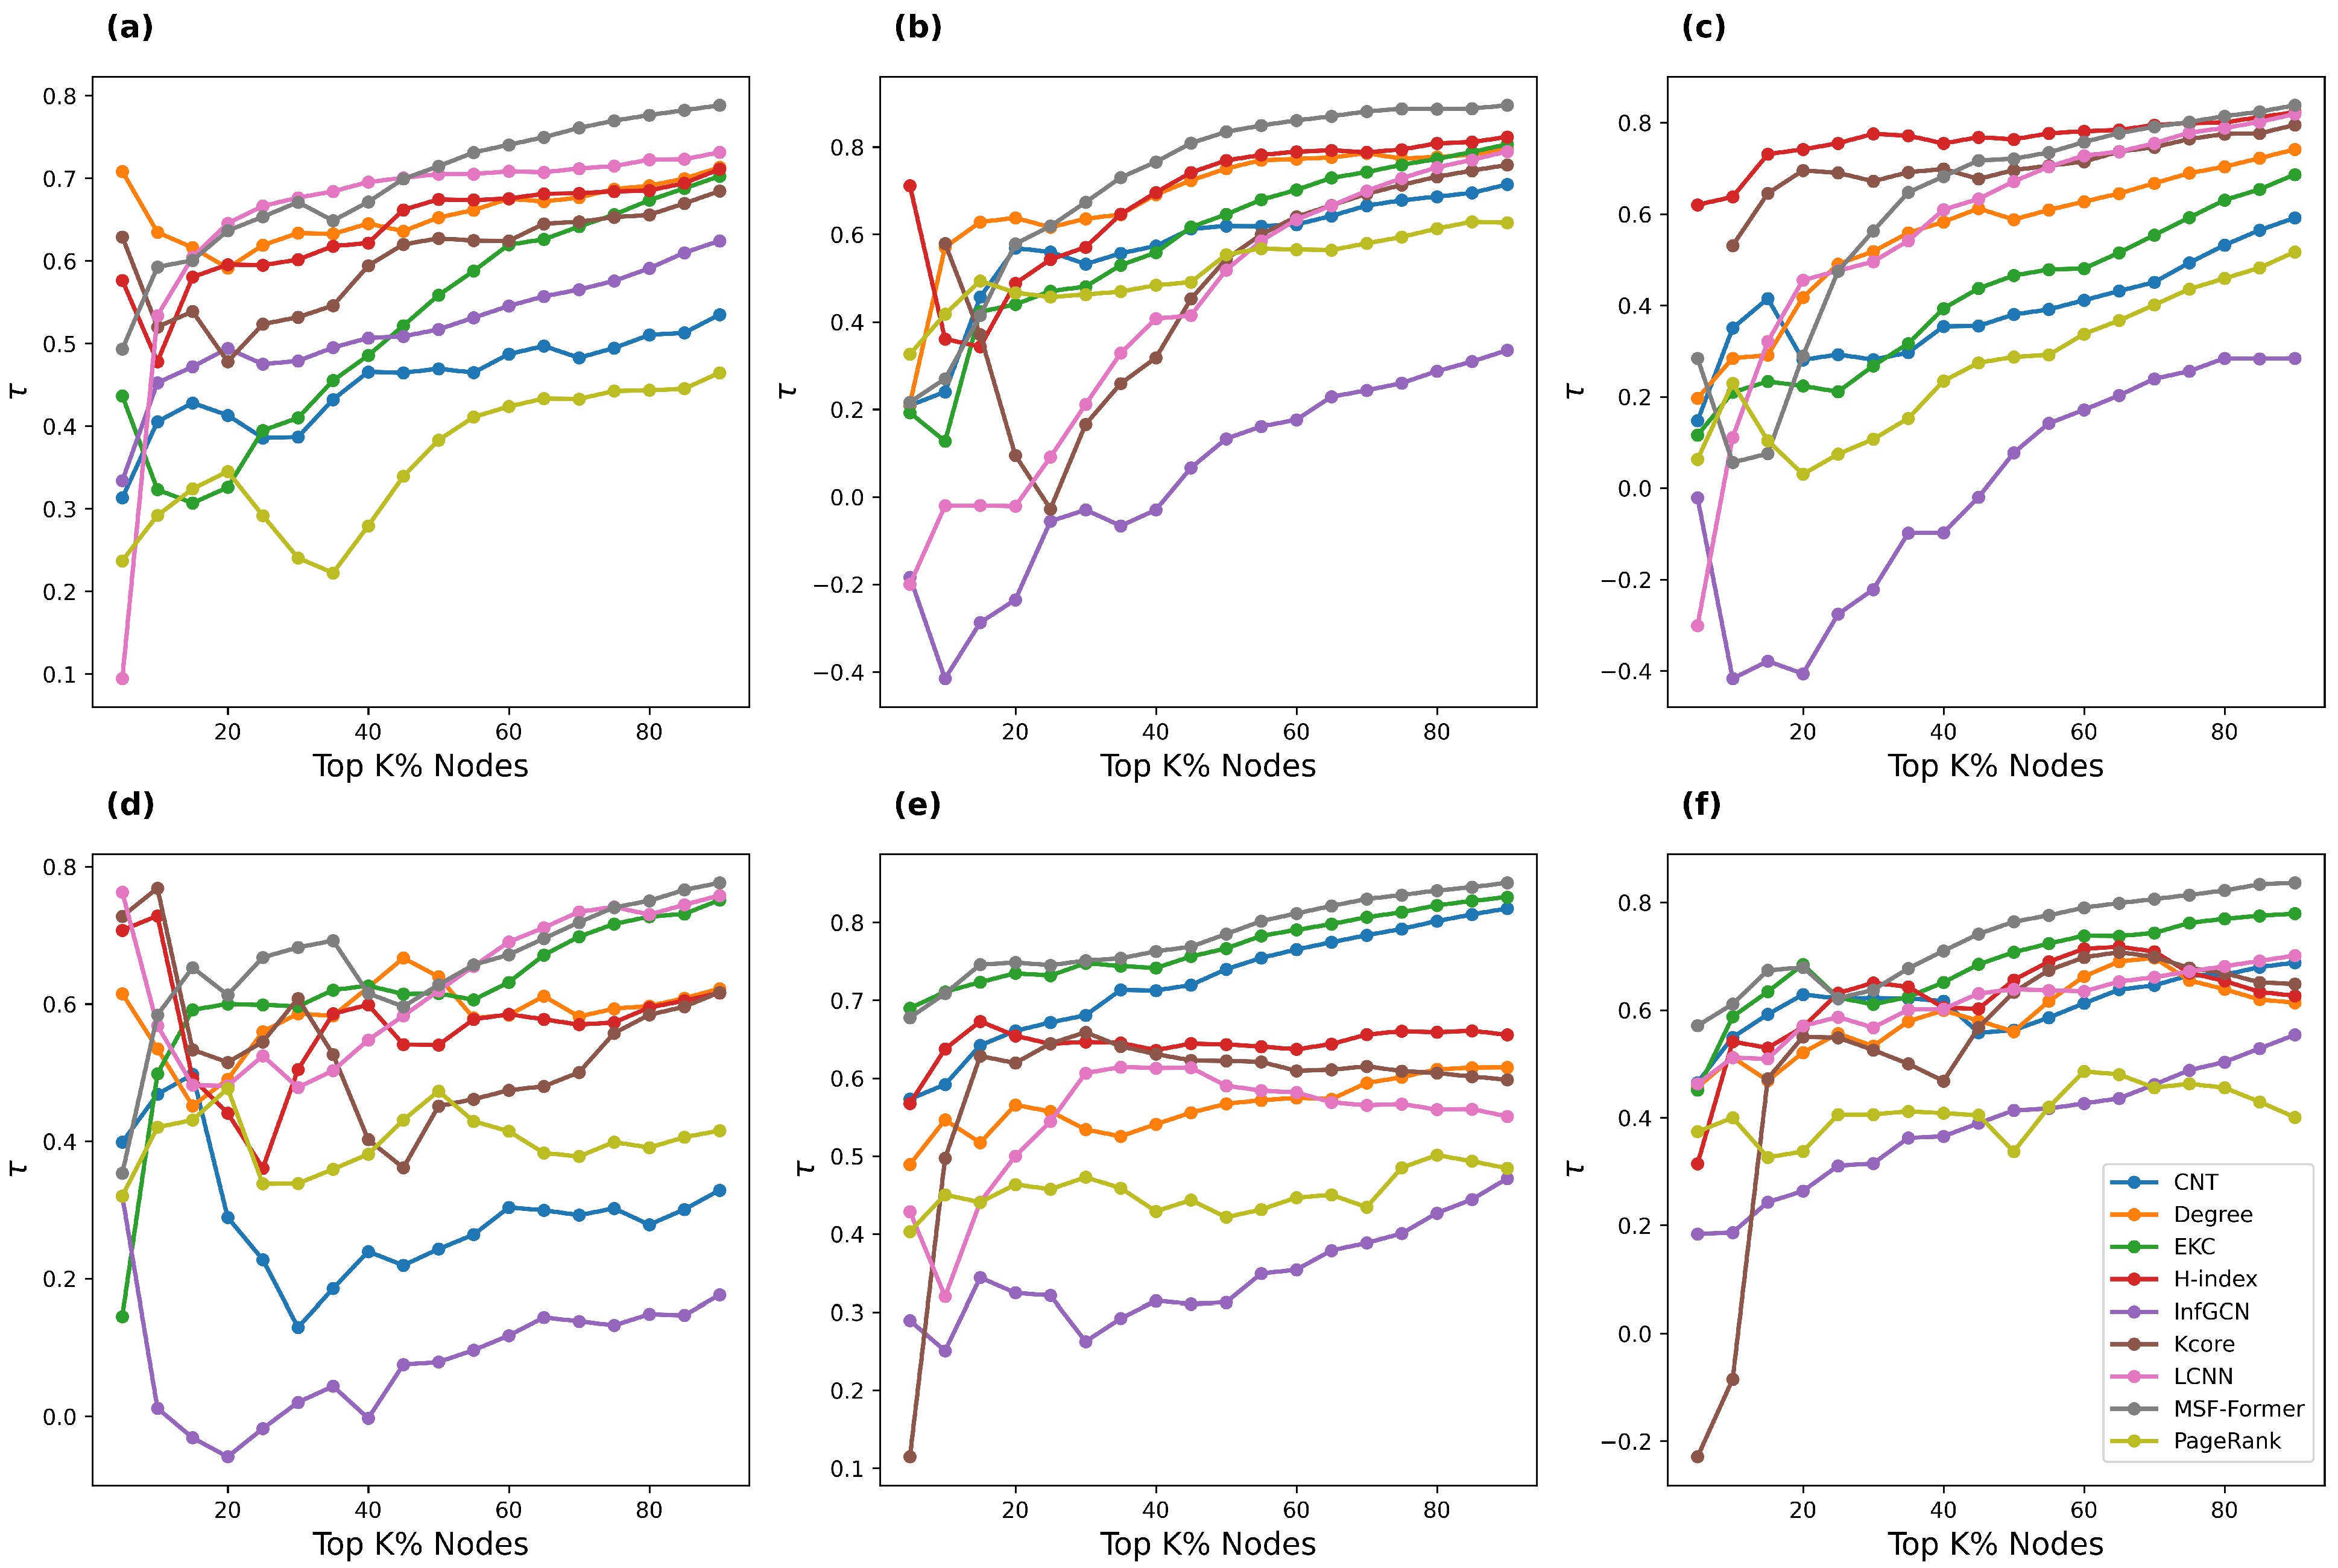
5.6.1. Synthetic Networks

We first conducted a comparative analysis of the Kendall correlation coefficient between the SIR model and various node importance evaluation algorithms across three synthetic networks, with the spreading rate range set to [0.01, 0.15]. As shown in Figure 5, MSF-Former consistently outperforms the other eight algorithms across all metrics, demonstrating its strong capability in identifying influential nodes in different synthetic networks. Moreover, MSF-Former maintains a significant advantage across a broader range of spreading rates. When the spreading rate is low, degree centrality and H-index perform relatively well, which can be attributed to the fact that under low spreading rates, a node’s actual influence is primarily determined by its degree.

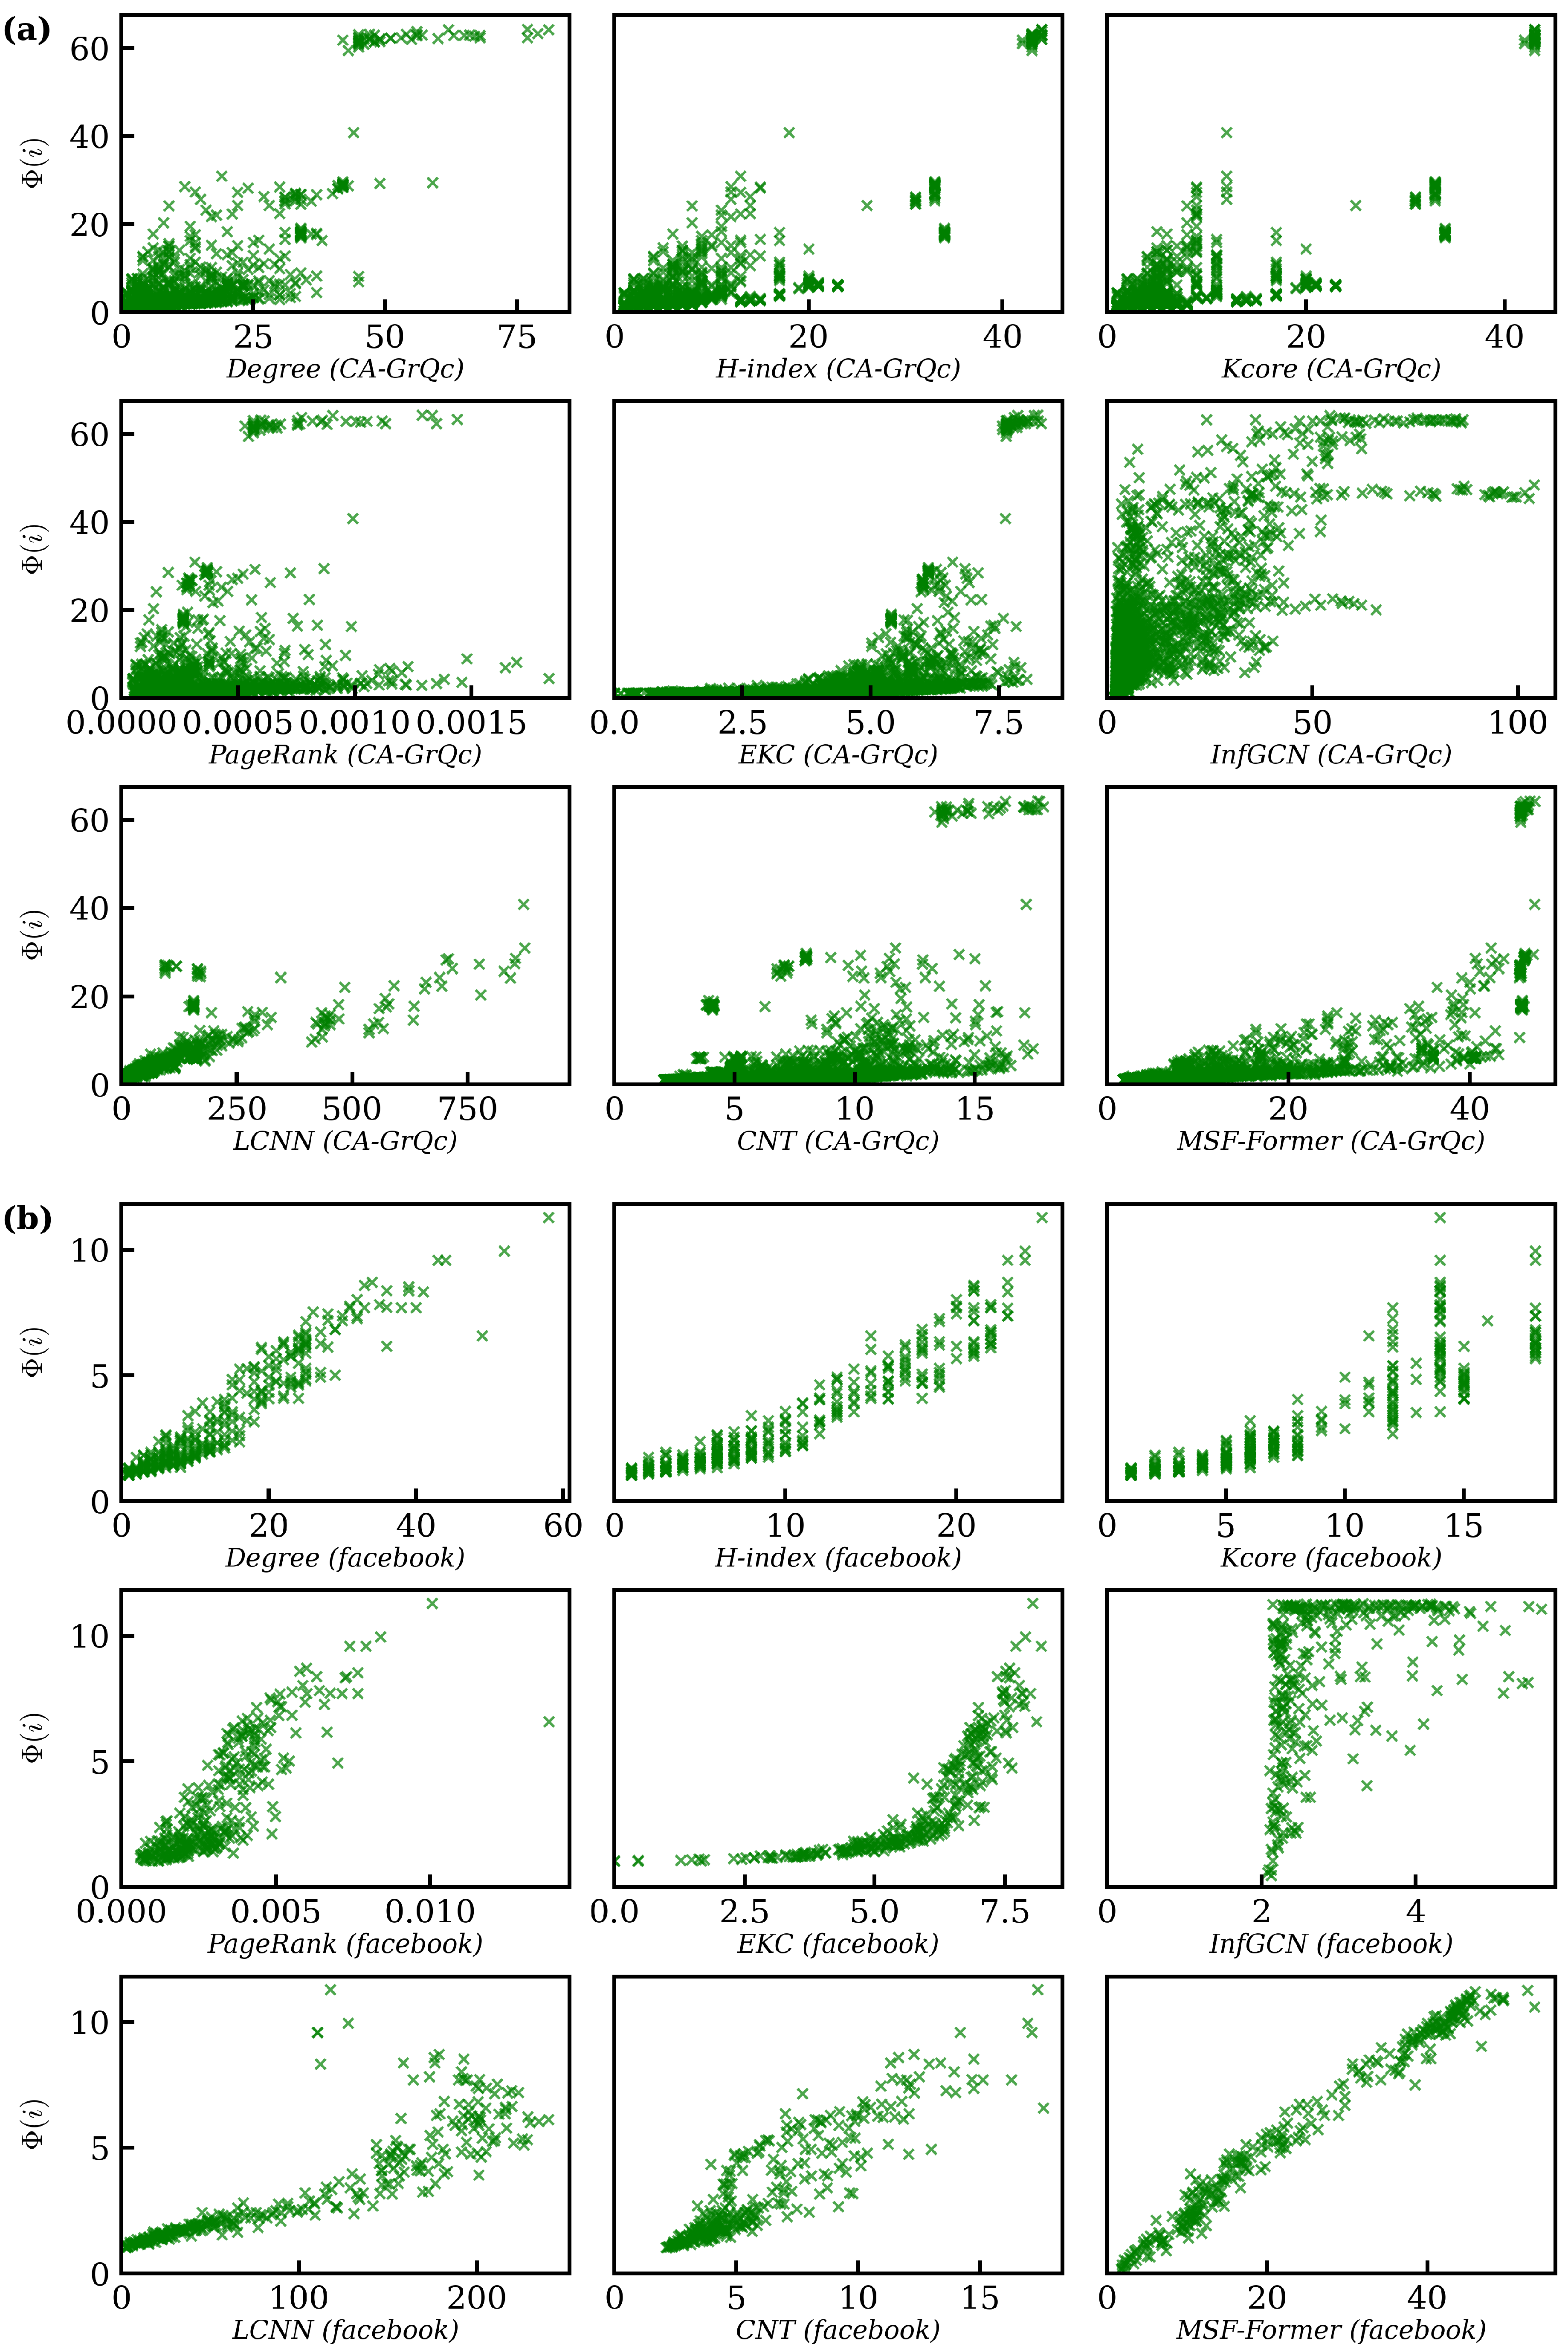
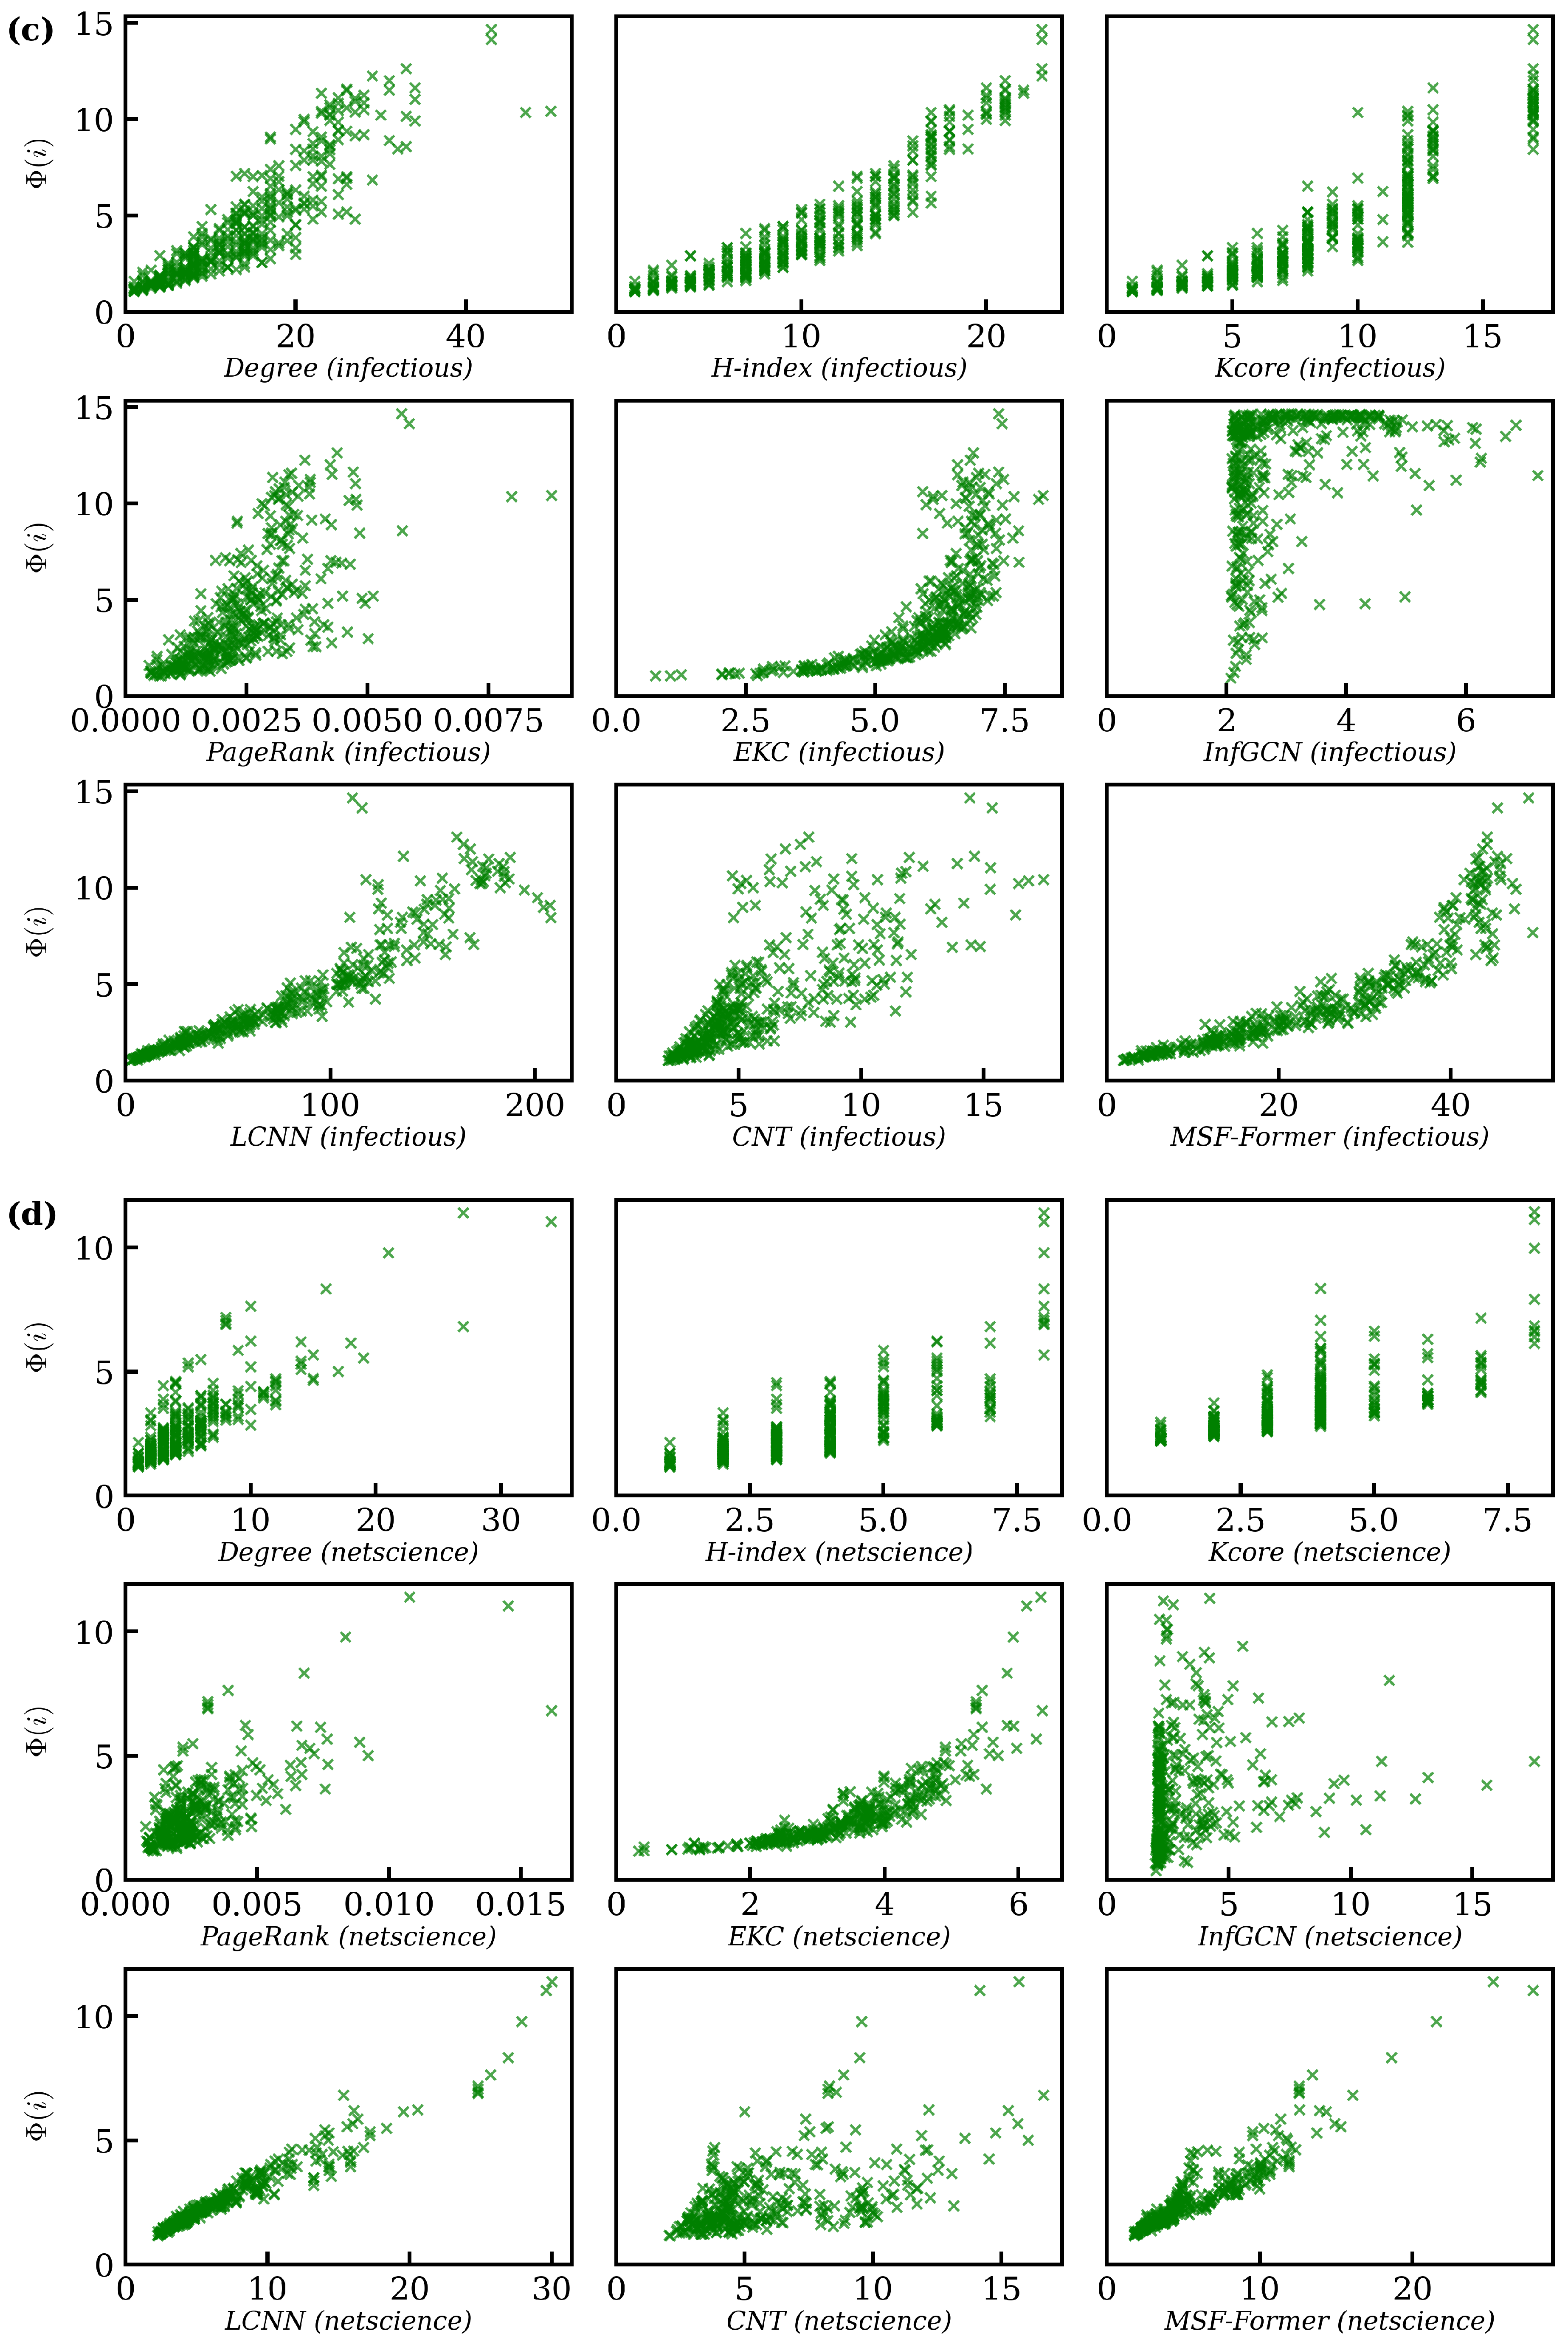
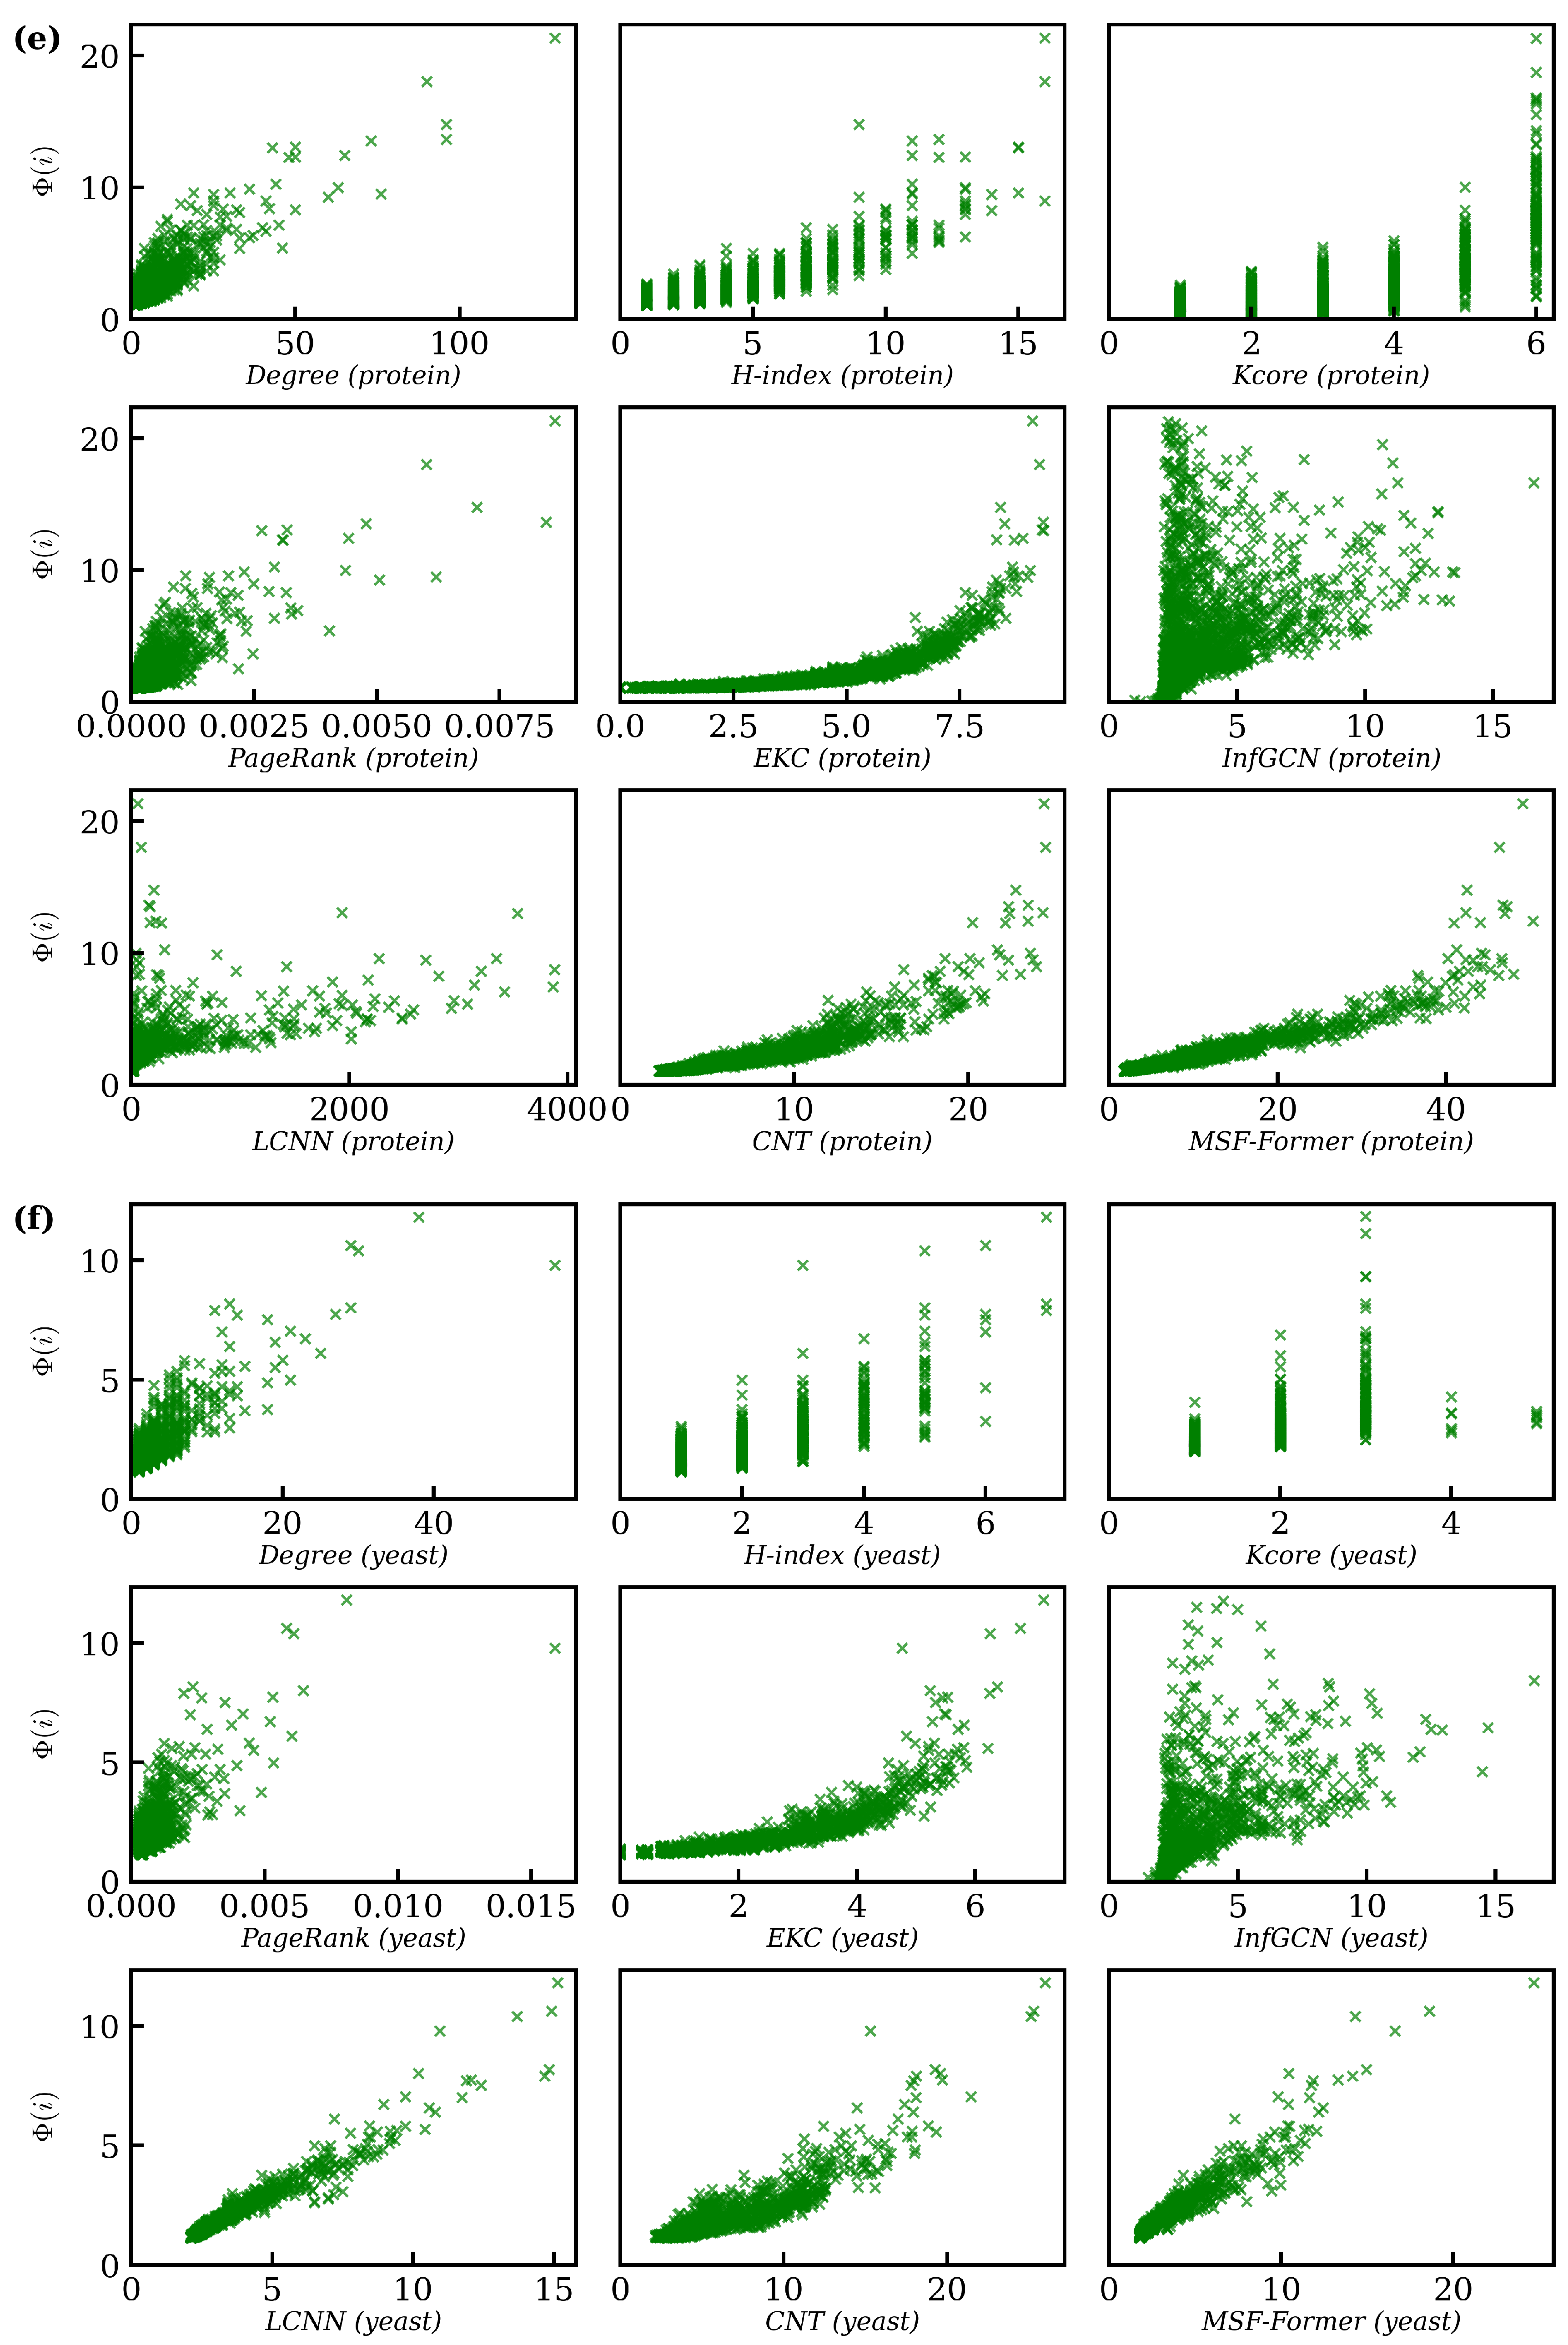
5.6.2. Real-World Network Validation

In addition to the three synthetic networks, we also conducted experiments on six real-world networks. We first evaluate the correlation between the node rankings produced by various algorithms and their actual propagation capabilities. The infection probability for each of the six networks is set according to the β values presented in Table 3, and each experiment is independently run 1000 times, with the average results recorded. Higher correlation values indicate that the node importance ranking derived from the algorithm more accurately reflects the true node influence.
As shown in Figure 6, the proposed MSF-Former exhibits a high correlation with the number of infections Φ in the SIR propagation process and outperforms other algorithms in most cases. In contrast, traditional centrality-based methods such as degree, H-index, and K-core show weaker correlations with actual influence, with results displaying greater fluctuations. Notably, H-index and K-core exhibit the weakest correlation with the number of infected nodes in the SIR model. This is because, in highly community-structured networks, nodes tend to have high clustering coefficients, and local connections limit the relationship between degree and global influence, thereby affecting ranking accuracy. PageRank produces predictions concentrated within a narrow range. While it exhibits a weak linear relationship in low-influence regions, its performance in identifying highly influential nodes is poor. This is mainly due to the sensitivity of PageRank to random walk paths, which introduces bias in strongly community-structured networks, leading to an underestimation of important nodes. Additionally, deep learning-based methods also fail to achieve satisfactory performance, with InfGCN performing particularly poorly.
In the correlation experiments, the spreading rate is fixed, meaning the experimental results only reflect a static state under a specific spreading rate. To more accurately evaluate and compare the ranking capabilities of different algorithms, we use τ as the accuracy metric and set the spreading rate within the range 0.01 , β th + 0.07 . If β t h 0.08 , the spreading rate is set within [0.01, 0.15]. Figure 7 presents the experimental results, demonstrating that MSF-Former outperforms other algorithms in most cases. Although K-core, PageRank, and EKC methods are based on global network information, they do not exhibit a significant advantage in identifying key influential nodes. Meanwhile, degree centrality and H-index, as local feature-based methods, perform well at lower spreading rates because information propagation is constrained locally, primarily influenced by the number of direct neighbors. In these cases, nodes with higher degree values tend to have a wider infection range. The LCNN model performs worse than MSF-Former due to its over-reliance on local neighborhood features, lacking an effective representation of global topological information. Although InfGCN fuses local and global features, its shallow GCN architecture limits the capture of higher-order neighborhood information, and its coarse feature fusion design fails to fully exploit multi-scale structural correlations, leading to suboptimal recognition performance. The suboptimal performance of the CNT model is attributed to its relatively simplistic input features, which primarily rely on node degree information and fail to adequately capture the multi-level structural characteristics of nodes in complex networks.
We further adjust the node evaluation range K to analyze variations in the Kendall correlation coefficient. Figure 8 presents the correlation between different algorithms’ ranking results and actual propagation influence rankings across various node proportions. The results indicate that for small K values, MSF-Former performs slightly worse than certain methods in the Facebook and infectious networks. This is primarily because these networks have relatively low overall degree, leading to minimal differences in the propagation influence of top-ranked nodes. In such low-degree networks, multiple high-ranked nodes exhibit similar propagation capacity, which affects MSF-Former’s evaluation performance for small-scale selections. However, as K increases, MSF-Former demonstrates more stable superiority across a broader range of node rankings, accurately identifying nodes that play a critical role in information dissemination. In contrast, other algorithms tend to exhibit inconsistent performance across different network structures, particularly in larger and more complex networks, where their ranking stability is notably weaker. Overall, MSF-Former outperforms other algorithms in ranking robustness.

5.6.3. Computational Complexity

To comprehensively evaluate the practical performance of MSF-Former, this study further introduces a computational complexity assessment. Computational complexity is measured by GFLOPs, which mitigates the influence of hardware differences on runtime and provides a more objective reflection of the theoretical computational cost.
In this experiment, MSF-Former and three deep learning methods (InfGCN, LCNN, and CNT) were selected as comparative models, and their GFLOPs during the inference phase were measured. The tests were conducted on network datasets of varying scales. It is worth noting that, since the inputs of InfGCN and CNT depend on the number of network nodes, their computational complexity increases with the growth of network size. In contrast, MSF-Former and LCNN employ fixed-size inputs, and their computational complexity remains unaffected by changes in network scale. The experimental results, as shown in Table 4, demonstrate that although MSF-Former incorporates a multi-scale feature fusion mechanism, it still exhibits significantly lower computational complexity compared to other methods, thereby achieving superior inference efficiency.

6. Conclusions

This paper proposes a transformer framework with multi-scale feature fusion (MSF-Former) that innovatively combines multi-modal thinking and transformer technology. We construct two feature maps by incorporating both global and local network structure information of the nodes as model inputs, and utilize the transformer for feature fusion learning. This facilitates the comprehensive extraction of both global and local node information, which in turn improves the accuracy of node importance identification. The effectiveness of MSF-Former is validated by using the Kendall correlation coefficient as the evaluation metric, with experiments conducted on six real-world and three synthetic network datasets. The results from the correlation experiments show that MSF-Former can more precisely measure the propagation influence of nodes. Moreover, in experiments across different spreading rates and node ranges, MSF-Former demonstrates superior performance in identifying key nodes, with its accuracy surpassing various classic and recently proposed methods. These results fully demonstrate the effectiveness and innovation of MSF-Former.
Future improvements to enhance the effectiveness and applicability of MSF-Former can be considered along several directions. In terms of feature representation, incorporating additional information such as node heterogeneity and dynamic evolution could further enrich node representations and improve the model’s recognition ability in complex network environments. Regarding model structure, considering the relatively high computational complexity of transformer architectures, future work could explore lightweight transformer variants or sparse attention mechanisms to reduce inference costs and improve computational efficiency. Moreover, given that weighted networks provide a more realistic characterization of connection strengths in real-world systems [51], future extensions of MSF-Former could focus on adapting the model to weighted network settings. It is also worth noting that the current study primarily validates the model on undirected and unweighted networks, and has not yet systematically tested its performance on weighted or directed networks. By incorporating edge weight information and considering network directionality, the model could capture node importance more comprehensively, thereby enhancing its applicability and generalization ability in practical complex networks.

Author Contributions

Conceptualization: T.J. and Y.R.; methodology: T.J.; validation: T.J. and T.Y.; formal analysis: Y.Y. and L.B.; investigation: Y.R. and T.Y.; resources: T.J.; data curation: T.J.; writing—original draft preparation: T.J.; writing—review and editing: Y.R.; visualization: Y.Y. All authors have read and agreed to the published version of the manuscript.

Funding

This research was funded by the National Natural Science Foundation of China (NSFC) under grant number 72101265.

Data Availability Statement

The data presented in this study are available on request from the corresponding author.

Acknowledgments

I would like to express my gratitude to the National Natural Science Foundation of China (NSFC) for providing the financial support that made this research possible.

Conflicts of Interest

The authors declare no conflicts of interest.

References

  1. Lü, L.; Chen, D.; Ren, X.L.; Zhang, Q.M.; Zhang, Y.C.; Zhou, T. Vital nodes identification in complex networks. Phys. Rep. 2016, 650, 1–63. [Google Scholar] [CrossRef]
  2. Pastor-Satorras, R.; Vespignani, A. Epidemic spreading in scale-free networks. Phys. Rev. Lett. 2001, 86, 3200. [Google Scholar] [CrossRef] [PubMed]
  3. Albert, R.; Barabási, A.L. Statistical mechanics of complex networks. Rev. Mod. Phys. 2002, 74, 47. [Google Scholar] [CrossRef]
  4. Zeng, Y. Evaluation of node importance and invulnerability simulation analysis in complex load-network. Neurocomputing 2020, 416, 158–164. [Google Scholar] [CrossRef]
  5. Albert, R.; Jeong, H.; Barabási, A.L. Diameter of the world-wide web. Nature 1999, 401, 130–131. [Google Scholar] [CrossRef]
  6. Freeman, L.C. A set of measures of centrality based on betweenness. Sociometry 1977, 40, 35–41. [Google Scholar] [CrossRef]
  7. Sabidussi, G. The centrality index of a graph. Psychometrika 1966, 31, 581–603. [Google Scholar] [CrossRef]
  8. Lü, L.; Zhou, T.; Zhang, Q.M.; Stanley, H.E. The H-index of a network node and its relation to degree and coreness. Nat. Commun. 2016, 7, 10168. [Google Scholar] [CrossRef] [PubMed]
  9. Kitsak, M.; Gallos, L.K.; Havlin, S.; Liljeros, F.; Muchnik, L.; Stanley, H.E.; Makse, H.A. Identification of influential spreaders in complex networks. Nat. Phys. 2010, 6, 888–893. [Google Scholar] [CrossRef]
  10. Wen, X.; Tu, C.; Wu, M.; Jiang, X. Fast ranking nodes importance in complex networks based on LS-SVM method. Phys. A Stat. Mech. Its Appl. 2018, 506, 11–23. [Google Scholar] [CrossRef]
  11. Li, X.; Zhang, Z.; Liu, J.; Gai, K. A new complex network robustness attack algorithm. In Proceedings of the 2019 ACM International Symposium on Blockchain and Secure Critical Infrastructure, Auckland, New Zealand, 8 July 2019; pp. 13–17. [Google Scholar] [CrossRef]
  12. Zhao, G.; Jia, P.; Huang, C.; Zhou, A.; Fang, Y. A machine learning based framework for identifying influential nodes in complex networks. IEEE Access 2020, 8, 65462–65471. [Google Scholar] [CrossRef]
  13. Fan, C.; Zeng, L.; Sun, Y.; Liu, Y.Y. Finding key players in complex networks through deep reinforcement learning. Nat. Mach. Intell. 2020, 2, 317–324. [Google Scholar] [CrossRef]
  14. Yu, E.Y.; Wang, Y.P.; Fu, Y.; Chen, D.B.; Xie, M. Identifying critical nodes in complex networks via graph convolutional networks. Knowl.-Based Syst. 2020, 198, 105893. [Google Scholar] [CrossRef]
  15. Tang, J.; Qu, J.; Song, S.; Zhao, Z.; Du, Q. GCNT: Identify influential seed set effectively in social networks by integrating graph convolutional networks with graph transformers. J. King Saud Univ.-Comput. Inf. Sci. 2024, 36, 102183. [Google Scholar] [CrossRef]
  16. Ye, L.; Rochan, M.; Liu, Z.; Wang, Y. Cross-modal self-attention network for referring image segmentation. In Proceedings of the IEEE/CVF Conference on Computer Vision and Pattern Recognition, Long Beach, CA, USA, 15–20 June 2019; pp. 10502–10511. [Google Scholar]
  17. Tzinis, E.; Wisdom, S.; Jansen, A.; Hershey, S.; Remez, T.; Ellis, D.P.; Hershey, J.R. Into the wild with audioscope: Unsupervised audio-visual separation of on-screen sounds. arXiv 2020, arXiv:2011.01143. [Google Scholar] [CrossRef]
  18. Gabeur, V.; Sun, C.; Alahari, K.; Schmid, C. Multi-modal transformer for video retrieval. In Proceedings of the European Conference on Computer Vision, Glasgow, UK, 23–28 August 2020; Springer: Cham, Switzerland, 2020; pp. 214–229. [Google Scholar]
  19. Dzabraev, M.; Kalashnikov, M.; Komkov, S.; Petiushko, A. Mdmmt: Multidomain multimodal transformer for video retrieval. In Proceedings of the IEEE/CVF Conference on Computer Vision and Pattern Recognition, Nashville, TN, USA, 20–25 June 2021; pp. 3354–3363. [Google Scholar]
  20. Iashin, V.; Rahtu, E. Multi-modal dense video captioning. In Proceedings of the IEEE/CVF Conference on Computer Vision and Pattern Recognition Workshops, Seattle, WA, USA, 14–19 June 2020; pp. 958–959. [Google Scholar]
  21. Vaswani, A.; Shazeer, N.; Parmar, N.; Uszkoreit, J.; Jones, L.; Gomez, A.N.; Kaiser, Ł.; Polosukhin, I. Attention is all you need. Adv. Neural Inf. Process. Syst. 2017, 30, 6000–6010. [Google Scholar]
  22. Opsahl, T.; Agneessens, F.; Skvoretz, J. Node centrality in weighted networks: Generalizing degree and shortest paths. Soc. Netw. 2010, 32, 245–251. [Google Scholar] [CrossRef]
  23. Zhang, P.; Wang, J.; Li, X.; Li, M.; Di, Z.; Fan, Y. Clustering coefficient and community structure of bipartite networks. Phys. A Stat. Mech. Its Appl. 2008, 387, 6869–6875. [Google Scholar] [CrossRef]
  24. Zhao, G.; Jia, P.; Zhou, A.; Zhang, B. InfGCN: Identifying influential nodes in complex networks with graph convolutional networks. Neurocomputing 2020, 414, 18–26. [Google Scholar] [CrossRef]
  25. Li, Y.; Cai, W.; Li, Y.; Du, X. Key node ranking in complex networks: A novel entropy and mutual information-based approach. Entropy 2019, 22, 52. [Google Scholar] [CrossRef]
  26. Chen, L.; Xi, Y.; Dong, L.; Zhao, M.; Li, C.; Liu, X.; Cui, X. Identifying influential nodes in complex networks via Transformer. Inf. Process. Manag. 2024, 61, 103775. [Google Scholar] [CrossRef]
  27. Ahmad, W.; Wang, B.; Chen, S. Learning to rank influential nodes in complex networks via convolutional neural networks. Appl. Intell. 2024, 54, 3260–3278. [Google Scholar] [CrossRef]
  28. Bonacich, P. Power and centrality: A family of measures. Am. J. Sociol. 1987, 92, 1170–1182. [Google Scholar] [CrossRef]
  29. Xu, X.; Zhu, C.; Wang, Q.; Zhu, X.; Zhou, Y. Identifying vital nodes in complex networks by adjacency information entropy. Sci. Rep. 2020, 10, 2691. [Google Scholar] [CrossRef]
  30. Brin, S.; Page, L. The anatomy of a large-scale hypertextual web search engine. Comput. Netw. ISDN Syst. 1998, 30, 107–117. [Google Scholar] [CrossRef]
  31. Lü, L.; Zhang, Y.C.; Yeung, C.H.; Zhou, T. Leaders in social networks, the delicious case. PLoS ONE 2011, 6, e21202. [Google Scholar] [CrossRef]
  32. Curado, M.; Tortosa, L.; Vicent, J.F. A novel measure to identify influential nodes: Return random walk gravity centrality. Inf. Sci. 2023, 628, 177–195. [Google Scholar] [CrossRef]
  33. Ullah, A.; Wang, B.; Sheng, J.; Long, J.; Khan, N.; Sun, Z. Identifying vital nodes from local and global perspectives in complex networks. Expert Syst. Appl. 2021, 186, 115778. [Google Scholar] [CrossRef]
  34. Liu, W.; Lu, P.; Zhang, T. Identifying influential nodes in complex networks from semi-local and global perspective. IEEE Trans. Comput. Soc. Syst. 2023, 11, 2105–2120. [Google Scholar] [CrossRef]
  35. Ullah, A.; Meng, Y. Finding influential nodes via graph embedding and hybrid centrality in complex networks. Chaos Solitons Fractals 2025, 194, 116151. [Google Scholar] [CrossRef]
  36. Rezaei, A.A.; Munoz, J.; Jalili, M.; Khayyam, H. A machine learning-based approach for vital node identification in complex networks. Expert Syst. Appl. 2023, 214, 119086. [Google Scholar] [CrossRef]
  37. Zhang, M.; Wang, X.; Jin, L.; Song, M.; Li, Z. A new approach for evaluating node importance in complex networks via deep learning methods. Neurocomputing 2022, 497, 13–27. [Google Scholar] [CrossRef]
  38. Kermack, W.O.; McKendrick, A.G. A contribution to the mathematical theory of epidemics. Proc. R. Soc. London. Ser. A Contain. Pap. Math. Phys. Character 1927, 115, 700–721. [Google Scholar] [CrossRef]
  39. Bae, J.; Kim, S. Identifying and ranking influential spreaders in complex networks by neighborhood coreness. Phys. A Stat. Mech. Its Appl. 2014, 395, 549–559. [Google Scholar] [CrossRef]
  40. Maas, A.L.; Hannun, A.Y.; Ng, A.Y. Rectifier nonlinearities improve neural network acoustic models. In Proceedings of the 30th International Conference on Machine Learning, Atlanta, GA, USA, 16–21 June 2013; Volume 30, p. 3. [Google Scholar]
  41. Hendrycks, D.; Gimpel, K. Gaussian error linear units (gelus). arXiv 2016, arXiv:1606.08415. [Google Scholar] [CrossRef]
  42. Barabási, A.L.; Albert, R. Emergence of scaling in random networks. Science 1999, 286, 509–512. [Google Scholar] [CrossRef] [PubMed]
  43. Kendall, M.G. A new measure of rank correlation. Biometrika 1938, 30, 81–93. [Google Scholar] [CrossRef]
  44. Batagelj, V.; Mrvar, A. Pajek-program for large network analysis. Connections 1998, 21, 47–57. [Google Scholar]
  45. Newman, M.E. Finding community structure in networks using the eigenvectors of matrices. Phys. Rev. E Stat. Nonlinear Soft Matter Phys. 2006, 74, 036104. [Google Scholar] [CrossRef]
  46. Leskovec, J.; Mcauley, J. Learning to discover social circles in ego networks. Adv. Neural Inf. Process. Syst. 2012, 25, 1–28. [Google Scholar]
  47. Isella, L.; Stehlé, J.; Barrat, A.; Cattuto, C.; Pinton, J.F.; Van den Broeck, W. What’s in a crowd? Analysis of face-to-face behavioral networks. J. Theor. Biol. 2011, 271, 166–180. [Google Scholar] [CrossRef] [PubMed]
  48. Jeong, H.; Mason, S.P.; Barabási, A.L.; Oltvai, Z.N. Lethality and centrality in protein networks. Nature 2001, 411, 41–42. [Google Scholar] [CrossRef] [PubMed]
  49. Rual, J.F.; Venkatesan, K.; Hao, T.; Hirozane-Kishikawa, T.; Dricot, A.; Li, N.; Berriz, G.F.; Gibbons, F.D.; Dreze, M.; Ayivi-Guedehoussou, N.; et al. Towards a proteome-scale map of the human protein–protein interaction network. Nature 2005, 437, 1173–1178. [Google Scholar] [CrossRef] [PubMed]
  50. Leskovec, J.; Kleinberg, J.; Faloutsos, C. Graph evolution: Densification and shrinking diameters. ACM Trans. Knowl. Discov. Data 2007, 1, 2-es. [Google Scholar] [CrossRef]
  51. Bellingeri, M.; Bevacqua, D.; Sartori, F.; Turchetto, M.; Scotognella, F.; Alfieri, R.; Nguyen, N.; Le, T.; Nguyen, Q.; Cassi, D. Considering weights in real social networks: A review. Front. Phys. 2023, 11, 1152243. [Google Scholar] [CrossRef]
Figure 1. The basic process of MSF-Former. First, node feature maps are extracted from the network, which include local feature maps and global feature maps. The local feature maps consist of degree centrality matrix E ( D C ) , weighted degree centrality matrix E ( D C P ) , and clustering coefficient matrix E ( C L ) . The global feature maps consist of the betweenness centrality matrix E ( B C ) , the closeness centrality matrix E ( C C ) , and the k-shell index matrix E ( K S ) . These features are fed into the Multi-Scale Feature Fusion Transformer for node influence prediction. The model is trained using labels generated from SIR model simulations, where the label represents the number of nodes that a given node can infect during the propagation process. To evaluate the performance of the method, MSF-Former is compared against traditional and deep learning-based algorithms, including degree, H-index, K-core, EKC, PageRank, LCNN, InfGCN, and CNT.
Bdcc 09 00129 g001
Figure 2. Illustration of adjacency matrix extraction: (a) identify the neighbor nodes directly connected to node 3 (nodes 1, 2, 4, 6, and 7), and sort them in descending order based on W D C to extract the candidate set for node 3; (b) generate adjacency matrices of size L = 5 and L = 6 based on these nodes.
Bdcc 09 00129 g002
Figure 3. Multi-scale feature fusion transformer module.
Bdcc 09 00129 g003
Figure 4. Parameter analysis: MSF-Former’s Kendall coefficient τ and total number of model parameters under different neighbor counts L and transformer layer numbers.
Bdcc 09 00129 g004
Figure 5. Comparison of ranking accuracy among nine methods on three synthetic networks datasets. The horizontal axis denotes the spreading rates, and the vertical axis indicates the Kendall correlation coefficient between the node rankings predicted by different algorithms and the ground-truth influence rankings derived from the SIR model: (a) LFR2000-k5; (b) LFR2000-k10; (c) LFR2000-k15.
Bdcc 09 00129 g005
Figure 6. The correlation of the rankings from nine different methods with the number of infected nodes in the SIR model’s propagation process. The horizontal axis shows the node influence predicted by each algorithm, while the vertical axis represents the actual number of infected nodes from SIR model simulations. Due to differences in scoring mechanisms and output scales among the algorithms, the horizontal axis values are not on a unified scale: (a) CA-GrQc; (b) Facebook; (c) infectious; (d) netscience; (e) protein; (f) yeast.
Bdcc 09 00129 g006aBdcc 09 00129 g006bBdcc 09 00129 g006c
Figure 7. Comparison of ranking accuracy among nine methods on six real-world network datasets. The horizontal axis indicates the spreading rate, while the vertical axis shows the Kendall correlation coefficient between the node rankings predicted by different algorithms and the ground-truth influence rankings derived from SIR simulations: (a) CA-GrQc; (b) Facebook; (c) infectious; (d) netscience; (e) protein; (f) yeast.
Bdcc 09 00129 g007
Figure 8. Comparison of nine algorithms at different node proportions. The horizontal axis represents the node sampling rate, and the vertical axis shows the Kendall correlation coefficient between the predicted and ground-truth node rankings: (a) CA-GrQc; (b) Facebook; (c) infectious; (d) netscience; (e) protein; (f) yeast.
Bdcc 09 00129 g008
Table 1. List of acronyms.
AcronymMeaningReference
M S F - F o r m e r A transformer framework with multi-scale feature fusion
D C Degree centrality[5]
B C Betweenness centrality[6]
D C p Weighted degree centrality[22]
C C Closeness centrality[7]
K S K-shell index[9]
C L Clustering coefficient[23]
K C K-core centrality[9]
H I H-index[8]
I n f G C N GCN model predicting node influence based on centrality features[24]
E K C Enhances K-core by integrating neighbors’ K-core values[25]
C N T Transformer model identifying influential nodes via dynamic feature sequences[26]
L C N N CNN model ranking node importance from local feature maps[27]
Table 2. The statistical properties of the synthetic networks.
NetworkNE d β th β k C ks max
LFR2000-k5200010,0345.698360.098360.0950.377398
LFR2000-k10200020,6344.472040.072270.07100.4104111
LFR2000-k15200030,3503.923030.057720.05200.423911
Table 3. The statistical properties of the real-world networks.
NetworkNE d β th β k C ks max
CA-GrQc415813,4226.049380.055610.056.4560.5568843
facebook32422183.053740.046620.0413.6910.4658118
infectious41027653.630850.053430.0513.4880.4558217
netscience3799146.041870.124680.124.8230.741238
protein78367264.839840.063390.064.3170.071526
yeast145819486.812370.140310.142.6720.070835
Table 4. GFLOPs comparison of different models across multiple networks.
ModelNetscienceCA-GrQcInfectiousProteinYeastFacebookLFR2000-k5LFR2000-k10LFR2000-k15
InfGCN0.00710.07780.00350.02860.01230.00270.01690.01690.0169
LCNN0.06110.06110.06110.06110.06110.06110.06110.06110.0611
CNT0.00420.42330.00490.12790.07180.00420.13310.13310.1331
MSF-Former0.00040.00040.00040.00040.00040.00040.00040.00040.0004
Disclaimer/Publisher’s Note: The statements, opinions and data contained in all publications are solely those of the individual author(s) and contributor(s) and not of MDPI and/or the editor(s). MDPI and/or the editor(s) disclaim responsibility for any injury to people or property resulting from any ideas, methods, instructions or products referred to in the content.

