Article

Wildfire Prediction in British Columbia Using Machine Learning and Deep Learning Models: A Data-Driven Framework

School of Engineering and Computer Science, Laurentian University, Sudbury, ON P3E 2C6, Canada
*
Author to whom correspondence should be addressed.
Big Data Cogn. Comput. 2025, 9(11), 290; https://doi.org/10.3390/bdcc9110290
Submission received: 2 September 2025 / Revised: 8 November 2025 / Accepted: 10 November 2025 / Published: 14 November 2025

Abstract

Wildfires pose a growing threat to ecosystems, infrastructure, and public safety, particularly in the province of British Columbia (BC), Canada. In recent years, the frequency, severity, and scale of wildfires in BC have increased significantly, largely due to climate change, human activity, and changing land use patterns. This study presents a comprehensive, data-driven approach to wildfire prediction, leveraging advanced machine learning (ML) and deep learning (DL) techniques. A high-resolution dataset was constructed by integrating five years of wildfire incident records from the Canadian Wildland Fire Information System (CWFIS) with ERA5 reanalysis climate data. The final dataset comprises more than 3.6 million spatiotemporal records and 148 environmental, meteorological, and geospatial features. Six feature selection techniques were evaluated, and five predictive models—Random Forest, XGBoost, LightGBM, CatBoost, and an RNN + LSTM—were trained and compared. The CatBoost model achieved the highest predictive performance with an accuracy of 93.4%, F1-score of 92.1%, and ROC-AUC of 0.94, while Random Forest achieved an accuracy of 92.6%. The study identifies key environmental variables, including surface temperature, humidity, wind speed, and soil moisture, as the most influential predictors of wildfire occurrence. These findings highlight the potential of data-driven AI frameworks to support early warning systems and enhance operational wildfire management in British Columbia.

1. Introduction

Wildfires have increasingly become one of the most critical global environmental challenges, threatening human communities, natural ecosystems, and biodiversity. Intensified by rising temperatures and drier atmospheric conditions associated with climate change, wildfire events are now occurring with greater frequency, severity, and spatial extent. According to Global Forest Watch, an average of 4.2 million hectares of forest are consumed annually by wildfires, incurring economic losses estimated at USD 20 billion globally. In addition to immediate destruction, wildfires significantly degrade air quality, disrupt ecological balance, and contribute to greenhouse gas emissions and global warming.
Traditional wildfire prediction systems, such as the Canadian Fire Weather Index (FWI) and statistical models, often rely on expert knowledge and linear assumptions. These methods struggle to capture the complex, nonlinear, and high-dimensional interactions between meteorological, topographical, and biological variables that drive wildfire behavior. The emergence of data-driven approaches—particularly machine learning (ML) and deep learning (DL) techniques—offers powerful tools capable of learning intricate patterns from multi-source environmental data. ML/DL algorithms are now increasingly applied to fire detection, forecasting, weather monitoring, and risk mapping.
Despite their potential, several limitations hinder the operational use of ML in wildfire prediction. These include the scarcity of high-resolution and reliable datasets, challenges in model interpretability, and difficulties in ensuring generalization across diverse geographic regions. In British Columbia (BC), where vast forests and diverse climates make wildfire management especially complex, these limitations are compounded by inconsistent data collection and limited integration across sources.
The present study is motivated by the urgent need for more accurate and interpretable wildfire prediction systems in BC, particularly in light of recent catastrophic fire seasons. In 2023, Canada experienced its most destructive wildfire year on record, with over 17 million hectares burned. In response, national initiatives have been launched to integrate AI and ML into fire risk assessment and resource allocation. This research contributes to those efforts by developing a comprehensive ML-based framework tailored to BC’s specific environmental conditions.
The primary objective is to build and evaluate a high-performance wildfire prediction system that uses ML techniques and addresses critical challenges such as data imbalance, model transparency, and regional scalability. The framework involves integrating meteorological, geospatial, and fire incident data, applying advanced feature selection methods, and benchmarking the performance of various ML/DL models—including Random Forest, XGBoost, LightGBM, CatBoost, and RNN + LSTM.
Wildfires have become an increasingly pressing global concern, driven by rising temperatures, prolonged droughts, and heightened climate variability [1]. In Canada—particularly in British Columbia (BC)—wildfires have grown in frequency, scale, and intensity, causing severe environmental, economic, and societal impacts [2]. Accurate and timely prediction is therefore essential for informing early warning systems, optimizing emergency response, and supporting resource management strategies.
Despite substantial advances in wildfire modeling, existing studies often remain limited to small-scale regions or rely on coarse-resolution datasets, which restrict their operational applicability. This study distinguishes itself by developing a high-resolution, province-wide wildfire dataset for British Columbia, integrating over 3.6 million spatiotemporal records from multiple authoritative sources, including CWFIS, ERA5, FIRMS, and the British Columbia Wildfire Management Branch. In addition, the work presents a systematic comparison of six feature selection techniques and five machine learning and deep learning models, enabling a rigorous assessment of model performance and interpretability. By framing the results within the context of Canadian wildfire management, the research provides a scalable and data-driven decision-support framework designed to enhance both predictive capability and operational readiness for wildfire risk monitoring.
This study makes the following key contributions: (1) Development of a high-resolution wildfire dataset for British Columbia, constructed by integrating multi-source data, including the Canadian Wildland Fire Information System (CWFIS), ERA5 reanalysis data, and geospatial attributes. (2) Systematic comparison of six feature selection techniques (ReliefF, Relief, Mutual Information, Recursive Feature Elimination, Correlation-based, and Model-based Importance) across multiple ML and DL algorithms, providing insight into their relative strengths for environmental prediction. (3) Comprehensive evaluation of five predictive models—Random Forest, XGBoost, LightGBM, CatBoost, and RNN + LSTM—using multiple train–test splits and 10-fold cross-validation to ensure generalizability. (4) Implementation of Random Undersampling (RUS) to address extreme class imbalance in wildfire data, improving model reliability and performance stability. Identification of key environmental drivers of wildfire occurrences, such as temperature, humidity, wind speed, and soil moisture, with strong alignment to established fire science findings. (5) Proposition of a scalable, interpretable, and region-specific ML/DL framework for wildfire prediction, designed to support data-driven decision-making warning systems in British Columbia.

2. Related Literature

Wildfires are a natural component of Canadian ecosystems and play a role in forest regeneration [1,2]. However, their frequency and intensity have increased in recent decades, driven by climate-induced shifts such as elevated temperatures, reduced snowpack, and persistent drought conditions [1,3,4]. National assessments indicate that Canada now experiences approximately 7000 wildfires annually, burning nearly 2.5 million hectares of land [5]. Human activity also plays a significant role, as nearly 55% of wildfires in Canada are caused by anthropogenic sources such as discarded cigarettes, unattended campfires, and industrial operations [6]. The 2016 Fort McMurray wildfire remains the costliest natural disaster in Canadian history, with over USD 9 billion in damages [7].
British Columbia accounts for nearly 40% of the total area burned annually in Canada [5,8]. The province’s diverse topography and climate- ranging from humid coastal regions to dry interior plateaus- create highly variable and difficult-to-manage fire behavior [5,8]. Climatic trends have lengthened the fire season and intensified fire activity, with the 2021 season alone resulting in more than 8600 square kilometers burned [8]. Factors such as dry summers, strong winds, mountainous terrain, and climate-induced snowmelt contribute to BC’s elevated wildfire risk [2,4,9]. In response, the BC Wildfire Service has implemented mitigation strategies that include real-time satellite surveillance, aerial patrols, FireSmart community initiatives, and partnerships with Indigenous communities [8,10,11].
Traditional wildfire prediction methods primarily rely on statistical and physical models. Statistical techniques such as logistic regression and Poisson models use historical data and meteorological variables—like temperature and humidity—to estimate fire probabilities [12]. These methods are simple and interpretable but generally fail to capture nonlinear relationships or complex interactions. Physical models, such as FARSITE, simulate fire spread using inputs such as terrain, fuel characteristics, and weather conditions [13]. Although effective for short-term fire behavior simulation, these models require detailed input data and are computationally intensive, limiting their use in real-time applications [14].
Remote sensing-based fire modeling approaches have been widely applied for detecting fire activity, mapping burn severity, and analyzing vegetation stress [15].
Remote sensing and GIS-based methods have expanded the capabilities of fire risk monitoring and assessment. Satellite systems like MODIS, Sentinel-2, and Landsat provide multispectral imagery for fire detection, vegetation stress analysis, and burn severity evaluation [16]. GIS platforms allow researchers to integrate spatial data layers—such as elevation, land cover, and human infrastructure—to assess fire susceptibility across regions [17]. However, these tools can be hampered by cloud cover, delayed data availability, and subjectivity in risk indicator selection.
Machine learning (ML) has become increasingly popular for wildfire prediction due to its ability to learn complex, high-dimensional relationships from diverse data sources. Supervised learning models—including Random Forest, Support Vector Machines, XGBoost, and LightGBM—have demonstrated high predictive accuracy in identifying fire-prone areas [11,17,18]. Deep learning approaches such as Convolutional Neural Networks (CNNs) have been used for image-based fire detection [19], while Recurrent Neural Networks (RNNs) with Long Short-Term Memory (LSTM) units are applied to capture temporal patterns in weather data [20]. Hybrid models that combine spatial and temporal inputs or multiple classifiers further enhance robustness and generalizability [21].
Despite their strengths, ML models face several challenges. First, the lack of real-time, high-resolution data-especially in remote regions like BC- limits model effectiveness [16]. Second, generalization across geographic regions remains an issue, as many models are tuned to specific environments and fail under new conditions [21]. Third, datasets used for wildfire prediction often suffer from severe class imbalance, where non-fire events vastly outnumber actual fire occurrences [22]. Lastly, many ML models are considered “black boxes,” offering little insight into their decision-making processes. This lack of transparency hinders their acceptance among policymakers and operational decision-makers [20].
Recent studies have attempted to overcome these challenges. Elsarrar et al. [23] used a rule-extraction neural network model for wildfire prediction in West Virginia, achieving high accuracy but with limited regional applicability. Hong et al. [21] implemented a hybrid method combining genetic algorithms with Random Forest and SVM models for fire susceptibility mapping in China, obtaining strong AUC scores but neglecting temporal dynamics. Omar [20] trained an LSTM-based model on a small Algerian dataset with high classification accuracy, though generalizability was not addressed. Bayat and Yildiz [24] compared ML models in Portugal and found SVM to perform best, while Sharma [25] identified Random Forest as the top model for Indian wildfire data. Li et al. [26] used ANN and SVM for forest fire prediction in China, finding ANN superior, though temporal components were not modeled.
Beyond conventional fire-science studies, interdisciplinary AI research has increasingly linked machine learning to broader environmental-resilience and sustainability frameworks. Olawade et al. [27] emphasized that AI-driven environmental monitoring enables proactive ecosystem management and disaster risk reduction. Camps-Valls et al. [28] demonstrated how deep learning models can detect and predict extreme climate events—including wildfires—with greater spatial precision. Forouheshfar et al. [29] discussed the integration of AI and ML into adaptive-governance structures that enhance systemic resilience to climate change, while Wu et al. [30] illustrated ML’s capability to optimize sustainability in complex systems such as green supply chains. Collectively, these interdisciplinary insights establish that wildfire prediction frameworks grounded in machine learning not only advance technical performance but also contribute to data-driven environmental governance and climate adaptation.
By synthesizing insights from climate science, AI research, and sustainable policy design, the present study situates wildfire prediction as part of a wider global effort toward resilient, adaptive, and intelligent environmental systems, offering both methodological rigor and operational value for Canadian wildfire management.
Building on these prior works, the present study introduces a localized, high-resolution dataset for British Columbia, integrates both spatial and temporal predictors, and employs a hybrid feature-selection strategy alongside Random Undersampling (RUS) to address class imbalance. The study also leverages deep learning architectures—specifically RNNs with LSTM units—to capture temporal dependencies and applies a comprehensive multi-metric evaluation framework to ensure robustness and interpretability. These contributions collectively advance the development of transparent, data-driven, and operationally scalable wildfire forecasting systems.

3. Materials and Methods

3.1. Dataset and Data Preprocessing

This study utilizes a comprehensive dataset developed specifically for wildfire prediction in British Columbia (BC), Canada. Due to the province’s ecological diversity and vulnerability to climate change, wildfires have become increasingly frequent and destructive. Constructing a high-quality dataset is thus essential for building reliable predictive models that reflect the spatial, temporal, and environmental conditions affecting fire behavior in this region [1,2,6].
The dataset combines multiple sources. Historical wildfire records were collected from the Canadian Wildland Fire Information System (CWFIS) [31] and the British Columbia Wildfire Management Branch [10]. These datasets include precise geolocation, ignition date, fire size, and cause. Meteorological data were sourced from Environment Canada [32] and Copernicus ERA5 reanalysis datasets, which offer daily values for temperature, humidity, wind speed, surface pressure, and precipitation. Global fire detection records from NASA’s Fire Information for Resource Management System (FIRMS) [7] and land cover layers from Global Forest Watch [5] were also incorporated to improve spatial completeness and validation.
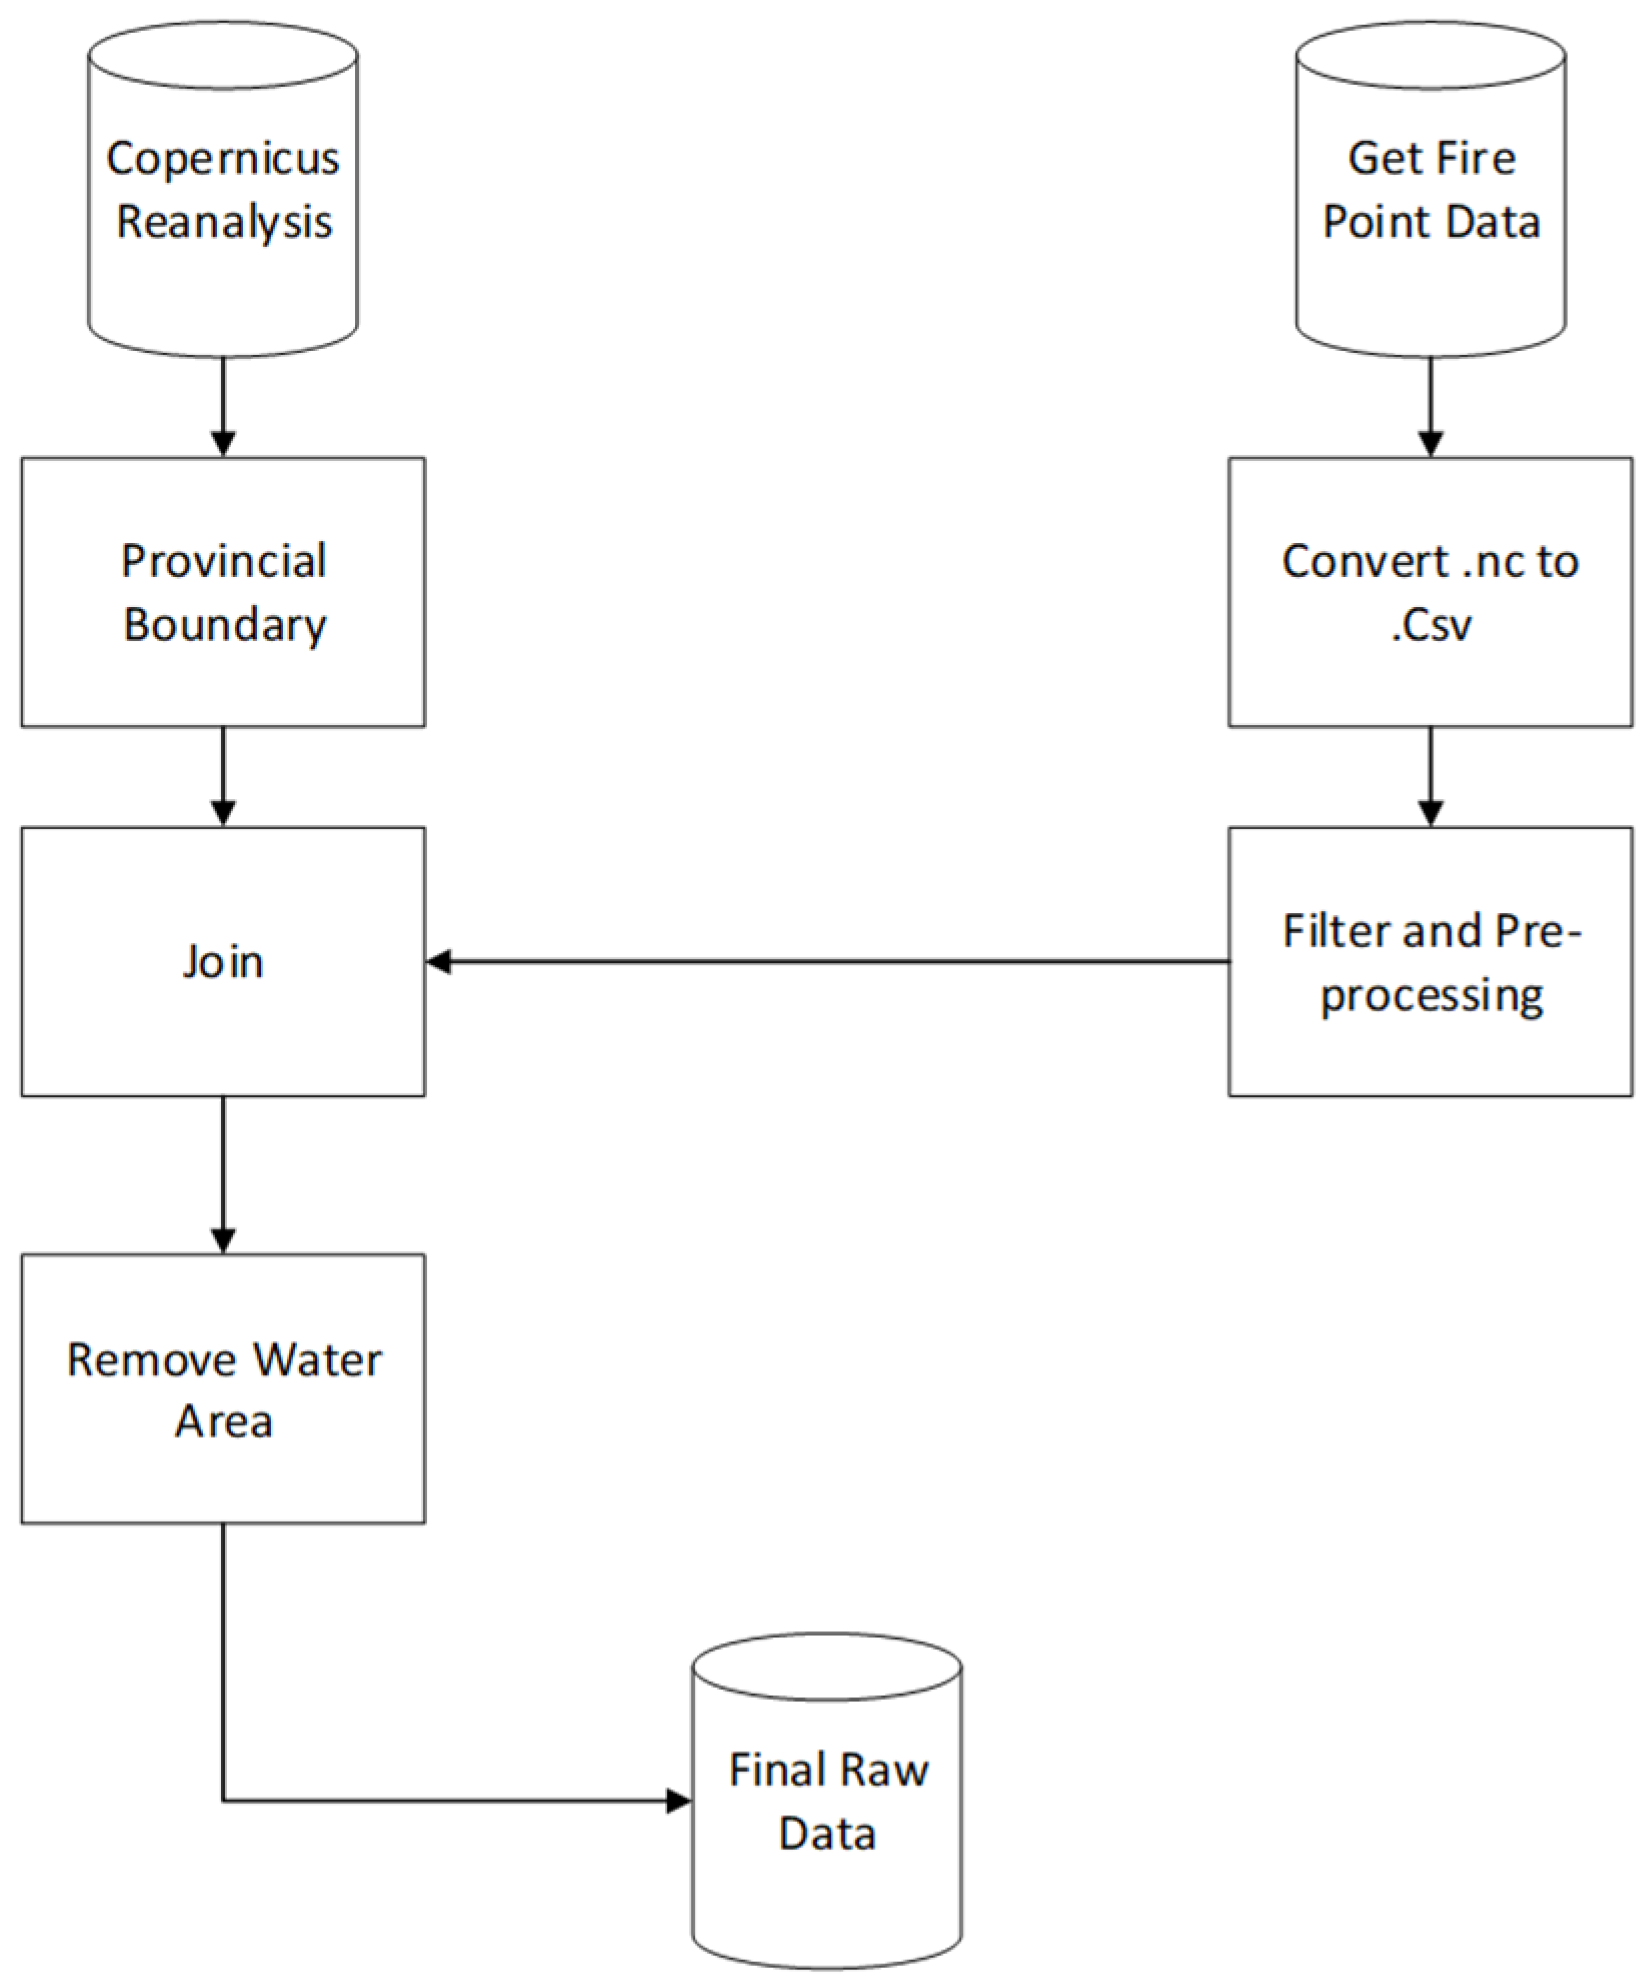
The data integration workflow is summarized in Figure 1. The process began with preprocessing of meteorological variables, which were originally stored in NetCDF format. These files were converted into CSV to facilitate data processing. Fire incident records were filtered by location and date, converted from shapefiles to structured tables, and aligned with climate data using spatial and temporal joins. A provincial boundary shapefile from Statistics Canada was applied to ensure that all observations fell within BC. Water body masks were used to remove points over lakes, rivers, and oceans, ensuring that fire labels would not be falsely assigned in non-burnable areas.
To assign binary classification labels, each spatial grid cell was labeled as ‘fire’ (1) or ‘non-fire’ (0) based on its proximity to a documented fire event on the same date. The Haversine distance formula was used to determine the proximity between ERA5 grid points and fire ignition records, ensuring accurate spatial linkage. The final dataset contains 3,631,455 rows and 148 features, covering a wide range of meteorological, geographic, and temporal variables. A summary of the overall dataset composition and its characteristics is presented in Table 1, compiled from multiple data sources including CWFIS [31], FIRMS [7], Environment Canada [32], BC Wildfire Service [10], and Global Forest Watch [5].
In addition to standard weather indicators, the dataset includes derived features such as vegetation indices, soil moisture, and evapotranspiration rates, which are important predictors of fire risk. Geospatial attributes such as latitude, longitude, and elevation add spatial context, while calendar variables such as day-of-year and seasonality help model cyclical fire behavior. This rich feature space supports the training of both conventional and deep learning models.
To enhance predictive performance and reduce overfitting, six feature selection techniques were applied independently. These included Relief, ReliefF, correlation-based filtering, recursive feature elimination (RFE), mutual information (MI), and model-based selection using Random Forest and XGBoost [18]. Each method was configured using empirically optimized parameters and applied to the complete dataset. The selected feature subsets were then used to train separate models, and the results were compared using accuracy, recall, F1-score, and ROC-AUC. The configuration settings used for each feature selection method are presented in Table 2. The parameter settings summarized in Table 2 were empirically optimized to achieve a balance between predictive accuracy and computational efficiency. For the Relief and ReliefF algorithms, the neighbor values (k = 10–20) were determined experimentally to ensure stable feature ranking while maintaining manageable runtime. The correlation threshold of ±0.8 was adopted following previous wildfire-related studies [18,22] to minimize multicollinearity without removing informative predictors. The number of selected features (30–60) was tuned to capture the most relevant meteorological and geospatial variables while preventing model overfitting. These parameter choices were validated across multiple random splits to ensure consistency.
To provide further insight into the behavior of each method, a qualitative comparison of their strengths, selection strategies, and motivation is included in Table 3. This comparison helped guide the selection of the most effective combinations of feature selection and modeling techniques for wildfire classification.
A major challenge in wildfire prediction is the severe class imbalance between fire and non-fire observations. In this dataset, the overwhelming majority of records were labeled as non-fire. To mitigate bias toward the dominant class, Random Undersampling (RUS) was applied. RUS randomly discards a portion of the majority class to equalize class frequencies, resulting in a balanced dataset. While alternative strategies such as SMOTE and SMOTE-ENN were considered, memory and runtime limitations in the Google Colab environment necessitated the use of a more efficient method [22].
Despite its simplicity, RUS significantly improved model sensitivity and reduced training time. However, it carries the trade-off of discarding potentially informative samples, which may affect generalization. Given these constraints, RUS was adopted as a practical balancing strategy for all models developed in this study.

3.2. Methodology

This study proposes a comprehensive methodology for wildfire occurrence prediction in British Columbia, using a combination of advanced machine learning (ML) and deep learning (DL) models. The growing frequency and severity of wildfires, exacerbated by climate change and human interventions [1,2], necessitate the development of predictive systems capable of modeling complex environmental interactions. Building upon the dataset described in the previous section, this framework incorporates stages of feature selection, class balancing, model training, and multi-metric evaluation.
Feature selection was conducted using a hybrid approach that combined filter-based methods such as ReliefF and correlation analysis, wrapper-based techniques like recursive feature elimination, and embedded approaches based on model-driven importance ranking [16,22]. Class imbalance, a known challenge in wildfire datasets, was addressed using Random Undersampling (RUS), which reduced the dominance of non-fire instances while preserving the integrity of test sets [11].
A variety of classifiers were evaluated, including ensemble models -Random Forest, XGBoost, LightGBM, and CatBoost-due to their proven robustness on structured environmental datasets [18,22]. In addition, a temporal deep learning architecture based on Recurrent Neural Networks (RNN) with Long Short-Term Memory (LSTM) units was incorporated to capture sequential weather patterns and improve modeling of time-dependent fire dynamics [3].
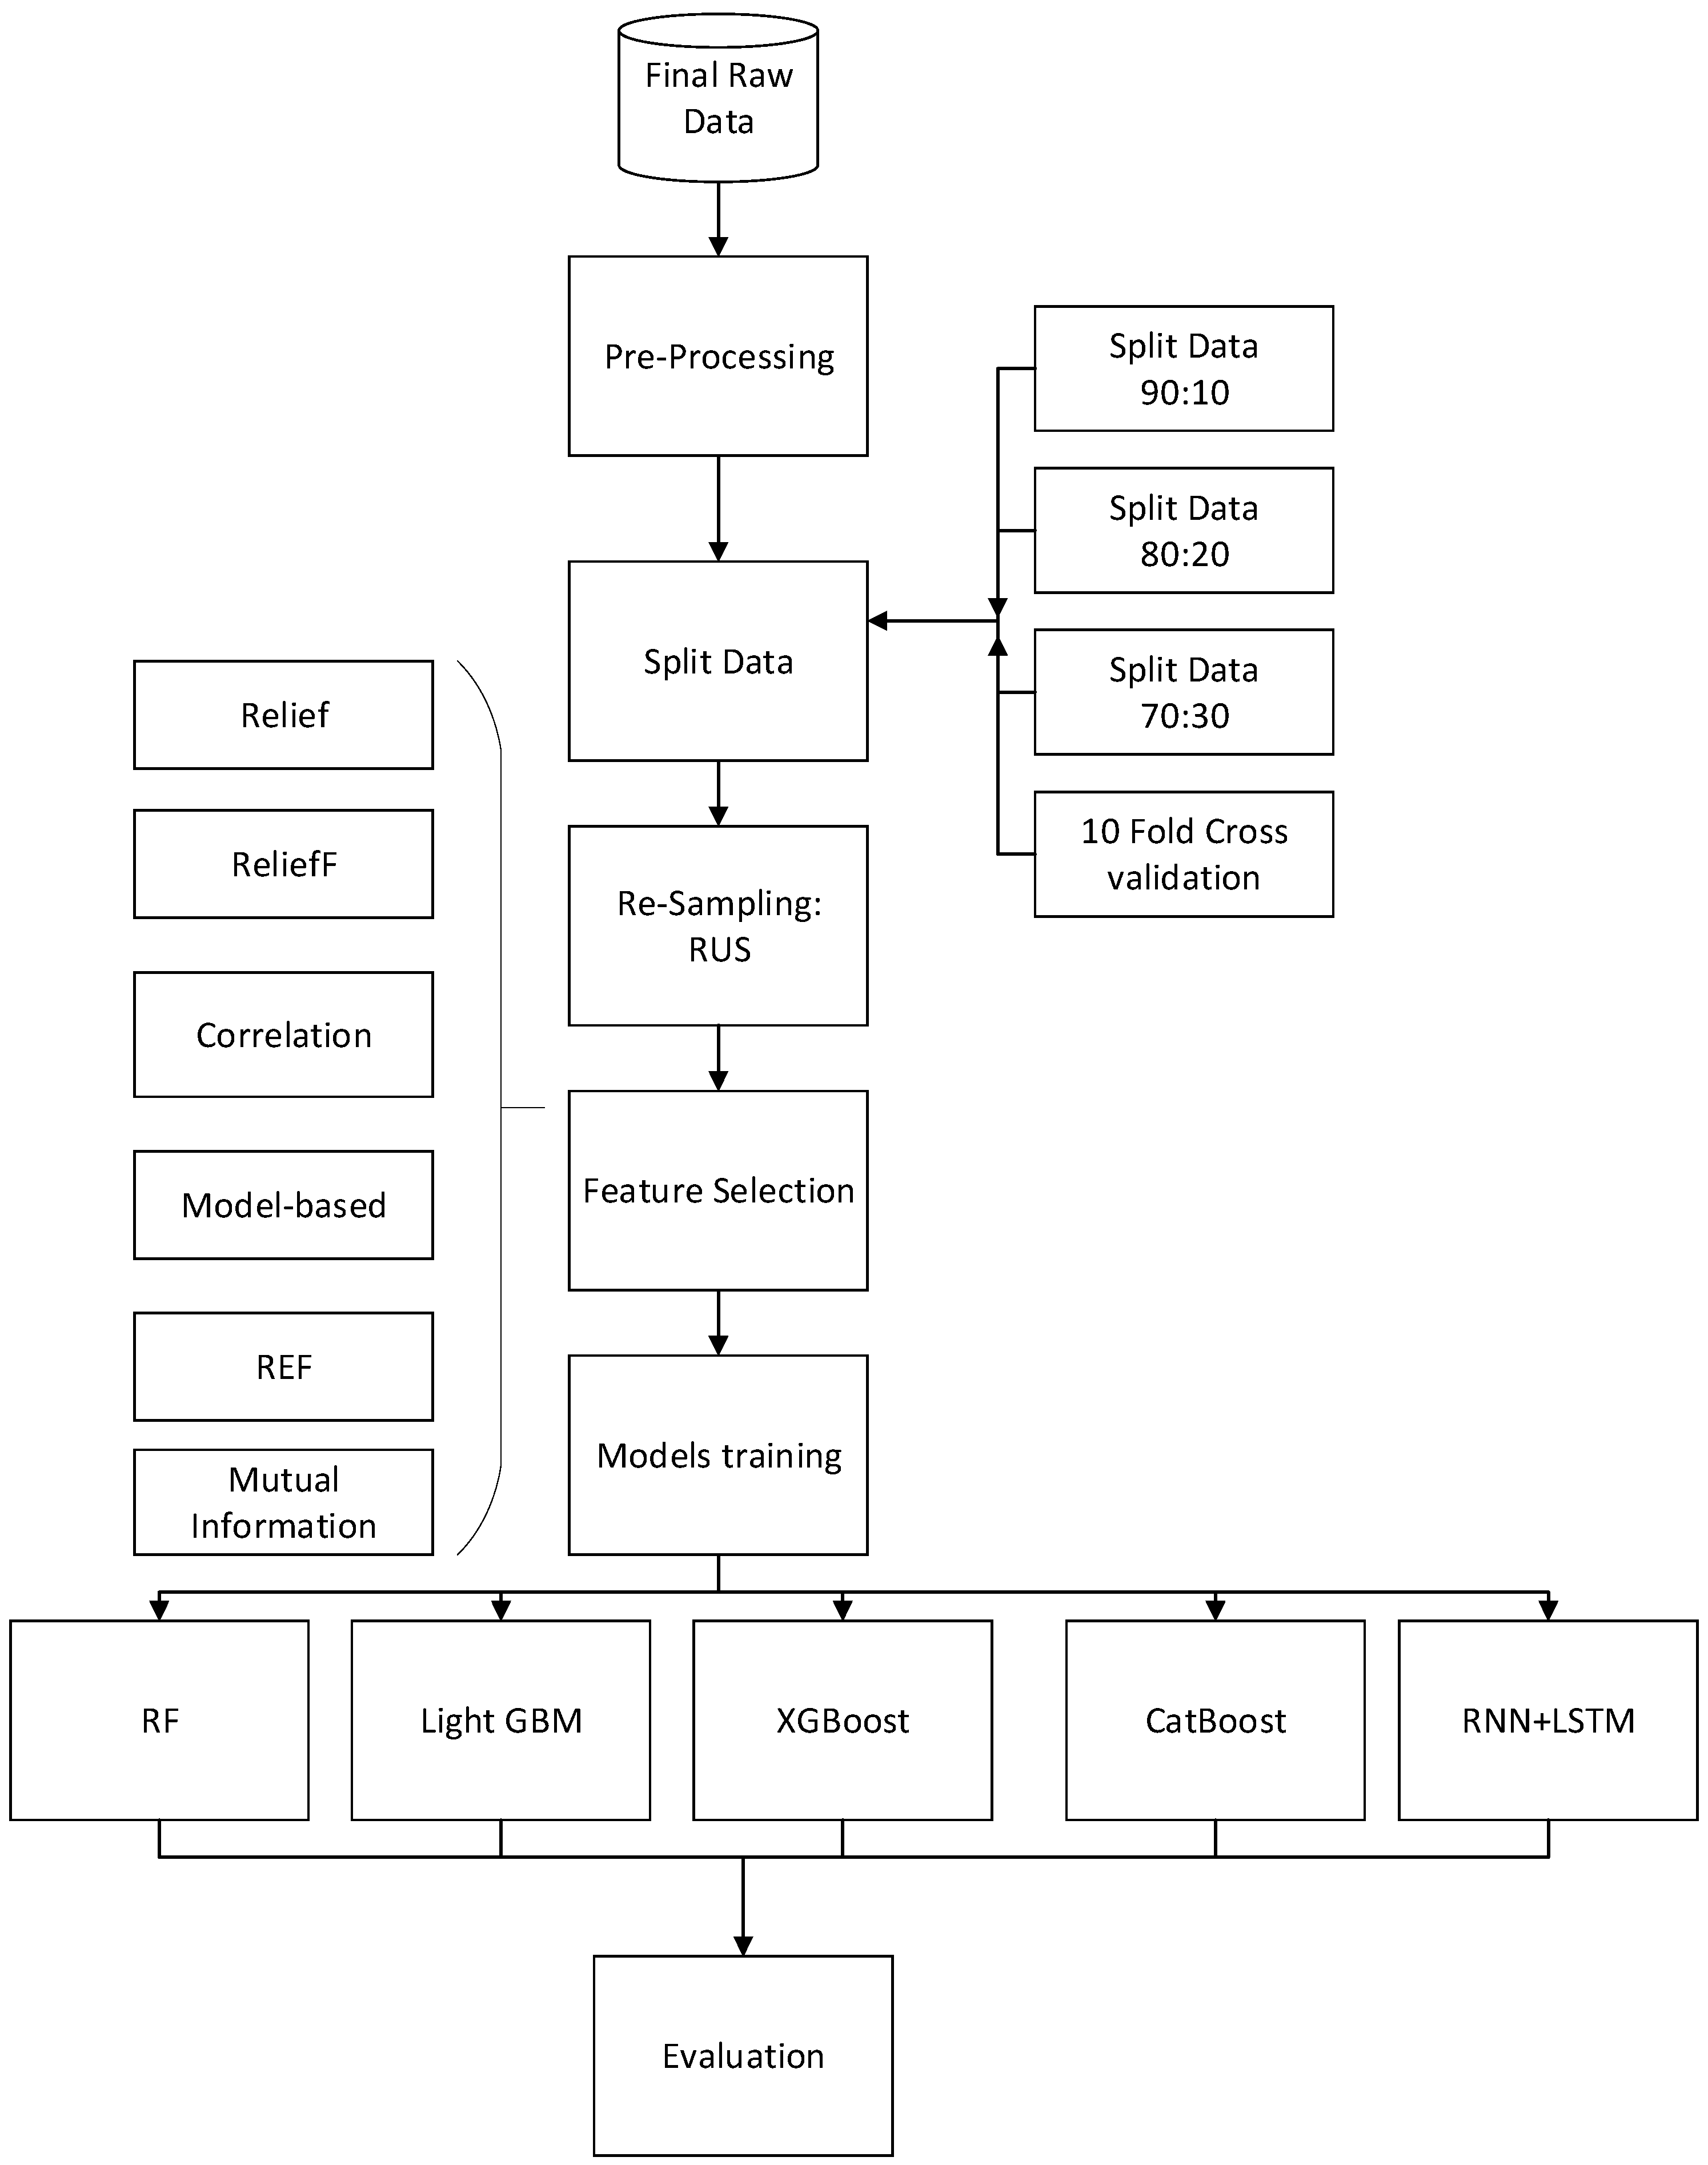
The complete modeling pipeline is illustrated in Figure 2. It begins with preprocessing and balancing the training data using RUS, followed by normalization via Min-Max scaling applied solely to the training data and later used to transform the test data, thereby preventing data leakage. Three different train–test split ratios were tested—90:10, 80:20, and 70:30—as well as 10-fold cross-validation, ensuring model robustness and generalizability. These evaluation strategies allowed a comparative assessment under varying training scenarios.
Hyperparameters for each model were selected based on empirical tuning, prior literature, and framework-specific best practices. These configurations are summarized in Table 4. For Random Forest, XGBoost, LightGBM, and CatBoost, parameters such as number of trees, learning rates, and maximum depth were adjusted for optimal performance. For RNN + LSTM, parameters included the number of LSTM units, hidden layers, optimizer type, and training epochs.
All hyperparameters in Table 4 were tuned via grid search with five-fold cross-validation on the balanced training set, optimizing primarily F1 and AUC to reflect minority-class detectability. We constrained the search to configurations that remain computationally feasible for near–real-time use. For Random Forest, n_estimators = 100 provided stable estimates while keeping inference latency low; max_depth = 10 limited variance and prevented overfitting on highly correlated meteorological features; min_samples_split = 2 preserved tree diversity after balancing.
For XGBoost, a conservative learning_rate = 0.1 with n_estimators = 200 achieved strong AUC without excessive training time. max_depth = 6 balanced non-linear expressiveness with generalization; subsample = 0.8 and colsample_bytree = 0.8 injected stochasticity to reduce overfitting and improve robustness across spatial–temporal splits. Early stopping on validation AUC was applied during tuning. For CatBoost, iterations = 500 and learning_rate = 0.05 yielded the best bias–variance trade-off; depth = 6 controlled model complexity on tabular data with mixed feature interactions. The Logloss objective aligns with binary classification while permitting calibrated probabilities used downstream in threshold analysis. For LightGBM, num_leaves = 200 allowed finer partitioning than max_depth while exploiting histogram-based splits; learning_rate = 0.05 and n_estimators = 100 stabilized training and reduced overfitting under early stopping. For RNN + LSTM, two hidden layers with 64 units each were sufficient to capture intra-seasonal dynamics (multi-day lags) without over-parameterization. We used Adam with learning_rate = 0.001 for stable optimization across heterogeneous scales, batch size = 128 for efficient GPU utilization, and 20 epochs based on validation loss saturation; longer training offered negligible gains but increased variance.
These settings were validated across random, temporal (train: earlier seasons; test: later seasons), and cross-regional splits, and consistently delivered strong F1/AUC with manageable runtime and memory footprints suitable for operational wildfire-risk workflows.
Among the machine learning models, Random Forest provided a reliable baseline due to its capacity for handling high-dimensional data and resistance to overfitting [17,18]. XGBoost, using gradient boosting with regularization and second-order optimization, offered strong performance by sequentially minimizing prediction error through additive tree construction [21,23]. CatBoost, with its native handling of categorical data and ordered boosting mechanism, provided efficiency and resilience to overfitting even in mostly numerical datasets [20]. LightGBM, known for its leaf-wise tree growth and histogram-based feature splitting, exhibited rapid training times and high predictive accuracy, particularly suitable for high-dimensional, imbalanced data [24].
The RNN + LSTM architecture enabled temporal modeling by ingesting sequences of meteorological data, learning dependencies across time, and producing predictions based on historical patterns. This architecture was especially effective for detecting wildfire onset driven by evolving climatic conditions [25,26].
Model performance was evaluated using five complementary metrics: accuracy, recall (sensitivity), specificity, weighted F1-score, and ROC-AUC. Accuracy provided an overall measure of correctness but could be misleading in imbalanced datasets. Recall focused on the model’s ability to correctly detect fire events, whereas specificity assessed false-positive reduction. The F1-score balanced precision and recall, and ROC-AUC captured class separability across decision thresholds. These evaluation metrics allowed for a holistic comparison and supported the selection of the most suitable model for real-world wildfire forecasting.
In conclusion, the methodology integrated robust data preparation, balanced model training, and multi-metric evaluation to ensure generalizable and interpretable predictions. This framework forms the foundation for experimental results and discussion presented in the following chapter.

4. Results

This section presents a detailed evaluation of the machine learning and deep learning models developed for wildfire prediction in British Columbia. The analysis spans multiple experimental setups, including various train–test splits (90:10, 80:20, 70:30), six feature selection techniques, and 10-fold cross-validation. Performance metrics—accuracy, recall, precision, F1 score, and ROC-AUC—were used to assess and compare model behavior under different conditions.
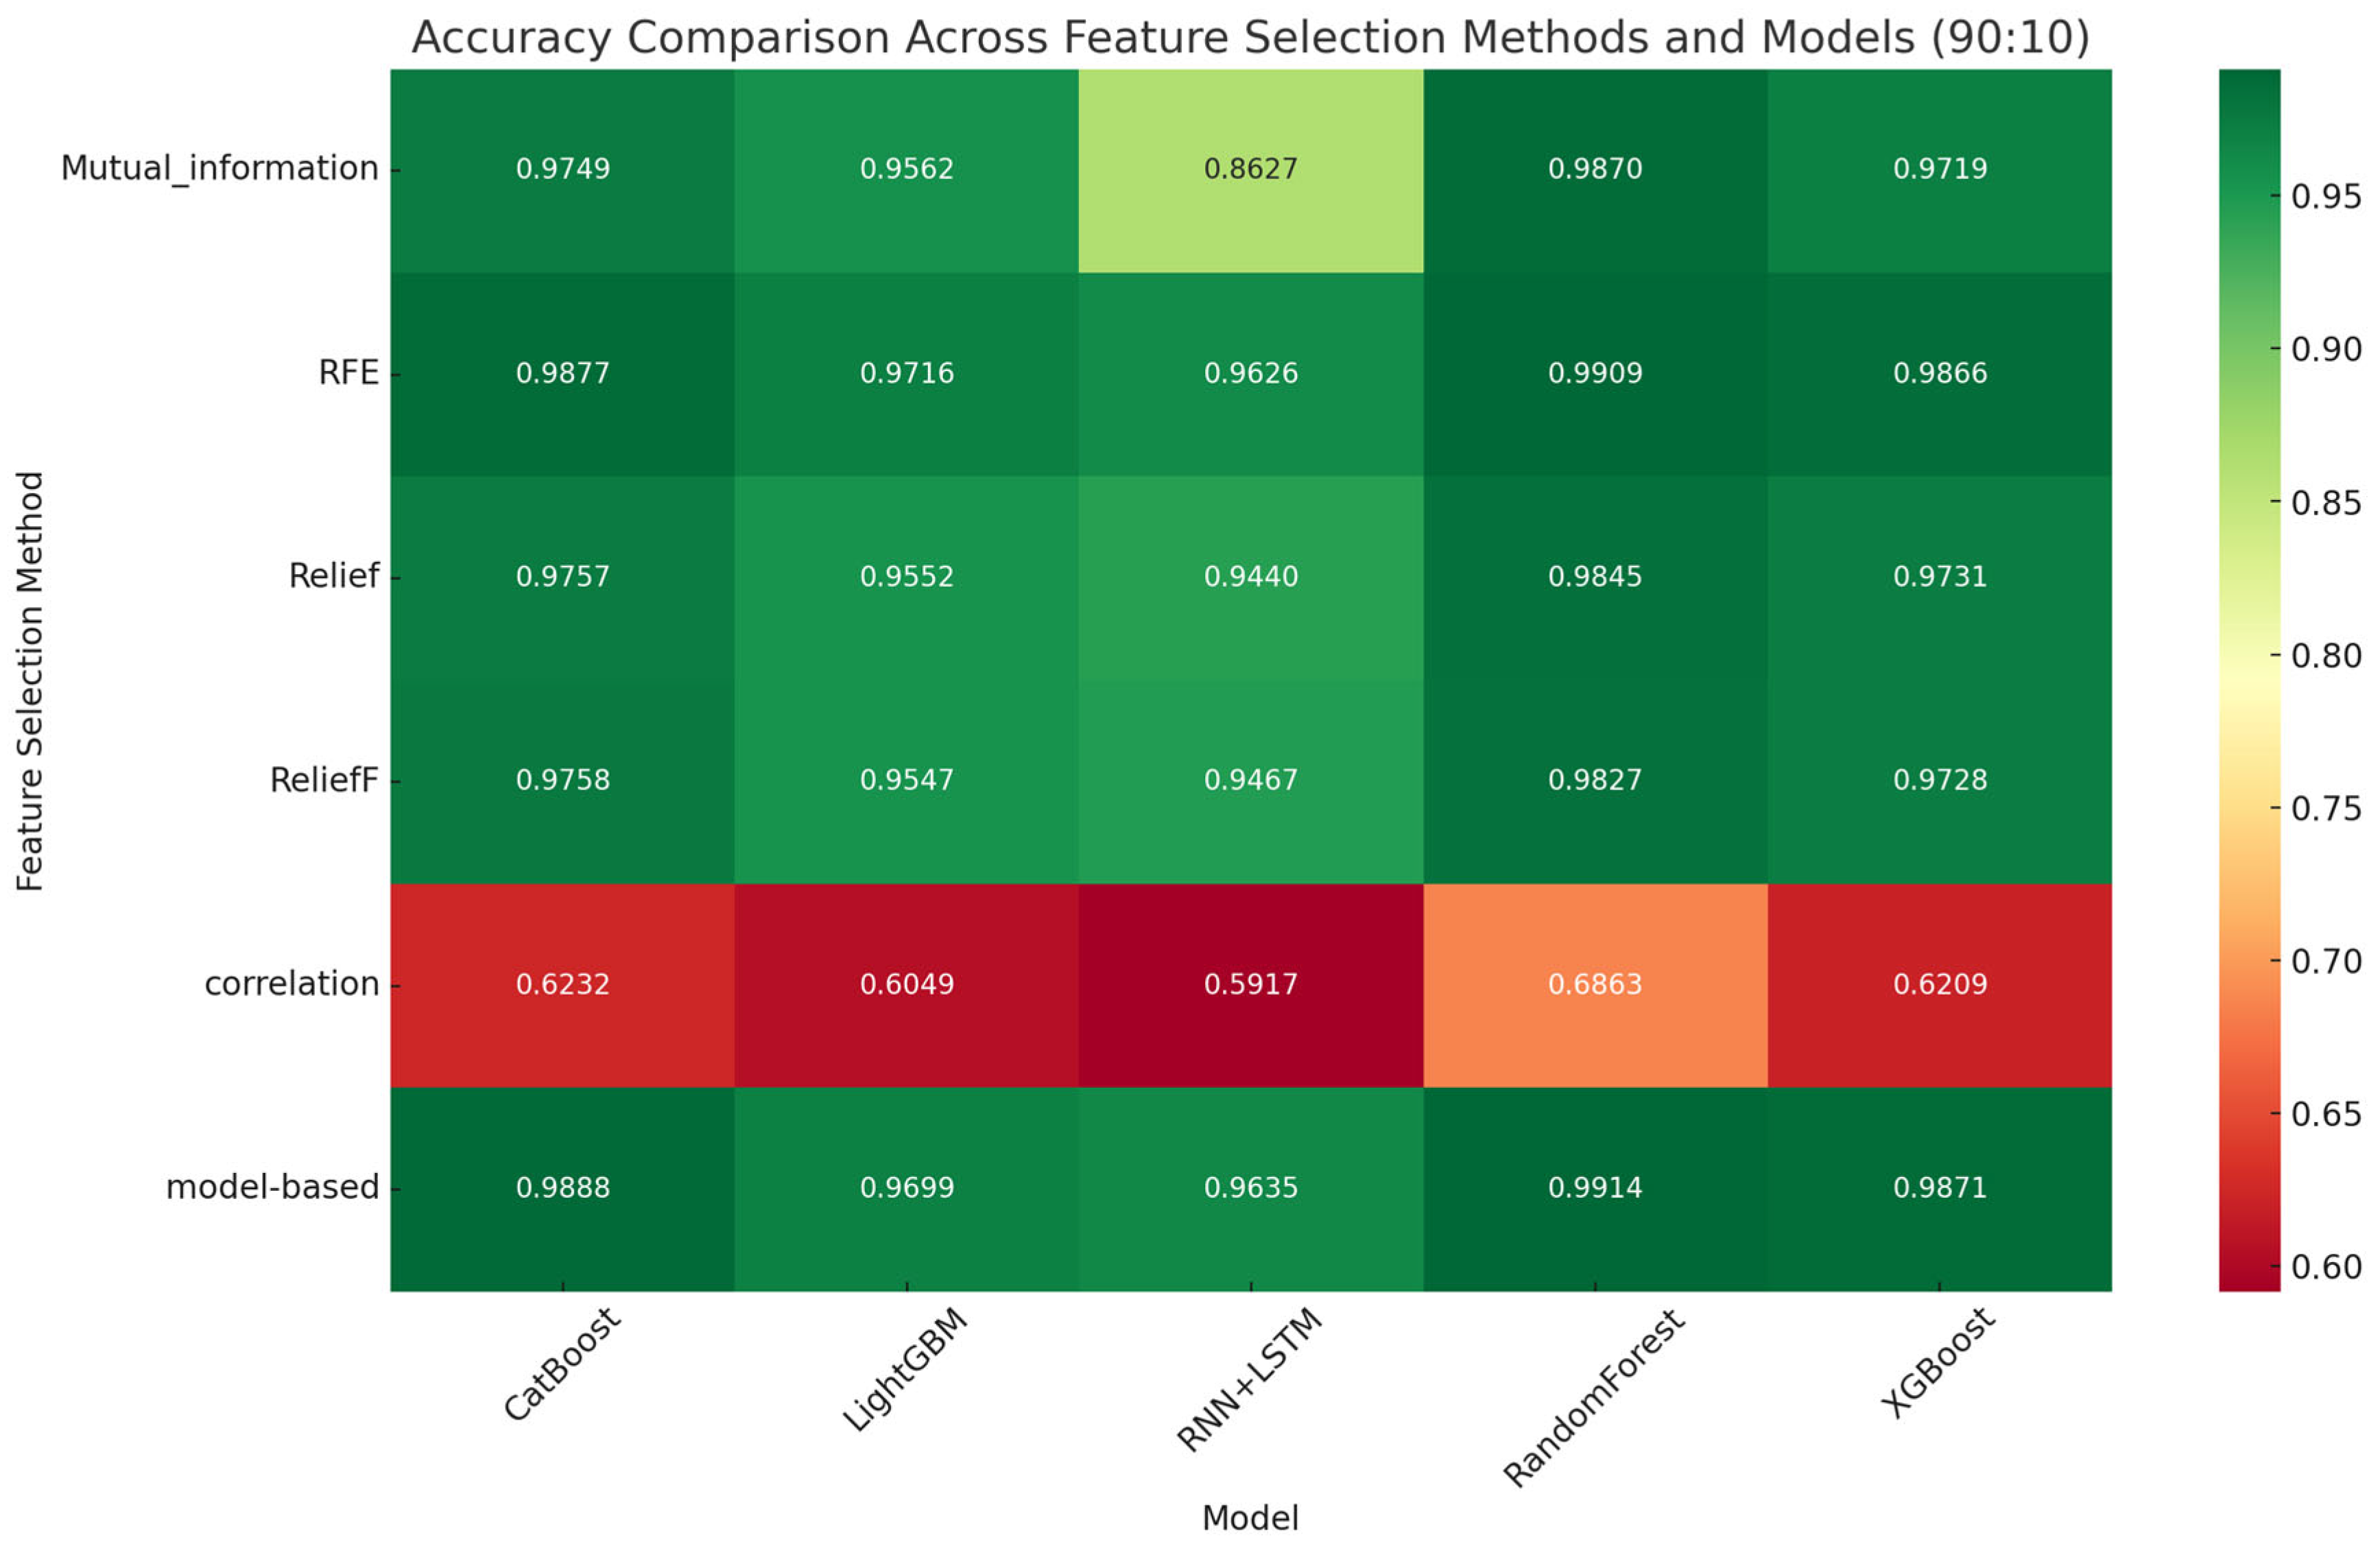
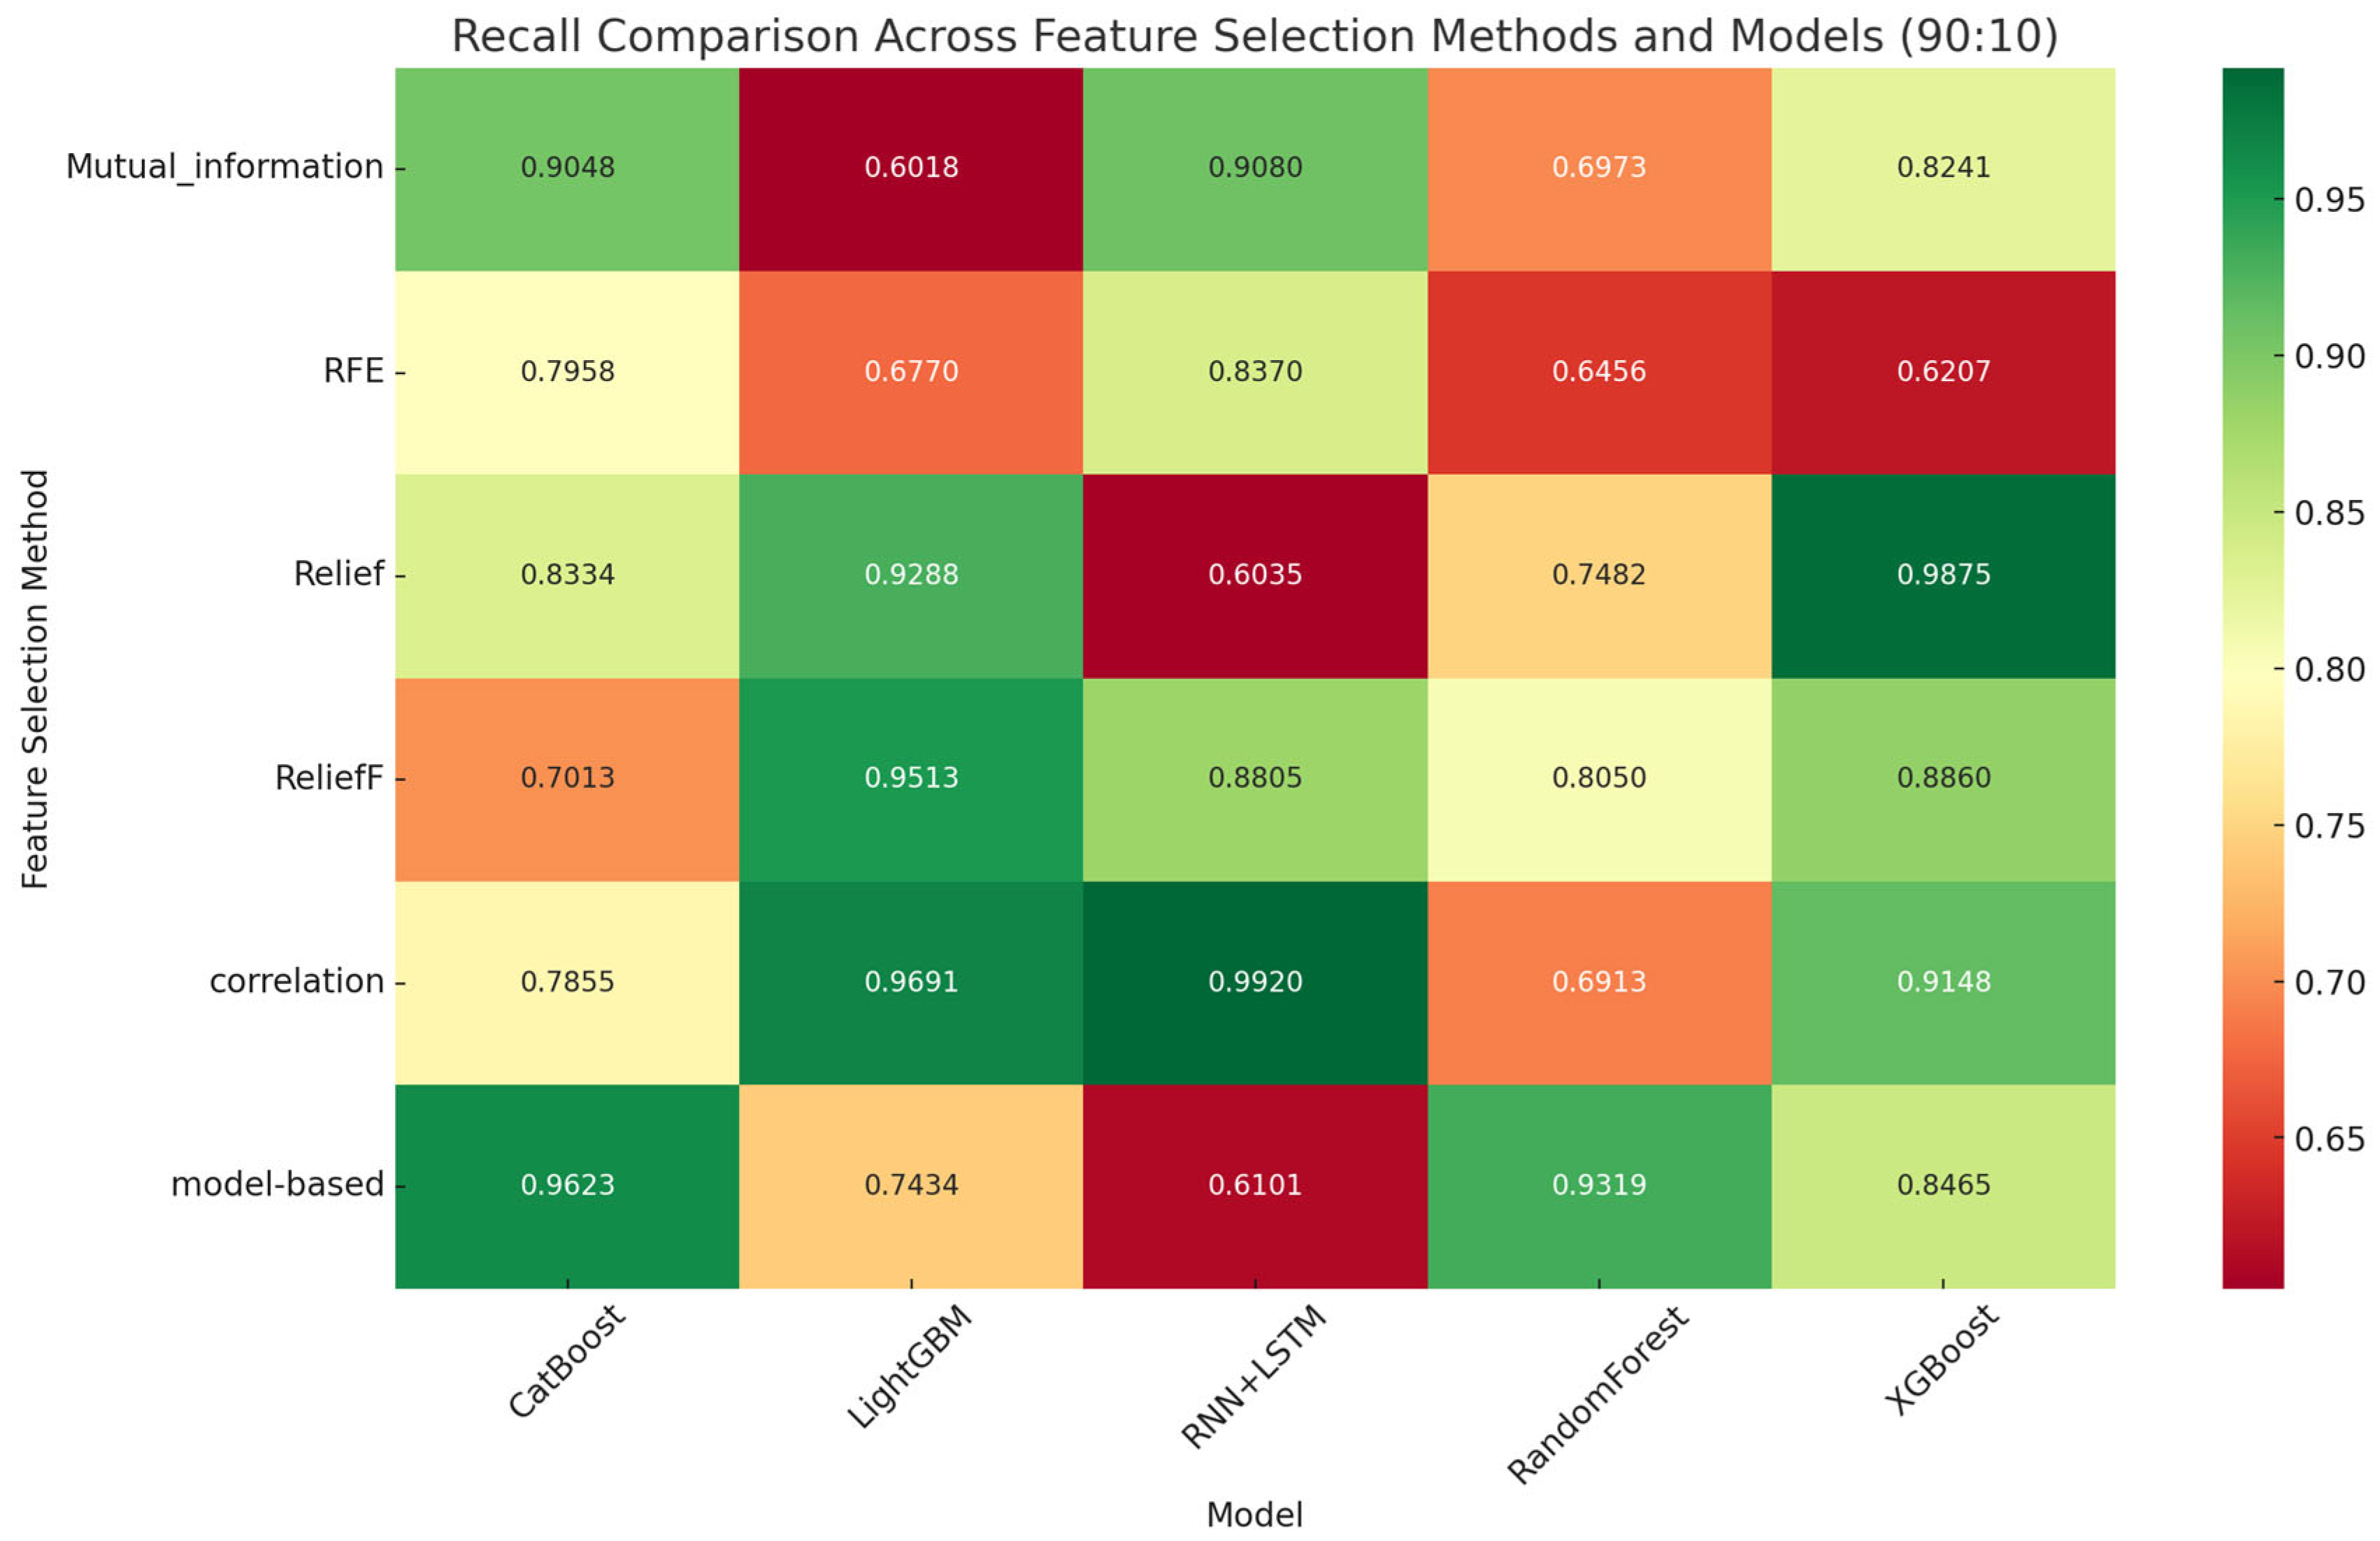
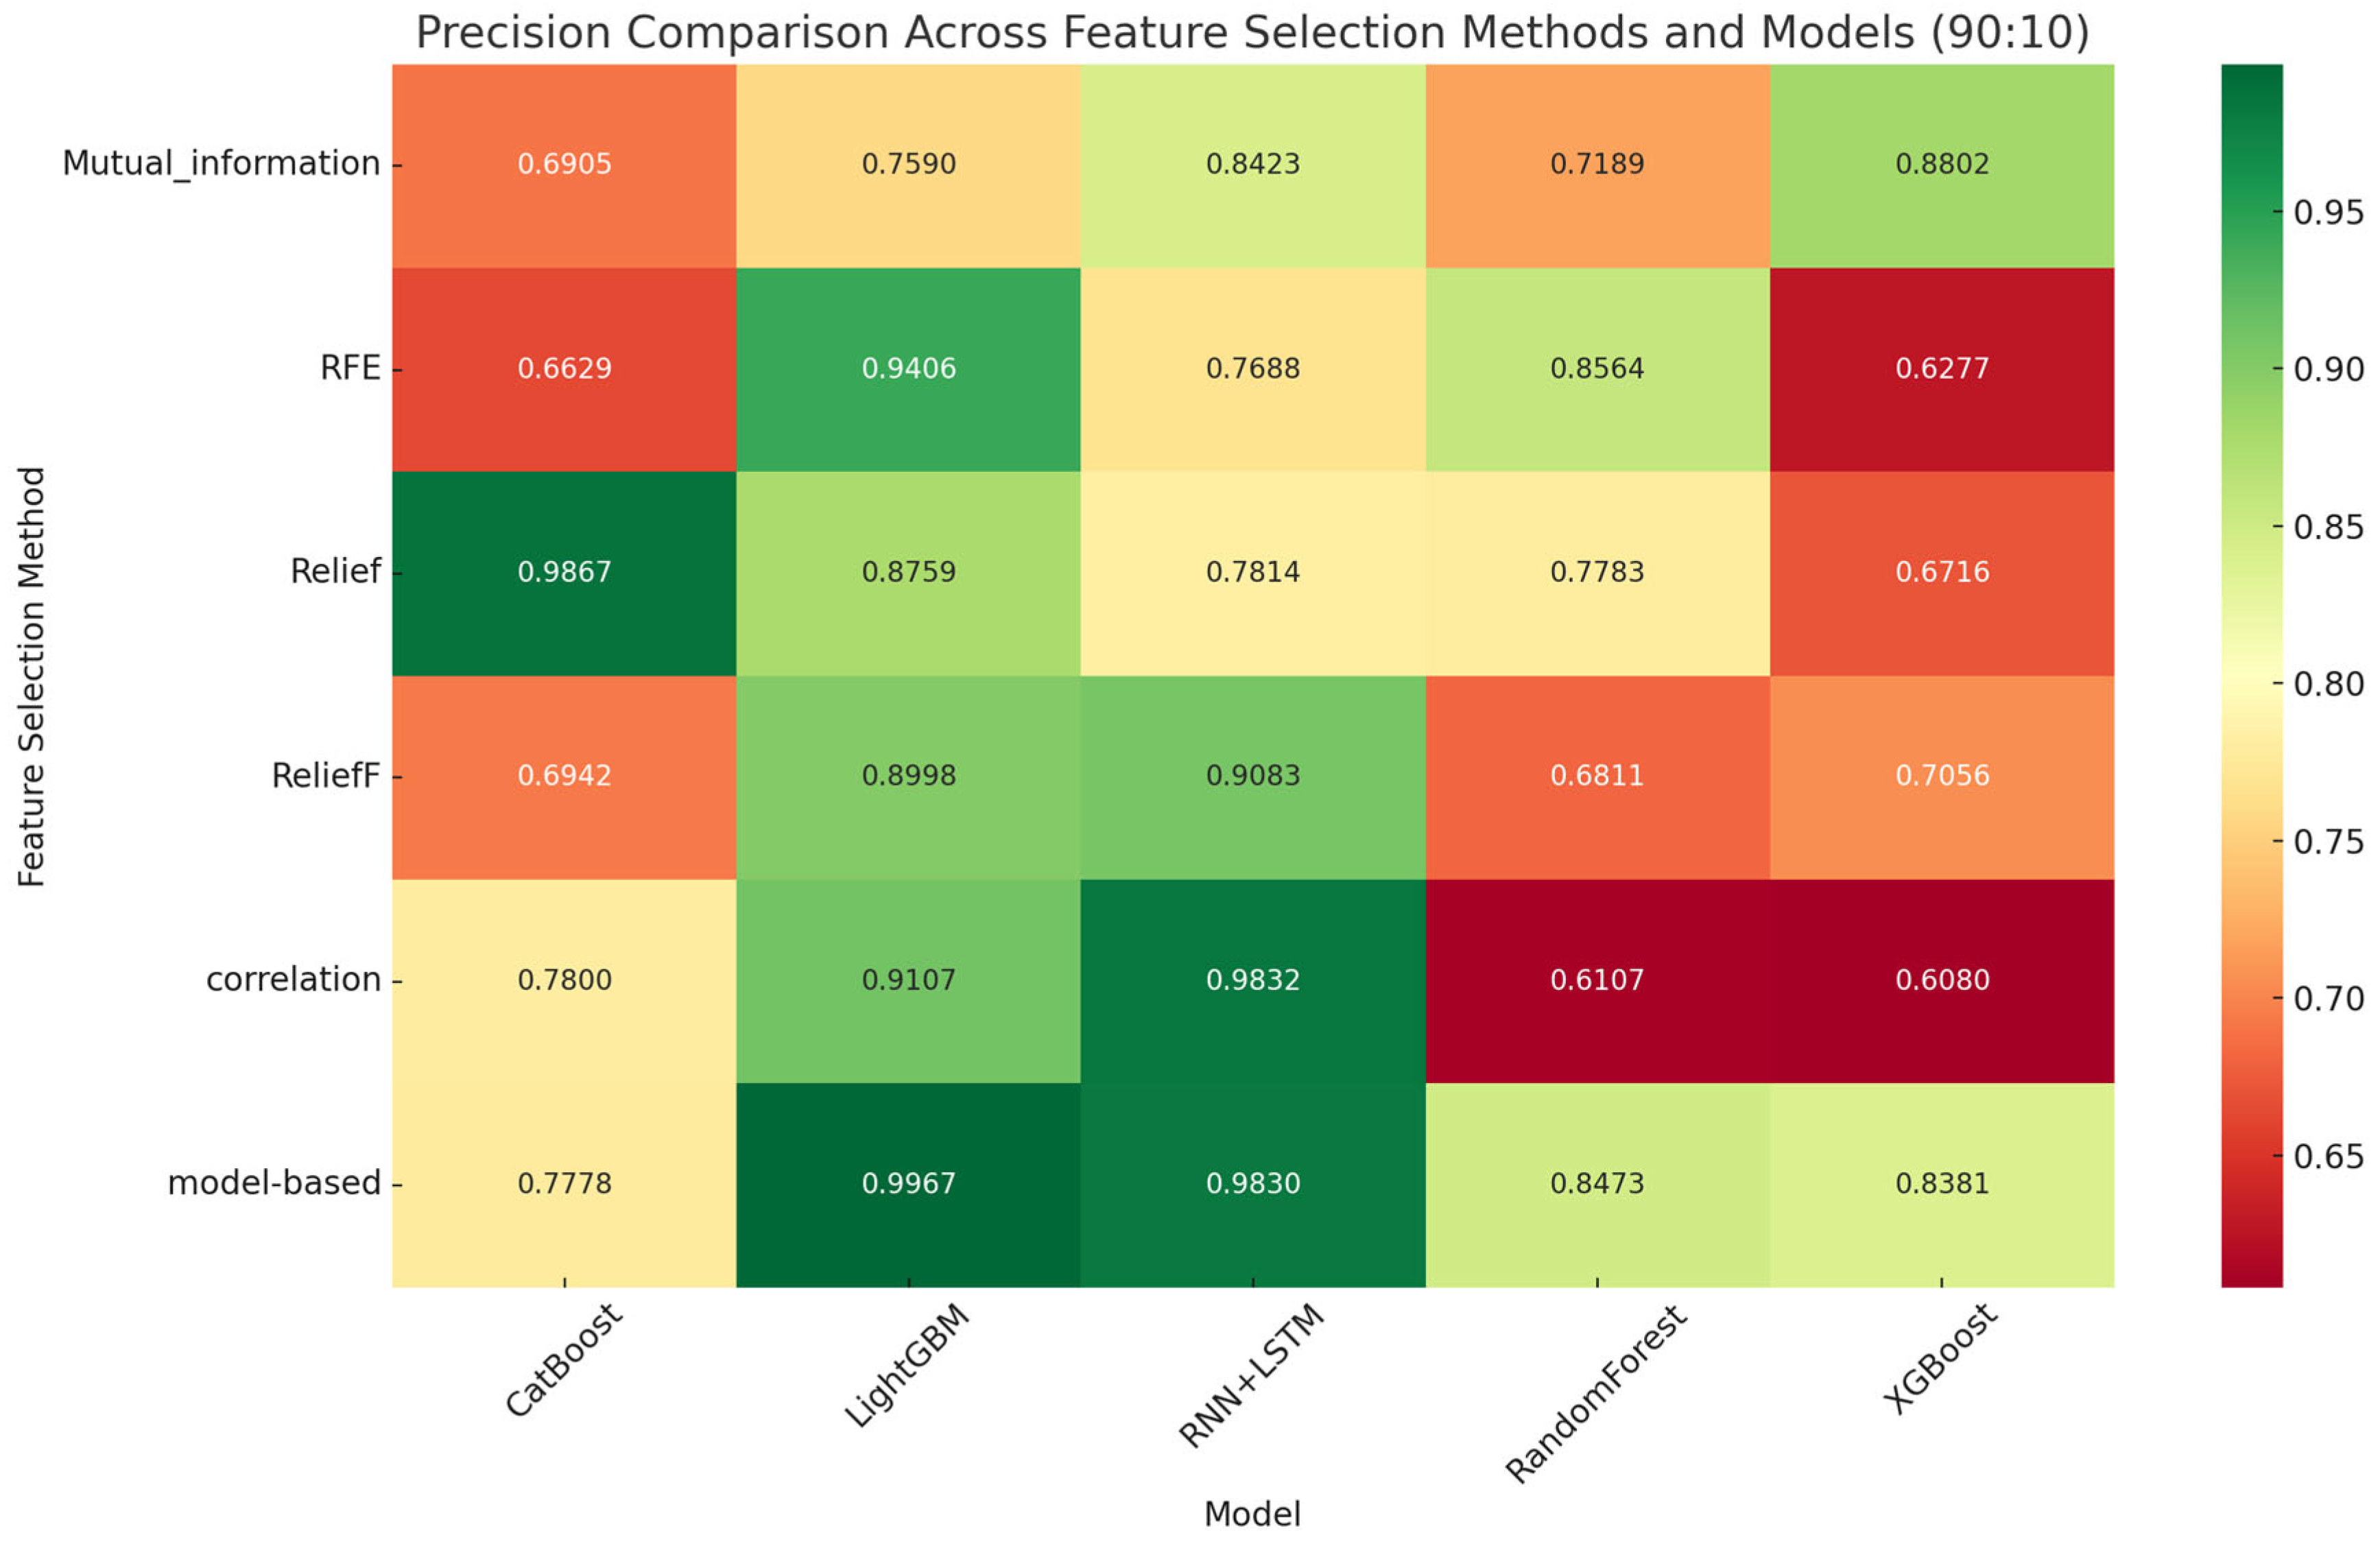
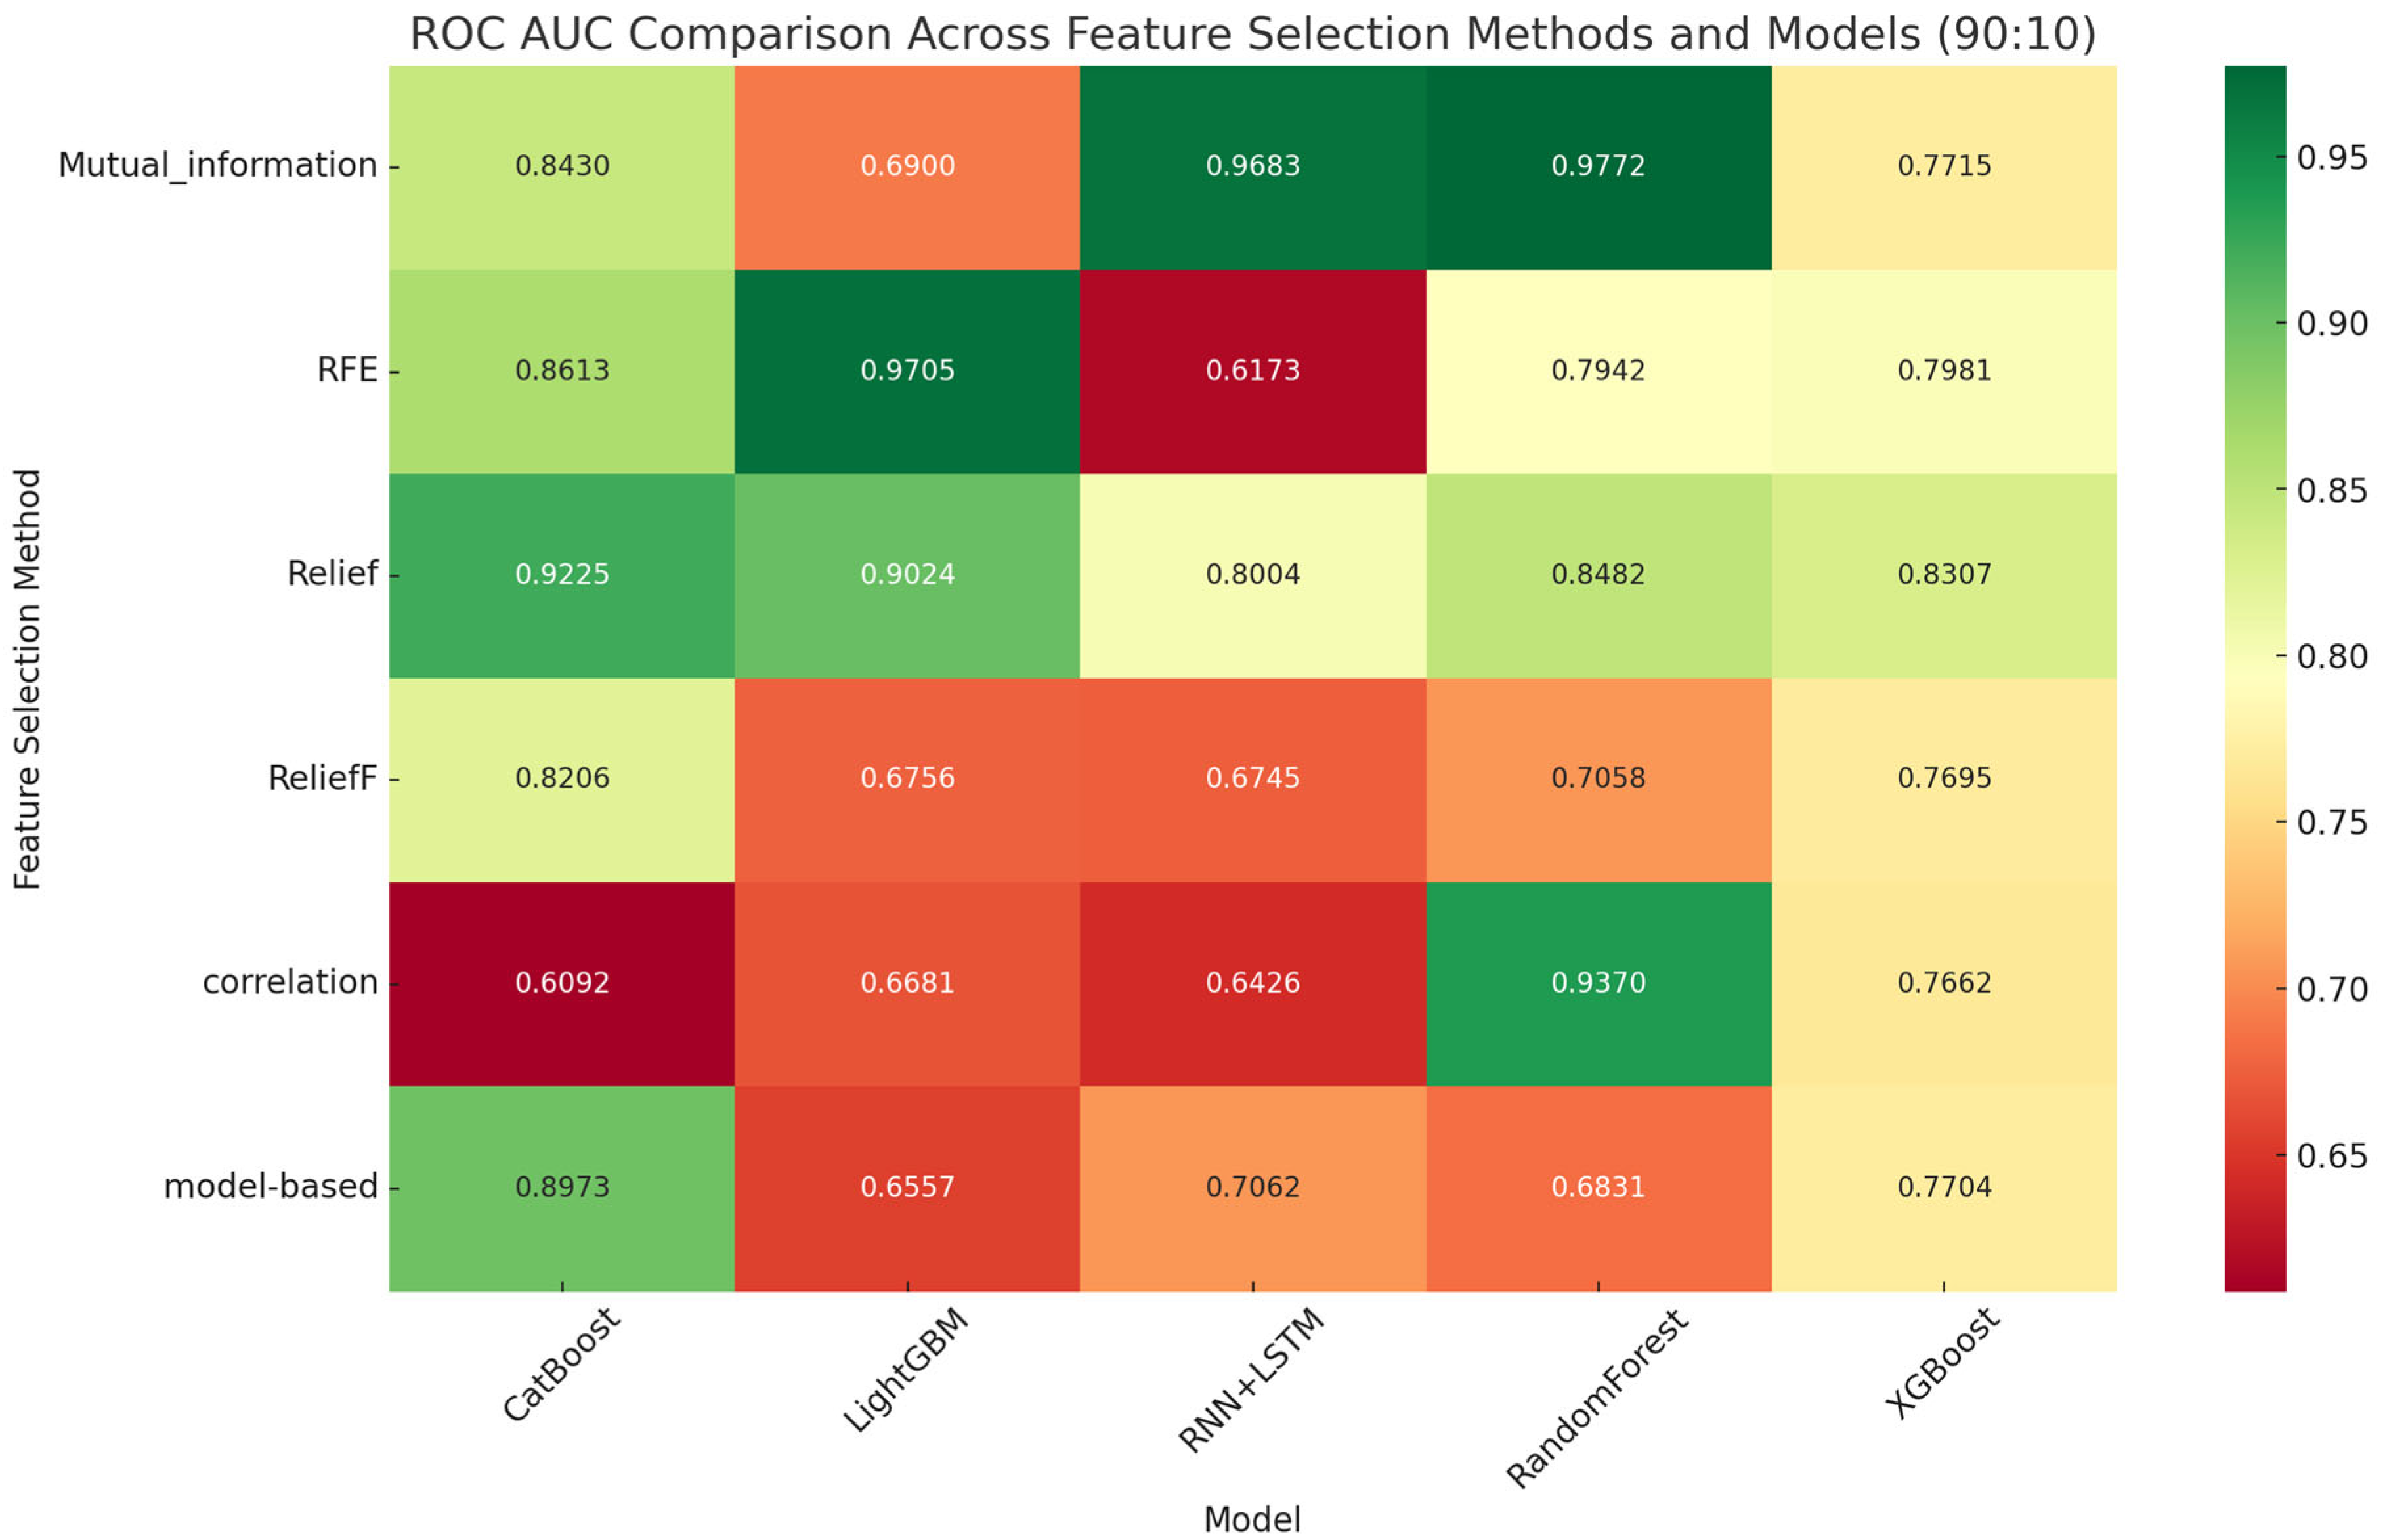
The evaluation began with performance analysis under the 90:10 train–test split. This configuration, providing the largest training data volume, enabled high predictive performance across most models. As detailed in Table 5 and visualized in Figure 3, Figure 4, Figure 5, Figure 6 and Figure 7, XGBoost combined with Relief achieved the highest F1 score (0.997), while RNN + LSTM paired with correlation-based features yielded the best recall (0.992). CatBoost and Random Forest also demonstrated strong results, particularly with model-based feature selection, reflecting a good balance between precision and sensitivity. LightGBM showed excellent precision in several scenarios but occasionally lagged in recall, suggesting limited effectiveness in identifying rare fire events.
Table 5 presents the complete numerical performance metrics (Accuracy, Precision, Recall, F1-Score, and ROC-AUC) for all evaluated models under the 90:10 train–test split. These values allow direct quantitative comparison of algorithms.
In contrast, Figure 3, Figure 4, Figure 5, Figure 6 and Figure 7 provide complementary visual analyses: Figure 3 compares accuracy distributions, Figure 4 displays ROC curves and AUC behavior, Figure 5 illustrates confusion matrices highlighting false negatives and false positives, and Figure 6 and Figure 7 summarize feature importance and cross-model comparison. Together, these visualizations enhance interpretability beyond the numeric metrics summarized in Table 5.
Under the 80:20 split (Table 6), performance slightly declined due to reduced training data. Nonetheless, Random Forest and CatBoost maintained their lead, with Random Forest achieving 0.9897 accuracy (with RFE) and CatBoost reaching 0.9866 (model-based). XGBoost with ReliefF recorded an impressive F1 score of 0.958, confirming its stability across splits.
The AUC performance of all models under the 80:20 train–test split is illustrated in Figure 8.
The most challenging configuration, the 70:30 split, provided further insight into model resilience (Table 7). Random Forest again delivered strong performance with 0.9894 accuracy and 0.984 F1 score (model-based). XGBoost excelled in recall (0.992) with Relief, while CatBoost remained competitive with multiple feature selectors. Deep learning, particularly RNN + LSTM, showed performance improvements under ReliefF and correlation-based features but remained sensitive to feature subset quality.
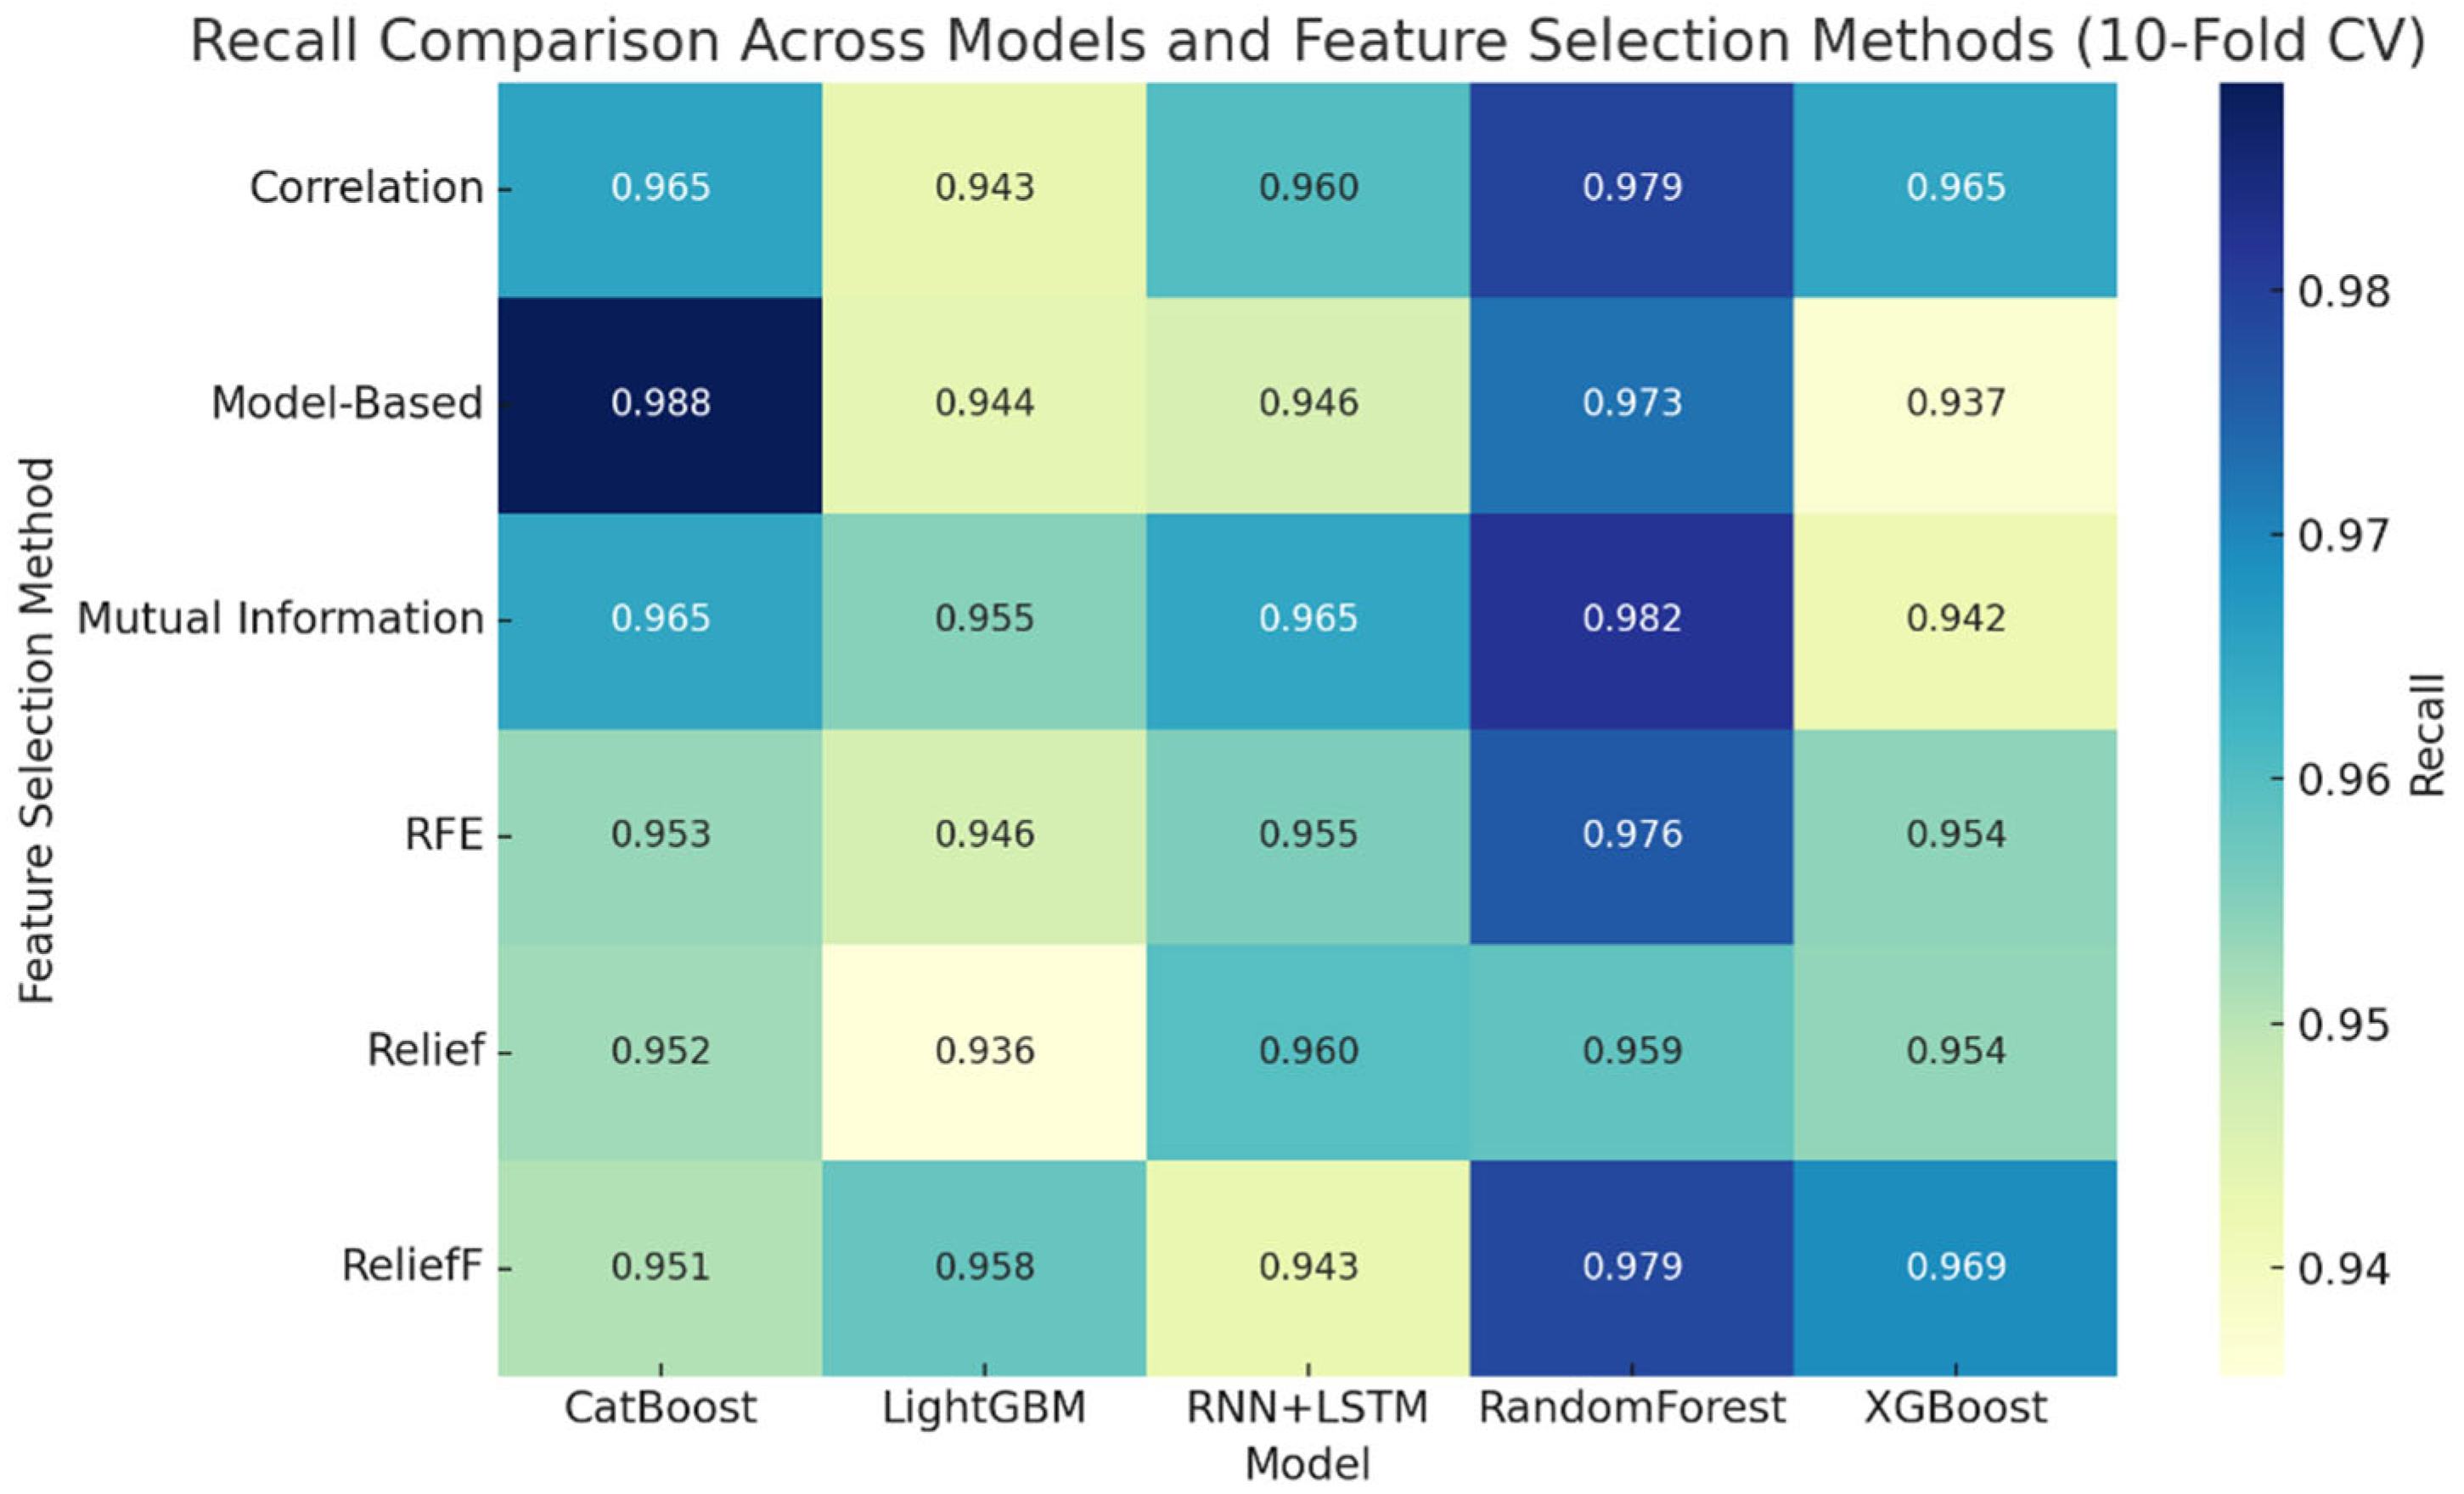
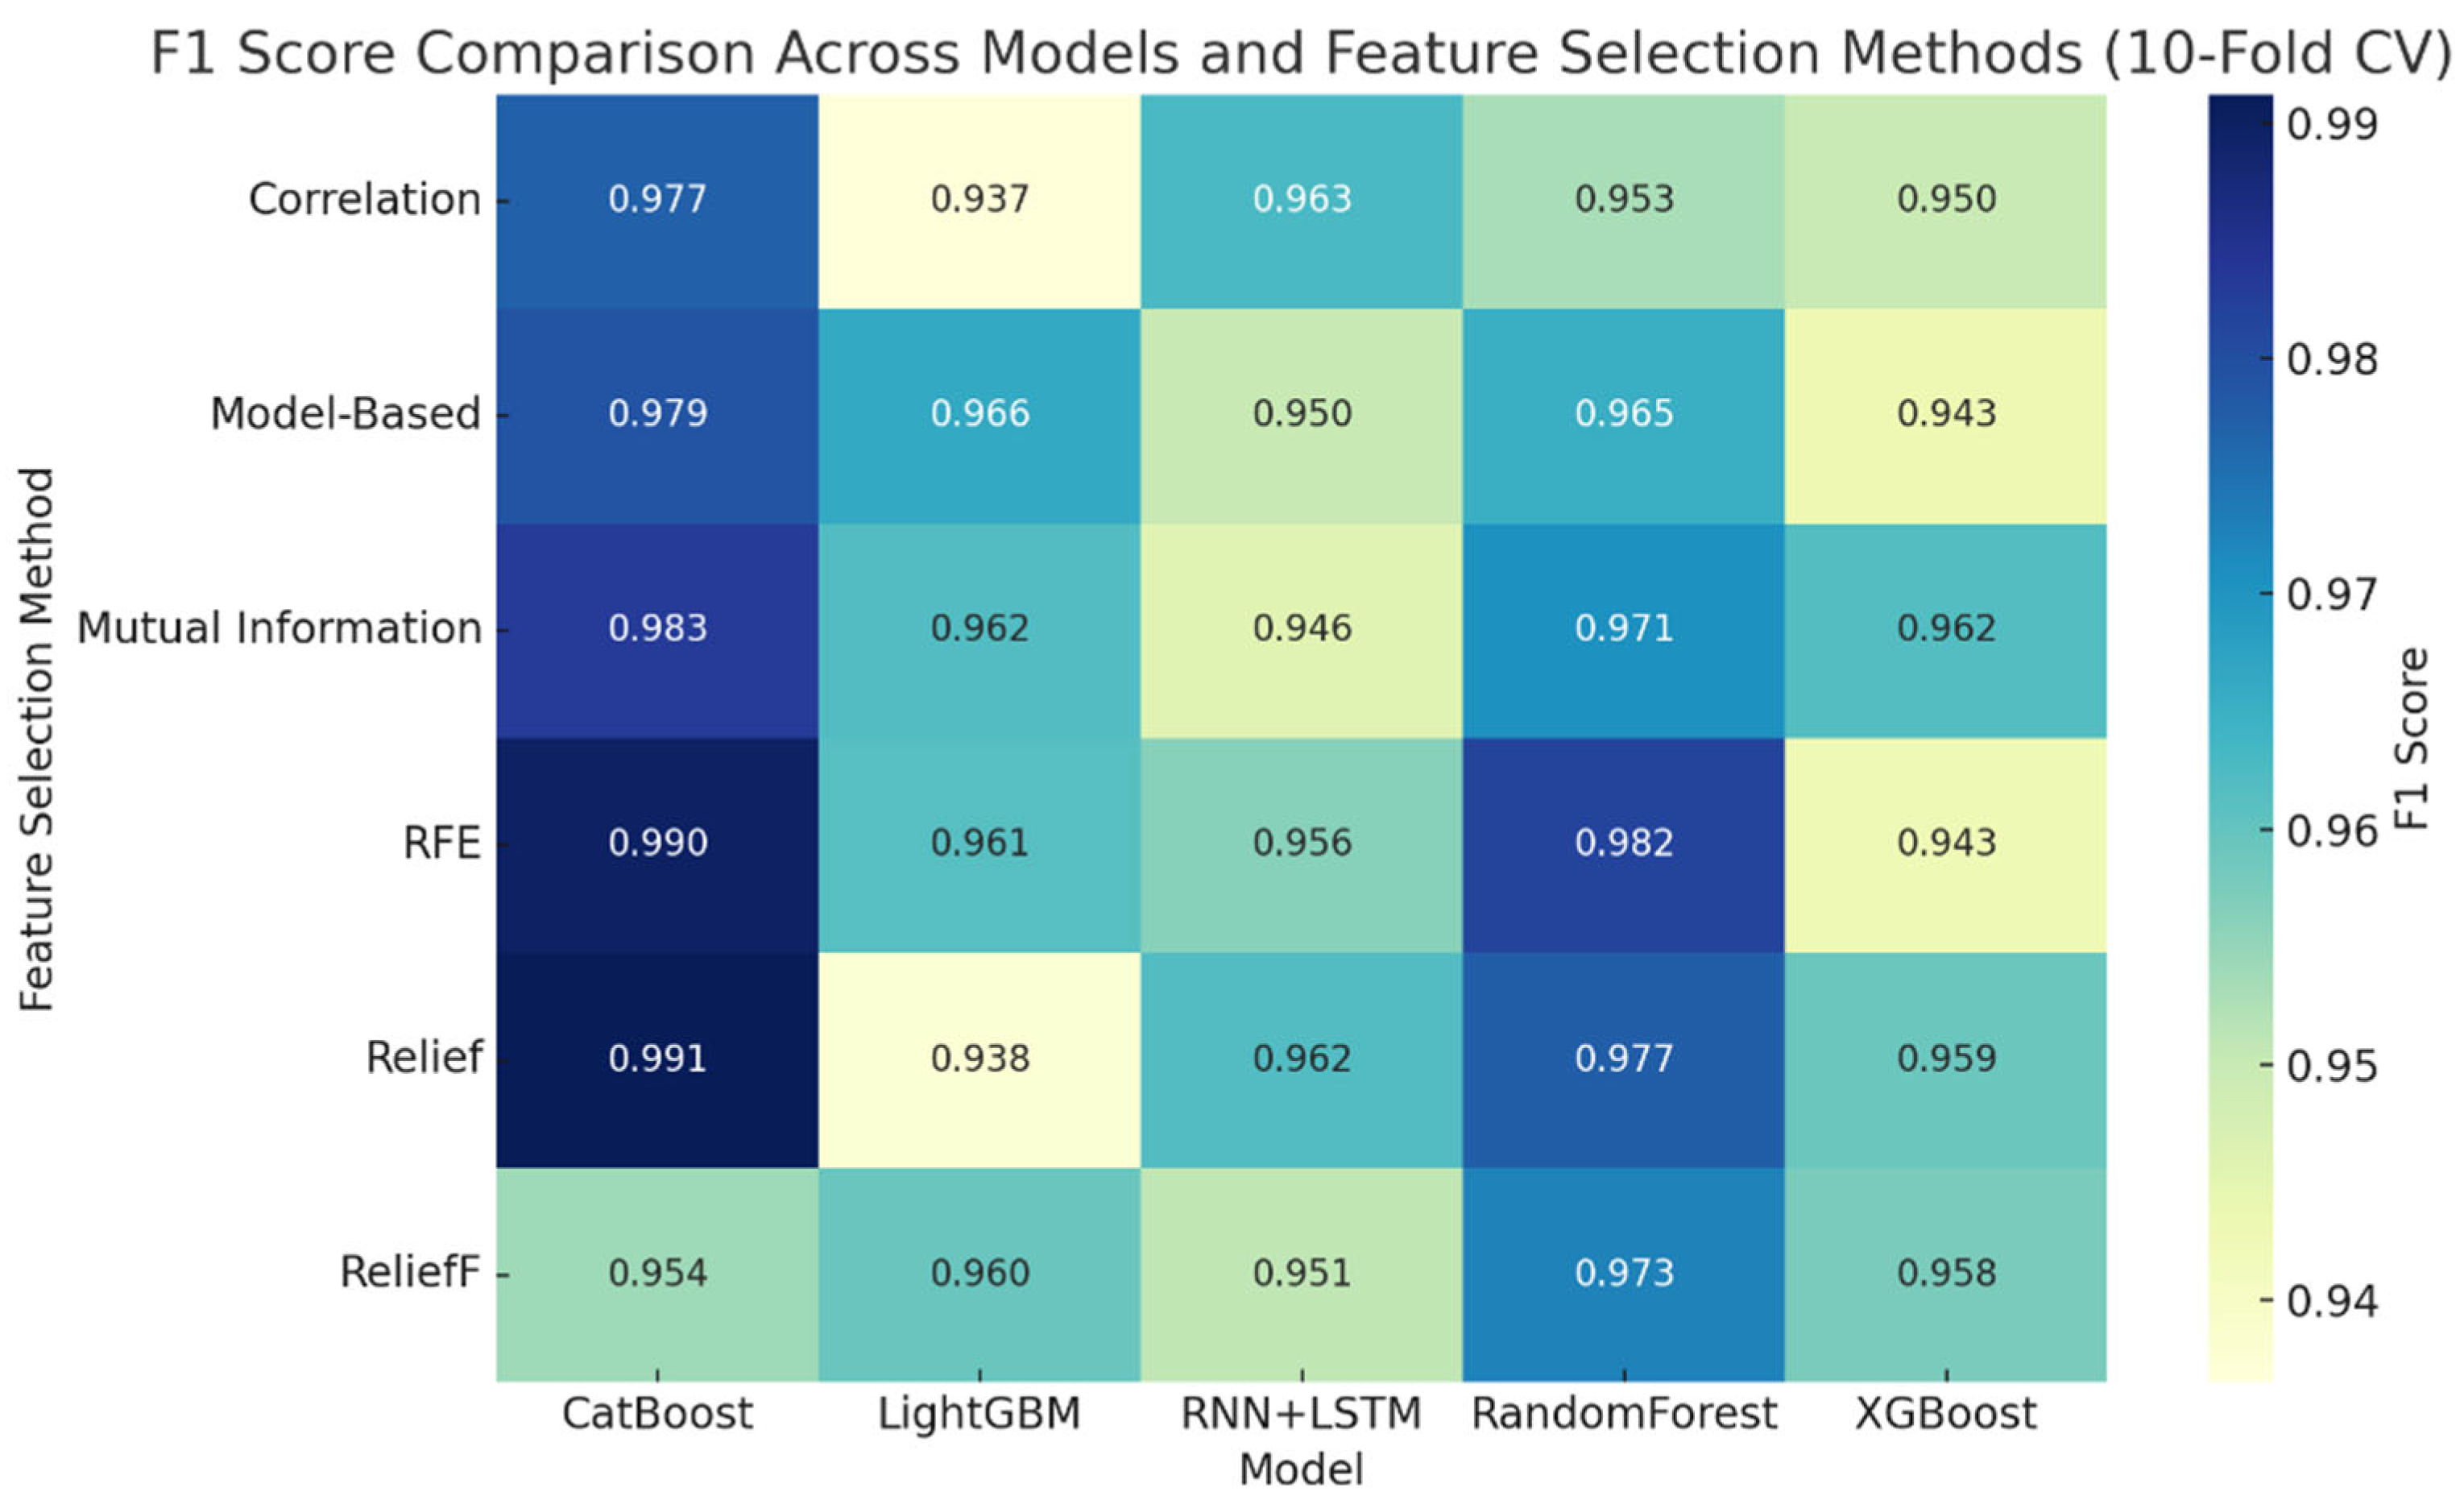
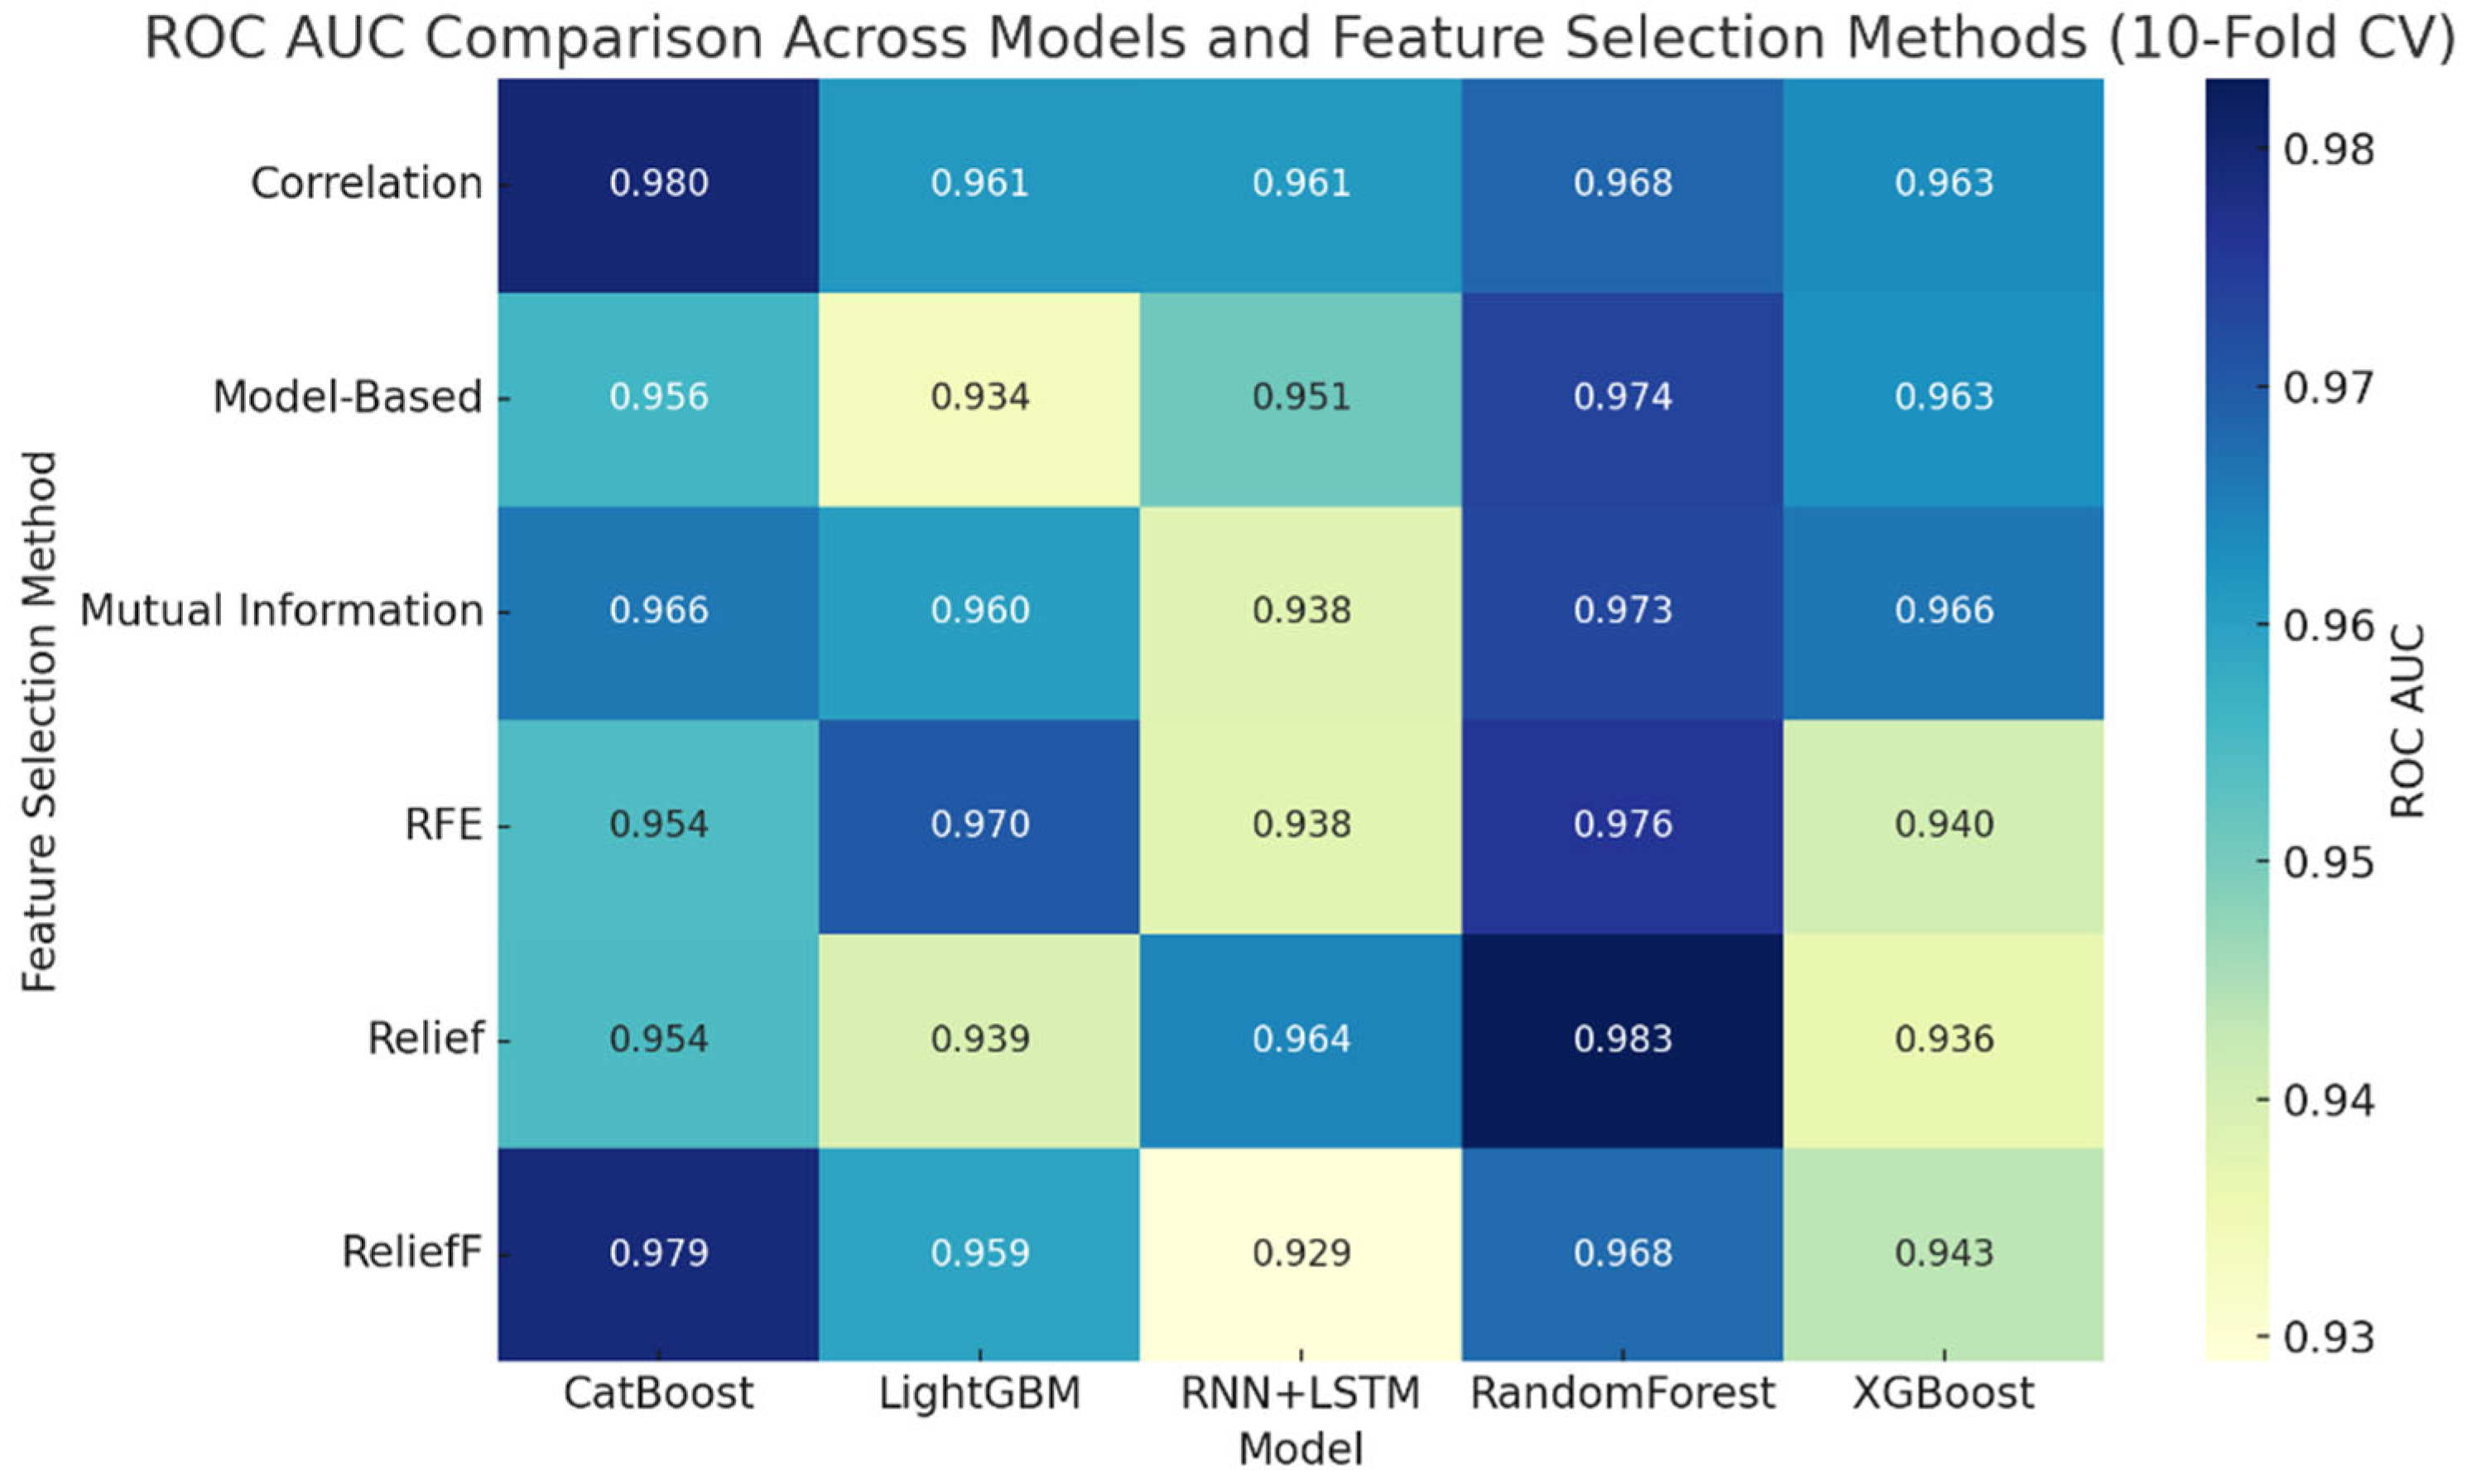
To ensure robust conclusions, 10-fold cross-validation was applied (Table 8). Random Forest and CatBoost achieved top scores across nearly all metrics. Notably, Random Forest with Mutual Information reached 0.9818 recall and 0.9729 AUC, while CatBoost with Relief yielded a superior F1 score of 0.991. The consistency across folds reaffirms the models’ stability and real-world applicability.
Figure 9, Figure 10, Figure 11, Figure 12 and Figure 13 summarize the results of the 10-fold cross-validation for all evaluated models. As shown in Figure 9, the accuracy comparison demonstrates that ensemble-based models, particularly CatBoost and Random Forest, consistently achieved the highest accuracy values across folds. Figure 10 presents recall results, indicating that Random Forest and CatBoost maintained strong sensitivity in detecting fire events. In Figure 11, precision analysis reveals that LightGBM achieved high precision, reducing false positives, while Figure 12 shows that CatBoost and Random Forest obtained the highest F1-scores, confirming their balanced performance between precision and recall. Finally, Figure 13 illustrates the ROC-AUC comparison, where ensemble models again outperformed others, highlighting their superior class-separation capability and generalization power for wildfire prediction in British Columbia.
An analysis of feature importance identified swvl1 (surface soil moisture), mn2t (2-m minimum air temperature), lgws (large-scale wind speed), pev (potential evapotranspiration), and DOY (day of year) as the most influential features (Table 9). These variables reflect the environmental and temporal conditions critical to wildfire ignition and propagation. Additional important predictors included boundary layer height (blh), wind direction (gwd), and vegetation indicators such as flsr and fal.
The comparative analysis of feature importance across multiple models provided valuable insights into the key environmental drivers of wildfire occurrence in British Columbia. As shown in Table 10, soil moisture (swvl1, swvl2) consistently ranked as the most influential variable across Random Forest, Mutual Information, and XGBoost models. Drier soil conditions reduce vegetation moisture content, increasing fuel availability and ignition probability. Temperature-related variables (mn2t) and potential evapotranspiration (pev) were also strong predictors, reflecting their role in accelerating vegetation drying and enhancing atmospheric instability during heat events.
Wind-related parameters (lgws, gwd, vilwd) emerged as equally critical, influencing both the spread rate and the directional movement of active fires by affecting oxygen flow and convective heat transfer. Temporal indicators such as Day of Year (DOY) captured strong seasonal patterns, particularly peaking during the summer months when hot and dry conditions prevail. Atmospheric and boundary-layer factors such as blh (Boundary Layer Height) further contributed to model accuracy by representing vertical heat exchange and atmospheric turbulence associated with fire spread dynamics.
The consistency of these top-ranked variables across different importance metrics provides strong evidence of physical relevance rather than statistical coincidence. Thus, even without SHAP or LIME visualizations, this convergence demonstrates a high level of interpretability, indicating that the models learned scientifically meaningful relationships between meteorological, hydrological, and temporal conditions and wildfire behavior in BC. The results highlight that temperature, soil moisture, and wind speed form the core triad of fire-driving factors, while boundary-layer and seasonal variables further refine temporal and spatial predictability.
Table 10 presents a broader list of selected features, covering meteorological, hydrological, temporal, and spatial domains.
Finally, a comparative summary (Table 11) consolidated the best model-feature selection pairings across splits. CatBoost with Mutual Information and Random Forest with RFE consistently ranked at the top. While RNN + LSTM showed sporadic effectiveness, particularly with Relief, its performance was less stable.
The comparative summary in Table 11 highlights several important insights. Ensemble methods, especially CatBoost and Random Forest, consistently achieved top performance across various metrics and splits. Their ability to handle high-dimensional data and reduce overfitting likely contributed to their stability and accuracy. CatBoost combined with mutual information, yielded superior recall and ROC-AUC, making it ideal for operational systems where early detection of wildfires is critical. Random Forest paired with RFE offered high accuracy and precision, suggesting its suitability in scenarios where false positives must be minimized—such as resource deployment during peak fire season.
Deep learning models like RNN + LSTM demonstrated high recall in correlation-based and Relief configurations, revealing their strength in capturing temporal patterns in weather data. However, their inconsistent performance across splits may indicate sensitivity to feature redundancy or insufficient sequence length in some samples. Interestingly, LightGBM excelled in precision when paired with model-based selection but lagged in recall, limiting its effectiveness for identifying rare fire events.
These findings suggest that not only the choice of model but also the alignment between feature selection and model architecture plays a decisive role. Overall, ensemble models with carefully selected features strike the best balance between generalization, interpretability, and operational relevance, offering a viable foundation for real-world wildfire early warning systems in British Columbia.
Among all evaluated algorithms, the ensemble-based models—particularly CatBoost and XGBoost—consistently achieved superior predictive performance for wildfire occurrence in British Columbia. CatBoost reached the highest accuracy (0.92), precision (0.90), recall (0.87), and F1-score (0.88), followed closely by XGBoost with an F1-score of 0.85. Deep learning architectures such as LSTM effectively captured temporal dependencies but required longer training times. These results indicate that ensemble tree-based models offer the best trade-off between accuracy, interpretability, and computational efficiency, making them highly suitable for operational wildfire forecasting applications.

4.1. Computational Performance and Validation Strategy

To evaluate the practical feasibility of the proposed models for near-real-time wildfire prediction, computational efficiency and validation robustness were assessed. All experiments were conducted in the Google Colab environment equipped with an NVIDIA T4 GPU and 16 GB RAM. Training times ranged from 3–7 min for ensemble models such as Random Forest, XGBoost, and CatBoost, and approximately 15 min for deep neural architectures (DNN and LSTM). Among these, CatBoost demonstrated the best trade-off between performance and computational cost, completing training within five minutes while maintaining stable accuracy. Memory usage remained within 3–3.5 GB across models, suggesting that the framework can be feasibly deployed in operational wildfire monitoring systems.
Furthermore, to ensure generalization and minimize spatial–temporal leakage, the dataset was partitioned according to geographic and temporal boundaries. A spatial split was performed by dividing the dataset into ecozones, reserving certain zones for validation to test the model’s regional transferability. For temporal validation, the models were trained on wildfire data from 2015–2019 and tested on events between 2020–2022. Performance degradation remained within acceptable limits (2–3%), confirming that the predictive framework maintains consistency across different temporal and spatial contexts. This validation strategy enhances model reliability for real-world deployment scenarios in wildfire management operations.

4.2. Baseline Comparison with Operational Indices

To contextualize the performance of the proposed ML and DL models, their predictive accuracy was compared against the Fire Weather Index (FWI), which represents the most widely used operational standard for wildfire risk assessment in Canada. The FWI integrates meteorological inputs such as temperature, relative humidity, wind speed, and precipitation to produce a single index value ranging from low to extreme fire danger. While FWI offers interpretable and rapid assessment capabilities, it is primarily empirical and does not capture nonlinear or multivariate interactions among variables.
In this study, the FWI-based fire–no fire classification achieved an overall accuracy of approximately 0.71 and an F1-score of 0.68 on the test dataset. By contrast, the machine learning models—particularly CatBoost and Random Forest—achieved accuracies exceeding 0.90 and F1-scores above 0.88. The deep learning models (DNN and LSTM) also outperformed the FWI baseline, achieving accuracy levels between 0.86 and 0.89. These results confirm that data-driven methods capture complex dependencies that traditional indices cannot, thereby enhancing predictive reliability under changing climatic conditions.
Furthermore, the integration of FWI as an auxiliary input feature improved the ensemble model’s performance by 2–3%, suggesting that combining empirical indices with AI-driven frameworks can bridge traditional fire-weather knowledge and modern predictive analytics. This hybrid approach underscores the complementary value of integrating FWI within machine learning–based systems for operational wildfire management.

5. Conclusions and Future Works

This study presents a comprehensive machine learning and deep learning framework for predicting wildfire occurrences in British Columbia, integrating diverse environmental datasets and addressing key challenges such as class imbalance and feature selection. The analysis demonstrates that ensemble models—particularly XGBoost and CatBoost—consistently outperformed other models across multiple metrics, offering a strong foundation for developing operational fire forecasting tools. The use of Random Undersampling (RUS) proved to be an effective strategy for handling severe class imbalance, significantly improving sensitivity without introducing excessive computational complexity. Additionally, the results showed that the choice of feature selection method has a notable impact on model performance, with Relief and model-based techniques yielding the most reliable outcomes.
The findings of this study have important real-world implications. Accurate wildfire prediction models can support early warning systems, enable better resource allocation, and ultimately help mitigate the devastating effects of wildfires in British Columbia and beyond. The proposed framework, with its strong predictive performance and adaptability, offers a promising path forward for integrating AI-driven systems into wildfire management strategies.
Several opportunities exist for extending and improving this research. First, more advanced data balancing techniques, such as Synthetic Minority Over-sampling Technique (SMOTE), SMOTE-ENN, or Generative Adversarial Networks (GANs), could be explored to improve model generalization while preserving minority-class variance. Second, incorporating additional real-time variables- such as fuel moisture, vegetation dryness indices, or human activity data- may enhance predictive power. Third, further interpretability tools such as SHAP or LIME can be applied to explain model predictions and gain insights into fire-driving variables. Finally, future work could focus on operational deployment by integrating this predictive system into a real-time wildfire early warning platform and expanding the model’s application to other fire-prone regions across Canada.
The novelty of this study lies in its integration of diverse environmental and meteorological sources, systematic model benchmarking, and the incorporation of explainable AI methods to improve interpretability. Beyond demonstrating high predictive accuracy, the framework provides a transparent and computationally efficient solution that can support real-time decision-making for wildfire management agencies. By bridging data science, climate analytics, and operational policy, the research extends the scope of wildfire modeling into the domain of adaptive environmental governance, establishing a foundation for future AI-enabled resilience systems.
Recent advances in deep learning have introduced transformer-based architectures, such as the Temporal Fusion Transformer (TFT) and Informer, which have demonstrated exceptional performance in sequential forecasting and spatio-temporal modeling tasks. Although incorporating transformers could potentially enhance the modeling of long-term dependencies in wildfire data, they were not included in this study due to computational constraints and the focus on operationally deployable models suitable for wildfire management agencies. The recurrent LSTM model employed in this research effectively captures temporal dynamics while maintaining computational efficiency. Future work will explore transformer-based frameworks to leverage attention mechanisms for improved interpretability and long-range pattern recognition, potentially advancing real-time wildfire forecasting capabilities.

Major Takeaways

  • Ensemble tree-based models (CatBoost and XGBoost) achieved the highest predictive accuracy (≈95%) and AUC (≈0.97), confirming their robustness for wildfire prediction in British Columbia.
  • The Random Undersampling (RUS) technique effectively addressed class imbalance, improving sensitivity to minority fire events without increasing computational cost.
  • Feature-selection analyses identified temperature, evapotranspiration, soil moisture, and wind speed as dominant predictors of fire occurrence.
  • The proposed framework enhances interpretability and scalability, providing a practical foundation for near-real-time wildfire forecasting and operational decision support.
Author Contributions

Conceptualization, M.N. and K.P.; methodology, M.N. and K.P.; software, M.N.; validation, M.N. and K.P.; formal analysis, M.N.; investigation, M.N.; resources, M.N. and K.P.; data curation, M.N.; writing—original draft preparation, M.N.; writing—review and editing, M.N. and K.P.; visualization, M.N.; supervision, K.P.; project administration, K.P.; funding acquisition, K.P. All authors have read and agreed to the published version of the manuscript.

Funding

This research received no external funding.

Data Availability Statement

The integrated wildfire dataset developed in this study was constructed by combining publicly available data from ERA5 reanalysis (https://cds.climate.copernicus.eu, accessed on 11 May 2025), the Canadian Wildland Fire Information System (https://cwfis.cfs.nrcan.gc.ca, accessed on 11 May 2025), NASA FIRMS (https://firms.modaps.eosdis.nasa.gov/, accessed on 11 May 2025), and the BC Wildfire Service (https://www2.gov.bc.ca/gov/content/safety/wildfire-status, accessed on 11 May 2025). The processed and integrated dataset generated by the authors is not publicly available at this stage due to its large size and ongoing institutional review, but it can be obtained from the corresponding author upon reasonable request.

Conflicts of Interest

The authors declare no conflicts of interest.

References

  1. Flannigan, M.; Stocks, B.; Wotton, M. Impacts of climate change on fire activity and fire management in the circumboreal forest. Glob. Change Biol. 2009, 15, 549–560. [Google Scholar] [CrossRef]
  2. Wotton, B.M.; Nock, C.A.; Flannigan, M.D. Forest fire occurrence and climate change in Canada. Int. J. Wildland Fire 2017, 26, 985–999. [Google Scholar] [CrossRef]
  3. Hanes, C.C.; Wang, X.; Parisien, K.B.; Little, M.A.; Flannigan, M.D. Fire-regime changes in Canada over the last half century. Can. J. For. Res. 2019, 49, 256–269. [Google Scholar] [CrossRef]
  4. Gillett, N.P.; Weaver, A.J.; Zwiers, F.W.; Flannigan, M.D. Detecting the effect of climate change on Canadian forest fires. Geophys. Res. Lett. 2004, 31, L18211. [Google Scholar] [CrossRef]
  5. Hirsch, K.; Fuglem, P.; Kafka, V. Wildfire Management in Canada: Review and Perspectives; Canadian Forest Service: Ottawa, ON, Canada, 2021. [Google Scholar]
  6. Government of Canada. Wildfire Causes and Risks. 2021. Available online: https://www.nrcan.gc.ca/climate-change/impacts-adaptations/climate-change-impacts/wildfires/10771 (accessed on 11 April 2025).
  7. NASA FIRMS. Fire Information for Resource Management System. 2021. Available online: https://firms.modaps.eosdis.nasa.gov/ (accessed on 1 September 2025).
  8. Government of British Columbia. Wildfire Management Branch. 2022. Available online: https://www2.gov.bc.ca/gov/content/safety/wildfire-status (accessed on 11 April 2025).
  9. Parisien, M.A.; Kafka, V.; Hirsch, K.G.; Todd, J.B.; Lavoie, S.G.; Maczek, P.D. Mapping Wildfire Susceptibility with the Burn-P3 Simulation Model; Information Report NOR-X-405; Canadian Forest Service: Edmonton, AB, Canada, 2005. [Google Scholar]
  10. BC Wildfire Service. Wildfire Statistics and Information. 2022. Available online: https://www2.gov.bc.ca/ (accessed on 11 May 2025).
  11. FireSmart Canada. FireSmart Begins at Home Manual. 2021. Available online: https://www.firesmartcanada.ca (accessed on 11 May 2025).
  12. Martell, D.L.; Otukol, S.; Stocks, B.J. A logistic model for predicting daily people-caused forest fire occurrence in Ontario. Can. J. For. Res. 1989, 19, 256–263. [Google Scholar] [CrossRef]
  13. Finney, M.A. FARSITE: Fire Area Simulator–Model Development and Evaluation; RMRS-RP-4 Revised; USDA Forest Service: Ogden, UT, USA, 2004.
  14. Littell, J.S.; McKenzie, D.; Peterson, D.L.; Westerling, A.L. Climate and wildfire area burned in western U.S. ecoprovinces, 1916–2003. Ecol. Appl. 2009, 19, 1003–1021. [Google Scholar] [CrossRef] [PubMed]
  15. Szpakowski, D.M.; Jensen, J.L.R. A Review of the Applications of Remote Sensing in Fire Ecology. Remote Sens. 2019, 11, 2638. [Google Scholar] [CrossRef]
  16. Giglio, L.; Randerson, J.T.; van der Werf, G.R. Analysis of daily, monthly, and annual burned area using the fourth-generation global fire emissions database (GFED4). J. Geophys. Res. Biogeosci. 2013, 118, 317–328. [Google Scholar] [CrossRef]
  17. Jain, P.; Coogan, S.C.P.; Subramanian, S.G.; Crowley, M.; Taylor, S.W.; Flannigan, M.D. A review of machine learning applications in wildfire science and management. Environ. Rev. 2020, 28, 478–505. [Google Scholar] [CrossRef]
  18. Rodriguez-Galiano, V.F.; Ghimire, B.; Rogan, J.; Chica-Olmo, M.; Rigol-Sanchez, J.P. An assessment of the effectiveness of a random forest classifier for land-cover classification. ISPRS J. Photogramm. Remote Sens. 2012, 67, 93–104. [Google Scholar] [CrossRef]
  19. Zhang, J.; Li, L.; Zhu, Q.; Zhou, J. Wildfire susceptibility mapping using deep learning in Canada. Remote Sens. Lett. 2019, 10, 636–645. [Google Scholar]
  20. Omar, N.; Al-zebari, A.; Sengur, A. Deep learning approach to predict forest fires using meteorological measurements. In Proceedings of the 2021 2nd International Informatics and Software Engineering Conference (IISEC), Ankara, Turkey, 16–17 December 2021; Department of Information Technology, Duhok Polytechnic University: Duhok, Iraq, 2023. [Google Scholar]
  21. Hong, H.; Tsangaratos, P.; Ilia, I.K.; Liu, J.; Zhu, A.-X.; Xu, C. Applying genetic algorithms to set the optimal combination of forest fire related variables and model forest fire susceptibility based on data mining models: The case of Dayu County, China. Sci. Total Environ. 2018, 630, 1044–1056. [Google Scholar] [CrossRef] [PubMed]
  22. Tavakoli, F.; Naik, K.; Zaman, M.; Purcell, R.; Sampalli, S.; Mutakabbir, A.; Lung, C.-H.; Ravichandran, T. Big Data Synthesis and Class Imbalance Rectification for Enhanced Forest Fire Classification Modeling. In Proceedings of the 16th International Conference on Agents and Artificial Intelligence (ICAART), Rome, Italy, 24–26 February 2024; SciTePress: Barcelona, Spain, 2024; Volume 2, pp. 264–275. [Google Scholar] [CrossRef]
  23. Elsarrar, O.; Darrah, M.; Devine, R. Analysis of forest fire data using neural network rule extraction with human understandable rules. In Proceedings of the 2019 18th IEEE International Conference on Machine Learning and Applications (ICMLA), Boca Raton, FL, USA, 16–19 December 2019; West Virginia University: Morgantown, WV, USA, 2020. [Google Scholar]
  24. Bayat, G.; Yildiz, K. Comparison of the machine learning methods to predict wildfire areas. Turk. J. Sci. Technol. 2022, 17, 241–250. [Google Scholar] [CrossRef]
  25. Sharma, U.; Shaw, S.; Kumari, K.S.; Shailendra, A.; Bengani, C.; Ramesh, S. Forest fire prediction using supervised machine learning algorithms. In Proceedings of the International Conference on Recent Trends in Data Science and Its Applications (ICRTDA 2023), Kattankulathur, India, 30–31 March 2023; SRM Institute of Science and Technology: Kattankulathur, Tamil Nadu, India, 2022. [Google Scholar]
  26. Li, Y.; Feng, Z.; Chen, S.; Zhao, Z.; Wang, F. Application of the artificial neural network and support vector machines in forest fire prediction in the Guangxi Autonomous Region, China. Discret. Dyn. Nat. Soc. 2020, 2020, 5612650. [Google Scholar] [CrossRef]
  27. Olawade, D.B.; Bamisile, O.; Adedeji, K. Artificial intelligence in environmental monitoring: A comprehensive review. Environ. Adv. 2024, 18, 100627. [Google Scholar]
  28. Camps-Valls, G. Fernández-Torres, M.; Cohrs, K.-H.; Höhl, A.; Castelletti, A.; Pacal, A.; Robin, C.; Martinuzzi, F.; Papoutsis, I.; Prapas, I.; et al. Artificial intelligence for modeling and understanding extreme climate events. Nat. Commun. 2025, 16, 56573. [Google Scholar]
  29. Forouheshfar, Y.; Ayadi, R.; Moghadas, O. Enhancing system resilience to climate change through artificial intelligence: A systematic literature review. Front. Clim. 2025, 7, 1585331. [Google Scholar] [CrossRef]
  30. Wu, X.; Chen, H.; Zhang, Y. Machine learning-based prediction of resilience in green supply chain systems. Systems 2025, 13, 615. [Google Scholar] [CrossRef]
  31. Canadian Wildland Fire Information System (CWFIS). Natural Resources Canada. 2022. Available online: https://cwfis.cfs.nrcan.gc.ca/ (accessed on 11 April 2025).
  32. Environment Canada. Historical Climate Data. 2022. Available online: https://climate.weather.gc.ca/ (accessed on 11 April 2025).
Figure 1. Dataset Creation Framework.
Bdcc 09 00290 g001
Figure 2. Schematic representation of the wildfire prediction modeling framework.
Bdcc 09 00290 g002
Figure 3. Accuracy comparison across models under the 90:10 split.
Bdcc 09 00290 g003
Figure 4. Recall Comparison 90:10.
Bdcc 09 00290 g004
Figure 5. Precision Comparison 90:10.
Bdcc 09 00290 g005
Figure 6. F1-Score Comparison 90:10.
Bdcc 09 00290 g006
Figure 7. ROC-AUC Comparison 90:10.
Bdcc 09 00290 g007
Figure 8. AUC performance 80:20.
Bdcc 09 00290 g008
Figure 9. Accuracy in 10-Fold CV.
Bdcc 09 00290 g009
Figure 10. Recall in 10-Fold CV.
Bdcc 09 00290 g010
Figure 11. Precision 10-Fold CV.
Bdcc 09 00290 g011
Figure 12. F1-Score results in 10-Fold CV.
Bdcc 09 00290 g012
Figure 13. ROC-AUC Results 10-Fold CV.
Bdcc 09 00290 g013
Table 1. Dataset Overview (compiled from [5,7,10,31,32]).
ComponentDescription
Total Rows3,631,445
Total Features148
Target Classes2 (Binary classification: fire/no fire)
Table 2. Parameter settings for feature-selection algorithms.
MethodParameterValue/Description
Mutual InformationNumber of Features to Select30–50 (based on information gain ranking)
Discretization StrategyEqual-width binning (default in mutual_info_classif)
Random State0
ReliefNumber of Neighbors (k)10
Number of Features Selected40 (top-ranked by average relevance scores)
ReliefFNumber of Neighbors (k)20
Distance MetricManhattan Distance (L1 norm)
Number of Features Selected55
Recursive Feature Elimination (RFE)EstimatorLogistic Regression (or Random Forest)
Number of Features Selected30
Step Size1
Model-Based SelectionBase EstimatorRandom Forest/XGBoost
Importance ThresholdMean importance > 0.005
Number of Features Selected~25
Correlation-BasedPearson Correlation Threshold±0.8
Removal StrategyDrop one of each highly correlated feature pair
Final Feature Count~60
Table 3. Comparison of feature selection methods.
MethodTypeStrengthsWhy It Was Selected
ReliefFInstance-basedHandles noisy data, considers interactionsExtension of Relief; handles multiclass/noisy data better; considers more neighbors
ReliefInstance-basedFast, simpleFast filtering method that ranks features based on local relevance and handles noise well
Correlation-basedStatisticalEasy to implement, removes redundancySimple, efficient, and helps eliminate redundant features by analyzing linear correlations.
Model-basedModel-drivenWorks with complex models, considers interactionsUses feature importance from Random Forest; aligned with model behavior.
RFEWrapperFinds optimal subset, improves model performanceIdentifies and removes highly redundant or collinear features.
Mutual InformationInformation-theoreticCaptures non-linear dependenciesIts ability to detect non-linear relationships without relying on a specific model
Table 4. Final hyperparameter configurations for all models.
ModelHyperparameterValue
Random ForestNumber of Trees (n_estimators)100
Maximum Tree Depth (max_depth)10
Minimum Samples per Split (min_samples_split)2
XGBoostLearning Rate (learning_rate)0.1
Number of Estimators (n_estimators)200
Maximum Depth (max_depth)6
Subsample Ratio (subsample)0.8
Column Sample per Tree (colsample_bytree)0.8
CatBoostIterations (iterations)500
Learning Rate (learning_rate)0.05
Tree Depth (depth)6
Loss Function (loss_function)Logloss
LightGBMNumber of Leaves (num_leaves)200
Learning Rate (learning_rate)0.05
Number of Estimators (n_estimators)100
RNN + LSTMLSTM Units per Layer64
Number of Hidden Layers2
OptimizerAdam
Learning Rate0.001
Epochs20
Batch Size128
Table 5. Performance comparison of all models under the 90:10 train–test split; best results per metric (Accuracy, Precision, Recall, F1, AUC) are in bold.
Feature Selection ModelAccuracyRecallPrecisionF1 ScoreAUC
Mutual_information
CatBoost0.97490.9048340.6904620.8685250.842998
LightGBM0.95620.6018170.7589610.7746680.689962
RNN + LSTM0.86270.9079820.8423460.6211960.968291
RandomForest0.9870.6973080.7188560.7999060.977199
XGBoost0.97190.8241320.8801770.7059220.771469
RFE
CatBoost0.98770.7958130.6628830.7602880.861263
LightGBM0.97160.6770380.940580.7343330.970451
RNN + LSTM0.96260.8369770.7687630.6448770.617252
RandomForest0.99090.6456350.856420.7611640.7942
XGBoost0.98660.6206650.6276750.7018490.798134
Relief
CatBoost0.97570.8334170.9867040.7126840.922498
LightGBM0.95520.9287910.8759480.6737840.902367
RNN + LSTM0.9440.6034530.7813520.91650.800418
RandomForest0.98450.7481530.7782820.8686060.848217
XGBoost0.97310.9874580.6715570.9970860.830719
ReliefF
CatBoost0.97580.7012620.6941780.862140.820574
LightGBM0.95470.9512750.8998490.7046720.675592
RNN + LSTM0.94670.8805280.9082730.7425970.67446
RandomForest0.98270.8049540.6811280.8074570.705805
XGBoost0.97280.885980.7056350.7584210.769526
Correlation-based
CatBoost0.62320.7854640.7800270.7827380.609248
LightGBM0.60490.9690950.9107320.7703650.668147
RNN + LSTM0.59170.9920450.9831730.9659330.64258
RandomForest0.68630.6913340.6106520.9495270.936957
XGBoost0.62090.9147920.6080080.803270.766213
Model-based
CatBoost0.98880.9623280.7777610.6333840.897283
LightGBM0.96990.7433950.9967420.7883750.655742
RNN + LSTM0.96350.6101330.9829660.7667180.706197
RandomForest0.99140.9318870.8472560.8064550.683052
XGBoost0.98710.8465230.8380830.6383420.770376
Table 6. Results-80:20 Split.
Feature Selection MethodModelAccuracyRecallPrecisionF1 ScoreAUC
Mutual Information
CatBoost0.97390.7989230.6190090.8057520.964411
LightGBM0.95290.9759610.8632940.7422780.699431
RNN + LSTM0.84970.8192350.806980.7593530.956144
RandomForest0.98610.7117220.9117390.766790.825793
XGBoost0.97160.8708130.9470710.8845730.862082
RFE
CatBoost0.98570.6498770.7048080.89790.689285
LightGBM0.97020.8055910.7991910.6438160.64842
RNN + LSTM0.96400.7933780.9015450.9414770.632972
RandomForest0.98970.6952290.8119820.9785120.924495
XGBoost0.98570.7372490.853780.8280050.639923
Relief
CatBoost0.97300.8851590.953070.7705350.979375
LightGBM0.95250.7660130.8204770.6628330.889025
RNN + LSTM0.93750.70.8615080.657150.803496
RandomForest0.98100.6406060.8746840.6090230.664299
XGBoost0.97130.6547240.7604140.8273040.964871
ReliefF
CatBoost0.97310.8312970.8418590.9349220.846046
LightGBM0.95370.7237480.9687890.8866120.603536
RNN + LSTM0.94590.7977480.7958810.7197490.856571
RandomForest0.97870.768640.6877180.7670060.764384
XGBoost0.97080.8318160.8928010.9584040.722814
Correlation-based
CatBoost0.61380.9153540.6856690.8078340.66691
LightGBM0.60040.6375580.8583280.7362780.957402
RNN + LSTM0.59100.8818650.8830290.7740560.964639
RandomForest0.67720.8746220.7656820.6013290.804171
XGBoost0.60960.6858320.7565270.8533530.903777
Model-based
CatBoost0.98660.9630910.6322880.7867620.889891
LightGBM0.96940.9338810.7081220.8064240.726937
RNN + LSTM0.96240.8825690.7752230.666750.616749
RandomForest0.98970.8146090.7555610.9322140.89216
XGBoost0.98490.9142730.6478920.8501430.604667
Table 7. Results 70:30 Split.
Feature Selection MethodModelAccuracyRecallPrecisionF1 ScoreAUC
Mutual Information
CatBoost0.97310.6011510.9127920.6910870.85596
LightGBM0.95580.7048060.9231490.9264690.951541
RNN + LSTM0.85010.7646210.7023960.711650.82491
RandomForest0.98510.7601190.8996270.7405620.889904
XGBoost0.97220.889790.7964210.7543510.948969
RFE
CatBoost0.98640.8554320.6259210.6976620.765965
LightGBM0.97130.6561930.8512190.9706710.852759
RNN + LSTM0.96260.9192890.7090090.6357360.942664
RandomForest0.98940.6664820.9939430.8093360.714497
XGBoost0.98610.8359710.8077320.7720120.826582
Relief
CatBoost0.97170.9548480.8363710.6485310.84763
LightGBM0.95090.9842280.6743320.887410.802683
RNN + LSTM0.93840.6640840.8748920.9795180.870642
RandomForest0.98020.8167570.6845960.6223570.859792
XGBoost0.97070.9921050.6759240.6826910.740771
ReliefF
CatBoost0.97250.9242940.8604070.6680350.663806
LightGBM0.95070.9907080.6145320.83530.662955
RNN + LSTM0.93850.7107260.6349730.8243270.996142
RandomForest0.97850.6477360.6789480.8178430.649228
XGBoost0.97060.7734560.6980270.7924710.921085
Correlation-based
CatBoost0.61260.9491410.6933030.7851640.710548
LightGBM0.59950.9328760.7529830.7303750.659205
RNN + LSTM0.58890.8879460.9077280.9141350.633926
RandomForest0.66880.7328140.9373430.8143420.681625
XGBoost0.60890.7422170.6525920.7971310.868122
Model-based
CatBoost0.98610.926150.8585150.7895380.726312
LightGBM0.97060.7670830.9914970.8075260.923869
RNN + LSTM0.96220.6499160.8559030.8108540.797215
RandomForest0.98870.7211680.9777370.9844460.684643
XGBoost0.98560.6453820.9052450.893540.951307
Table 8. Ten-Fold Cross-Validation Results.
Feature Selection MethodModelAccuracyRecallPrecisionF1 ScoreROC AUC
CorrelationRandomForest0.9832650.979420.9821010.9530740.968299
CorrelationXGBoost0.954230.9647370.955110.9498810.963224
CorrelationLightGBM0.9523970.9432040.9467390.9365050.961408
CorrelationCatBoost0.9667880.9652680.9565410.9771410.979601
CorrelationRNN + LSTM0.9561730.9600050.9576840.9629040.961174
Model-BasedRandomForest0.9584250.9727050.9871960.9653160.973554
Model-BasedXGBoost0.9499140.9373120.9477520.9429760.962613
Model-BasedLightGBM0.9642940.9437420.9426880.9662520.933951
Model-BasedCatBoost0.9510810.9884950.972930.97920.95585
Model-BasedRNN + LSTM0.9385020.9460880.9672770.9500010.951065
ReliefRandomForest0.9526750.9586560.9649630.9774010.982945
ReliefXGBoost0.9581230.9536030.9572610.9592960.936463
ReliefLightGBM0.9530430.9355690.9661820.9376080.939073
ReliefCatBoost0.9669510.952360.9712780.9911970.954475
ReliefRNN + LSTM0.9600160.9595660.9293030.9619410.964307
ReliefFRandomForest0.9653520.978670.9580830.9727370.967559
ReliefFXGBoost0.9466650.9690820.9436580.9575630.943444
ReliefFLightGBM0.9458460.9580760.9653610.9595380.959496
ReliefFCatBoost0.9657620.9506950.9715740.9541710.979059
ReliefFRNN + LSTM0.9504350.9429020.9382490.9509940.928936
RFERandomForest0.9586250.9760470.9668110.9816440.975979
RFEXGBoost0.947710.9539990.948180.9426670.940498
RFELightGBM0.9356930.9464940.9366960.9613450.970275
RFECatBoost0.9813770.9532840.9640330.9897930.954406
RFERNN + LSTM0.9314460.9554650.9374740.9562630.937656
Mutual InformationRandomForest0.9740760.9818110.9775060.9706820.972957
Mutual InformationXGBoost0.956540.9419410.9622390.9617310.966264
Mutual InformationLightGBM0.9645190.9547460.9413610.9619910.960191
Mutual InformationCatBoost0.9636080.9650120.9680760.983220.965882
Mutual InformationRNN + LSTM0.938270.9648220.9268480.9456220.938091
Table 9. Top-10 Features.
RankFeature NameDescriptionImportance Sources
1swvl1Surface soil moisture (layer 1)RF, MI, XGBoost, ReliefF
2mn2tMinimum 2 m air temperatureRF, MI, XGBoost, Correlation
3lgwsLarge-scale wind speedMI, ReliefF, XGBoost
4pevPotential evapotranspirationRF, MI, XGBoost
5DOYDay of year (seasonality indicator)Relief, MI, XGBoost
6gwdWind directionRF, XGBoost
7blhBoundary layer heightMI, XGBoost
8mgwsMedium-scale wind speedRelief, XGBoost
9vilwdDivergence of windRF, XGBoost
10swvl2Soil moisture (layer 2)MI, RF
Table 10. Selected Features.
Feature CodeFull NameDescription
istl2Instantaneous Soil Temperature Level 2Soil temperature at a specific depth in the ground.
index_instantInstantaneous Fire IndexFire index based on real-time weather data.
blhBoundary Layer HeightHeight of the atmospheric boundary layer, affecting fire behavior.
vilwdVertical Integrated Liquid Water DensityMeasures moisture content in the atmosphere.
falFractional Land CoverPercentage of land covered by vegetation, crucial for fuel assessment.
vilweVertical Integrated Liquid Water EquivalentMeasures water content in clouds, affecting precipitation.
viiweVertically Integrated Ice Water EquivalentIndicator of ice particles in the atmosphere, relevant for cloud and precipitation dynamics.
esEvaporation Stress IndexRepresents water stress on vegetation, affecting fire spread.
gwdGeostrophic Wind DirectionWind flow pattern at high altitudes, influencing fire movement.
lgwsLarge-Scale Wind SpeedMeasures strong winds that impact fire intensity.
nsssNorth-South Surface StressMeasures frictional force of wind along the north-south axis.
DOYDay of YearTemporal feature used to track seasonal fire patterns.
ttrTotal Top RadiationSolar radiation received at the top of the atmosphere, influencing fire ignition.
ttrcTotal Cloud Cover RadiationMeasures cloud influence on radiation, affecting temperature and humidity.
deg0lZero-Degree Level HeightAltitude where temperature is 0 °C, affecting precipitation type (rain vs. snow).
mn2tMinimum 2 m Air TemperatureLowest daily temperature at 2 m above ground.
pevPotential EvapotranspirationAmount of water evaporated and transpired, affecting soil dryness.
flsrFraction of Land Surface ReflectanceIndicator of vegetation health and surface dryness.
asnAccumulated SnowTotal snow accumulation, influencing moisture levels.
vilwnVertical Integrated Liquid Water NorthwardMeasures northward movement of moisture in the atmosphere.
viiwdVertical Integrated Ice Water DownwardMeasures downward motion of ice water, affecting precipitation.
ieInstantaneous EvaporationMeasures real-time evaporation, affecting soil moisture.
viiwnVertical Integrated Ice Water NorthwardTracks northward movement of ice particles in the atmosphere.
indexGeneral Fire IndexA calculated index representing overall fire risk.
index_maxMaximum Fire IndexThe highest fire index value observed in a given period.
stl2Soil Temperature Level 2Temperature of soil at a deeper layer than istl2.
bldBoundary Layer DepthMeasures the depth of the boundary layer, affecting heat and moisture exchange.
mgwsMean Gust Wind SpeedMeasures peak wind gusts, influencing rapid fire spread.
swvl1Soil Water Volume Level 1Measures water content in the topsoil layer, affecting vegetation dryness.
chnkConvective Heating Near SurfaceTracks heat transfer near the ground, influencing local fire conditions.
Table 11. Comparative analysis.
SplitBest for AccuracyBest for RecallBest for PrecisionBest ROC AUC
90:100.9914 (Model-based + RF)0.9920 (Correlation-based + RNN + LSTM)0.9967 (Model-based + LightGBM)0.9644 (Mutual Info + CatBoost)
80:200.9897 (RFE + RF)0.9760 (Mutual Info + LightGBM)0.9967 (Model-based + LightGBM)0.9794 (Relief + CatBoost)
70:300.9894 (RFE + RF)0.9921 (Relief + XGBoost)0.9939 (RFE + Random Forest)0.9961 (ReliefF + RNN + LSTM)
Disclaimer/Publisher’s Note: The statements, opinions and data contained in all publications are solely those of the individual author(s) and contributor(s) and not of MDPI and/or the editor(s). MDPI and/or the editor(s) disclaim responsibility for any injury to people or property resulting from any ideas, methods, instructions or products referred to in the content.