1. Introduction
In today’s digitally interconnected world, social media platforms have become significant channels of communication as people use them to share views, reviews, discuss trends, policies, and many others. X is one such social media platform which currently ranks 12th in terms of popularity, has over 200 million daily active users as of 2024, and generates an average of over 500 million posts per day. These posts could be in any language but are limited to 280 characters [
1]. Unlike other social media platforms, such as Facebook, which do not allow easy access to their data due to their varying privacy policies [
2], X data is easily accessible in an easy and automated way, thereby making X a rich source of available data for analysis. Sentiment analysis, which is the computational study of opinions, sentiments and emotions expressed in text [
3] and which aims to determine if the opinion expressed is Positive, Negative or Neutral [
4], has been applied to tweets to obtain valuable insights from public opinions; the NHS is not exempt from this.
The NHS is the body responsible for health matters in the United Kingdom (UK). It was created in 1948 and consists of four distinct healthcare systems, each responsible for health services within their respective regions: NHS England, NHS Scotland, NHS Wales, and Health and Social Care (HSC) in Northern Ireland. During the COVID-19 pandemic, the NHS faced significant pressure and has struggled since then in terms of staff, funding, and resources, as evidenced by trends on X. Ref. [
5] further highlighted the NHS staff’s feelings of betrayal by the government over inadequate Personal Protective Equipment and ineffective virus testing during the COVID-19 pandemic. Prior to the commencement of this study, Prime Minister Rishi Sunak announced on 4 May 2024 that the date for the UK prime minister elections was set for 4 July 2024. This announcement caused increased engagement on X regarding the NHS. Elections are when people decide the suitable candidate to handle the country’s affairs, and since the NHS is also affected by government policies, people took to X to air their opinions about the areas where the NHS is lagging, aspiring candidates and which parties they believed have the potential to implement beneficial policies for the healthcare system. This study, therefore, aims to analyze these NHS tweets.
Given the NHS’s centrality in political campaigns and policymaking, X became a prominent platform for expressing public sentiment about healthcare, government accountability, and electoral promises. This unique political context provides the motivation for our study: to systematically examine how people discussed the NHS on social media during a critical electoral period and uncover the underlying issues and sentiments that can be identified [
6].
Accordingly, the research pursues the following objectives:
To identify the overall public sentiment towards the NHS on X during the UK 2024 general election campaign.
To uncover major discussion themes through topic modelling, highlighting the intersection of healthcare and politics.
To perform fine-grained aspect-based sentiment analysis, identifying specific areas of concern or praise related to the NHS and policies.
These objectives are not simply methodological steps but rather avenues through which the research addresses questions of policy relevance (how public concerns can guide decision-making), institutional awareness (how the NHS is perceived by patients, staff, and citizens), and scholarly contribution (how sentiment analysis can be applied to politicised health discourse).
This work contributes in the following ways:
It provides timely insights into public sentiment towards the NHS within the context of a national election, where healthcare policy is contested.
It demonstrates how combining lexicon-based, machine learning, deep learning, and aspect-based sentiment analysis techniques can yield complementary perspectives on social media discourse.
It advances sentiment analysis research by highlighting the methodological challenges of politically charged data—such as imbalanced sentiment distribution and limited labelled datasets—and by suggesting ways to overcome them.
2. Literature Review
Topic modelling is a statistical method used to uncover hidden semantic patterns within a corpus, revealing underlying topics [
6]. The most widely used technique for this purpose is Latent Dirichlet Allocation (LDA). To assess the effectiveness of the model, the coherence value metric (c_v metric), which measures the consistency of the generated topics through coherence scores is employed.
Ref. [
7] analysed public discourse on X about COVID-19 vaccines from 11 March 2020 to 31 January 2021. Using a dataset from Georgia State University’s Panacea Lab, they prepared two batches for text mining and emotion analysis, removing emojis for text mining and converting them to text for emotion analysis. Stop words, including topic-specific ones, were removed. They identified 16 key topics, with vaccination opinions being the most prominent among them. Vaccine discussion trends shifted with development progress, and sentiment became increasingly positive over time, with trust emerging as the predominant emotion.
Ref. [
8] conducted research by collecting and preprocessing NHS-related tweets from 2013 to 2016. They developed a method to integrate social media sentiments into public healthcare service evaluations using the SERVQUAL (Service Quality) model. Using Latent Dirichlet Allocation (LDA) for topic modelling and clustering, they identified relevant tweets and classified them into SERVQUAL dimensions with machine learning algorithms. For sentiment analysis, they created a healthcare-specific dictionary (NHSdict) from NHS patient reviews, which they combined with the AFINN sentiment dictionary. The study effectively tracked public perceptions of NHS quality, offering a cost-effective tool for policy improvement.
Ref. [
9] conducted a study using Support Vector Machine (SVM), Naive Bayes (NB), and strength of association machine learning models, along with topic modelling, on feedback from the NHS Choices website. The study found that SVM achieved the highest accuracy at 85%. Topic modelling identified 30 distinct topics, revealing that topics related to maternity had a positive mean sentiment, whereas topics concerning waiting rooms had a negative mean sentiment.
While studies such as [
10] provided useful insights into NHS quality, they relied on traditional models and structured feedback, which restricts generalizability to dynamic social media discussions. By contrast, more recent sentiment analysis in domains like political debate [
10] and misinformation tracking [
11] have applied transformer-based methods, demonstrating superior performance in capturing nuanced sentiment and irony. This contrast underscores the methodological gap in NHS-related sentiment research, which this study addresses by employing more advanced models.
Beyond BERT, transformer variants such as RoBERTa [
12] and DistilBERT have achieved higher benchmarks in sentiment analysis by refining pre-training objectives. More recently, GPT-style generative models have shown promise in zero-shot and few-shot sentiment classification [
13], though their application in healthcare-specific contexts remains underexplored. Including these newer architectures as comparative baselines is increasingly common in recent sentiment analysis research ref. [
12]. Recent studies have benchmarked transformer variants such as RoBERTa and XLNet against BERT, with results consistently showing higher performance in nuanced sentiment detection across domains [
14]. In healthcare-related discourse, ref. [
15] automated large-scale service feedback analysis using transformer-based sentiment analysis, while ref. [
9] demonstrated the value of transformers in tracking health misinformation on X. Ref. [
14] further showed that GPT-based models outperform traditional fine-tuned transformers in few-shot sentiment classification tasks.
The previous research on sentiment analysis of NHS-related tweets did not account for the unique context introduced by political discussions at the time of this research. This, therefore, creates a distinct environment that has not been explored in earlier studies, making this research particularly relevant and timely. Furthermore, most existing studies have focused specifically on customer feedback regarding the NHS, mostly from review sites, which are more structured. This research, on the other hand, takes a broader approach by analysing tweets. This includes not only feedback from patients but also opinions from healthcare workers, policymakers, and the public who have encountered various aspects of the NHS. This comprehensive perspective is essential to capture the multifaceted nature of public sentiment towards the NHS and enhance the reliability of the sentiment analysis.
3. Research Methodology
According to [
16], sentiment analysis can be investigated at three different levels:
Document Level: This level classifies the overall sentiment expressed in an entire document as either positive or negative, with the assumption that the entire document conveys a single opinion.
Sentence Level: This level, to which X sentiment analysis, classifies the sentiment of individual sentences.
Aspect Level: This is a more fine-grained approach that identifies and evaluates the sentiment of specific aspects within the text.
Sentiment analysis can be approached through various methods; these are explained below:
Ref. [
18] further mentioned the ‘Rule-Based Approach’ as another approach to sentiment analysis. Regardless of the approach used, the sentiment analysis process generally consists of the following steps:
Problem Identification and Definition: This step is crucial as it allows for a clear definition of the problem and determination of the appropriate data needed.
Data Collection: This involves fetching relevant data from appropriate sources, using appropriate data retrieval techniques.
Data Preprocessing: [
14] explains that this involves transforming raw data into a format understandable by machines through the three steps illustrated below.
- ➢
Data Cleaning: During data cleaning, elements such as hashtags, URLs, username mentions and stop words (common English words) are removed as they do not contribute to sentiment identification. Emoji may also be removed or replaced by their corresponding text.
- ➢
Feature Extraction: [
14] states that the aim of feature extraction is to identify important features for training, and that various features, including sentiment features, syntactic features, semantic features, n-gram features and top word features, could be extracted. Ref. [
16] further emphasised that accurate classification results depend on the number of features extracted.
- ➢
Feature Selection: This step focuses on reducing the feature size to improve classification speed and accuracy.
Classification: This step involves classifying texts using different approaches, into predefined categories, which can be binary, ternary, or multiclass.
Evaluation: Machine learning models are usually evaluated using metrics such as accuracy, precision, recall and F1-score to determine their performance and identify options for possible parameter tuning.
Presentation of Output: This involves presenting the results of the analysis in a meaningful and illustrative format.
This structured approach ensures that the sentiment analysis process is systematic and effective in extracting and classifying sentiments from textual data.
3.1. Data Collection
Data collection was conducted using the X Search API, targeting trending hashtags related to the NHS (#NHS, #NHSFunding, #SaveOurNHS) at the time of access. This yielded a total of 35,000 tweets. Data was sourced exclusively from public profiles to minimise intrusion into personal privacy. Continuous efforts were also made to respect user preferences and rights, ensuring that all aspects of the research process were conducted responsibly and ethically, in accordance with X’s Terms of Service and its user privacy and data usage policy.
3.2. Data Preprocessing
The preprocessing of the collected tweets involved several stages to ensure the data was suitable for sentiment analysis:
1. The term “NHS” was removed due to its high frequency across tweets, which could bias the analysis.
2. Punctuation marks, URLs, and hashtags were removed as they do not aid in sentiment identification.
3. Emojis were converted to their textual equivalents to better capture the sentiment conveyed, given their role as non-verbal indicators of emotion.
4. Stop words were both retained and removed in separate analyses for comparative purposes.
5. Mentions were initially retained to identify frequent mentions in tweets and were later removed for the overall sentiment analysis.
6. Text was converted to lowercase to ensure uniformity.
7. Sentences were broken down into tokens and reduced to their root form (lemma) using the ‘en_core_web_spacy’ model.
9. Posts that were rendered empty following preprocessing were discarded.
10. A subset of data was manually labelled using a stratified random approach for training traditional machine learning algorithms and BERT. Tweets clearly identified as Positive, Negative, or neutral were randomly selected, avoiding ambiguous cases. The labelled dataset was limited in size, and the sentiment distribution was imbalanced, with a prevalence of negative tweets due to their distinct nature (
Figure 1). To create a labelled dataset for supervised sentiment analysis, a manual annotation process was carried out by three postgraduate researchers with prior experience in social media data analysis. Each annotator received a detailed guideline document outlining the definitions and examples of Positive, Negative, and Neutral sentiment to ensure consistency. Using a stratified random sampling strategy, tweets were selected to represent a balanced distribution across sentiment categories, with ambiguous cases excluded. Annotators independently labelled the tweets using a secure platform, and inter-annotator agreement was assessed using Cohen’s κ, which yielded a score of 0.78—indicating substantial agreement. Tweets with conflicting labels were reviewed collectively, and final labels were assigned through a discussion and consensus process. The resulting curated dataset was used to train traditional machine learning models and a BERT-based classifier, with sentiment distribution visualised to highlight class imbalance, which was subsequently addressed using SMOTE. The size of the labelled dataset (approximately 3000 tweets), TF-IDF parameters having max_features = 10,000, n_gram range = (1, 2), min_df = 5), and the grid search space used for hyperparameter tuning. Class weights were set to balance to address class imbalance during training. For the BERT-based model, we used the bert-base-uncased checkpoint with a maximum sequence length of 128 tokens. The model was fine-tuned for 4 epochs using the AdamW optimiser with a learning rate of 2 × 10
−5 and weight decay of 0.01. Early stopping was applied with a patience of 2 epochs based on validation loss, and a fixed random seed (seed = 42) was used to ensure reproducibility. These additions aim to enhance the transparency and reproducibility of the training process.
11. Addressing Class Imbalance: Synthetic Minority Over-sampling Technique (SMOTE) was applied to the labelled dataset to address class imbalance. To address class imbalance in the labelled dataset, we applied the Synthetic Minority Over-sampling Technique (SMOTE), adjusting the k_neighbors parameter based on the size of the minority class to avoid overfitting. The resampled data was split into training and validation sets, and model performance was evaluated on the balanced validation set to ensure fair assessment across sentiment classes.
12. Feature Extraction: Both labelled and unlabelled datasets were transformed using Term Frequency-Inverse Document Frequency (TF-IDF) to convert text data into numerical features suitable for the traditional machine learning models.
For this research, both lexicon-based and machine learning approaches were investigated and experimented with.
Lexicon-Based Approaches
- -
VADER: This is specifically designed for sentiment analysis in social media contexts. It handles the nuances of social media language, including slang, emoticons, and acronyms, providing a reliable measure of sentiment in tweets [
19].
- -
TextBlob: This tool is used in sentiment analysis due to its simplicity and effectiveness. It provides both polarity (Positive, Negative, or Neutral sentiment) and subjectivity (the degree of opinion) scores. These were applied to the raw, unlabelled, yet pre-processed dataset, whilst retaining and removing stop words. Sentiment distribution on the test data was visualised and analysed for the two models.
3.3. Training and Tuning
Machine learning and ensemble models were trained and evaluated on labelled data. Classification reports were collected, visualised, and predictions were made on the test dataset. Models were further optimised using grid search and assessed through cross-validation. Sentiment distribution on the test data was then aggregated and analysed.
Hyperparameter tuning was performed using grid search with 5-fold cross-validation. For Naive Bayes, alpha values ranged from 0.01 to 10; for Logistic Regression, C values ranged from 0.01 to 10 with penalty options of l1 and l2; and for SVC, C ranged from 0.01 to 10 with kernel options of linear and rbf.
For the BERT model, the fine-tuned model was saved, loaded, and further experimented on by tuning all hyperparameters. BERT-based model used the bert-base-uncased checkpoint from Hugging Face Transformers, with a maximum sequence length of various tokens and training conducted over a particular number of epochs. The model was evaluated on the validation dataset and used to predict on the test data. Metrics such as accuracy, precision, recall, F1-score, and AUC were chosen for evaluation due to their comprehensive ability to assess the performance of sentiment analysis models.
4. Descriptive Statistics
4.1. Overview of the Collected Data
The data for this study was collected from X using the X Search API. Although the aim was to gather data spanning several weeks, high traffic from election announcements and party manifestos limited the data to 13–15 June 2024 as shown in
Table 1. Political party hashtags frequently appeared alongside NHS hashtags, indicating the significant intersection of politics and health, as government policies impact all sectors.
A total of 35,000 tweets was collected. The distribution of fetched tweets per day is seen in the table below.
The dataset includes various metadata such as tweet ID, timestamp, user ID, tweet content, and number of retweets and likes.
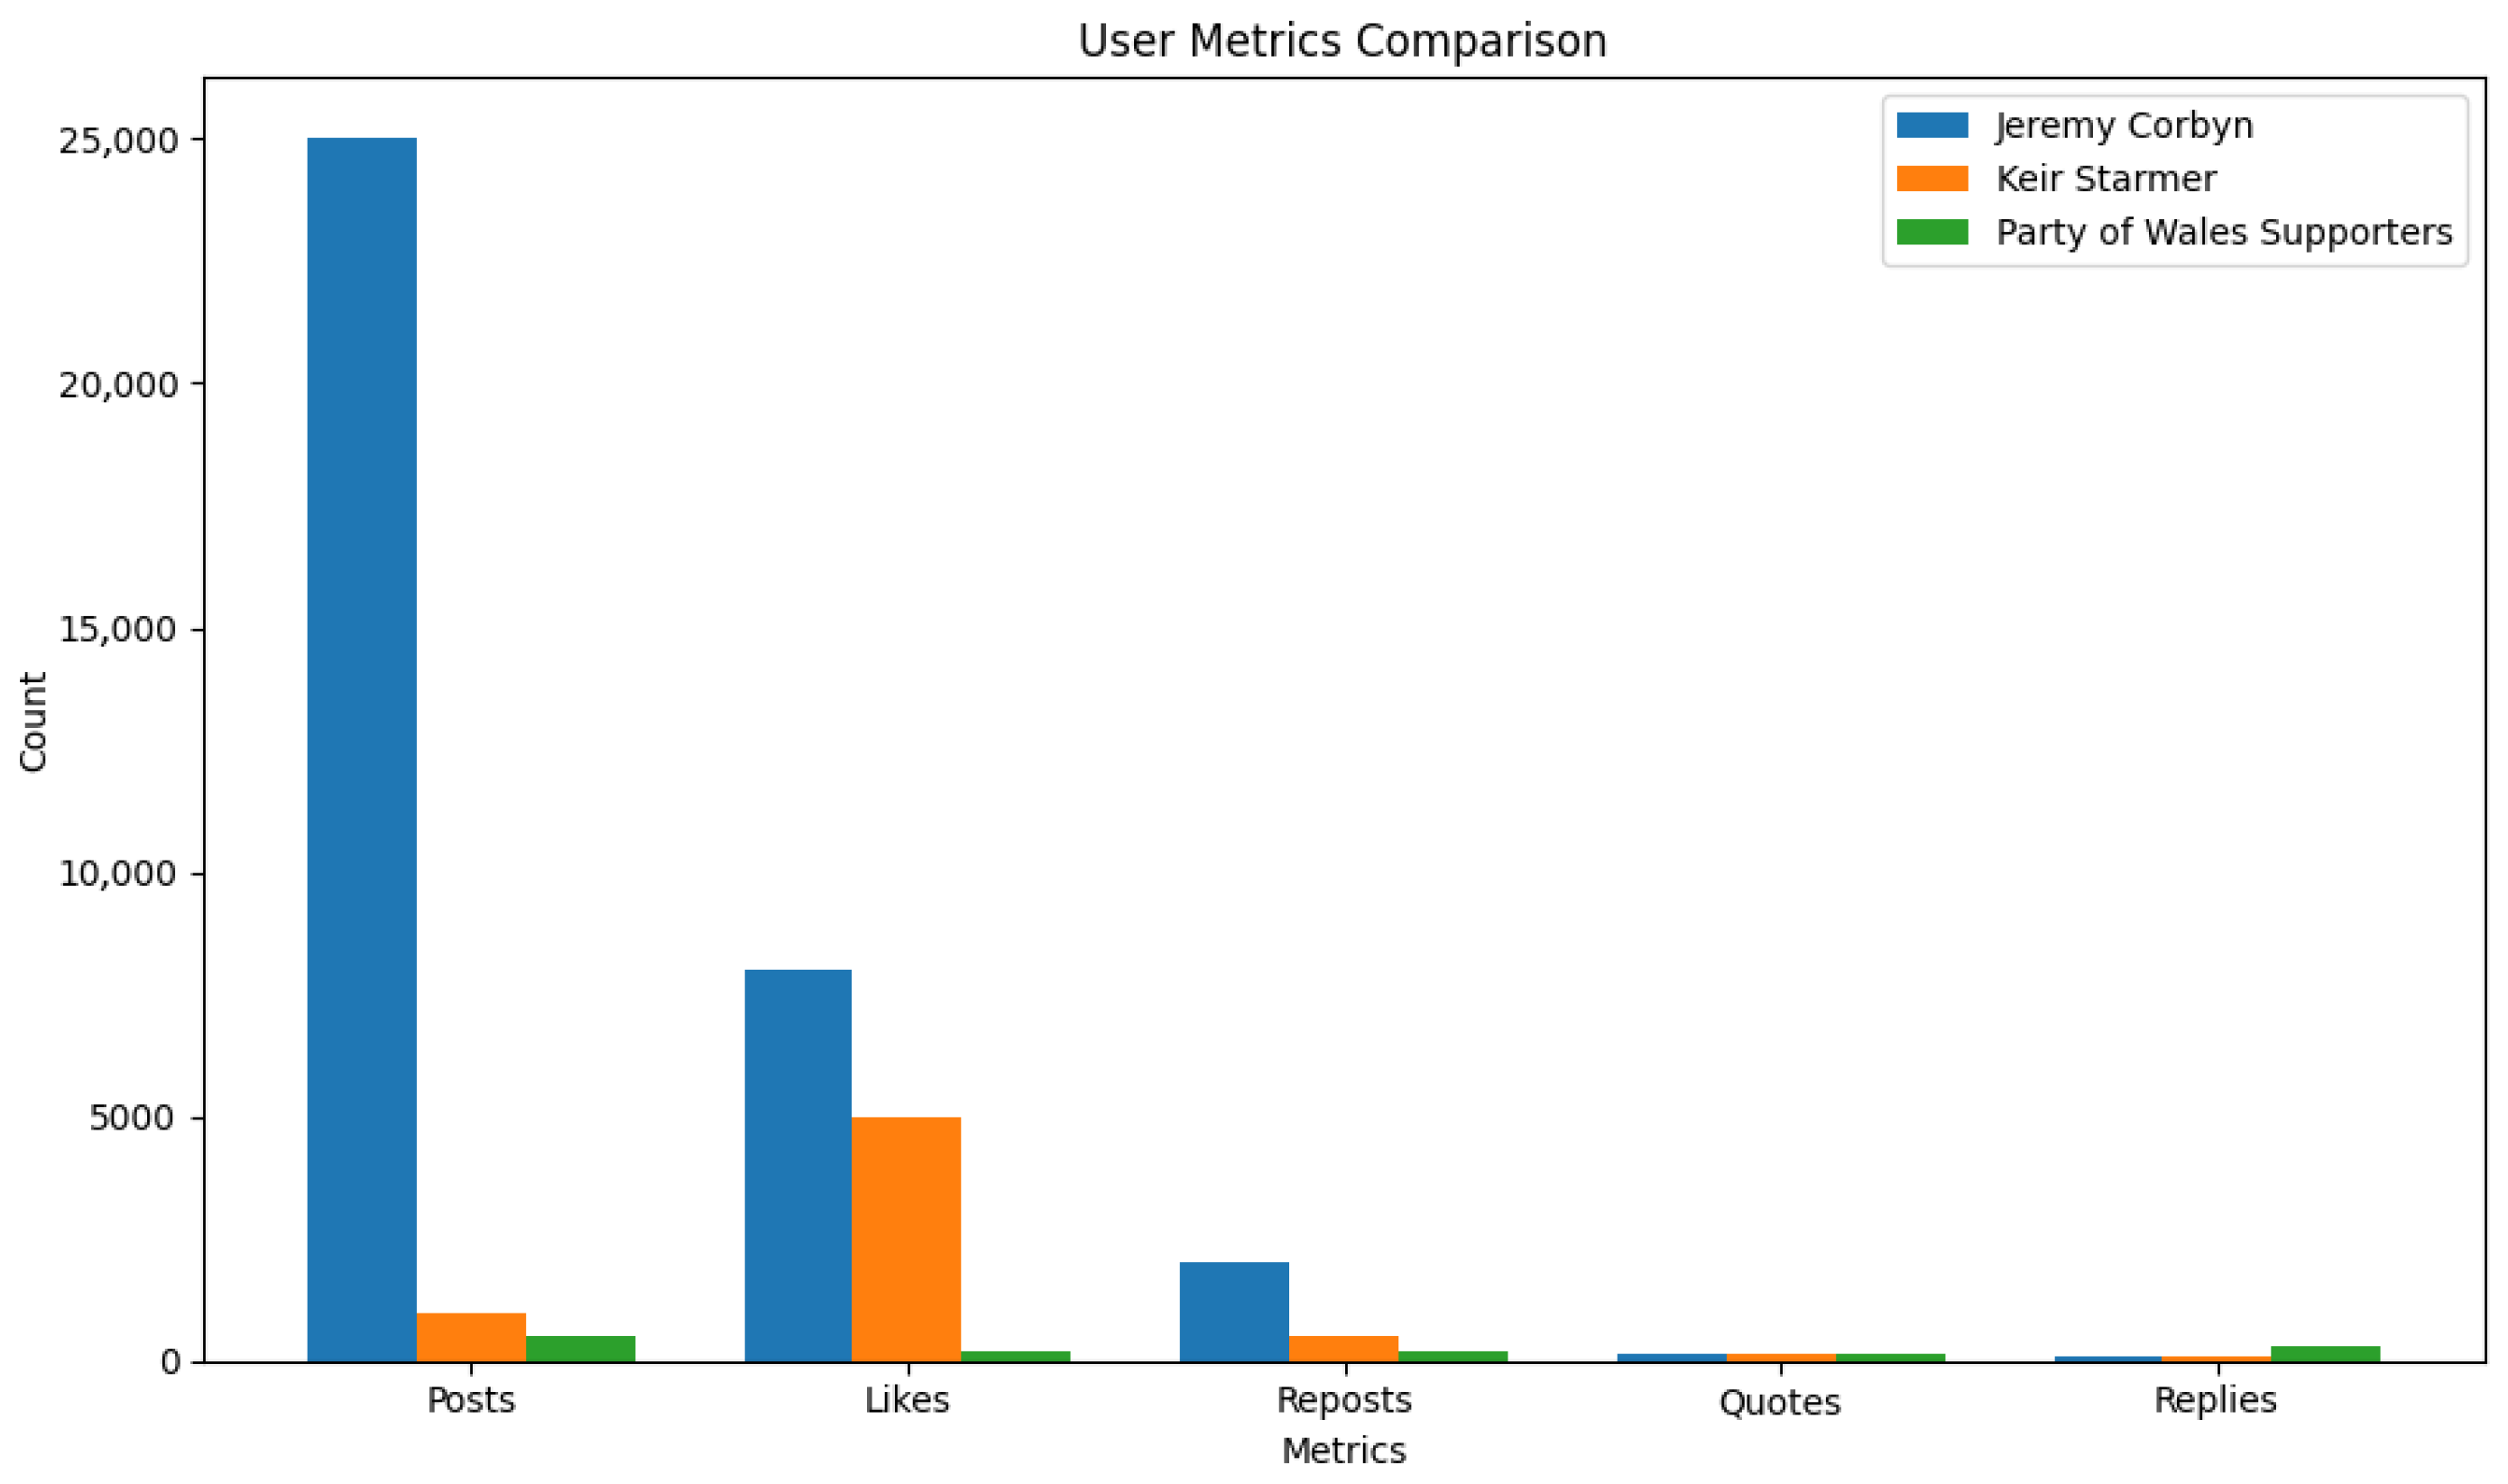
The dataset contains posts from 20,729 unique users. Among these, the group “Party of Wales Supporters” contributed the highest number of posts, totalling 189. In terms of engagement, Jeremy Corbyn had the highest total likes and reposts (
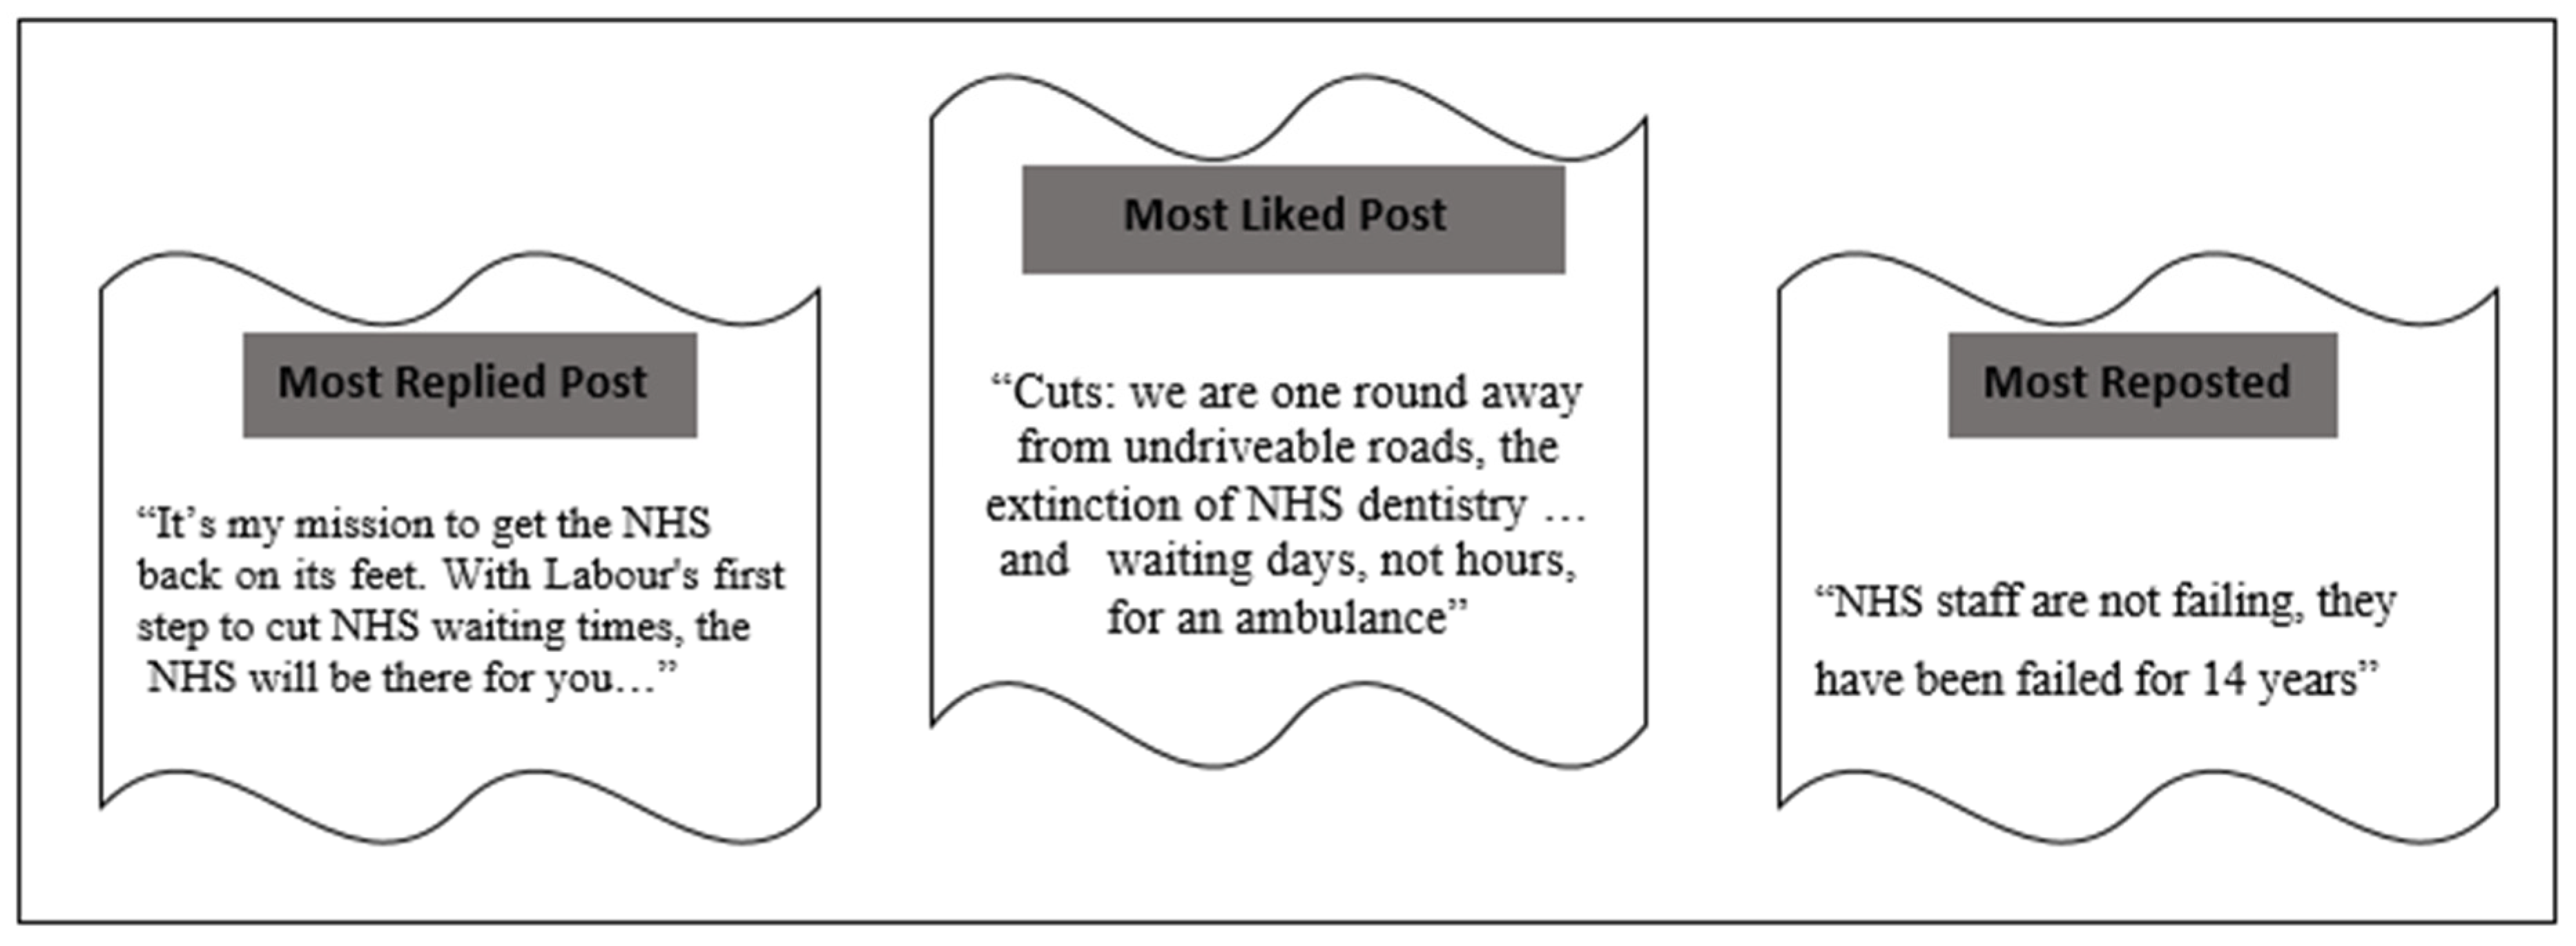
Figure 2). At the time of data retrieval, he was representing the Islington North Constituency of London and was aiming to retain his position as an independent Member of Parliament. Keir Starmer, who at the time of data retrieval was the leader of the Labour Party and an aspirant for the Prime Minister position in the UK, had the highest total quotes and replies. His most replied-to post discussed Labour’s plan to reduce NHS waiting times.
Figure 3 explicitly highlights the most replied, liked and reposted posts.
Furthermore, @UKLabour was the most frequently mentioned handle in the data corpus, indicating significant presence and engagement related to the Labour Party.
Sentiment analysis results
Machine learning models
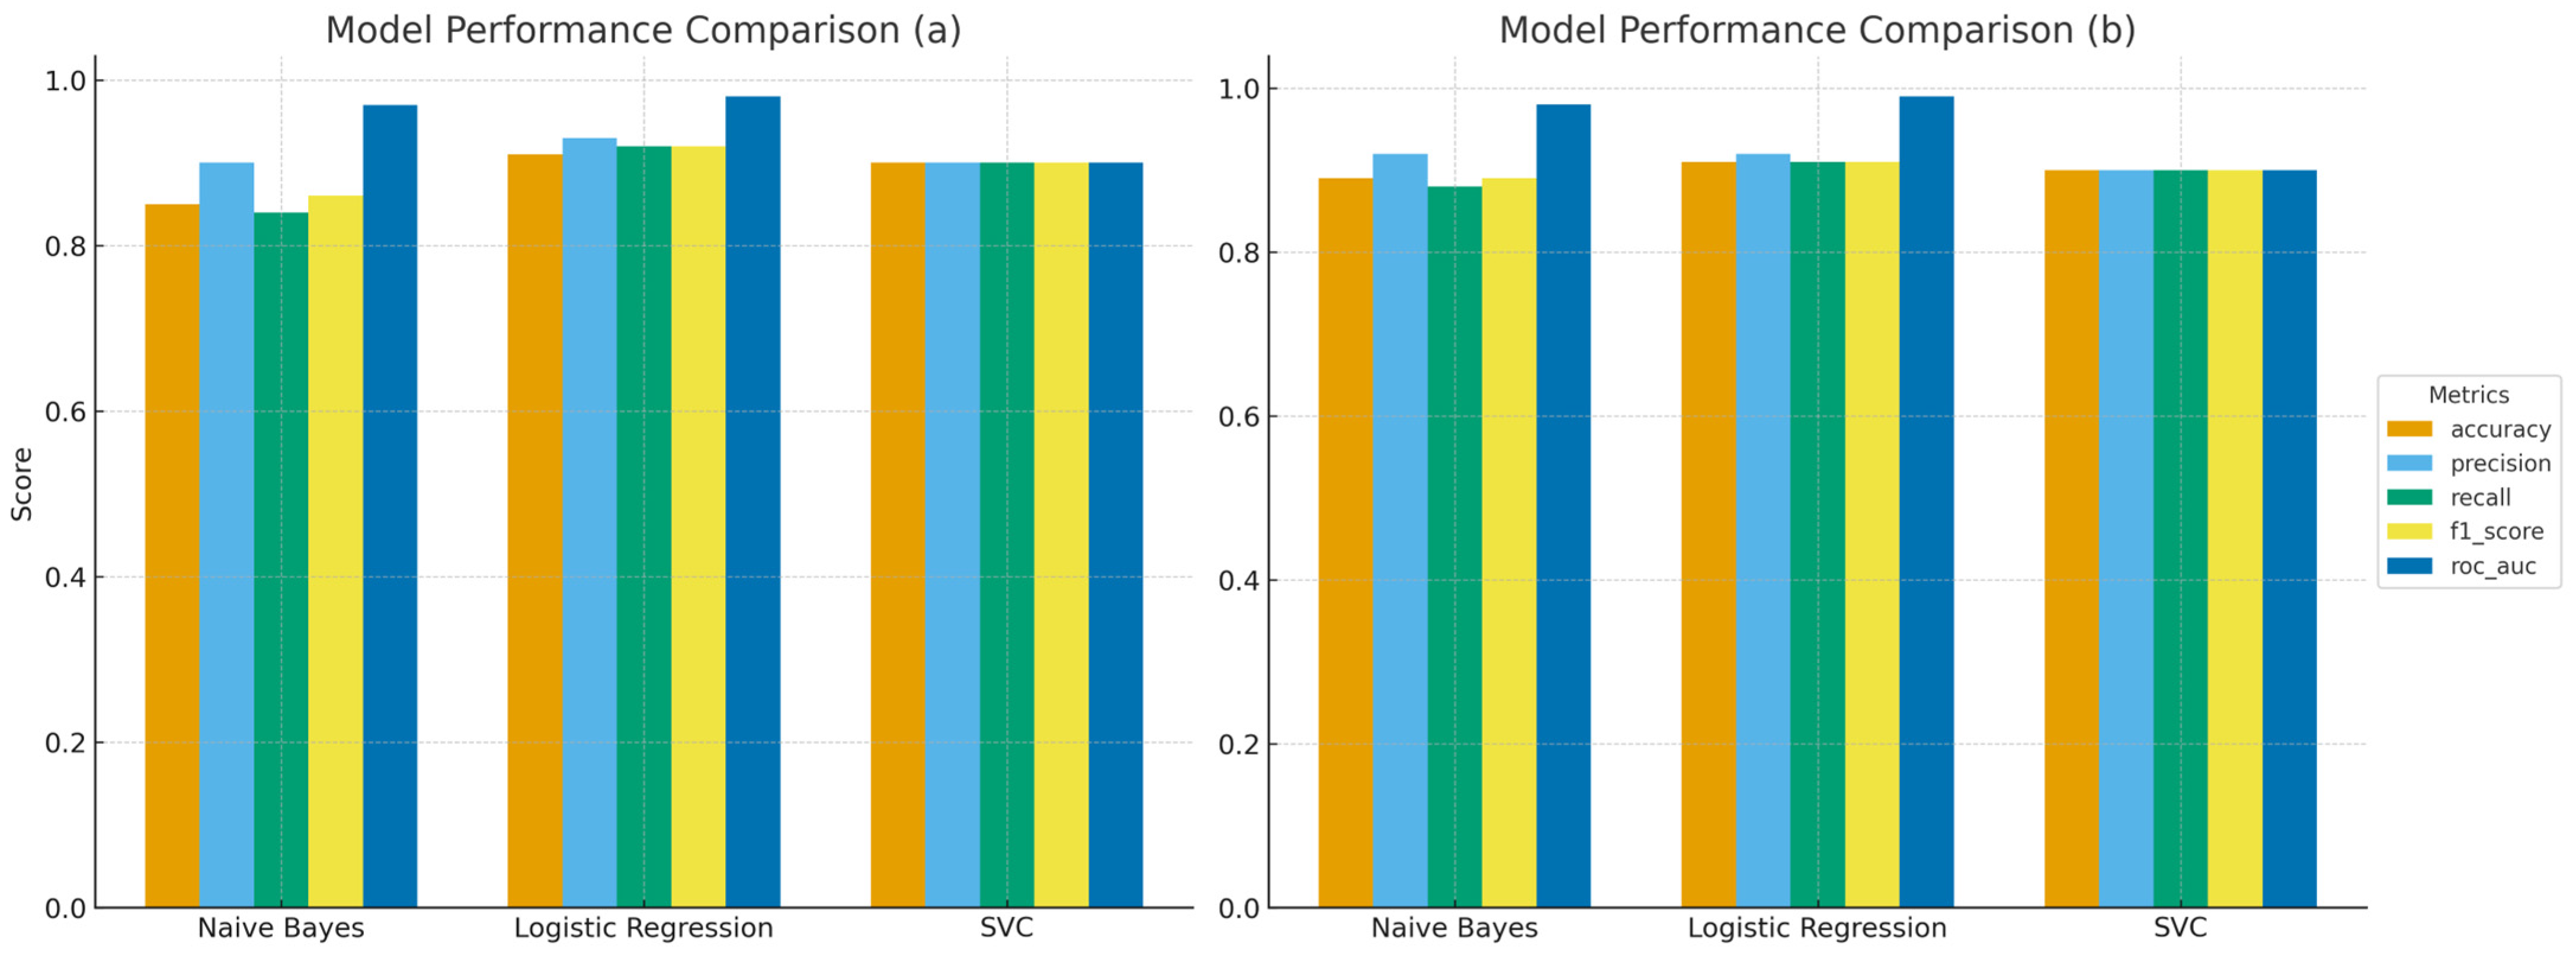
The summary classification report of the traditional machine learning models on the validation dataset is presented in
Figure 4 below.
Due to the lack of ground truth for the test data, the performance of the models could not be evaluated. However, the test dataset had the following sentiment distribution for both the untuned and tuned traditional models (
Table 2).
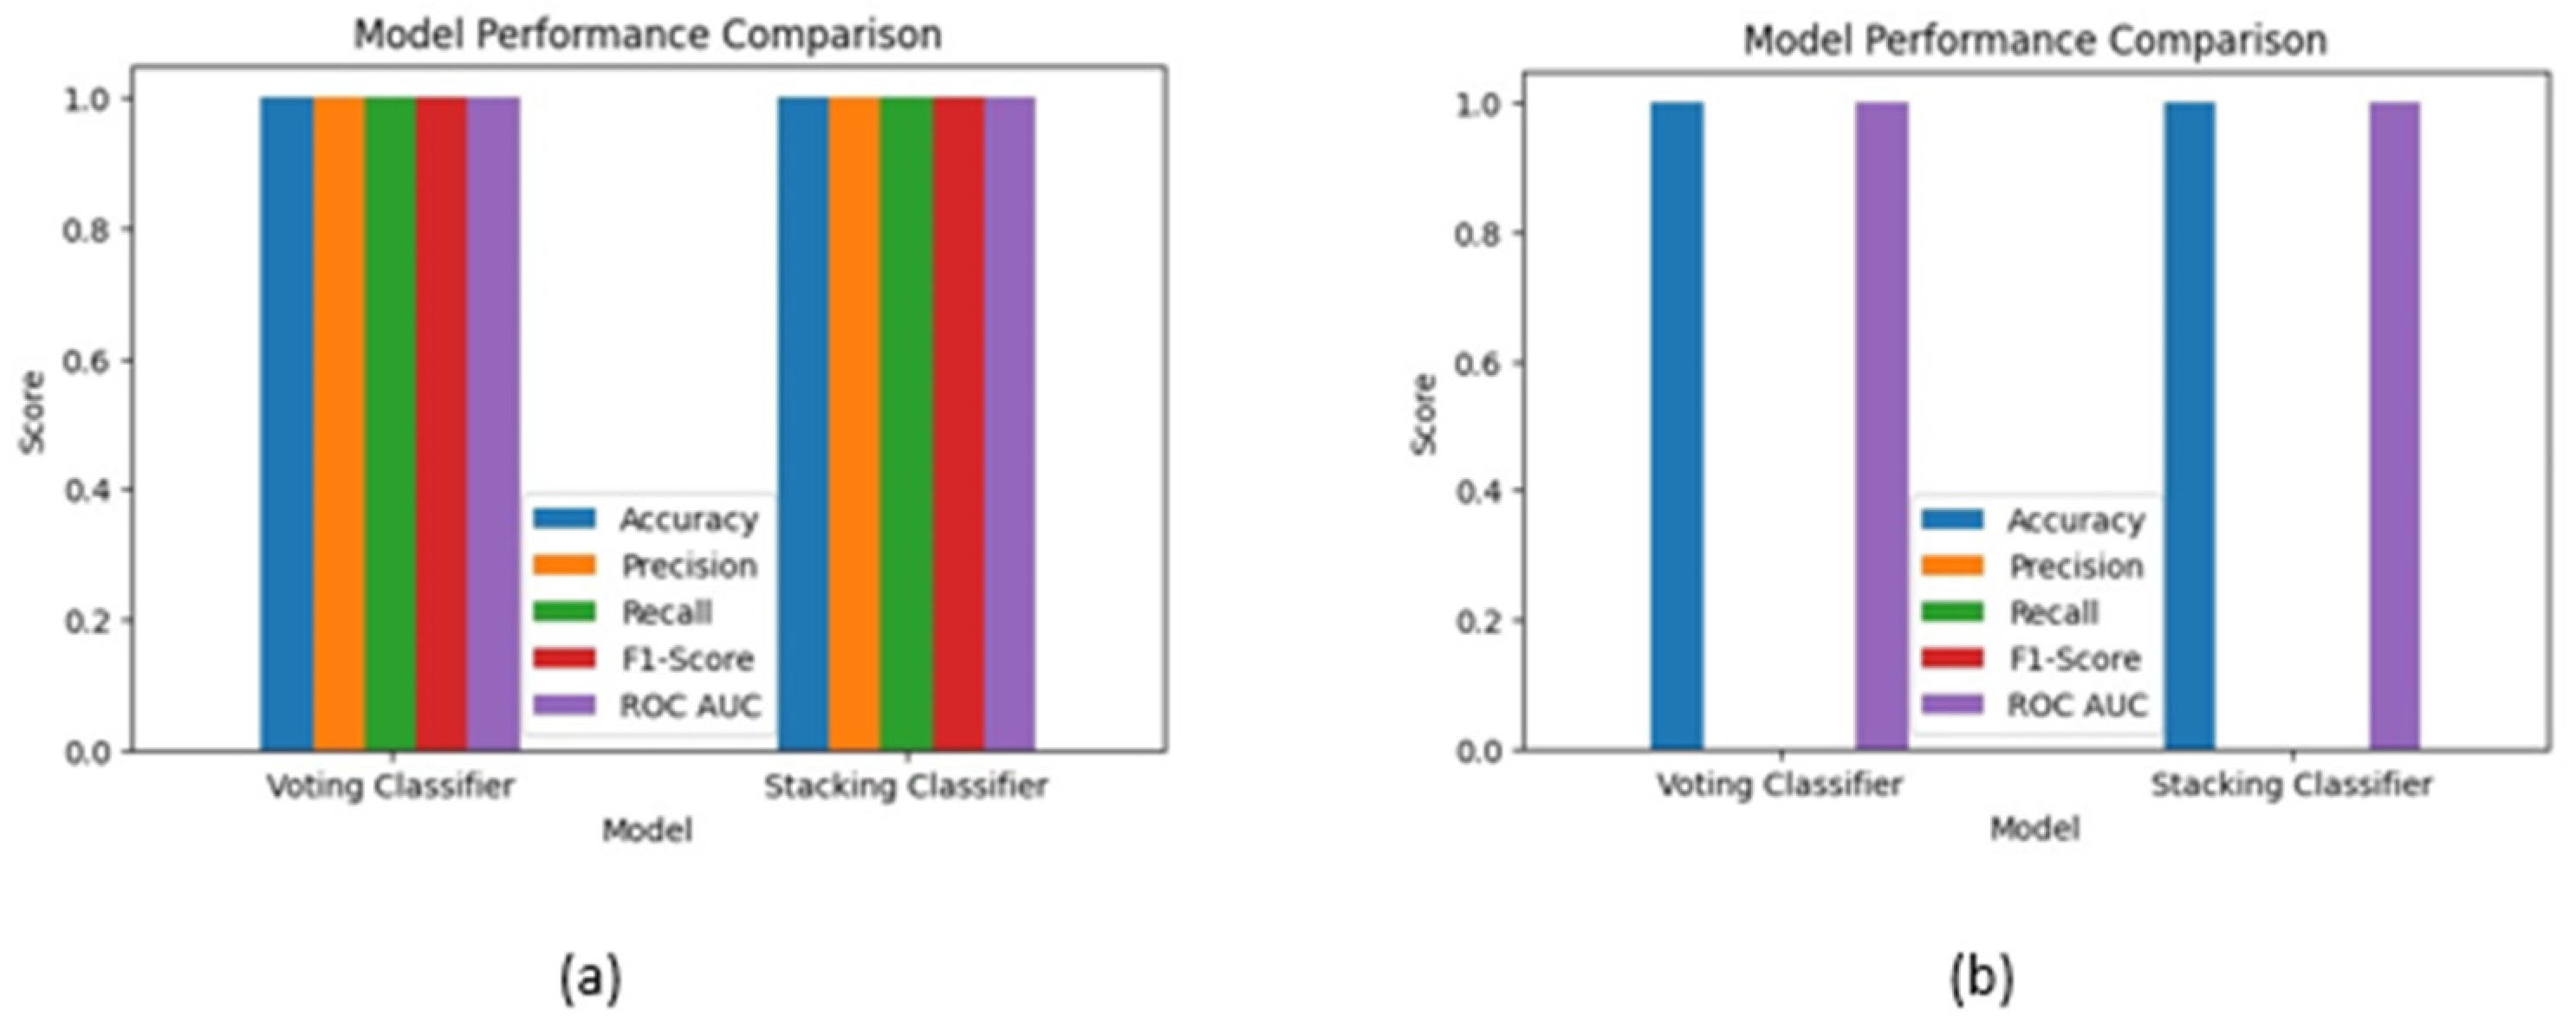
For ensemble models, weights were assigned based on individual model performance during cross-validation. Logistic Regression, which consistently outperformed other models, was given a higher weight in the voting scheme (2:1:1), ensuring its influence was proportionally reflected in the final predictions. The summary classification report of the ensemble model on the validation data and the summary sentiment distribution on the test data are seen in
Figure 5 and
Table 3 below.
The BERT classification model achieved an accuracy of 73% on the validation dataset with and without tuning (
Table 4). Its summary sentiment distribution on the test data in
Table 5 further shows that the model could not classify positive tweets.
4.2. Lexicon-Based Models
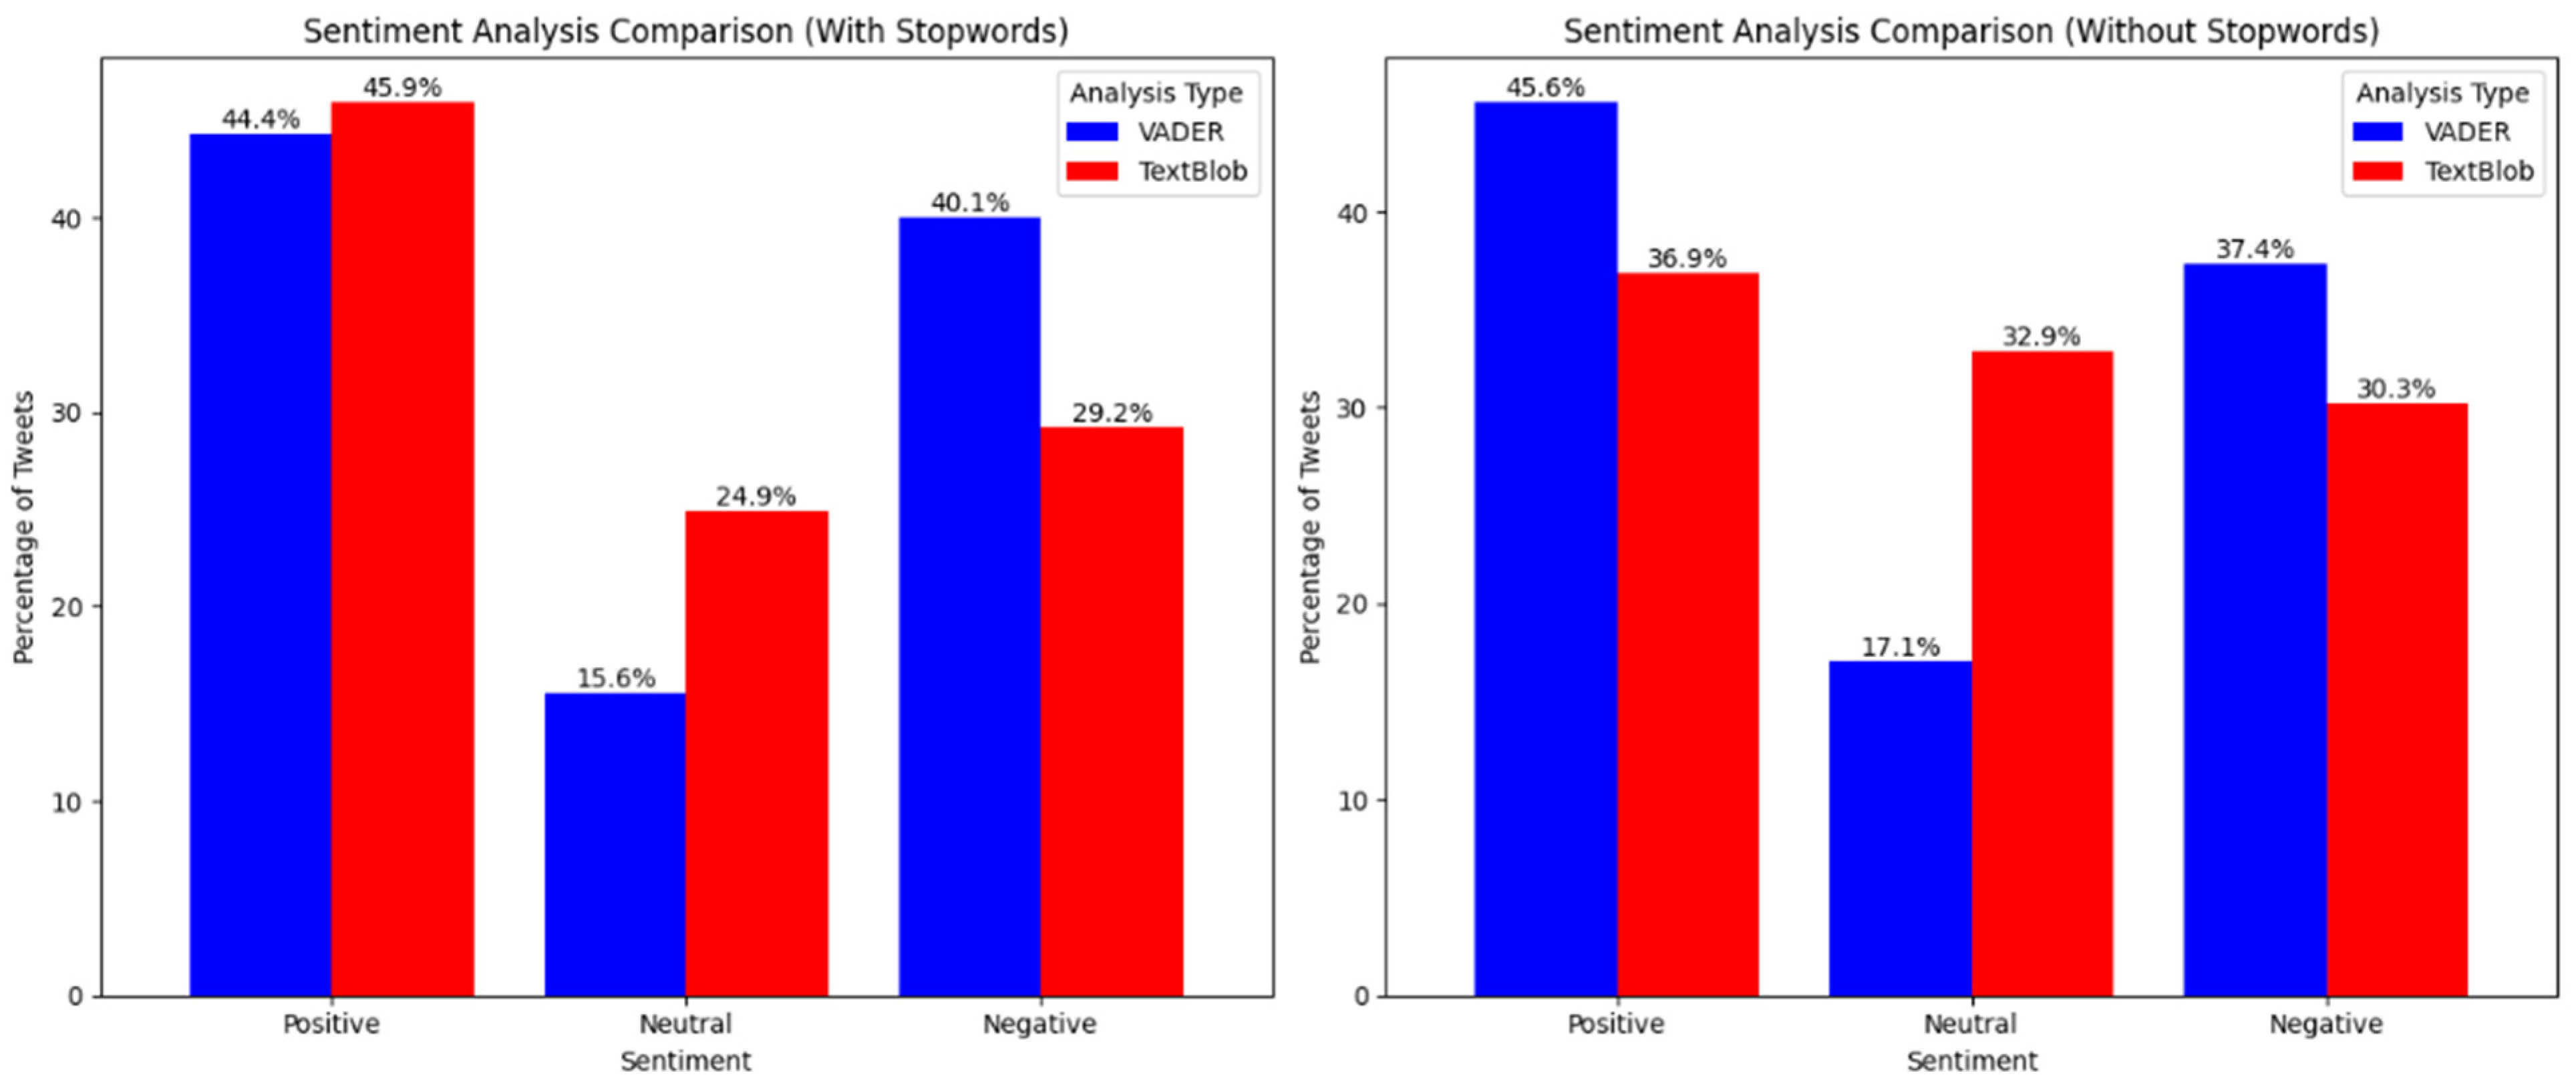
The resulting sentiment distribution of the lexicon-based approach is illustrated in
Figure 6 below.
4.3. Topic Modelling
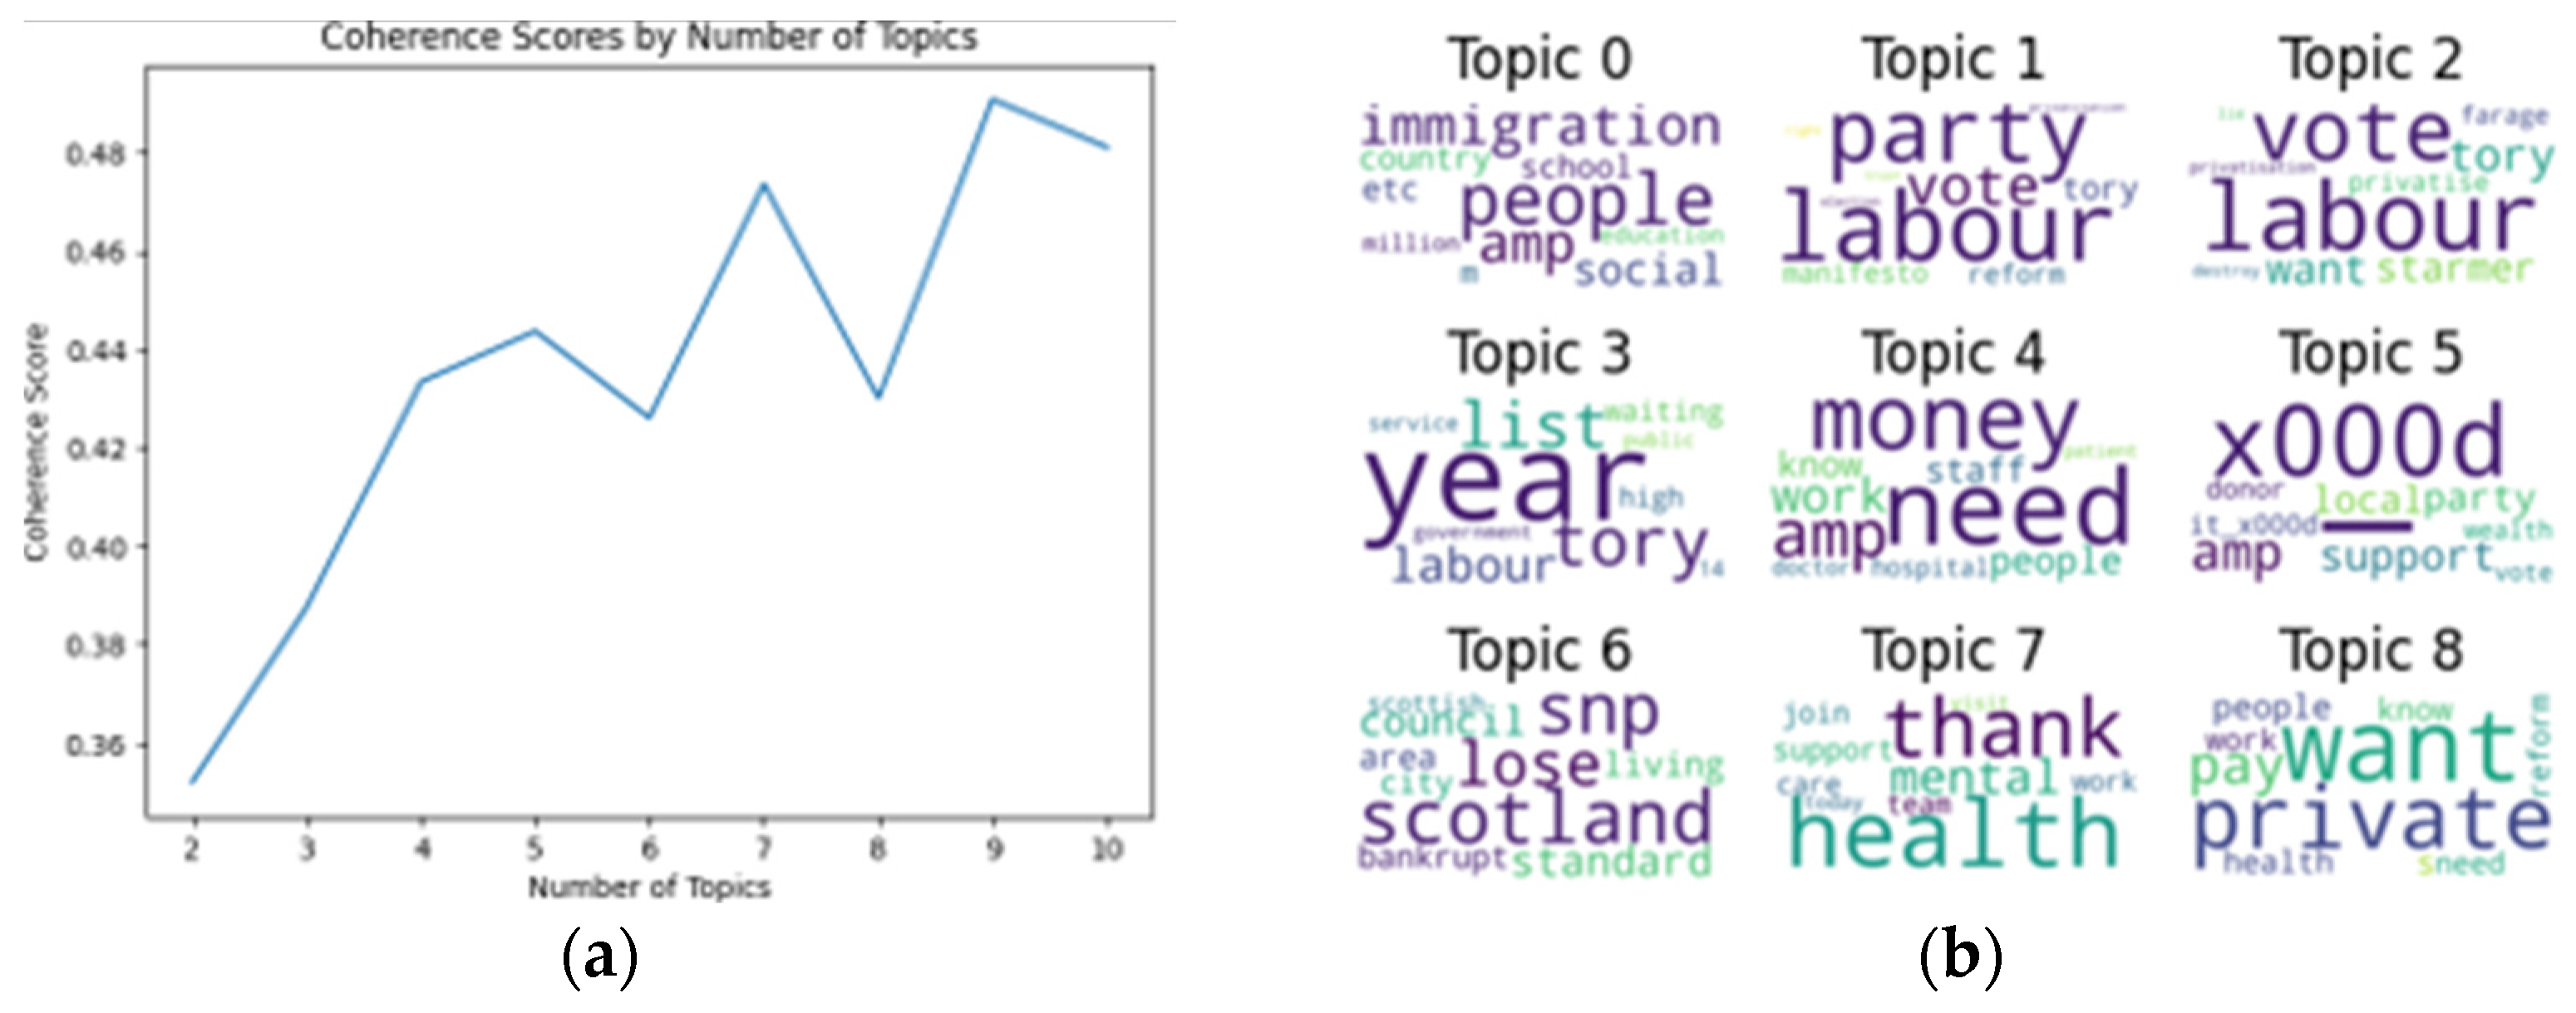
Figure 7 illustrates the optimal number of topic clusters identified by the model and some top words associated with the identified topics.
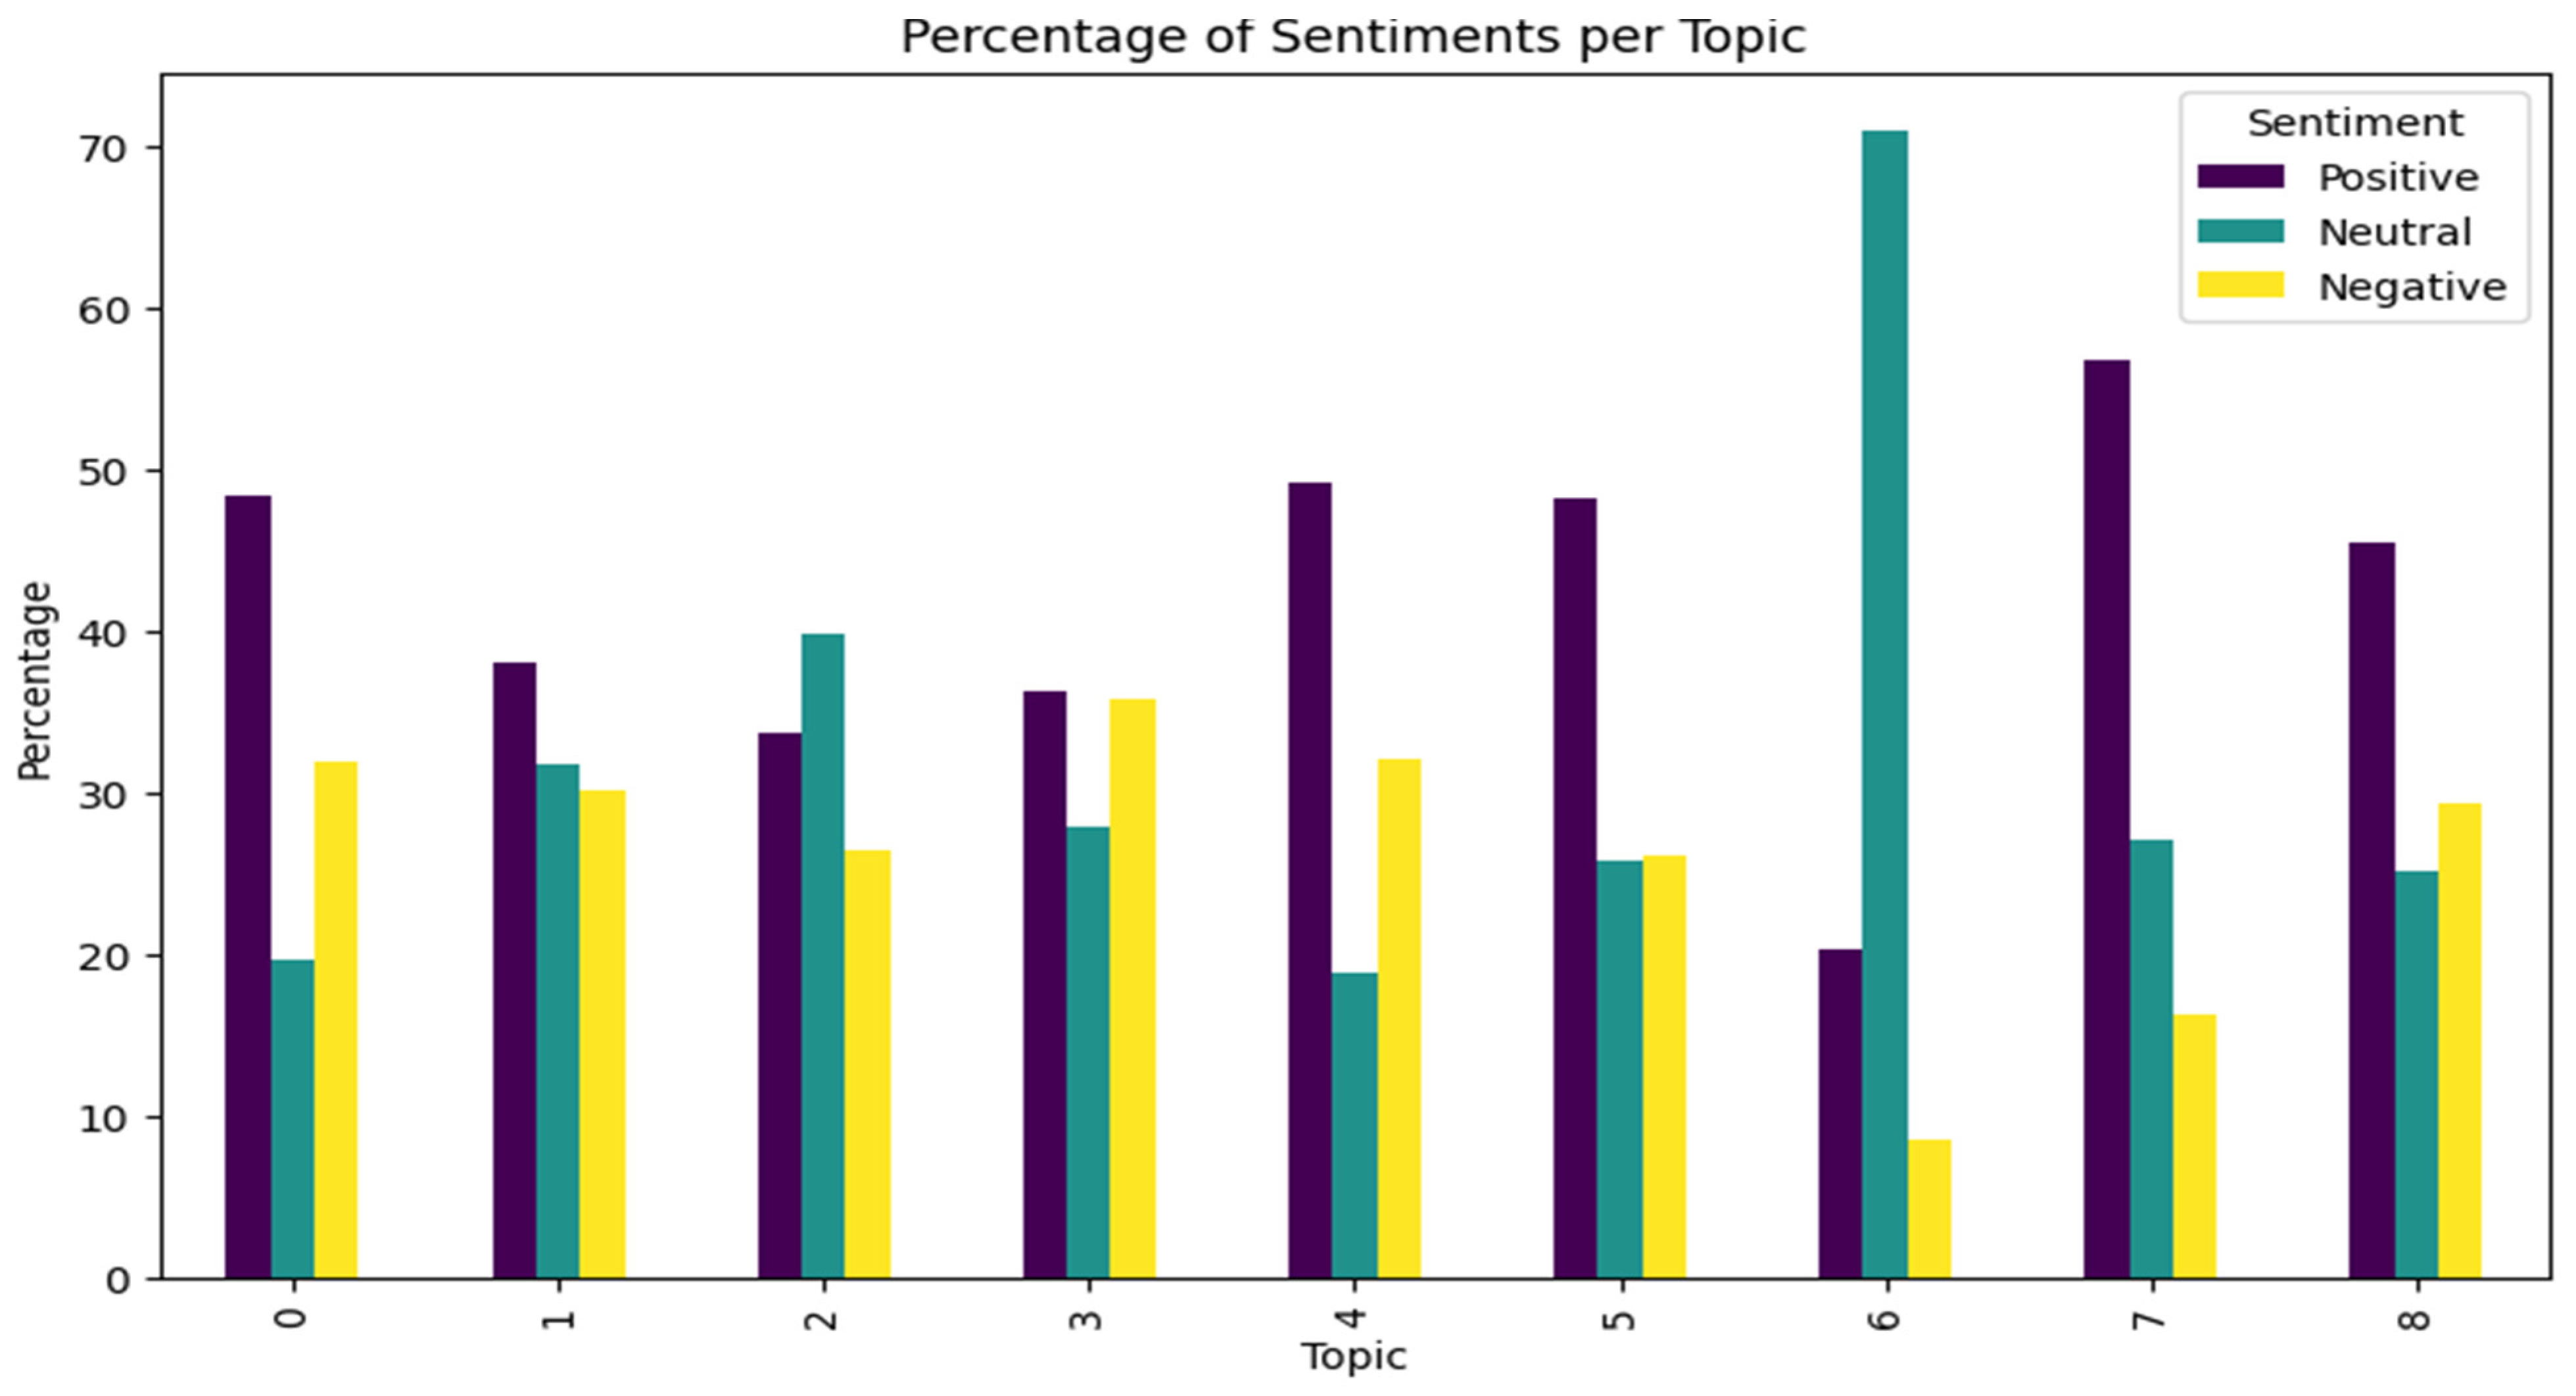
Figure 8 shows the percentage distribution of sentiment classes for each identified topic cluster.
4.4. Aspect Analysis
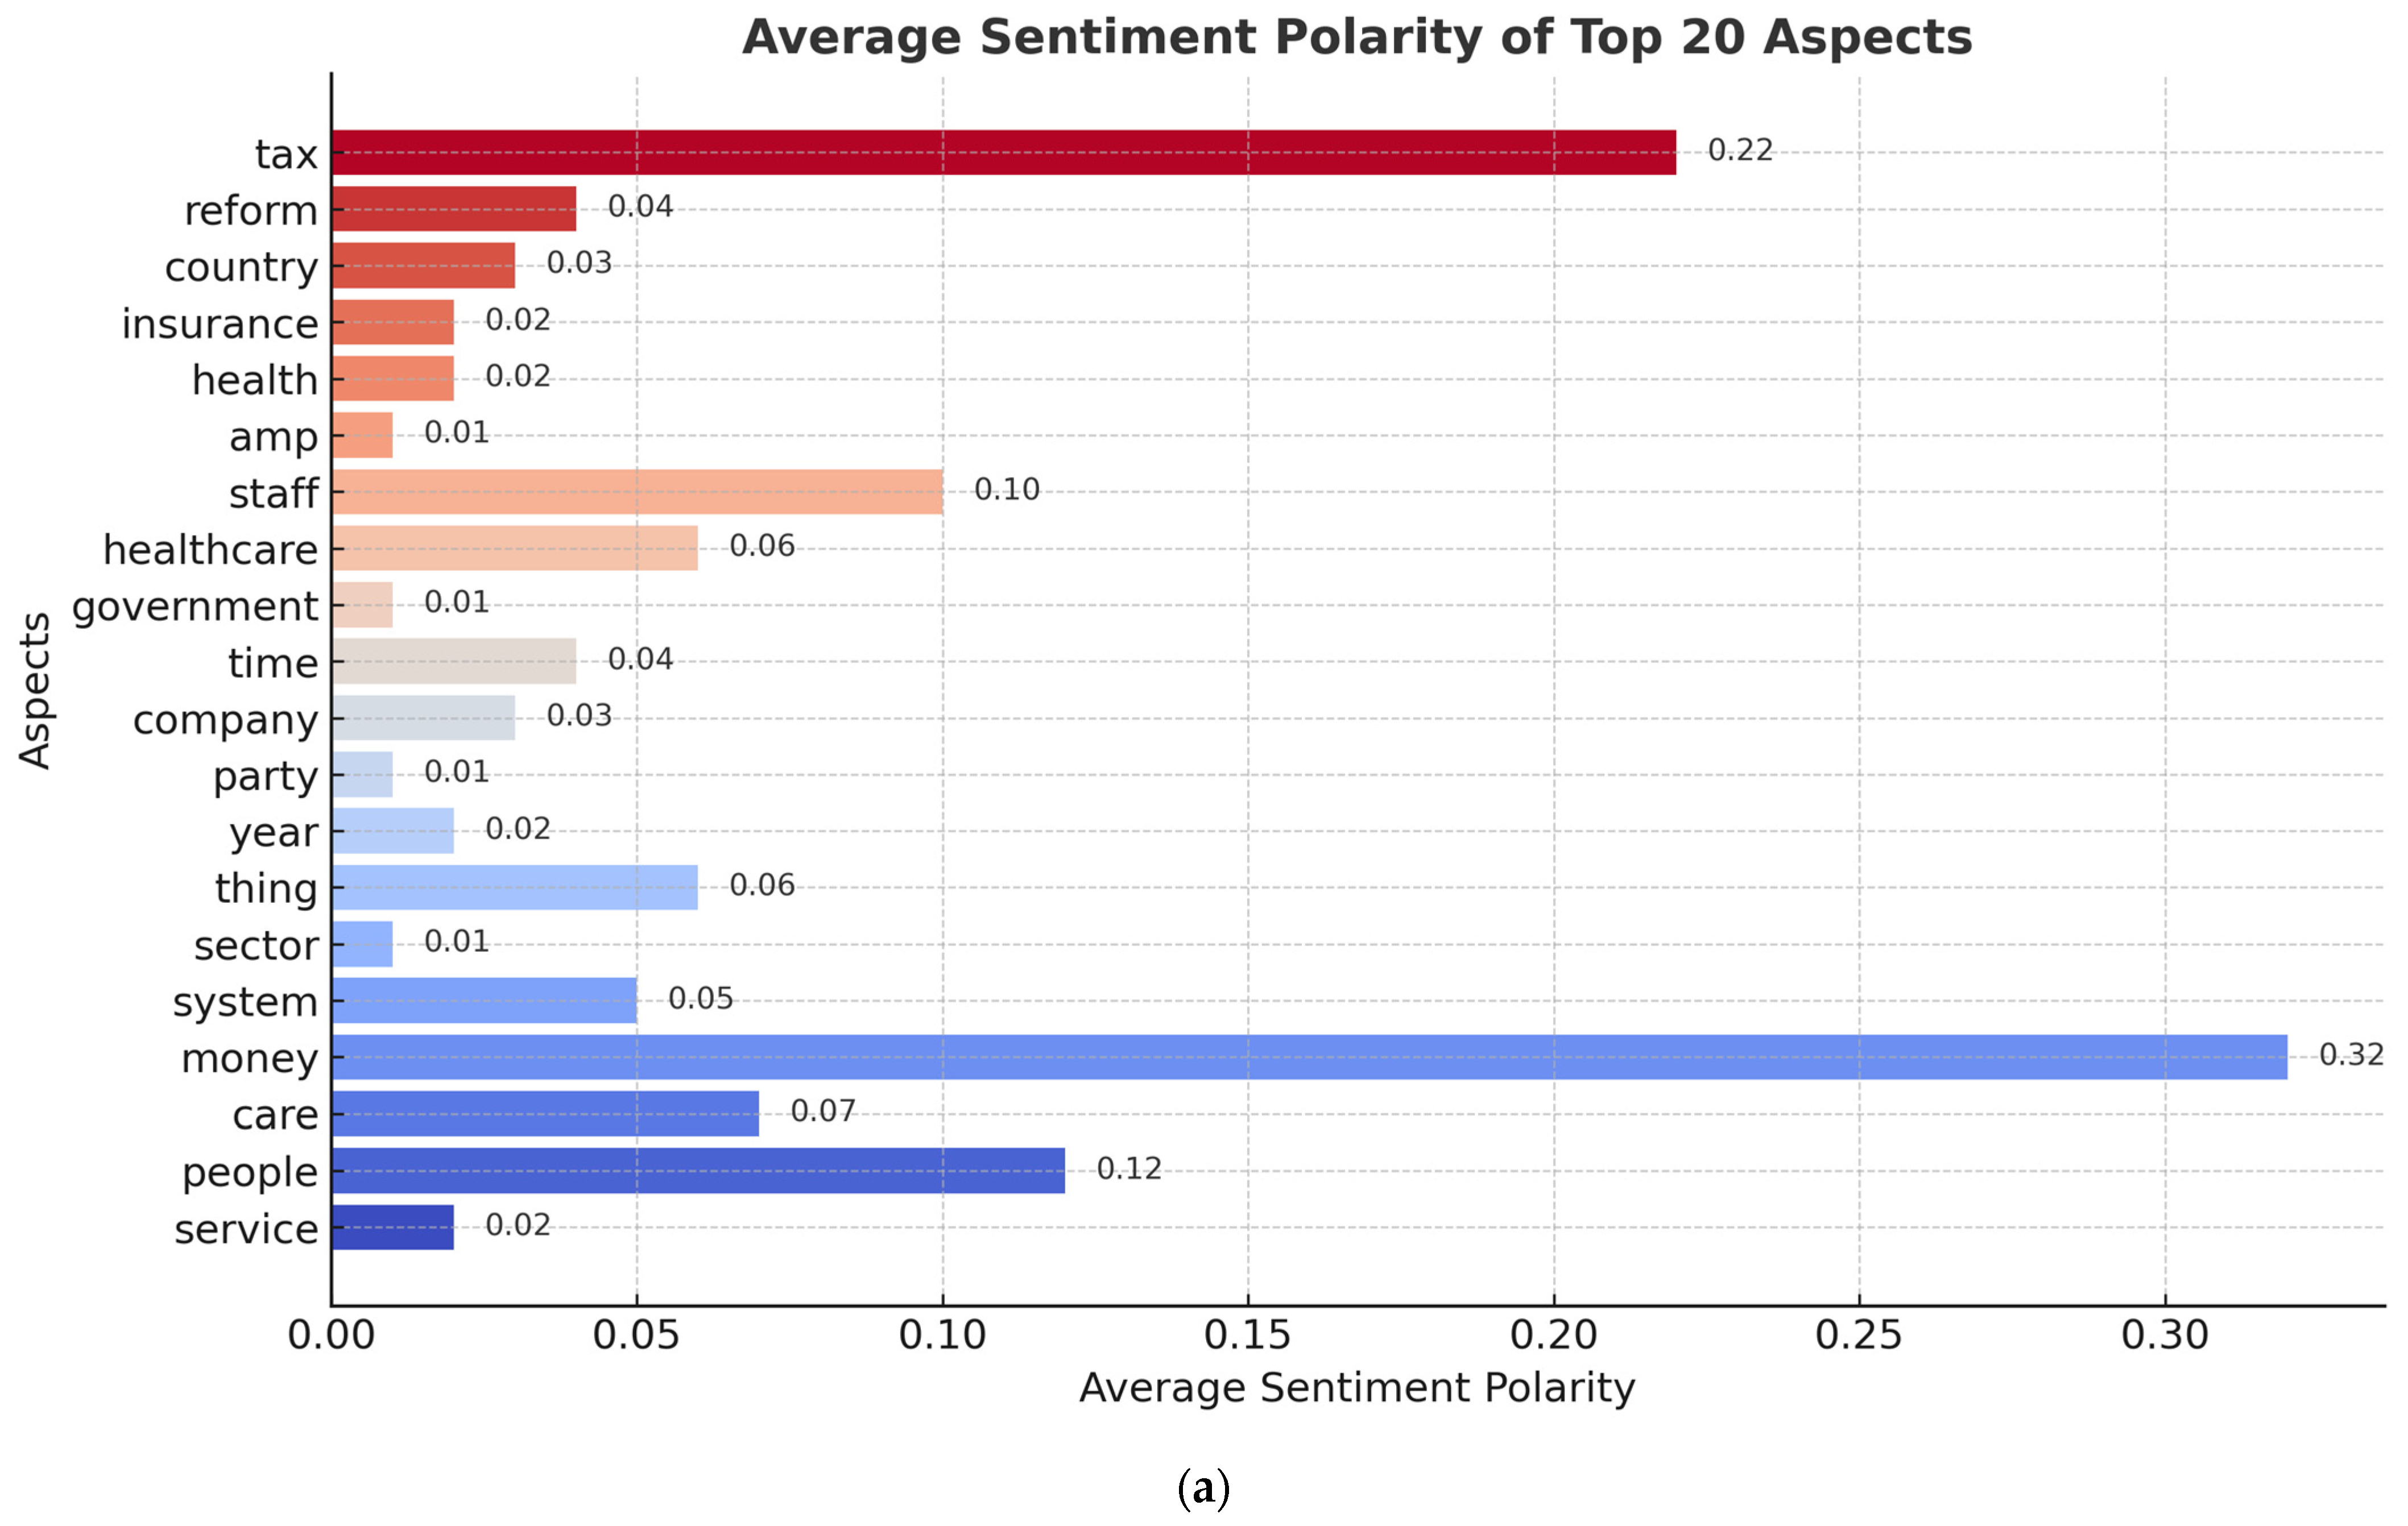
Several aspects were identified, but the topmost mentioned aspects and the average sentiment polarity of all the tweets containing them are illustrated in
Figure 9a below.
Table 6 also illustrates some identified aspects, sentiment words identified with them, and their polarity.
The performance and features of several sentiment analysis models applied to tweets about the NHS are compiled in
Table 7a,b. Machine learning and deep learning models provide quantitative performance measures, whereas lexicon-based methods (VADER, TextBlob) provide qualitative sentiment distributions. BERT captures rich contextual meaning, and ensemble approaches combine several models to increase accuracy.
Expressions of gratitude to NHS employees underline the value of worker morale, while themes such as waiting lists, immigration, staffing shortages, and funding cuts draw attention to discontent with service delivery and resource distribution. These observations provide valuable insights for developing responsive healthcare policies. Overall, the sentiment and topic modelling results demonstrate that public discourse about the NHS on X cannot be separated from broader political and social concerns. Issues such as waiting lists and immigration resonate with concrete policy debates, while positive sentiments towards staff underscore the enduring social value attached to the NHS as an institution.
5. Results Discussion
5.1. Interpretation of Results
Overall, the models performed well on the validation set, with the BERT model achieving an accuracy of 73%, which is the lowest compared to other models (
Table 7b). On the surface, this appears reasonable, but a closer look at the class-level performance reveals a critical limitation: BERT never predicted any positive sentiment instances. As a result, its precision, recall, and F1-score for the positive class are undefined. Following standard reporting practice, we report these values as N/A to highlight the model’s complete failure on that class. This discrepancy illustrates the danger of relying solely on accuracy, since the model’s relatively high overall accuracy masks its inability to capture positive sentiment. This result contrasts with the findings of [
20], who concluded that deep learning models generally outperform traditional and lexicon-based approaches in sentiment analysis. However, deep learning models often require large amounts of training data to capture contextual nuances effectively. The limited data available in this study may have therefore impacted the performance of the BERT model, restricting its ability to learn and generalise from contextual information. Lexicon-based approaches like VADER and TextBlob rely on predefined dictionaries that often associate common healthcare-related terms (e.g., “care,” “support,” “team”) with positive sentiment. These models do not account for context or sarcasm, which can lead to an overestimation of positive sentiment. In contrast, machine learning models are trained on imbalanced datasets where negative tweets are more prevalent and distinct, causing them to be biased toward negative classifications. This difference in methodology explains why lexicon models identified more positives, while ML models leaned toward negativity.
The lack of ground truth in the test data prevents a thorough evaluation of the models’ performance on unseen data, as the impressive results on the validation set above may suggest overfitting. This limitation highlights the need for a more robust dataset with labelled test data in future research to enable a comprehensive assessment of model performance. Ref. [
20] further emphasised that supervised machine learning, to which the machine learning in this study belongs, depends entirely on the availability and quality of labelled data.
The sentiment distributions also varied across techniques (
Table 8). The lexicon-based approach, which relies on predefined rules and lexicons, identified more tweets as positive, suggesting a potential limitation in handling contextual nuances. In contrast, the machine learning and deep learning models trained on the limited labelled data had more tweets as negative and generally struggled with Positive and Neutral sentiment classification. The presence of stop words also influenced the sentiment distribution of the lexicon-based models.
Furthermore, the precision, recall and f1-score of the ensemble models were zero after tuning, and this could be because of the models struggling to identify positive classes due to the highly biased dataset (
Table 9).
In the topic modelling results (
Figure 8), Topic 3, with terms like “waiting list” and “service,” had the most negative tweets. Conversely, Topic 7, containing words such as “thank,” “support,” “care,” and “team,” had the most positive tweets, indicating public dissatisfaction with the waiting list but appreciation for NHS support and care. Topic 0, featuring significant terms like “immigration,” had the second-highest number of negative tweets, suggesting public concern about mass immigration during the period concerned.
On the other hand, the result of the aspect-based sentiment analysis (
Figure 9) identified aspects like ‘government’, ‘health’ as having negative average sentiment polarity.
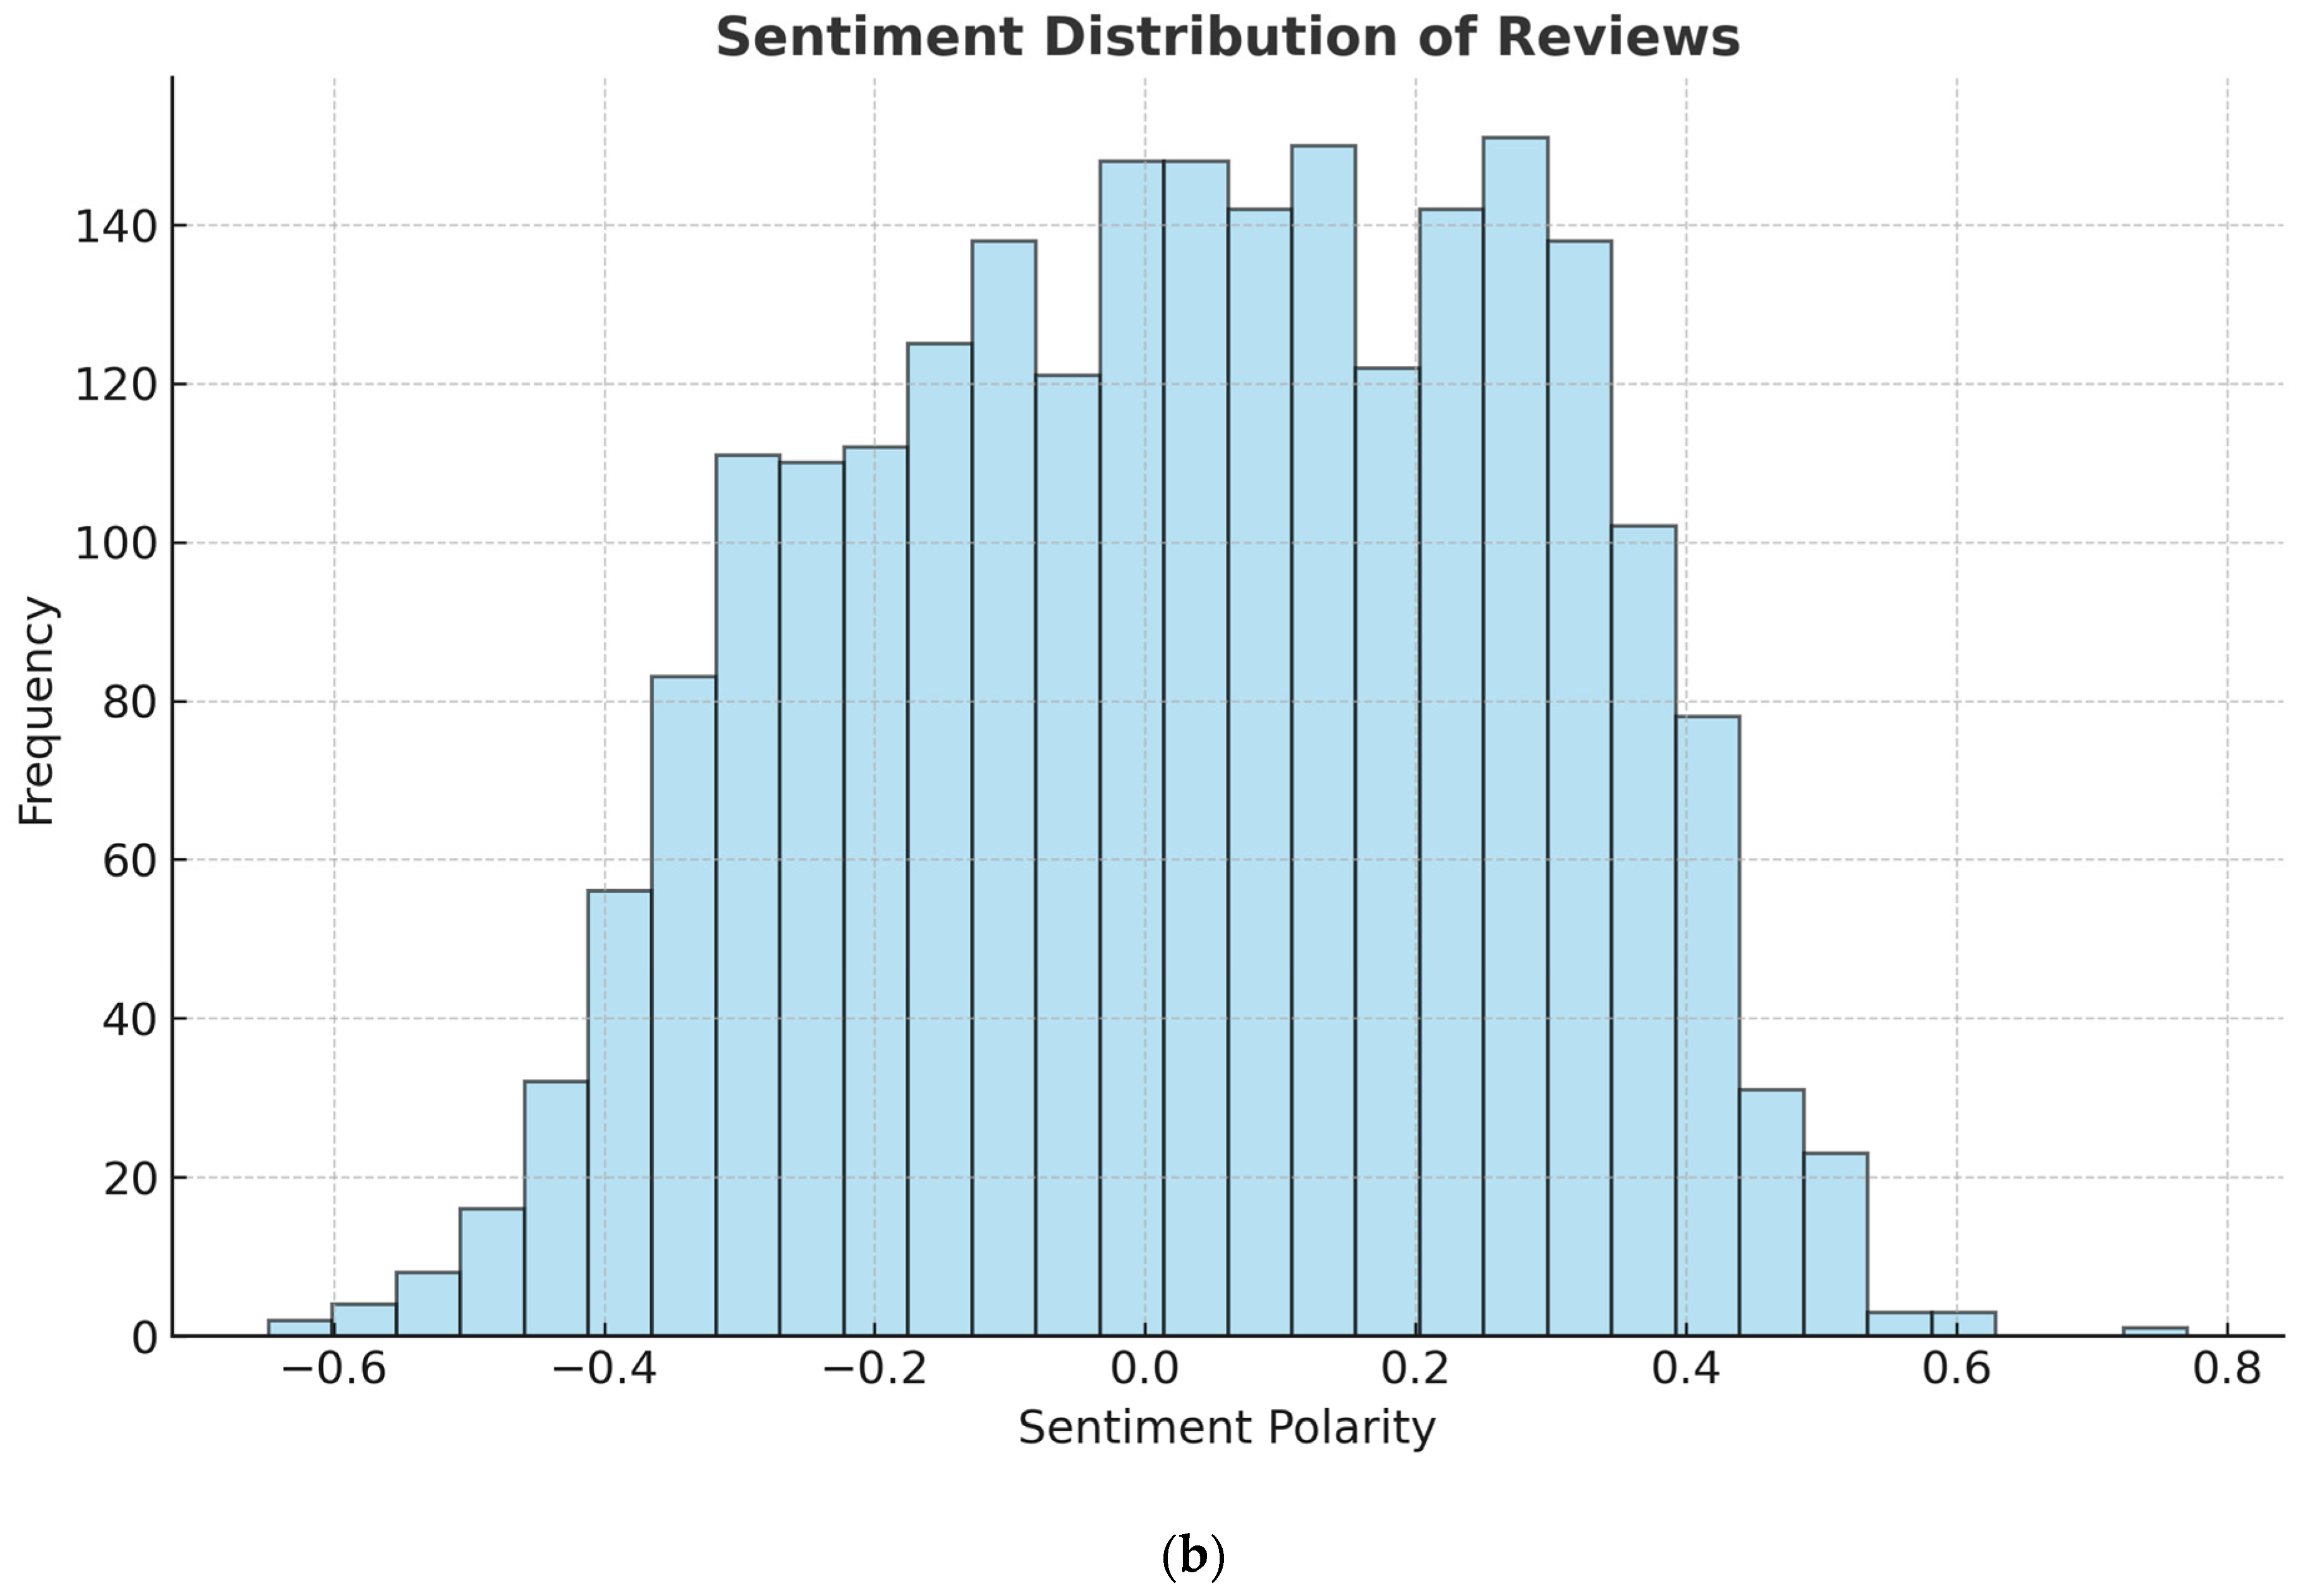
Furthermore, sentiment analysis carried out on tweets containing the most frequent mention of @Labour (
Figure 9b) indicated an overall Neutral polarity towards the party.
The observed divergence between lexicon-based and machine learning approaches can be explained by their underlying mechanics. Lexicon-based tools such as VADER and TextBlob rely on pre-defined sentiment dictionaries and rule-based scoring, which often overestimate positivity in text due to the presence of polite expressions (‘thank,’ ‘support,’ ‘care’) or positive modifiers, regardless of context. In contrast, machine learning models learn from labelled examples and, in this case, were trained on an imbalanced dataset dominated by negative tweets. As a result, the ML models were more likely to classify ambiguous or Neutral posts as negative, reflecting their bias towards the majority class. This imbalance, compounded by the relatively small, labelled dataset, contributed to the skewed classification. In short, lexicon methods tend to be overly optimistic, while ML models in this study reflected the negativity bias present in the training data. This finding aligns with previous work [
15,
20], which noted that lexicon-based methods perform poorly in domains with nuanced or sarcastic language, whereas ML approaches are highly sensitive to data imbalance. The contrast highlights a key methodological challenge in healthcare-related sentiment analysis: striking a balance between lexicon interpretability and ML contextual accuracy, especially when politically charged discourse amplifies negative sentiments.
5.2. Principal Findings
This study showed how limited data can seriously affect the performance of machine learning models, to such a point that even hyperparameter tuning does not result in improved performance. Furthermore, the absence of ground truth was found to be a barrier to comprehensive evaluation.
The study also revealed public dissatisfaction with the services offered by the NHS. Particularly regarding the waiting lists, quality of service, and immigration issues. Specifically for the immigration aspect, some members of the public felt that it puts strain on the NHS facilities and services. The respondents, however, expressed satisfaction with the NHS’s support, teamwork, and quality of care. This indicates areas of improvement and areas which are commendable.
6. Conclusions
This study investigated sentiment analysis of NHS-related tweets during the politically charged period leading up to the 2024 UK general election. By applying lexicon-based, traditional machine learning, ensemble, and transformer-based methods, the research offers several key findings.
First, the results revealed a clear methodological divide: lexicon-based approaches (VADER, TextBlob) tended to identify more positive sentiment, largely due to their reliance on dictionary-driven scoring that amplifies polite and supportive expressions. In contrast, machine learning and ensemble methods classified a higher proportion of tweets as negative, reflecting both the imbalance of the training dataset and the broader tone of NHS-related discourse at the time. BERT, despite its contextual sophistication, struggled with the small, imbalanced dataset and performed comparably to traditional models rather than surpassing them. The comparative summary highlights the persistent challenges of applying advanced models in domains with limited annotated data.
Second, the topic modelling analysis provided insight into how social media debates intersect with NHS policy concerns. Negative themes such as waiting lists, service pressures, and immigration reflect well-known policy controversies and social anxieties, while positive clusters (thank, support, care) demonstrate enduring public appreciation for frontline staff. Aspect-based sentiment analysis reinforced these findings by pinpointing government and funding issues as negative, but teamwork and service dedication as positive.
Taken together, these findings contribute to the literature in three exclusive ways. (1) They provide one of the first systematic analyses of NHS sentiment in the direct context of a general election, showing how political debates amplify public concerns. (2) They demonstrate the comparative strengths and weaknesses of lexicon, machine learning, ensemble, and transformer-based approaches in analysing politicised healthcare discourse. (3) They highlight the limitations of current methods when faced with class imbalance and limited labelled data, offering a roadmap for future research to incorporate larger, more balanced, and multilingual datasets.
In doing so, this work advances NHS-related sentiment analysis beyond earlier studies focused on structured feedback or general healthcare discussions, and positions social media as a vital, if complex, source of evidence for understanding public perceptions of health policy.
BERTweet will be incorporated into future studies of this work to compare its performance with the generic BERT model.
Author Contributions
Conceptualization, S.U.R. and O.O.B.; methodology, S.U.R. and O.O.B.; software, S.U.R. and O.O.B.; validation, S.U.R. and O.O.B.; formal analysis, S.U.R., A.A. and O.O.B.; investigation, S.U.R. and A.A.; resources, S.U.R., A.A. and O.O.B.; data curation, S.U.R. and O.O.B.; writing—original draft preparation, S.U.R., A.A. and O.O.B.; writing—review and editing, S.U.R. and A.A.; visualization, S.U.R., A.A. and O.O.B.; supervision, S.U.R.; project administration, S.U.R. and A.A. All authors have read and agreed to the published version of the manuscript.
Funding
This research received no external funding.
Institutional Review Board Statement
Not applicable.
Informed Consent Statement
Not applicable.
Data Availability Statement
The original contributions presented in this study are included in the article. Further inquiries can be directed to the corresponding author.
Conflicts of Interest
The authors declare no conflict of interest.
References
- Yau, N. Visualize This: The FlowingData Guide to Design, Visualization, and Statistics; John Wiley & Sons: Hoboken, NJ, USA, 2024. [Google Scholar]
- Gohil, S.; Vuik, S.; Darzi, A. Sentiment analysis of health care tweets: Review of the methods used. JMIR Public Health Surveill. 2018, 4, e5789. [Google Scholar] [CrossRef] [PubMed]
- Liu, B. Sentiment Analysis and Subjectivity. In Handbook of Natural Language Processing, 2nd ed.; Chapman & Hall/CRC Press: Boca Raton, FL, USA, 2010. [Google Scholar]
- Devika, M.D.; Sunitha, C.; Ganesh, A. Sentiment analysis: A comparative study on different approaches. Procedia Comput. Sci. 2016, 87, 44–49. [Google Scholar] [CrossRef]
- McKay, K.; Wayland, S.; Ferguson, D.; Petty, J.; Kennedy, E. “At Least until the Second Wave Comes…”: A X analysis of the NHS and COVID-19 between March and June 2020. Int. J. Environ. Res. Public Health 2021, 18, 3943. [Google Scholar] [CrossRef] [PubMed]
- Labour Party. Build an NHS Fit for the Future. 2024. Available online: https://labour.org.uk/change/build-an-nhs-fit-for-the-future/ (accessed on 13 August 2024).
- Qiao, F.; Williams, J. Topic modelling and sentiment analysis of global warming tweets: Evidence from big data analysis. J. Organ. End User Comput. 2022, 34, 1–18. [Google Scholar] [CrossRef]
- Lyu, J.C.; Han, E.L.; Luli, G.K. COVID-19 Vaccine–Related Discussion on X: Topic Modeling and Sentiment Analysis. J. Med. Internet Res. 2021, 23, e24435. [Google Scholar] [CrossRef] [PubMed] [PubMed Central]
- Bahja, M.; Lycett, M. Identifying patient experience from online resources via sentiment analysis and topic modelling. In Proceedings of the 3rd IEEE/ACM International Conference on Big Data Computing, Applications and Technologies, Shanghai, China, 6–9 December 2016; pp. 94–99. [Google Scholar]
- Lee, H.J.; Lee, M.; Lee, H. Understanding Public Healthcare Service Quality from Social Media. In Electronic Government, Proceedings of the 17th IFIP WG 8.5 International Conference, EGOV 2018, Krems, Austria, 3–5 September 2018; Parycek, P., Glassey, O., Janssen, M., Jochen Scholl, H., Tambouris, E., Kalampokis, E., Virkar, S., Eds.; Lecture Notes in Computer Science; Springer: Cham, Switzerland, 2018; Volume 11020. [Google Scholar] [CrossRef]
- Kbaier, D.; Kane, A.; McJury, M.; Kenny, I. Prevalence of health misinformation on social media—Challenges and mitigation before, during, and beyond the COVID-19 pandemic: Scoping literature review. J. Med. Internet Res. 2024, 26, e38786. [Google Scholar] [CrossRef] [PubMed]
- Mao, Y.; Qun, L.; Yu, Z. Sentiment analysis methods, applications, and challenges: A systematic literature review. J. King Saud Univ. Comput. Inf. Sci. 2024, 36, 102048. [Google Scholar] [CrossRef]
- Palanisamy, P.; Yadav, V.; Elchuri, H. Serendio: Simple and Practical lexicon based approach to Sentiment Analysis. In Second Joint Conference on Lexical and Computational Semantics (SEM), Proceedings of the Seventh International Workshop on Semantic Evaluation (SemEval 2013), Atlanta, GA, USA, 14–15 June 2013; Association for Computational Linguistics: Kerrville, TX, USA, 2013; Volume 2, pp. 543–548. [Google Scholar]
- Adwan, O.; Al-Tawil, M.; Huneiti, A.; Shahin, R.; Zayed, A.A.; Al-Dibsi, R. X sentiment analysis approaches: A survey. Int. J. Emerg. Technol. Learn. 2020, 15, 79–93. [Google Scholar] [CrossRef]
- Alexander, G.; Bahja, M.; Butt, G.F. Automating large-scale health care service feedback analysis: Sentiment analysis and topic modelling study. JMIR Med. Inform. 2022, 10, e29385. [Google Scholar] [CrossRef] [PubMed]
- Bouazizi, M.; Ohtsuki, T. Sentiment analysis in X: From classification to quantification of sentiments within tweets. In Proceedings of the 2016 IEEE Global Communications Conference (GLOBECOM), Washington, DC, USA, 4–8 December 2016; pp. 1–6. [Google Scholar]
- Desai, M.; Mehta, M.A. Techniques for sentiment analysis of X data: A comprehensive survey. In Proceedings of the 2016 International Conference on Computing, Communication and Automation (ICCCA), Greater Noida, India, 29–30 April 2016; pp. 149–154. [Google Scholar]
- Ghag, K.V.; Shah, K. Comparative analysis of effect of stop words removal on sentiment classification. In Proceedings of the 2015 International Conference on Computer, Communication and Control (IC4), Indore, India, 10–12 September 2015; pp. 1–6. [Google Scholar]
- Chiny, M.; Chihab, M.; Bencharef, O.; Chihab, Y. LSTM, VADER and TF-IDF based hybrid sentiment analysis model. Int. J. Adv. Comput. Sci. Appl. 2021, 12, 265–275. [Google Scholar] [CrossRef]
- Garrido-Merchan, E.C.; Gozalo-Brizuela, R.; Gonzalez-Carvajal, S. Comparing BERT against traditional machine learning text classification. J. Comput. Cogn. Eng. 2020, 2, 352–356. [Google Scholar] [CrossRef]
Figure 1.
Figure showing the sentiment distribution in the labelled dataset.
Figure 1.
Figure showing the sentiment distribution in the labelled dataset.
Figure 2.
Users with the highest engagements.
Figure 2.
Users with the highest engagements.
Figure 3.
Posts with high engagement.
Figure 3.
Posts with high engagement.
Figure 4.
Summary classification report of the traditional models without tuning (a) and with tuning (b).
Figure 4.
Summary classification report of the traditional models without tuning (a) and with tuning (b).
Figure 5.
Figure showing summary ensemble model classification report on validation data without tuning (a) and with tuning (b).
Figure 5.
Figure showing summary ensemble model classification report on validation data without tuning (a) and with tuning (b).
Figure 6.
Figure showing sentiment distribution of the lexicon-based models.
Figure 6.
Figure showing sentiment distribution of the lexicon-based models.
Figure 7.
Different number of topics, their coherence scores (a) and some top associated words (b).
Figure 7.
Different number of topics, their coherence scores (a) and some top associated words (b).
Figure 8.
Figure showing the percentage of sentiment classes in the identified topics.
Figure 8.
Figure showing the percentage of sentiment classes in the identified topics.
Figure 9.
Topmost mentioned aspects and their average sentiment polarity (a), sentiment polarity distribution of tweets containing the @Labour mention. (b) Sentiment polarity distribution.
Figure 9.
Topmost mentioned aspects and their average sentiment polarity (a), sentiment polarity distribution of tweets containing the @Labour mention. (b) Sentiment polarity distribution.
Table 1.
Table showing the distribution of fetched tweets per day.
Table 1.
Table showing the distribution of fetched tweets per day.
| Days | Number of Tweets |
|---|
| 13 June 2024 | 1724 |
| 14 June 2024 | 13,276 |
| 15 June 2024 | 20,000 |
Table 2.
Table showing the sentiment distributions of the models on the test dataset.
Table 2.
Table showing the sentiment distributions of the models on the test dataset.
| | NB Without Tuning (%) | NB with Tuning (%) | LR Without Tuning (%) | LR with Tuning (%) | SVC Without Tuning (%) | SVC with Tuning (%) |
|---|
| Negative | 42 | 55 | 85 | 80 | 88 | 88 |
| Positive | 32 | 23 | 10 | 12 | 12 | 12 |
| Neutral | 26 | 21 | 5 | 8 | 0 | 0 |
Table 3.
Table showing the sentiment distribution of the ensemble models on the test data.
Table 3.
Table showing the sentiment distribution of the ensemble models on the test data.
| Class | Voting Classifier Without Tuning (%) | Voting Classifier with Tuning (%) | Stacking Classifier Without Tuning (%) | Stacking Classifier with Tuning (%) |
|---|
| Negative | 84 | 84 | 87 | 87 |
| Positive | 15 | 15 | 13 | 13 |
| Neutral | 1 | 1 | 0 | 0 |
Table 4.
Table showing summary classification report of the Bert Model on the validation data.
Table 4.
Table showing summary classification report of the Bert Model on the validation data.
| Sentiment Class | BERT Without Tuning (Precision) | BERT Without Tuning (Recall) | BERT Without Tuning (F1-Score) | BERT Without Tuning (Accuracy) | BERT with Tuning (Precision) | BERT with Tuning (Recall) | BERT with Tuning (F1-Score) | BERT with Tuning (Accuracy) |
|---|
| Negative | 0.8 | 0.89 | 0.84 | | 0.8 | 0.89 | 0.84 | |
| Neutral | 0 | 0 | 0 | | 0 | 0 | 0 | |
| Positive | 0 | 0 | 0 | | 0 | 0 | 0 | |
| | | | | 0.73 | | | | 0.73 |
Table 5.
Table showing sentiment distribution of the Bert Model on the Test Data.
Table 5.
Table showing sentiment distribution of the Bert Model on the Test Data.
| Sentiment Class | BERT Without Tuning (%) | BERT with Tuning (%) |
|---|
| Negative | 74 | 75 |
| Neutral | 11 | 10 |
| Positive | 15 | 15 |
Table 6.
Identified sentiment words, and their polarity.
Table 6.
Identified sentiment words, and their polarity.
| Aspect | Sentiment Word | Polarity |
|---|
| Service | Useful | 0.3 |
| Scheme | Generous | 0 |
| Privatization | Purpose | 0 |
Table 7.
(a) Summary of model results. (b) Table showing summary accuracy scores of all the machine learning models.
Table 7.
(a) Summary of model results. (b) Table showing summary accuracy scores of all the machine learning models.
| Type | Name | Model Accuracy | Model Precision | Model Recall | Model F1-Score | Model ROC AUC | Comments |
|---|
| (a) |
| Traditional Model | Naive Bayes | 0.80 | 0.78 | 0.79 | 0.78 | 0.81 | More negative sentiment bias |
| Traditional Model | Logistic Regression | 0.82 | 0.80 | 0.81 | 0.80 | 0.83 | More negative sentiment bias |
| Traditional Model | SVC | 0.81 | 0.79 | 0.80 | 0.79 | 0.82 | More negative sentiment bias |
| Ensemble | Voting Classifier | 0.83 | 0.81 | 0.82 | 0.81 | 0.84 | Zero precision/recall for positive class after tuning |
| Ensemble | Stacking Classifier | 0.84 | 0.82 | 0.83 | 0.82 | 0.85 | Failed to classify positive class effectively |
| Deep Learning | BERT | 0.73 | N/A | N/A | N/A | N/A | Failed to classify positive sentiment |
| (b) |
| | NB | LR | SVC | Voting Classifier | Stacking Classifier | BERT |
| Without Tuning | 0.86 | 0.93 | 1 | 0.99 | 1 | 0.73 |
| With Tuning | 0.90 | 0.93 | 1 | 0.99 | 1 | 0.73 |
Table 8.
Table showing the summary sentiment distribution of all the machine learning models.
Table 8.
Table showing the summary sentiment distribution of all the machine learning models.
| Sentiment Class | NB | LR | SVC | Voting Classifier | Stacking Classifier | Bert |
|---|
| | Without Tuning | With Tuning | Without Tuning | With Tuning | Without Tuning | With Tuning | Without Tuning | With Tuning | Without Tuning | With Tuning | Without Tuning | With Tuning |
|---|
| Negative | 44.89 | 65.31 | 97.66 | 93.23 | 99.96 | 99.96 | 90.20 | 90.25 | 91.20 | 91.19 | 95.17 | 95.42 |
| Positive | 25.88 | 18.75 | 1.23 | 4.88 | 0.04 | 0.04 | 9.60 | 9.60 | 8.76 | 8.77 | 0.00 | 0.00 |
| Neutral | 29.22 | 15.95 | 1.11 | 1.88 | 0.00 | 0.00 | 0.20 | 0.15 | 0.04 | 0.04 | 4.83 | 4.58 |
Table 9.
Table showing the classification metrics of the ensemble machine learning models.
Table 9.
Table showing the classification metrics of the ensemble machine learning models.
| Evaluation Metrics | Voting Classifier
Without Tuning | Voting Classifier
with Tuning | Stacking Classifier
Without Tuning | Stacking Classifier
with Tuning |
|---|
| Accuracy | 0.83 | 0.84 | 0.84 | 0.84 |
| Precision | 0.81 | 0 | 0.82 | 0 |
| Recall | 0.82 | 0 | 0.83 | 0 |
| F1-score | 0.81 | 0 | 0.82 | 0 |
| ROC AUC | 0.84 | 0.84 | 0.85 | 0.85 |
| Disclaimer/Publisher’s Note: The statements, opinions and data contained in all publications are solely those of the individual author(s) and contributor(s) and not of MDPI and/or the editor(s). MDPI and/or the editor(s) disclaim responsibility for any injury to people or property resulting from any ideas, methods, instructions or products referred to in the content. |
© 2025 by the authors. Licensee MDPI, Basel, Switzerland. This article is an open access article distributed under the terms and conditions of the Creative Commons Attribution (CC BY) license (https://creativecommons.org/licenses/by/4.0/).

