Interpretable Emotion Estimation in Indoor Remote Work Environments via Environmental Sensor Data
Abstract
1. Introduction
- A novel system for continuous, multimodal data collection on both indoor environmental factors and human emotional states;
- The application of an interpretable machine learning approach (SHAP) to identify and quantify the specific environmental factors that influence a person’s sense of pleasantness or unpleasantness;
- A comprehensive analysis of the dynamic relationship between indoor factors, such as CO2 concentration, temperature, and humidity, and emotional well-being.
2. Materials and Methods
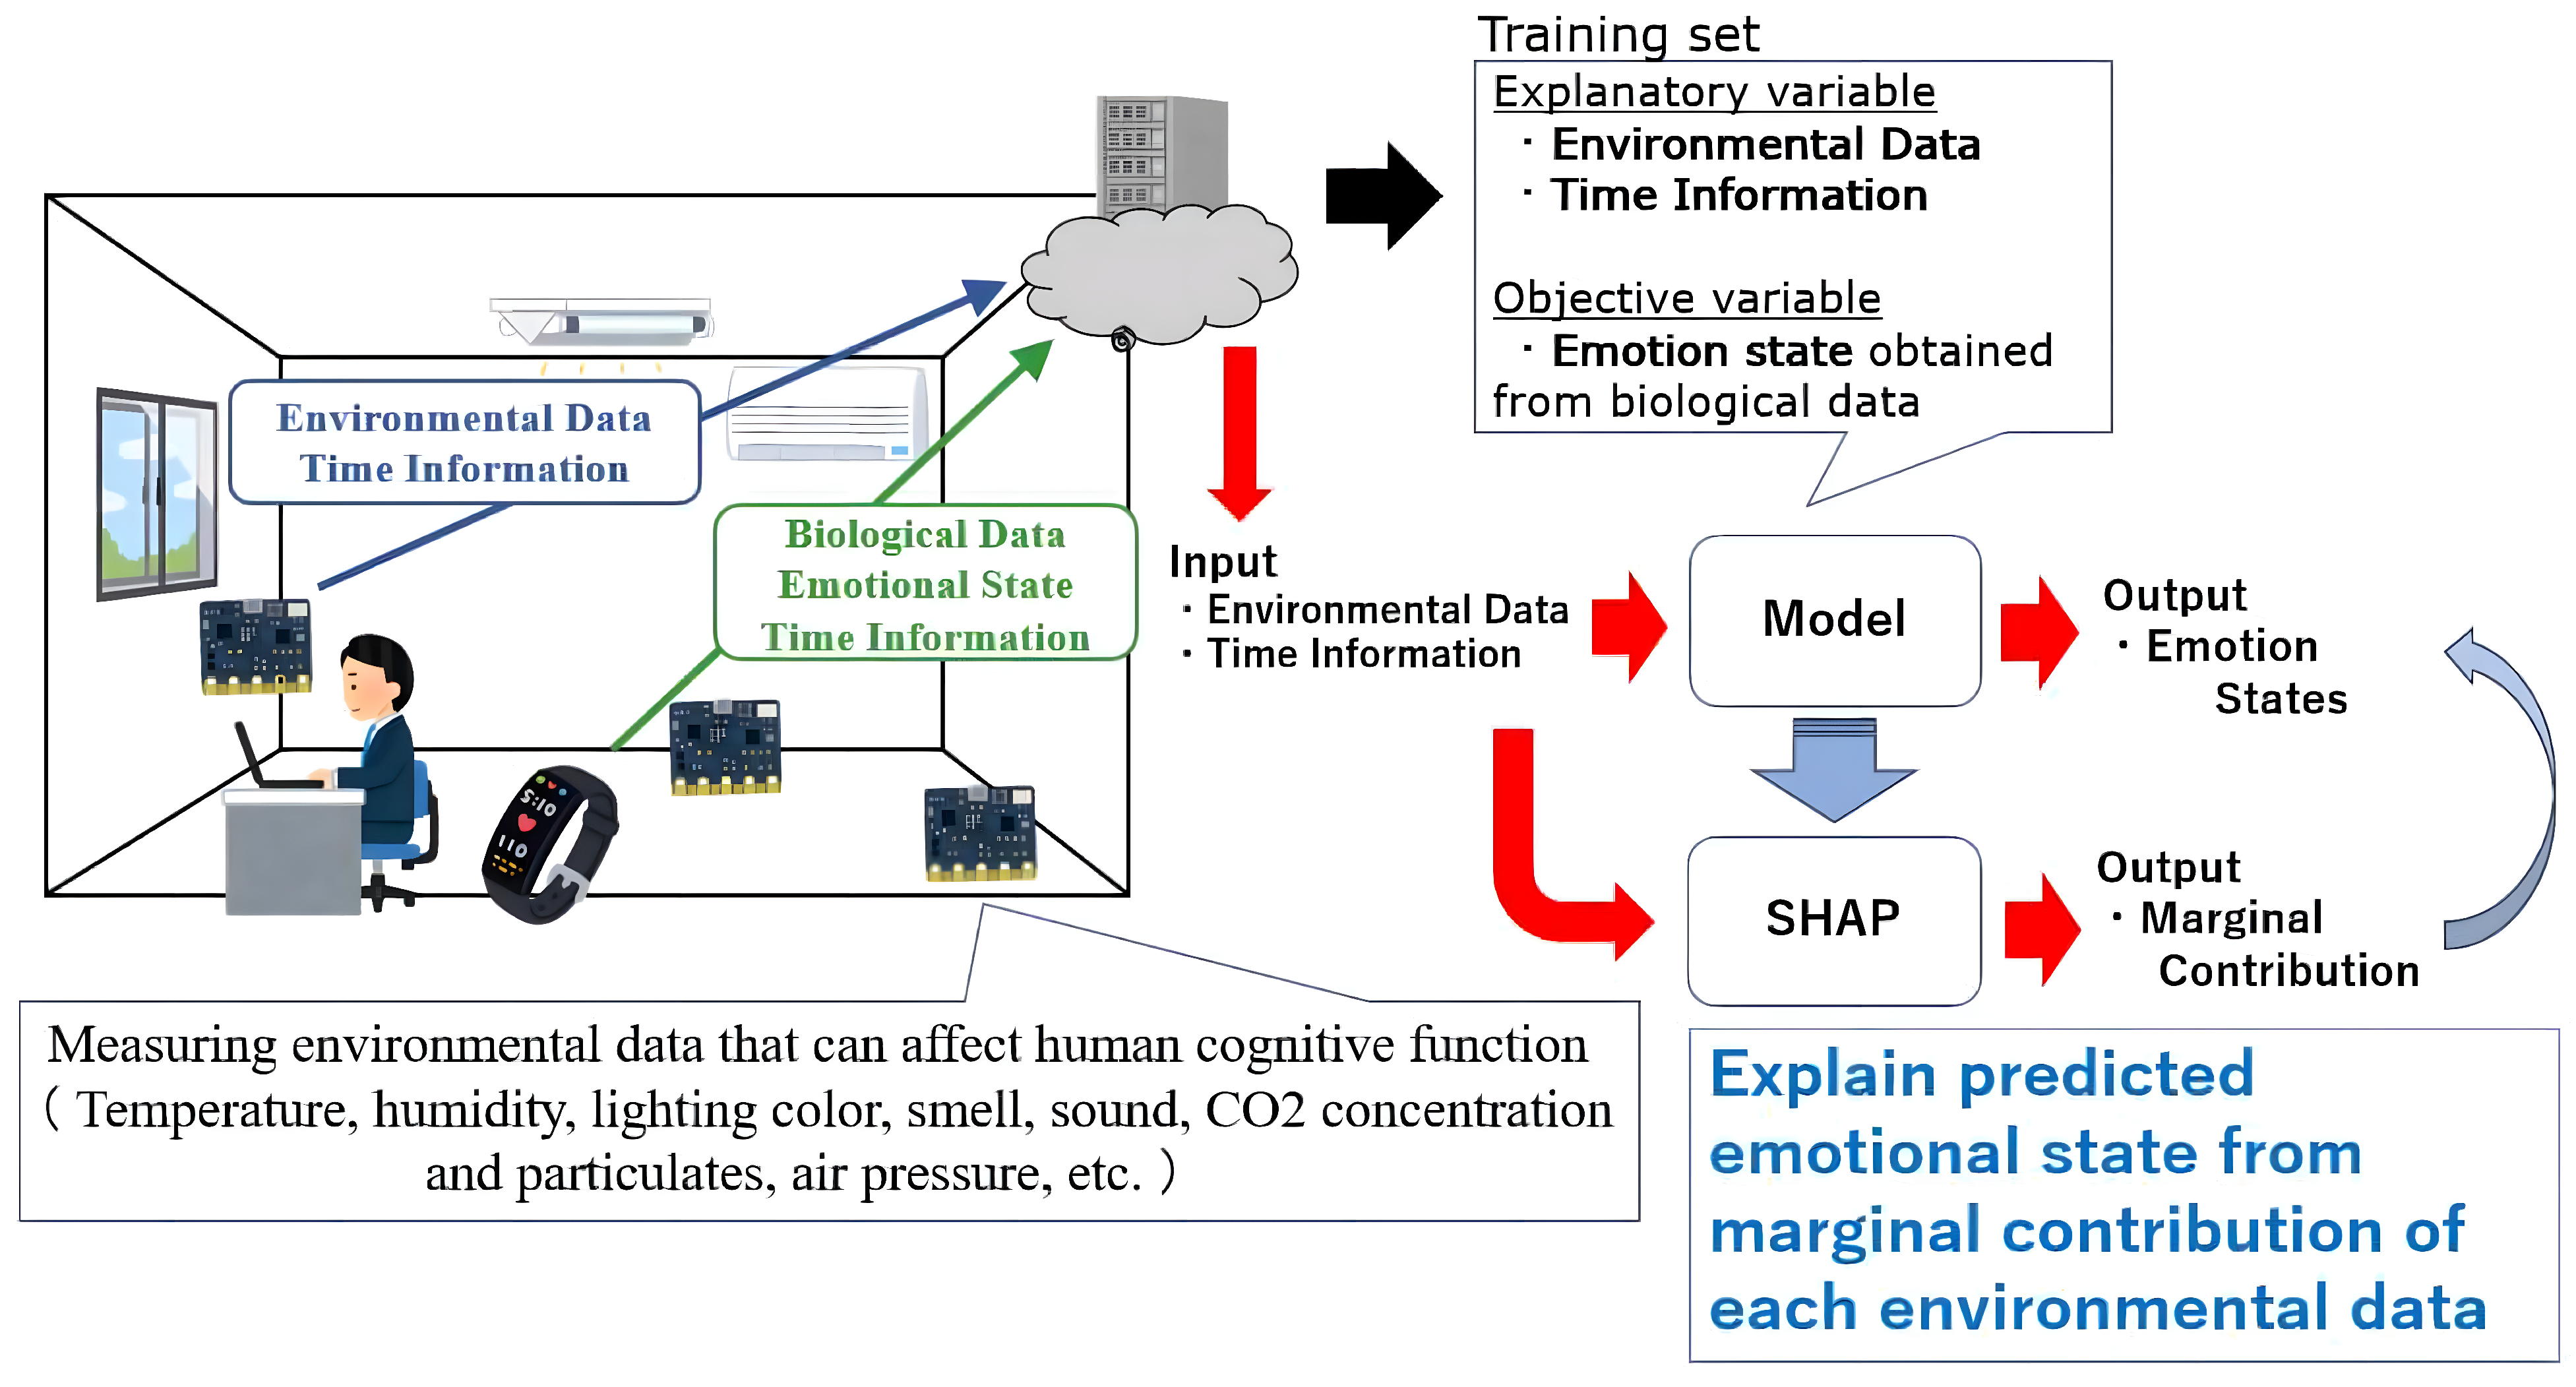
- Data Acquisition: Various indoor environmental data related to human cognitive functions and mental states (pleasantness/unpleasantness) are acquired by edge computersvia wireless sensor networks. The data are then segmented into training and test datasets for the machine learning model.
- Model Construction and Evaluation: Utilizing the training data, a machine learning model is developed, where the environmental data serve as the input and the mental state (pleasantness/unpleasantness) serves as the output. Post construction, the accuracy of the model is assessed using the test data.
- SHAP Analysis: SHAP is employed to construct a regression model from the training model. This model aims to determine which indoor environmental values impact emotions (pleasantness/unpleasantness) in the original machine learning model, as represented by SHAP values, thereby adding interpretability to the model.
2.1. Environmental Sensor
2.2. Emotional Recognition
2.3. Model Building
2.3.1. RF
2.3.2. GBDT
2.4. SHAP
2.5. Experiment
2.5.1. Participants and Experiment Design
- Inclusion Criteria:
- A healthy couple or partnershipaged 20 or older.
- Available for a 3-night, 4-day stay at the experimental house at Chiba University.
- Capable of working indoors (remote working) during the experiment (participants or their partners could also be registered as participants).
- Low sensitivity to chemical substances, as determined by the Quick Environmental Exposure and Sensitivity Inventory (QEESI) questionnaire.
- No prior history of symptoms related to sick building syndrome, as determined by the questionnaire.
- No known allergies.
- Exclusion Criteria:
- A history of smoking (if either partner had a history of smoking, the couple was excluded).
- A diagnosis of chemical sensitivity (if either partner had a diagnosis, the couple was excluded).
2.5.2. Experimental Environment and Data Collection
3. Results
3.1. Model Development and Validation Method
3.2. Emotion Estimation
3.3. Identification of Critical Environmental Factors Using SHAP
3.3.1. Key Environmental Factors
3.3.2. CO2 Concentration
3.3.3. Temperature
3.3.4. Humidity
4. Discussion
4.1. Key Findings and Comparison with Prior Work
4.2. Interpretation of Key Findings
4.3. Limitations and Future Work
5. Conclusions
Author Contributions
Funding
Institutional Review Board Statement
Informed Consent Statement
Data Availability Statement
Conflicts of Interest
Abbreviations
| NEC | Nippon Electric Company, Limited |
| RF | Random Forest |
| GBDT | Gradient Boosting Decision Tree |
Appendix A. Detailed Formulation of SHAP
- Local accuracy: Ensures ;
- Missingness: If a feature is missing, i.e., , then ;
- Consistency: If the contribution of a feature increases in a new model, its SHAP value will not decrease.
References
- Zhang, X.; Du, J.; Chow, D. Association between perceived indoor environmental characteristics and occupants’ mental well-being, cognitive performance, productivity, satisfaction in workplaces: A systematic review. Build. Environ. 2023, 246, 360–1323. [Google Scholar] [CrossRef]
- Lamb, S.; Kowk, K.S.C. A longitudinal investigation of work environment stressors on the performance and wellbeing of office workers. Appl. Ergon. 2016, 52, 104–111. [Google Scholar] [CrossRef] [PubMed]
- Standard 55.66; Thermal Comfort Conditions. ASHRAE: New York, NY, USA, 1966.
- Fields, J.M.; De Jong, R.; Gjestland, T.; Flindell, I.H.; Job, R.F.S.; Kurra, S.; Lercher, P.; Vallet, M.; Yano, T.; Guski, R.; et al. Standardized general-purpose noise reaction questions for community noise surveys: Research and a recommendation. J. Sound Vib. 2001, 242, 641–679. [Google Scholar] [CrossRef]
- Pransky, G.; Finkelstein, S.; Berndt, E.; Kyle, M.; Mackell, J.; Tortorice, D. Objective and self-report work performance measures: A comparative analysis. Int. J. Prod. Perform. Manag. 2006, 55, 390–399. [Google Scholar] [CrossRef]
- Stroop, R. Studies of interference in serial verbal reactions. J. Exp. Psychol. 1935, 18, 643–662. [Google Scholar] [CrossRef]
- Thach, T.Q.; Mahirah, D.; Sauter, C.; Roberts, A.C.; Dunleavy, G.; Nazeha, N.; Rykov, Y.; Zhang, Y.; Christopoulos, G.I.; Soh, C.K.; et al. Associations of perceived indoor environmental quality with stress in the workplace. Indoor Air 2020, 30, 1166–1177. [Google Scholar] [CrossRef]
- Thatcher, A.; Milner, K. Changes in productivity, psychological wellbeing and physical wellbeing from working in a ’green’ building. Work 2014, 49, 381–393. [Google Scholar] [CrossRef]
- Cheung, S.S.; Lee, J.K.; Oksa, J. Thermal stress, human performance, and physical employment standards. Appl. Physiol. Nutr. Metab. 2016, 41, 148–164. [Google Scholar] [CrossRef]
- Alkharabsheh, O.H.M.; Jaaffar, A.H.; Chou, Y.C.; Rawati, E.; Fong, P.W. The Mediating Effect of Fatigue on the Nature Element, Organisational Culture and Task Performance in Central Taiwan. Int. J. Environ. Res. Public Health 2022, 19, 8759. [Google Scholar] [CrossRef]
- Sakellaris, I.A.; Saraga, D.E.; Mandin, C.; Roda, C.; Fossati, S.; de Kluizenaar, Y.; Carrer, P.; Dimitroulopoulou, S.; Mihucz, V.G.; Szigeti, T.; et al. Perceived Indoor Environment and Occupants’ Comfort in European “Modern” Office Buildings: The OFFICAIR Study. Int. J. Environ. Res. Public Health 2016, 13, 444. [Google Scholar] [CrossRef] [PubMed]
- Schultz, W. Behavioral theories and the neurophysiology of reward. Annu. Rev. Psychol. 2006, 57, 87–155. [Google Scholar] [CrossRef] [PubMed]
- Healey, J.; Picard, R. Smart Car: Detecting driver stress. In Proceedings of the 15th International Conference on Pattern Recognition, Barcelona, Spain, 3–7 September 2000; Volume 4, pp. 218–221. [Google Scholar]
- Singh, R.R.; Conjeti, S.; Banerjee, R. A comparative evaluation of neural network classifiers for stress level analysis of automotive drivers using physiological signals. Biomed. Signal Process. Control 2013, 8, 740–754. [Google Scholar] [CrossRef]
- Abbasi, S.F.; Jamil, H.; Chen, W. EEG-based neonatal sleep stage classification using ensemble learning. Comput. Mater. Contin 2022, 70, 4619–4633. [Google Scholar]
- Tomoya, K.; Takao, T.; Shinya, K.; Ken, N.; Koji, N.; Toshio, O. Physical stimuli and emotional stress-induced sweat secretions in the human palm and forehead. Anal. Chim. Acta 1998, 365, 319–326. [Google Scholar] [CrossRef]
- Snow, S.; Amy, S.B.; Karlien, H.W.P.; Hannah, G.; Marco-Felipe, K.; Janet, B.; Catherine, J.N.; Schraefel, M.C. Exploring the physiological, neurophysiological and cognitive performance effects of elevated carbon dioxide concentrations indoors. Build. Environ. 2022, 156, 243–252. [Google Scholar] [CrossRef]
- Zhang, X.; Wargocki, P.; Lian, Z.; Thyregod, C. Effects of exposure to carbon dioxide and bioeffluents on perceived air quality, self-assessed acute health symptoms, and cognitive performance. Indoor Air 2017, 27, 45–64. [Google Scholar] [CrossRef]
- Maula, H.; Hongisto, V.; Naatula, V.; Haapakangas, A.; Koskela, H. The effect of low ventilation rate with elevated bioeffluent concentration on work performance, perceived indoor air quality, and health symptoms. Indoor Air 2017, 27, 1141–1153. [Google Scholar] [CrossRef]
- Maurizio, G.; Fabio, F.; Michele, F.; Fabio, M.; Aurora, D.A.; Stefania, F.; Isabella, G.T.; Giulia, L.; Cristina, M.; Paolo, M.R.; et al. Topographic electroencephalogram changes associated with psychomotor vigilance task performance after sleep deprivation. Sleep Med. 2014, 15, 1132–1139. [Google Scholar] [CrossRef] [PubMed]
- Hedge, A.; Erickson, W.A. A study of indoor environment and sick building syndrome complaints in air conditioned offices: Benchmarks for facility performance. Int. J. Facil. Manag. 1997, 1, 185–192. [Google Scholar]
- Hoddes, E.; Dement, W.; Zarcone, V. The development and use of the Stanford sleepiness scale. Psychophysiology 1972, 9, 150. [Google Scholar]
- Kim, H.; Hong, T.; Kim, J.; Yeon, S. A psychophysiological effect of indoor thermal condition on college students’ learning performance through EEG measurement. Build. Environ. 2020, 184, 107223. [Google Scholar] [CrossRef]
- Kim, H.; Jung, D.; Choi, H.; Hong, T. Advanced prediction model for individual thermal comfort considering blood glucose and salivary cortisol. Build. Environ. 2022, 224, 109551. [Google Scholar] [CrossRef]
- Deng, M.; Wang, X.; Menassa, C.C. Measurement and prediction of work engagement under different indoor lighting conditions using physiological sensing. Build. Environ. 2021, 203, 108098. [Google Scholar] [CrossRef]
- Komuro, N.; Hashiguchi, T.; Hirai, K.; Ichikawa, M. Development of wireless sensor nodes to monitor working environment and human mental conditions. In IT Convergence and Security; Lecture Notes in Electrical Engineering; Springer: Singapore, 2021; Volume 712, pp. 149–157. [Google Scholar]
- Komuro, N.; Hashiguchi, T.; Hirai, K.; Ichikawa, M. Predicting Individual Emotion from Perceptionbased Non-contact Sensor Big Data. Sci. Rep. 2021, 11, 2317. [Google Scholar] [CrossRef]
- Kurebayashi, I.; Maeda, K.; Komuro, N.; Hirai, K.; Sekiya, H.; Ichikawa, M. Mental-state estimation model with time-series environmental data regarding cognitive function. Internet Things 2023, 22, 100730. [Google Scholar] [CrossRef]
- Abe, K.; Iwata, S. NEC s Emotion Analysis Solution Supports Work Style Reform and Health Management. NEC Tech. J. 2019, 14, 44–48. [Google Scholar]
- James, A.R. A Circumplex Model of Affect. J. Personal. Soc. Psychol. 1980, 39, 1161–1178. [Google Scholar]
- Jonathan, P.; James, A.R.; Bradley, S.P. The circumplex model of affect: An integrative approach to affective neuroscience, cognitive development, and psychopathology. Dev. Psychopathol. 2005, 17, 715–734. [Google Scholar] [CrossRef] [PubMed]
- Lundberg, S.M.; Lee, S. A unified approach to interpreting model predictions. Adv. Neural Inf. Process. Syst. 2017, 30, 4768–4777. [Google Scholar]
- Hoenen, M.; Wolf, O.T.; Pause, B.M. The impact of stress on odor perception. Perception 2017, 46, 366–376. [Google Scholar] [CrossRef]
- Ayata, D.; Yaslan, Y.; Kamasak, M.E. Emotion based music recommendation system using wearable physiological sensors. IEEE Trans. Consum. Electron. 2018, 64, 196–203. [Google Scholar] [CrossRef]
- Bombail, V. Perception and emotions: On the relationships between stress and olfaction. Appl. Anim. Behav. Sci. 2018, 212, 98–108. [Google Scholar] [CrossRef]
- Frescura, A.; Lee, P.J. Emotions and physiological responses elicited by neighbours sounds in wooden residential buildings. Build. Environ. 2022, 210, 108729. [Google Scholar] [CrossRef]
- Mir, M.; Nasirzadeh, F.; Bereznicki, H.; Enticott, P.; Lee, S. Investigating the effects of different levels and types of construction noise on emotions using EEG data. Build. Environ. 2022, 225, 109619. [Google Scholar] [CrossRef]
- Brosch, T. Affect and emotions as drivers of climate change perception and action: A review. Curr. Opin. Behav. Sci. 2021, 42, 15–21. [Google Scholar] [CrossRef]
- Scheneider, C.R.; Zaval, L.; Markowitz, E.M. Positive emotions and climate change. Curr. Opin. Behav. Sci. 2021, 42, 114–120. [Google Scholar] [CrossRef]
- Shin, Y.B.; Woo, S.H.; Kim, D.H.; Kim, J.J.; Park, J.Y. The effect on emotions and brain activity by the direct/indirect lighting in the residential environment. Neurosci. Lett. 2015, 584, 28–32. [Google Scholar] [CrossRef] [PubMed]
- Choi, H.; Kim, H.; Hong, T.; An, J. Examining the indirect effects of indoor environmental quality on task performance: The mediating roles of physiological response and emotion. Build. Environ. 2023, 236, 110298. [Google Scholar] [CrossRef]
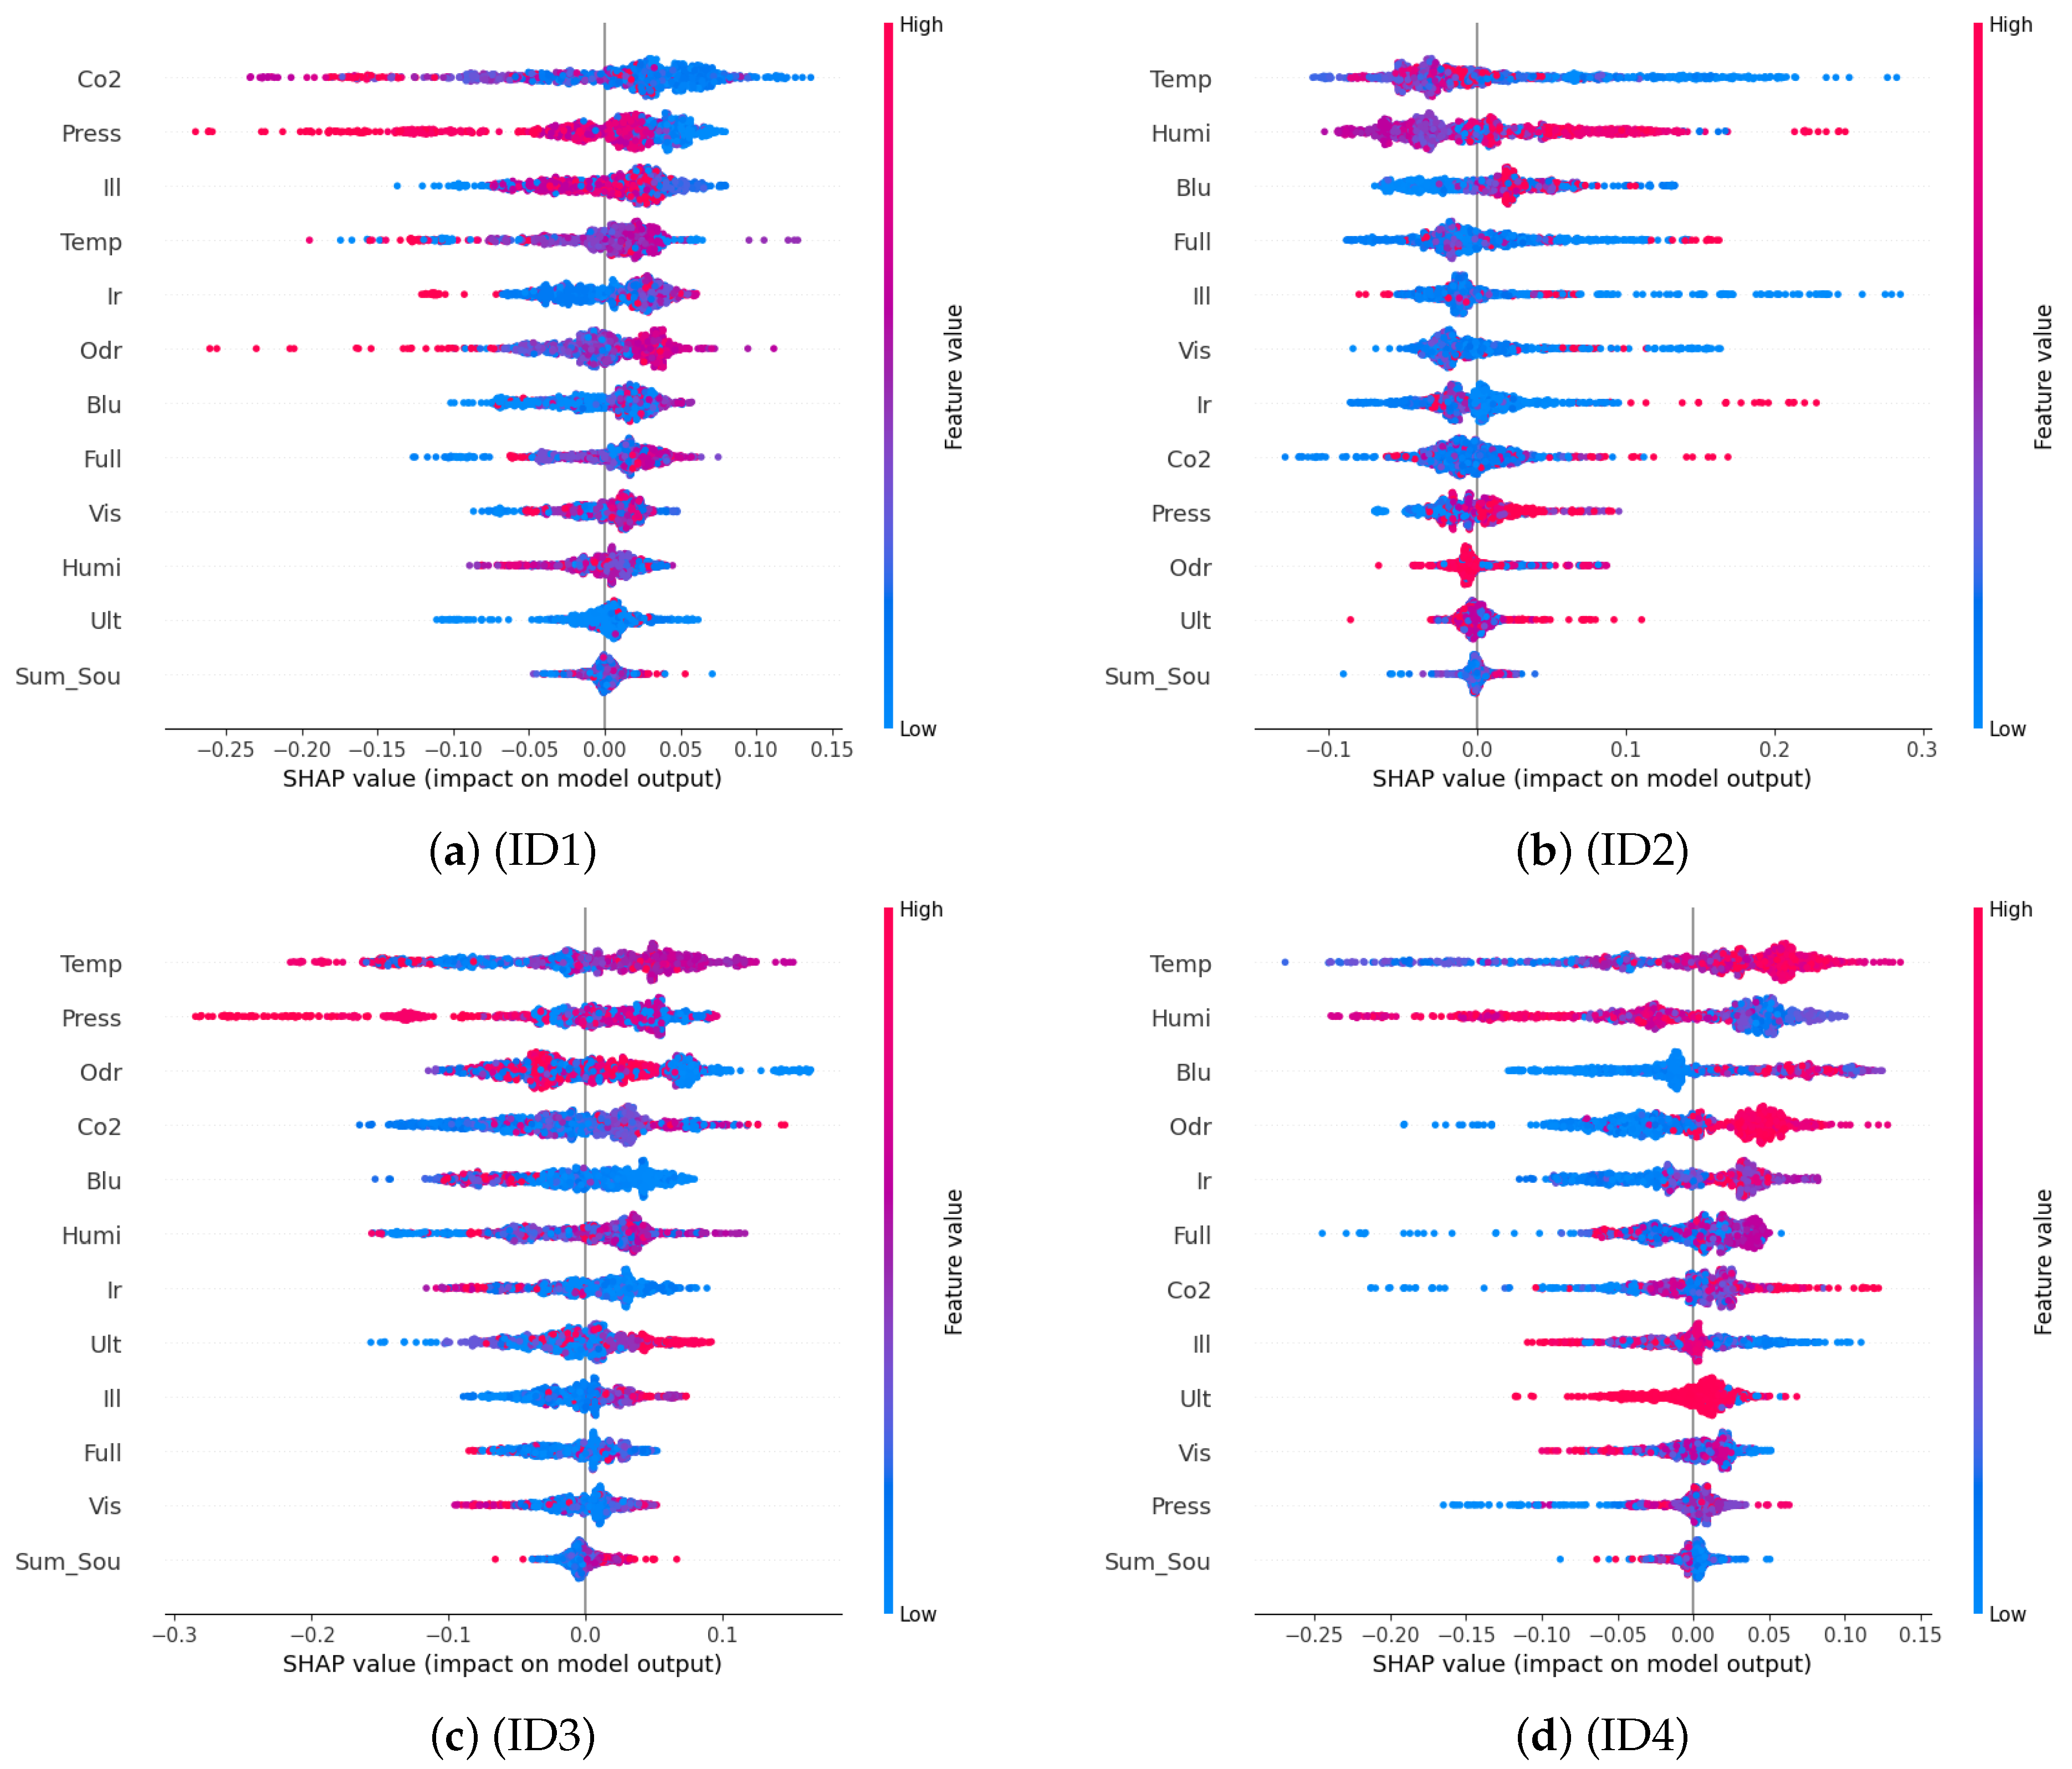
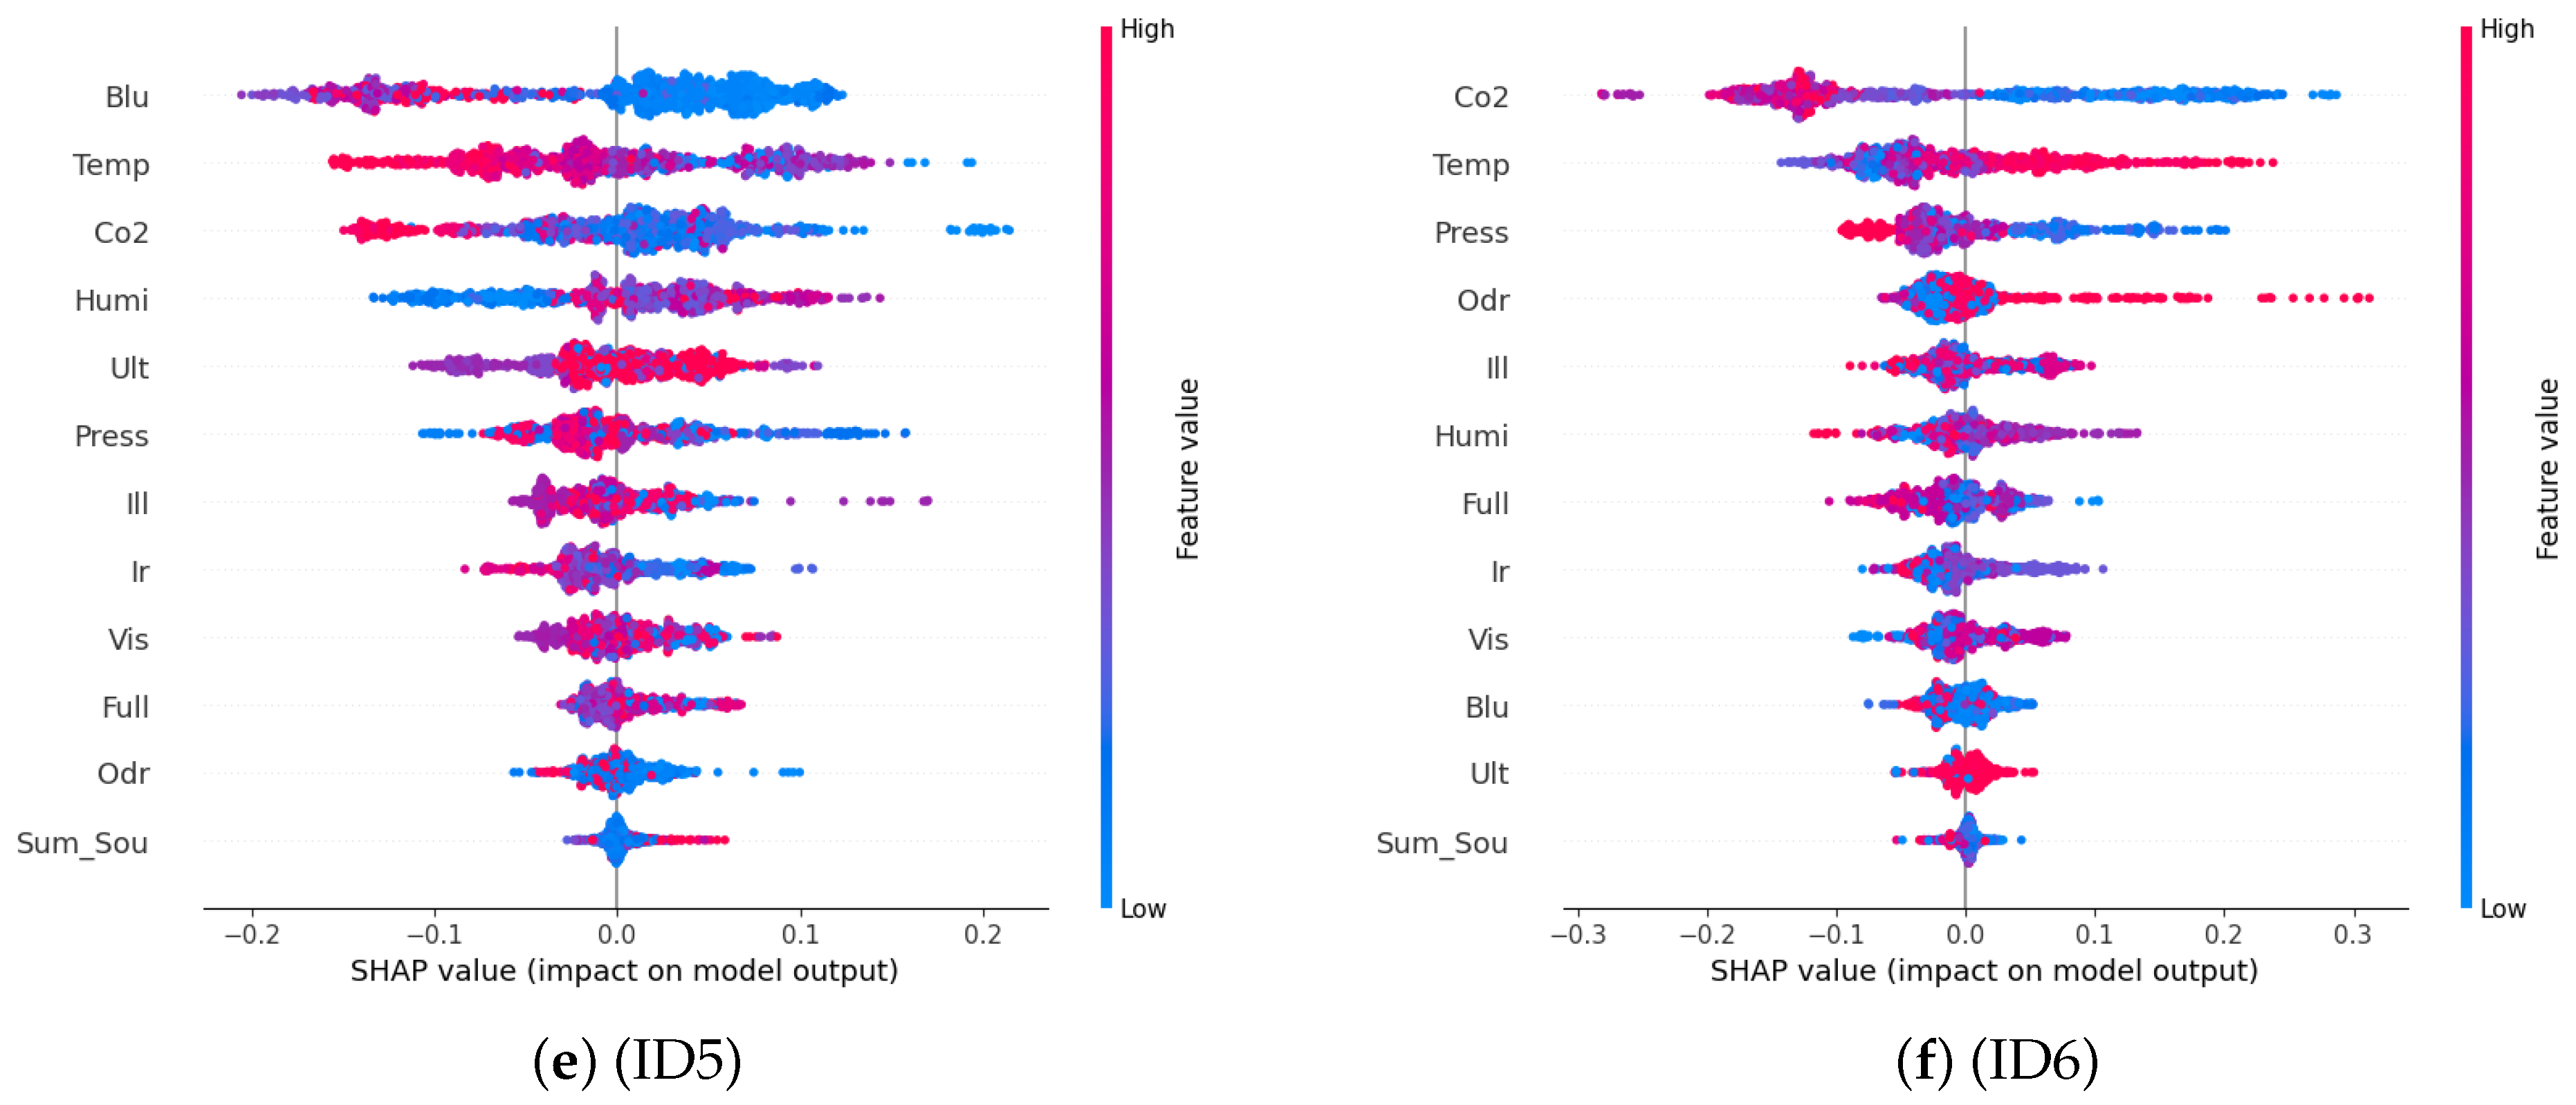
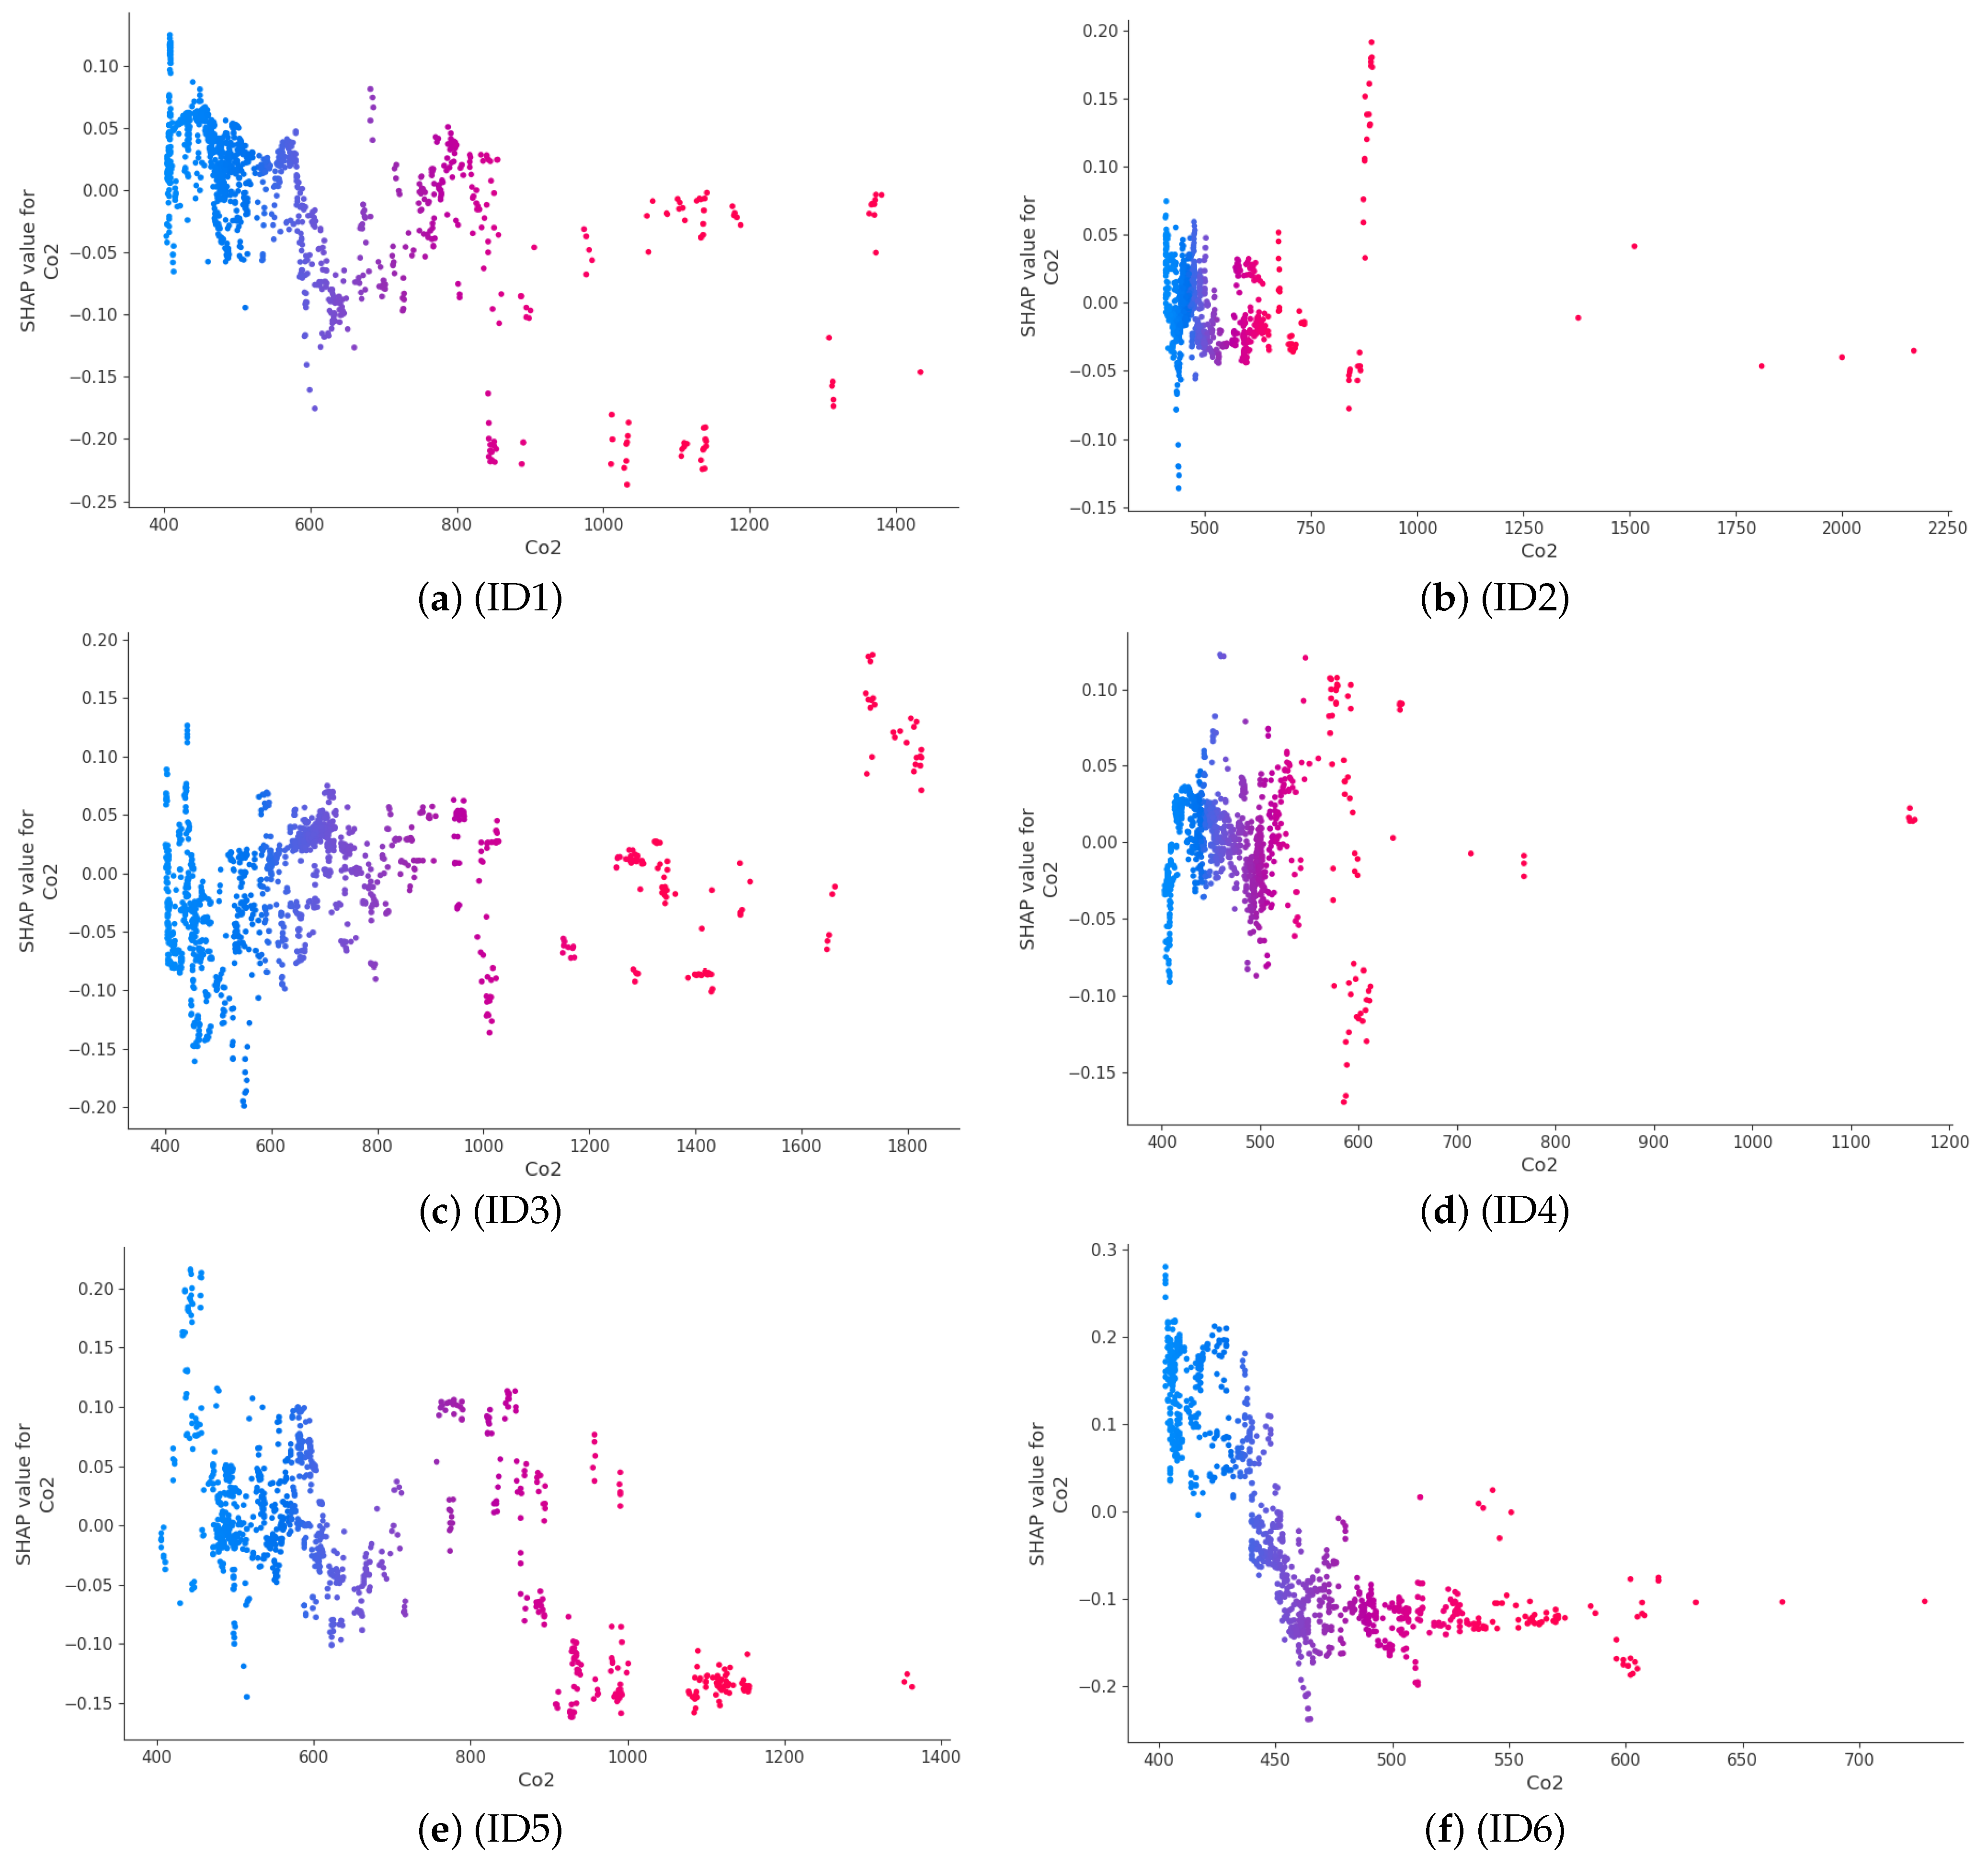
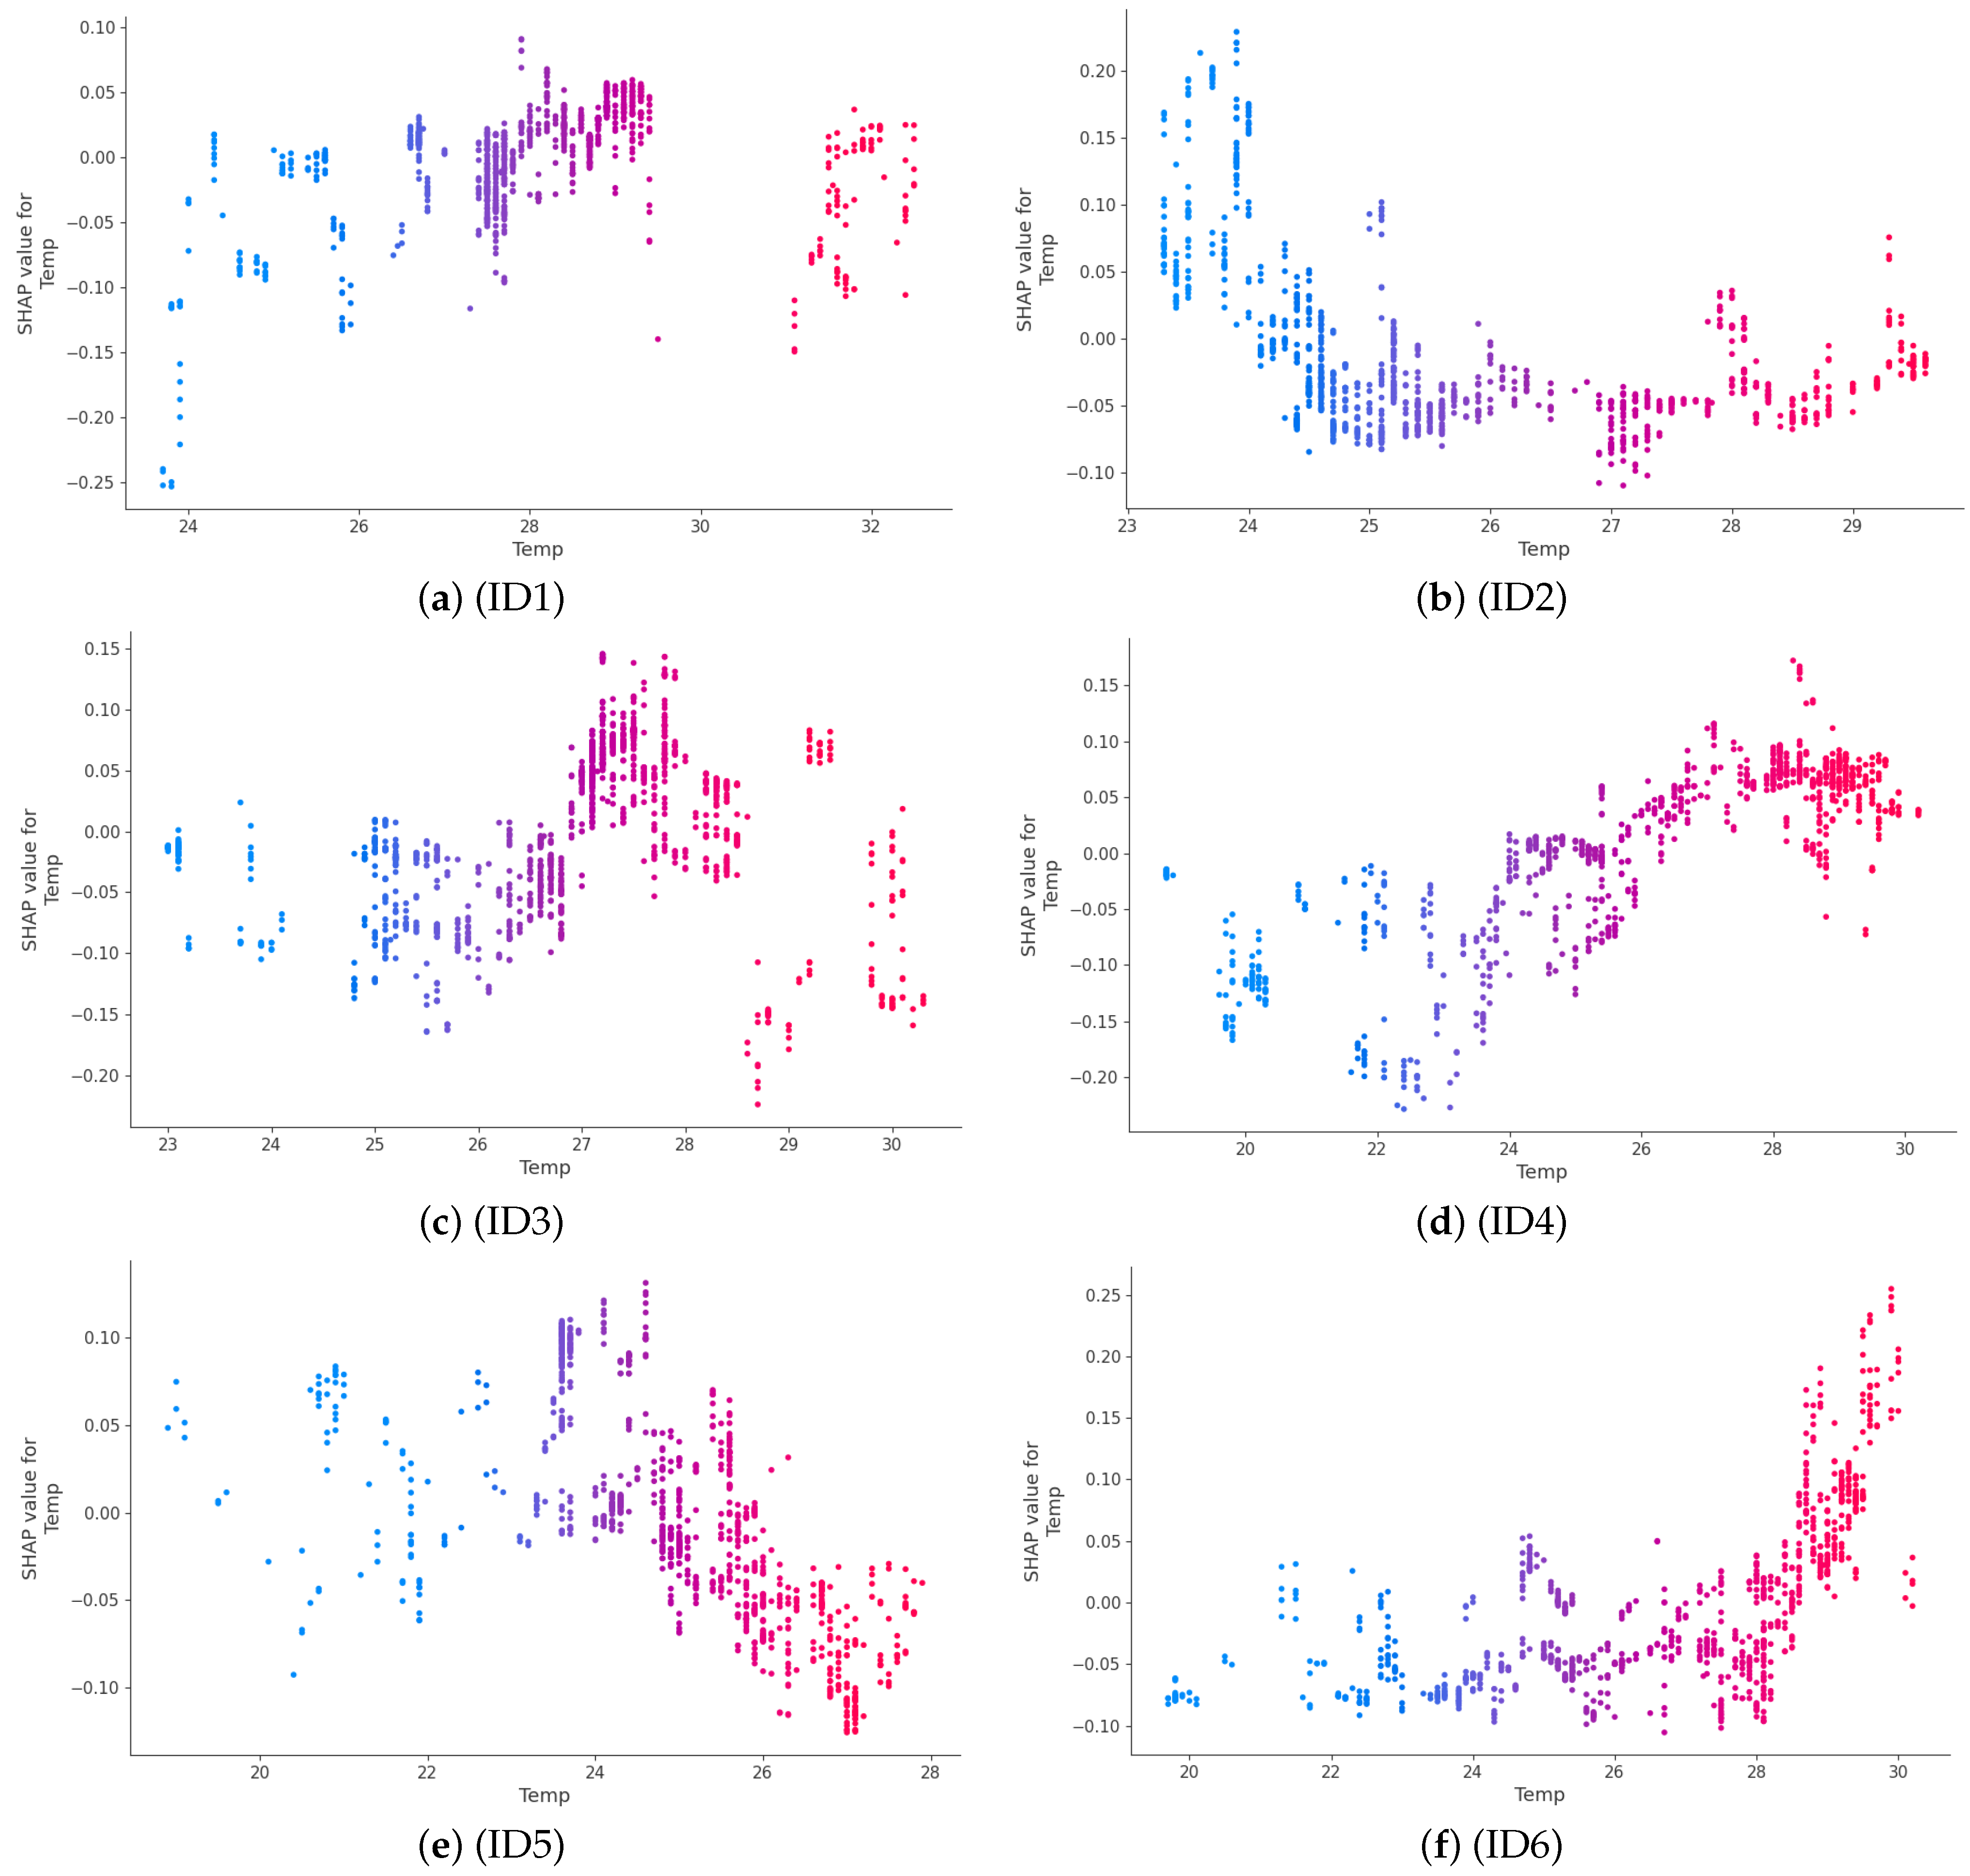

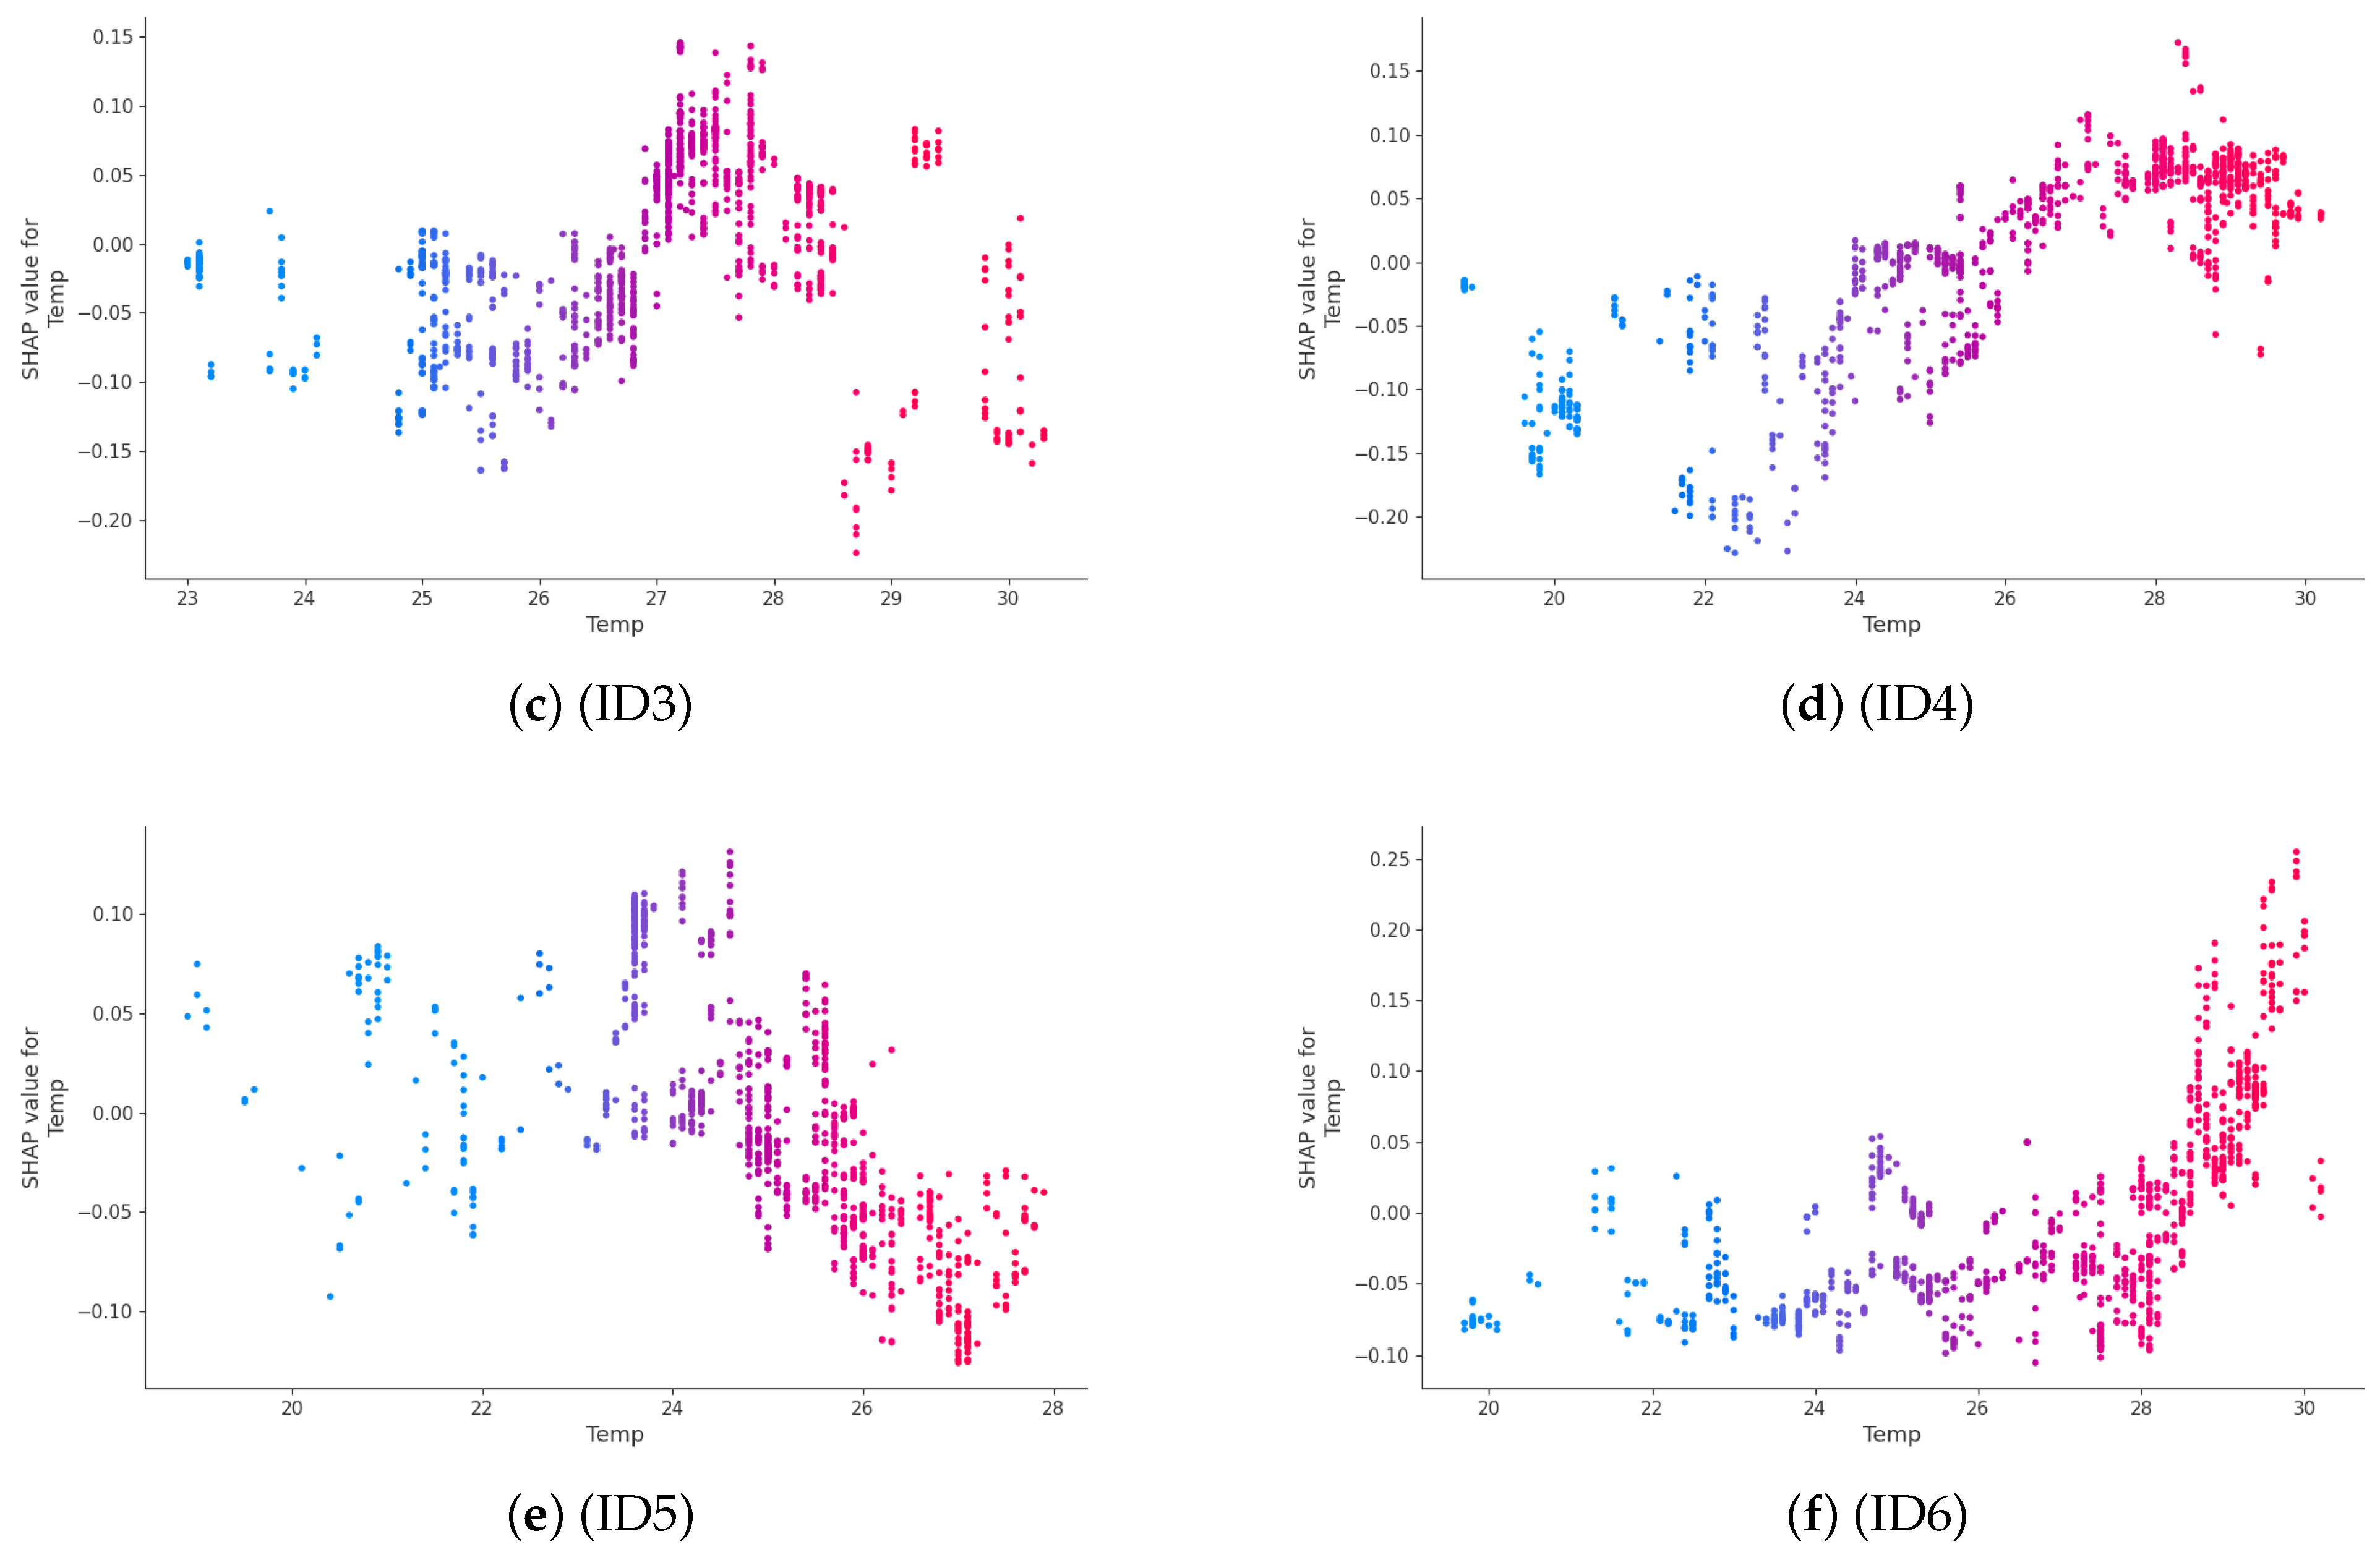


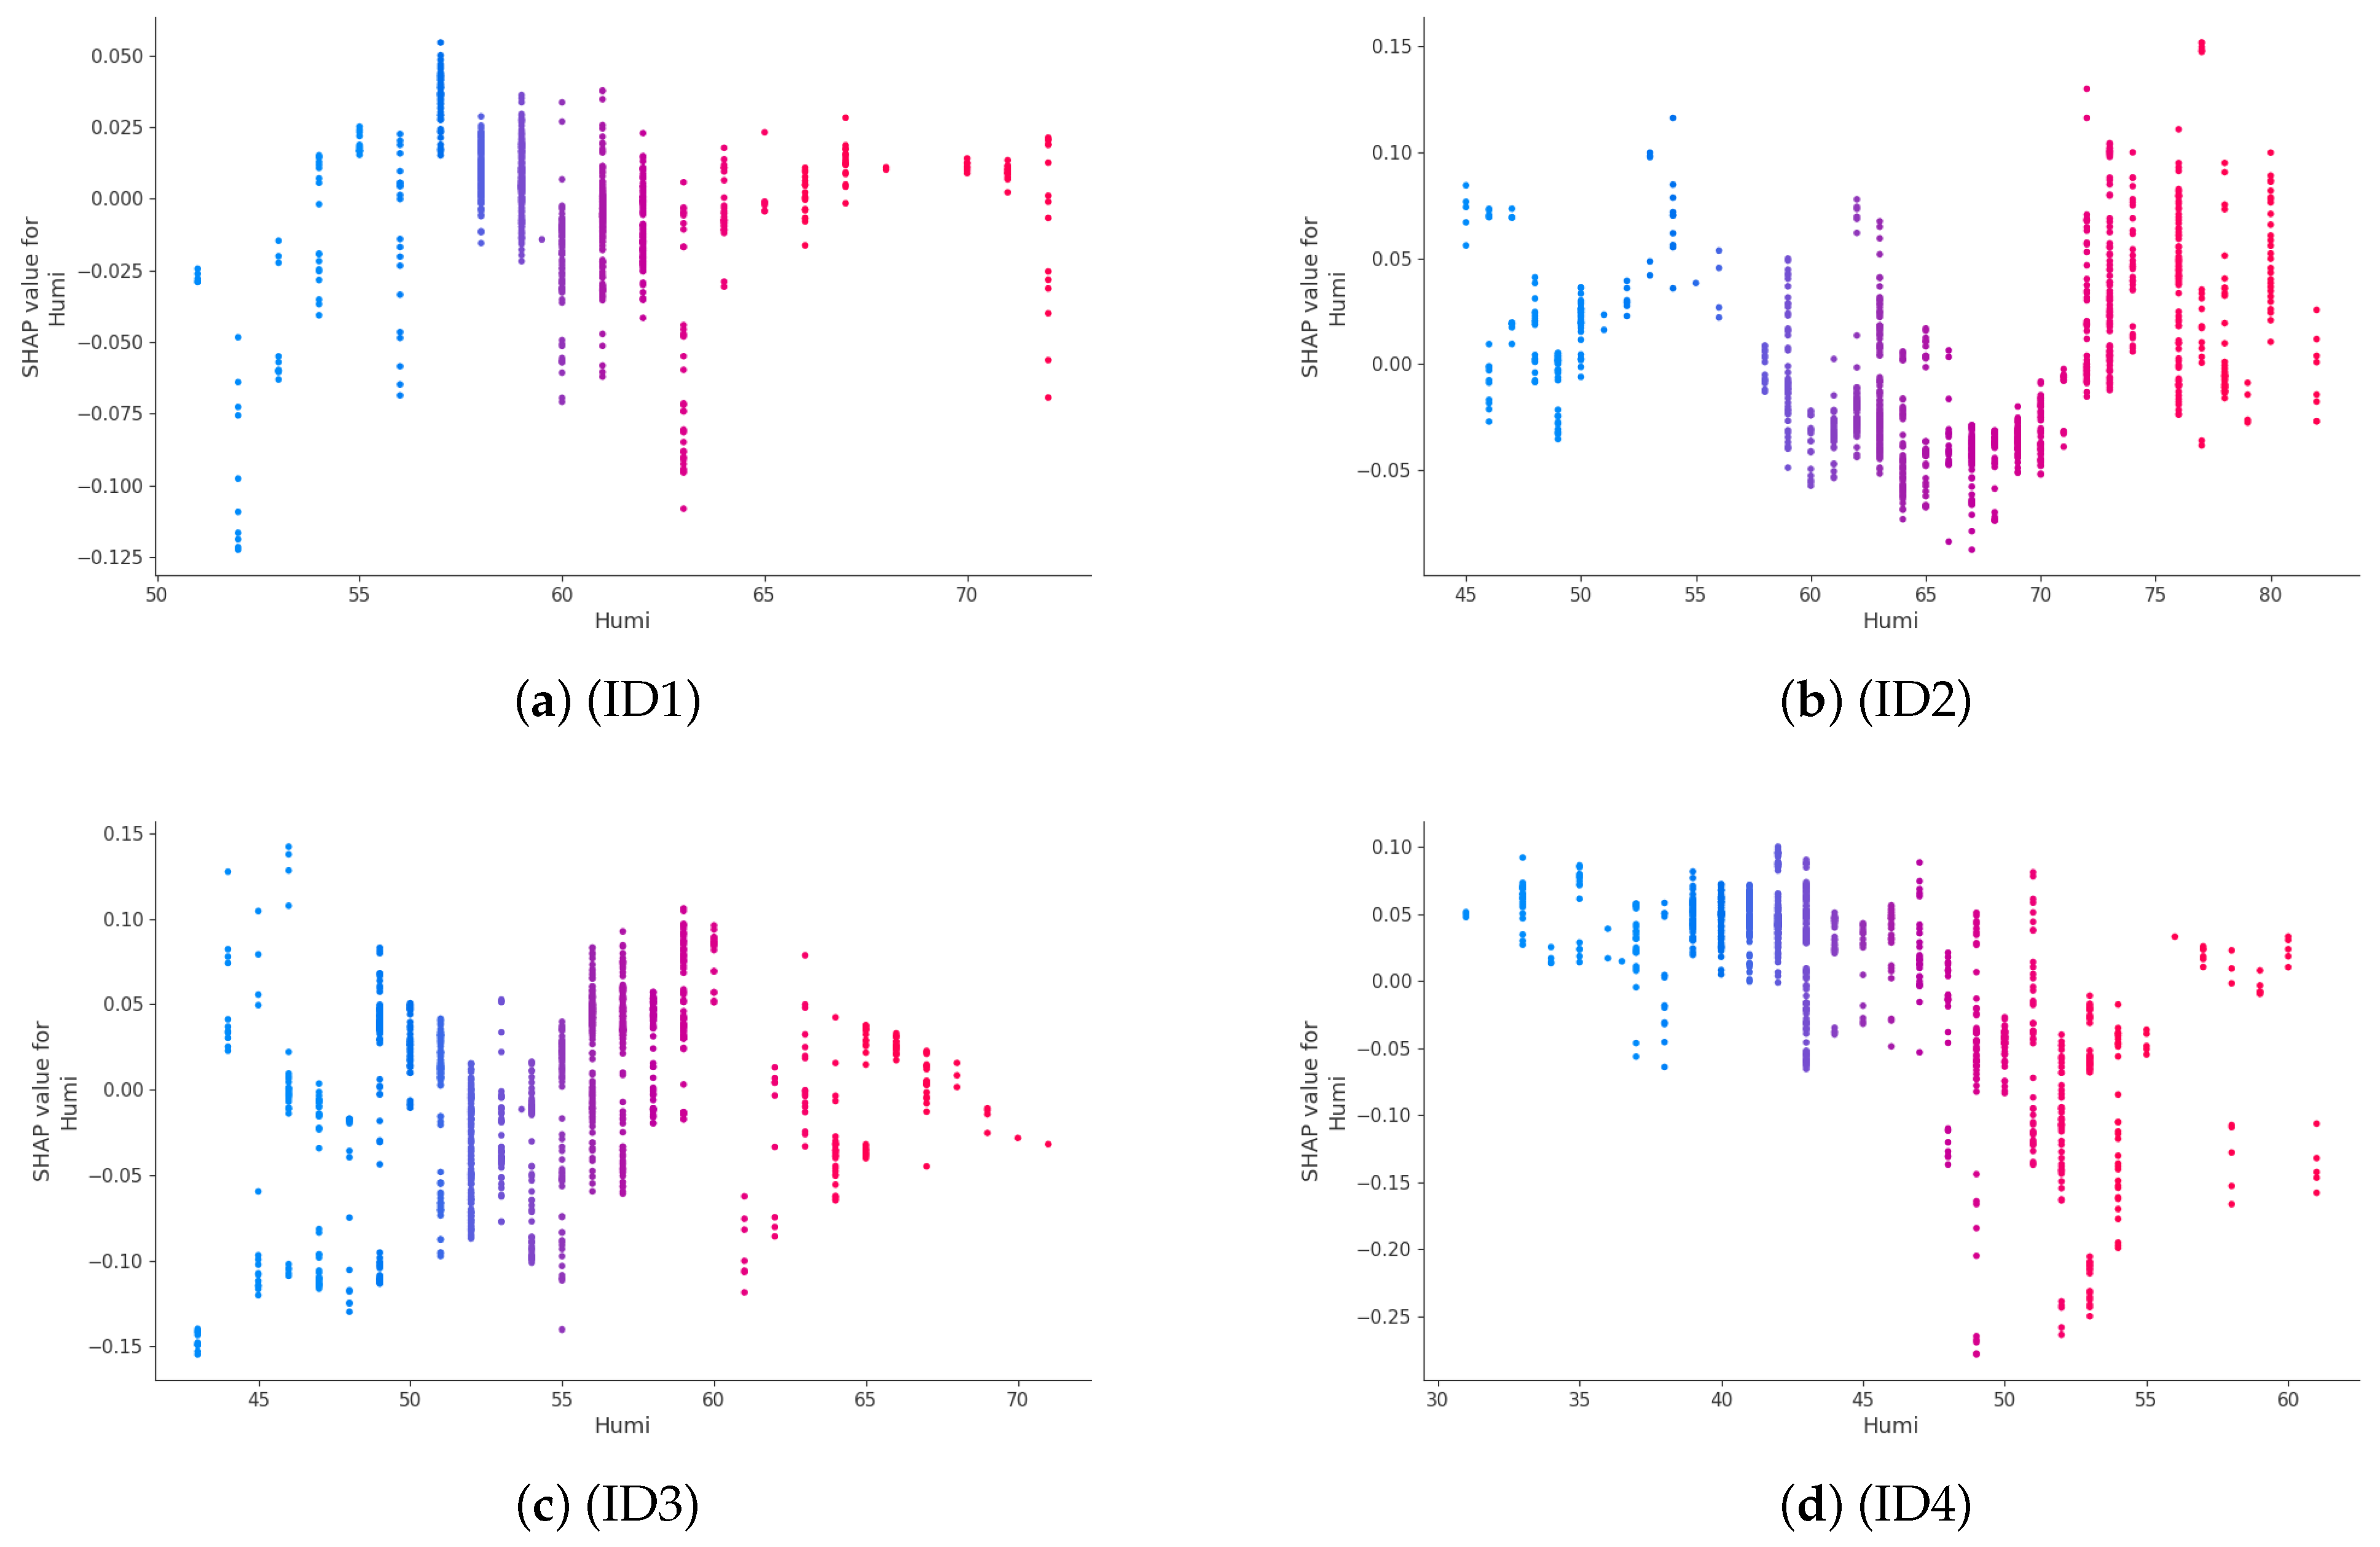

| Environmental Data | Sensor (Model, Principle) |
|---|---|
| Temperature (°C) | DHT11—Measures temperature |
| Humidity (%) | via resistance change and humidity via capacitance change. |
| CO2 concentration (ppm) | MH-Z19C—Detects CO2 by infrared absorption at 4.26 m. |
| Illuminance (lux) | TSL25721—Photodiodes sensitive to visible + IR and IR only. |
| Visible light (output, 0–1023) | |
| Infrared light rays (output, 0–1023) | |
| Full light rays (visible light + infrared rays) | |
| Intensity of blue light (output, 0–1023) | CDS393-B—CdS cell with blue filter; resistance varies with light intensity. |
| Sound level (output, 0–1023) | DFR0034—Vibration of electrodes alters capacitance. |
| Smell (output, 0–1023) | TGS2450—Conductivity change in response to sulfur compounds. |
| Ultrasonic distance (cm) | HC-SR04—Distance measured by ultrasonic reflection time. |
| Barometric pressure (hPa) | BME280—Thin-film resistance change due to pressure deformation. |
| Parameter | Value |
|---|---|
| random_state | 42 |
| max_depth | 10 |
| n_estimator | 30 |
| Parameter | Value |
|---|---|
| num_boost_round | 100 |
| early_stopping_rounds | 10 |
| Time | Temp. | Hum. | Light (Inf.) | Light (Full) | Light (Vis.) | Ill. | Blue | Soumd | Smell | Ultra. | Barometric | CO2 | Emotion |
|---|---|---|---|---|---|---|---|---|---|---|---|---|---|
| 09:18:20 | 23.4 | 61 | 83 | 319 | 236 | 719 | 841 | 43 | 1017 | 171.9 | 1010 | 432 | HAPPY |
| 09:18:30 | 23.4 | 62 | 83 | 322 | 239 | 733 | 847 | 47 | 1016 | 173.16 | 1010 | 432 | HAPPY |
| 09:18:40 | 23.4 | 61 | 83 | 322 | 239 | 733 | 847 | 48 | 1017 | 174.08 | 1010 | 432 | HAPPY |
| 09:18:50 | 23.3 | 61 | 84 | 323 | 239 | 729 | 852 | 59 | 1017 | 172.75 | 1010 | 432 | HAPPY |
| 09:19:00 | 23.4 | 61 | 84 | 323 | 239 | 729 | 848 | 44 | 1018 | 173.2 | 1010 | 431 | HAPPY |
| Train | Test | ||||||||||
|---|---|---|---|---|---|---|---|---|---|---|---|
| ID1 | Precision | Recall | F1 Score | Number | ID1 | Precision | Recall | F1 Score | Number | ||
| Pleasure | 0.94 | 0.80 | 0.87 | 1353 | Pleasure | 0.84 | 0.69 | 0.76 | 296 | ||
| Unpleasure | 0.92 | 0.98 | 0.95 | 3187 | Unpleasure | 0.90 | 0.95 | 0.92 | 844 | ||
| Macro avg | 0.93 | 0.89 | 0.91 | 4540 | Macro avg | 0.87 | 0.82 | 0.84 | 1140 | ||
| Accuracy | 0.93 | Accuracy | 0.88 | ||||||||
| ID2 | Precision | Recall | F1 Score | Number | ID2 | Precision | Recall | F1 Score | Number | ||
| Pleasure | 0.94 | 0.99 | 0.97 | 3507 | Pleasure | 0.87 | 0.94 | 0.90 | 853 | ||
| Unpleasure | 0.97 | 0.81 | 0.88 | 1138 | Unpleasure | 0.79 | 0.61 | 0.69 | 312 | ||
| Macro avg | 0.96 | 0.90 | 0.93 | 4645 | Macro avg | 0.83 | 0.77 | 0.79 | 1165 | ||
| Accuracy | 0.95 | Accuracy | 0.85 | ||||||||
| ID3 | Precision | Recall | F1 Score | Number | ID3 | Precision | Recall | F1 Score | Number | ||
| Pleasure | 0.97 | 0.95 | 0.96 | 1972 | Pleasure | 0.93 | 0.86 | 0.90 | 493 | ||
| Unpleasure | 0.97 | 0.98 | 0.98 | 3548 | Unpleasure | 0.93 | 0.96 | 0.95 | 887 | ||
| Macro avg | 0.97 | 0.97 | 0.97 | 5520 | Macro avg | 0.93 | 0.91 | 0.92 | 1380 | ||
| Accuracy | 0.97 | Accuracy | 0.93 | ||||||||
| ID4 | Precision | Recall | F1 Score | Number | ID4 | Precision | Recall | F1 Score | Number | ||
| Pleasure | 0.94 | 0.89 | 0.92 | 1150 | Pleasure | 0.75 | 0.68 | 0.72 | 256 | ||
| Unpleasure | 0.96 | 0.98 | 0.97 | 3230 | Unpleasure | 0.91 | 0.93 | 0.92 | 844 | ||
| Macro avg | 0.95 | 0.94 | 0.94 | 4380 | Macro avg | 0.83 | 0.81 | 0.82 | 1100 | ||
| Accuracy | 0.96 | Accuracy | 0.87 | ||||||||
| ID5 | Precision | Recall | F1 Score | Number | ID5 | Precision | Recall | F1 Score | Number | ||
| Pleasure | 0.96 | 0.95 | 0.96 | 2496 | Pleasure | 0.92 | 0.92 | 0.92 | 685 | ||
| Unpleasure | 0.93 | 0.93 | 0.93 | 1564 | Unpleasure | 0.83 | 0.84 | 0.83 | 335 | ||
| Macro avg | 0.94 | 0.94 | 0.94 | 4060 | Macro avg | 0.88 | 0.88 | 0.88 | 1020 | ||
| Accuracy | 0.95 | Accuracy | 0.89 | ||||||||
| ID6 | Precision | Recall | F1 Score | Number | ID6 | Precision | Recall | F1 Score | Number | ||
| Pleasure | 0.95 | 0.97 | 0.96 | 2528 | Pleasure | 0.86 | 0.91 | 0.88 | 655 | ||
| Unpleasure | 0.94 | 0.92 | 0.93 | 1552 | Unpleasure | 0.82 | 0.74 | 0.77 | 370 | ||
| Macro avg | 0.95 | 0.94 | 0.94 | 4080 | Macro avg | 0.84 | 0.82 | 0.83 | 1025 | ||
| Accuracy | 0.95 | Accuracy | 0.85 | ||||||||
| Train | Test | ||||||||||
|---|---|---|---|---|---|---|---|---|---|---|---|
| ID1 | Precision | Recall | F1 Score | Number | ID1 | precision | Recall | F1 Score | Number | ||
| Pleasure | 0.91 | 0.83 | 0.87 | 1288 | Pleasure | 0.75 | 0.65 | 0.70 | 361 | ||
| Unpleasure | 0.94 | 0.97 | 0.95 | 3252 | Unpleasure | 0.85 | 0.90 | 0.87 | 779 | ||
| Macro avg | 0.92 | 0.90 | 0.91 | 4540 | Macro avg | 0.80 | 0.77 | 0.78 | 1140 | ||
| Accuracy | 0.93 | Accuracy | 0.82 | ||||||||
| ID2 | precision | Recall | F1 Score | Number | ID2 | Precision | Recall | F1 Score | Number | ||
| Pleasure | 0.96 | 0.99 | 0.98 | 3488 | Pleasure | 0.92 | 0.95 | 0.93 | 872 | ||
| Unpleasure | 0.97 | 0.89 | 0.93 | 1157 | Unpleasure | 0.84 | 0.74 | 0.79 | 293 | ||
| Macro avg | 0.96 | 0.94 | 0.95 | 4645 | Macro avg | 0.88 | 0.85 | 0.86 | 1165 | ||
| Accuracy | 0.96 | Accuracy | 0.90 | ||||||||
| ID3 | Precision | Recall | F1 Score | Number | ID3 | Precision | Recall | F1 Score | Number | ||
| Pleasure | 0.97 | 0.97 | 0.97 | 1998 | Pleasure | 0.87 | 0.85 | 0.86 | 467 | ||
| Unpleasure | 0.98 | 0.98 | 0.98 | 3522 | Unpleasure | 0.92 | 0.94 | 0.93 | 913 | ||
| Macro avg | 0.98 | 0.98 | 0.98 | 5520 | Macro avg | 0.90 | 0.89 | 0.89 | 1380 | ||
| Accuracy | 0.98 | Accuracy | 0.91 | ||||||||
| ID4 | Precision | Recall | F1 Score | Number | ID4 | Precision | Recall | F1 Score | Number | ||
| Pleasure | 0.94 | 0.84 | 0.89 | 1069 | Pleasure | 0.82 | 0.60 | 0.69 | 337 | ||
| Unpleasure | 0.95 | 0.98 | 0.97 | 3311 | Unpleasure | 0.84 | 0.94 | 0.89 | 763 | ||
| Macro avg | 0.94 | 0.91 | 0.93 | 4380 | Macro avg | 0.83 | 0.77 | 0.79 | 1100 | ||
| Accuracy | 0.95 | Accuracy | 0.84 | ||||||||
| ID5 | Precision | Recall | F1 Score | Number | ID5 | Precision | Recall | F1 Score | Number | ||
| Pleasure | 0.96 | 0.96 | 0.96 | 2613 | Pleasure | 0.85 | 0.88 | 0.87 | 568 | ||
| Unpleasure | 0.92 | 0.93 | 0.93 | 1447 | Unpleasure | 0.85 | 0.80 | 0.82 | 452 | ||
| Macro avg | 0.94 | 0.94 | 0.94 | 4060 | Macro avg | 0.85 | 0.84 | 0.85 | 1020 | ||
| Accuracy | 0.95 | Accuracy | 0.85 | ||||||||
| ID6 | Precision | Recall | F1 Score | Number | ID6 | Precision | Recall | F1 Score | Number | ||
| Pleasure | 0.96 | 0.96 | 0.96 | 2508 | Pleasure | 0.91 | 0.90 | 0.90 | 675 | ||
| Unpleasure | 0.93 | 0.93 | 0.93 | 1572 | Unpleasure | 0.81 | 0.83 | 0.82 | 350 | ||
| Macro avg | 0.94 | 0.95 | 0.95 | 4080 | Macro avg | 0.86 | 0.86 | 0.86 | 1025 | ||
| Accuracy | 0.95 | Accuracy | 0.87 | ||||||||
| Random Forest | GBDT | ||
|---|---|---|---|
| Parameter | Count | Parameter | Count |
| CO2 Concentration | 6 |
CO2 Concentration Temperature | 6 |
| Temperature | 5 | ||
| Barometric Pressure | 4 | Humidity | 5 |
| Humidity | 3 |
Barometric Pressure Blue Light | 2 |
| Odor | 2 | ||
| Blue Light Full Ray Infrared Ray Ultrasonic Distance | 1 | Odor Infrared Ray Ultrasonic Distance | 1 |
| Visible Ray Sound level Illuminance | 0 | Visible Ray Full Ray Sound level Illuminance | 0 |
Disclaimer/Publisher’s Note: The statements, opinions and data contained in all publications are solely those of the individual author(s) and contributor(s) and not of MDPI and/or the editor(s). MDPI and/or the editor(s) disclaim responsibility for any injury to people or property resulting from any ideas, methods, instructions or products referred to in the content. |
© 2025 by the authors. Licensee MDPI, Basel, Switzerland. This article is an open access article distributed under the terms and conditions of the Creative Commons Attribution (CC BY) license (https://creativecommons.org/licenses/by/4.0/).
Share and Cite
Toriyama, Y.; Isogami, T.; Komuro, N. Interpretable Emotion Estimation in Indoor Remote Work Environments via Environmental Sensor Data. Big Data Cogn. Comput. 2025, 9, 243. https://doi.org/10.3390/bdcc9100243
Toriyama Y, Isogami T, Komuro N. Interpretable Emotion Estimation in Indoor Remote Work Environments via Environmental Sensor Data. Big Data and Cognitive Computing. 2025; 9(10):243. https://doi.org/10.3390/bdcc9100243
Chicago/Turabian StyleToriyama, Yuma, Tsumugi Isogami, and Nobuyoshi Komuro. 2025. "Interpretable Emotion Estimation in Indoor Remote Work Environments via Environmental Sensor Data" Big Data and Cognitive Computing 9, no. 10: 243. https://doi.org/10.3390/bdcc9100243
APA StyleToriyama, Y., Isogami, T., & Komuro, N. (2025). Interpretable Emotion Estimation in Indoor Remote Work Environments via Environmental Sensor Data. Big Data and Cognitive Computing, 9(10), 243. https://doi.org/10.3390/bdcc9100243


