Article

Analysis of Highway Vehicle Lane Change Duration Based on Survival Model

School of Civil Engineering and Transportation, South China University of Technology, Guangzhou 510641, China
*
Author to whom correspondence should be addressed.
Big Data Cogn. Comput. 2024, 8(9), 114; https://doi.org/10.3390/bdcc8090114
Submission received: 30 June 2024 / Revised: 21 August 2024 / Accepted: 30 August 2024 / Published: 6 September 2024

Abstract

:
To investigate highway vehicle lane-changing behavior, we utilized the publicly available naturalistic driving dataset, HighD, to extract the movement data of vehicles involved in lane changes and their proximate counterparts. We employed univariate and multivariate Cox proportional hazards models alongside random survival forest models to analyze the influence of various factors on lane change duration, assess their statistical significance, and compare the performance of multiple random survival forest models. Our findings indicate that several variables significantly impact lane change duration, including the standard deviation of lane-changing vehicles, lane-changing vehicle speed, distance to the following vehicle in the target lane, lane-changing vehicle length, and distance to the following vehicle in the current lane. Notably, the standard deviation and vehicle length act as protective factors, with increases in these variables correlating with longer lane change durations. Conversely, higher lane-changing vehicle speeds and shorter distances to following vehicles in both the current and target lanes are associated with shorter lane change durations, indicating their role as risk factors. Feature variable selection did not substantially improve the training performance of the random survival forest model based on our findings. However, validation set evaluation showed that careful feature variable selection can enhance model accuracy, leading to improved AUC values. These insights lay the groundwork for advancing research in predicting lane-changing behaviors, understanding lane-changing intentions, and developing pre-emptive safety measures against hazardous lane changes.

1. Introduction

Traffic safety has become a subject of global concern. Hazardous lane changes are a leading cause of traffic safety issues [1]. Statistical analyses reveal that approximately 4 to 10 percent of traffic incidents stem from lane-changing maneuvers [2]. These maneuvers notably exacerbate traffic delays. Lane-changing is a routine strategy in vehicle operation, necessitating the management of operational information from surrounding vehicles. This requirement substantially elevates the complexity of the driving task, potentially leading to vehicle conflicts and crashes [3]. Given the safety challenges posed by lane-changing maneuvers, it is imperative to investigate the factors influencing lane changes, their duration, and other related characteristics. Such research is essential for developing theoretical frameworks to support the prediction of lane-changing trajectories, the recognition of lane-changing intentions, and the issuance of warnings about hazardous lane changes.
The investigation into the dynamics of vehicle lane-changing predominantly examines the factors affecting the duration of lane changes and their probability distributions. Research pertaining to the determinants of lane-changing duration has largely employed survival analysis techniques, which are categorized into parametric [4,5,6,7], non-parametric [8,9], and semi-parametric models [9,10,11]. Survival analysis, also known as lifespan data analysis or time-to-event analysis, is a modeling framework used to analyze the distribution of expected lifespan or time-to-event occurrence. Within this framework, hazard-based duration models—such as the proportional hazards model, accelerated failure time model, and their derivatives—are frequently utilized to model lane-changing duration due to their capability to incorporate duration dependence [12]. In the realm of fully parametric modeling, it is essential to specify the distributions of duration-dependent or dependent variables. Common distributions employed include Weibull [4,13,14,15], gamma [16,17], lognormal [18,19,20], log-logistic [18,21,22], exponential [4,10], and Gompertz [23]. Ali et al. [4] investigated the survival time of lane change gap intervals using the Weibull accelerated failure time (AFT) gamma frailty model, examining the impacts of driving conditions, operational variables, and driver demographics. Li et al. [5] developed AFT models incorporating fixed parameters, latent classes, and random parameters to explore driver heterogeneity, identifying distinct factors affecting lane-changing durations across vehicle types and directions. Li et al. [10] applied five survival functions with different distributional patterns, finding that a significant majority of vehicles completed lane changes within 3 to 8 s. Ali et al. [13] employed a random parameter hazard-based duration modeling approach to examine lane-changing durations, highlighting differences between autonomous and human-driven vehicles. Ali et al. [14] employed two generalized estimation equation models and a Weibull AFT model to analyze the influence of the connected environment on lane-changing behavior using data from advanced driving simulators. Li et al. [17] constructed a univariate survival model indicating that heavy vehicles exhibit a median lane change duration 0.57 s longer than passenger cars, with heavy vehicle durations primarily associated with their speed and showing minimal interaction with preceding vehicles. To mediate between the clarity of covariate influences and the minimization of model assumptions, semi-parametric methods have been advocated [23]. Chen et al. [24] utilized a random parameter AFT model to address heterogeneity in influencing factors, including speed differentials before and after lane changes.
However, the inherent limitations of parametric models in capturing complex and nonlinear relationships have led some scholars to explore non-parametric models, which analyze lane-changing duration characteristics without presupposing the distribution of model inputs. Relevant techniques include the Kaplan–Meier (KM) non-parametric regression [25,26] and the Nelson–Aalen (NA) estimator [27]. Despite the utility of non-parametric models, they often suffer from a limited interpretability of results. Addressing the shortcomings of both fully parametric and fully non-parametric models, some researchers have applied semi-parametric approaches such as Cox proportional hazard (CPH) models [28,29] and quantile regression [30,31,32] to analyze the duration of traffic events. This approach seeks to balance model interpretability with the flexibility of handling complex data structures. Shang et al. [33] developed a CPH model to analyze lane-changing durations in tunnel and interchange settings, considering factors such as vehicle type, tunnel configuration, ramp design, and road service level.
Contemporary research on lane-changing duration often neglects the impact of surrounding traffic characteristics, such as information regarding preceding and following vehicles, and the spacing between the target vehicle and adjacent vehicles in the intended lane [34]. The driver’s attention primarily focuses on the target lane, initiating a lane change only upon identifying a suitable gap. Moreover, the random survival forest (RSF) model proves advantageous for analyzing right-censored survival data, circumventing the constraints of conventional assumptions by training numerous survival trees to achieve precise predictive outcomes [35]. Hence, this study aims to extract data on lane-changing vehicles and their surrounding operational details from the publicly available HighD naturalistic driving dataset. Utilizing these data, we will develop univariate and multivariate Cox proportional hazards models alongside random survival forest models. These models will enable an investigation into the impact of various factors on lane-changing duration, assess the significance of these factors, and compare the performance of diverse random survival forest models across different groups. This study reveals the mechanisms through which different influencing factors affect the duration of lane-changing for vehicles, providing theoretical support for predicting lane-changing times and analyzing the risk of lane-changing conflicts.

2. Material and Methods

2.1. Data and Preprocessing

The HighD dataset archives vehicular trajectory data collected from six distinct locations along the Cologne highway in Germany spanning the period from 2017 to 2018. This data acquisition was facilitated by unmanned aerial vehicles (drones), spanning a cumulative observation duration of 16.5 h, with a sampling frequency of 25 frames per second. The dataset encompasses approximately 44,500 km of accumulated travel by the sampled vehicles, capturing information from over 110,000 vehicles and in excess of 11,000 lane-changing incidents.
To investigate how the operational conditions surrounding vehicles affect the duration of lane-changing maneuvers, we subjected the lane-changing samples from the dataset to meticulous processes. These processes included data filtration to remove irrelevant or incomplete information, supplementation to add missing details, and extraction to isolate the key variables relevant to our study. The methodologies applied included the following: (1) evaluating the completeness of lane-changing trajectories based on longitudinal vehicle speed and acceleration, thereby eliminating incomplete data samples; (2) filtering lane-changing samples to exclude instances where the surrounding vehicle data were inadequate, specifically extracting samples involving the presence of a leading vehicle (V1), following vehicle (V2), leading vehicle in the target lane (V3), and following vehicle in the target lane (V4) during the lane-changing event, as depicted in Figure 1; and (3) supplementing interactional data between lane-changing vehicles and their surrounding counterparts, incorporating variables such as speed differentials with leading and following vehicles, distances to these vehicles, and corresponding variables in the target lane context. These procedures were essential for refining the dataset to facilitate a comprehensive investigation into the dynamics of lane-changing behaviors influenced by surrounding vehicle operational states.
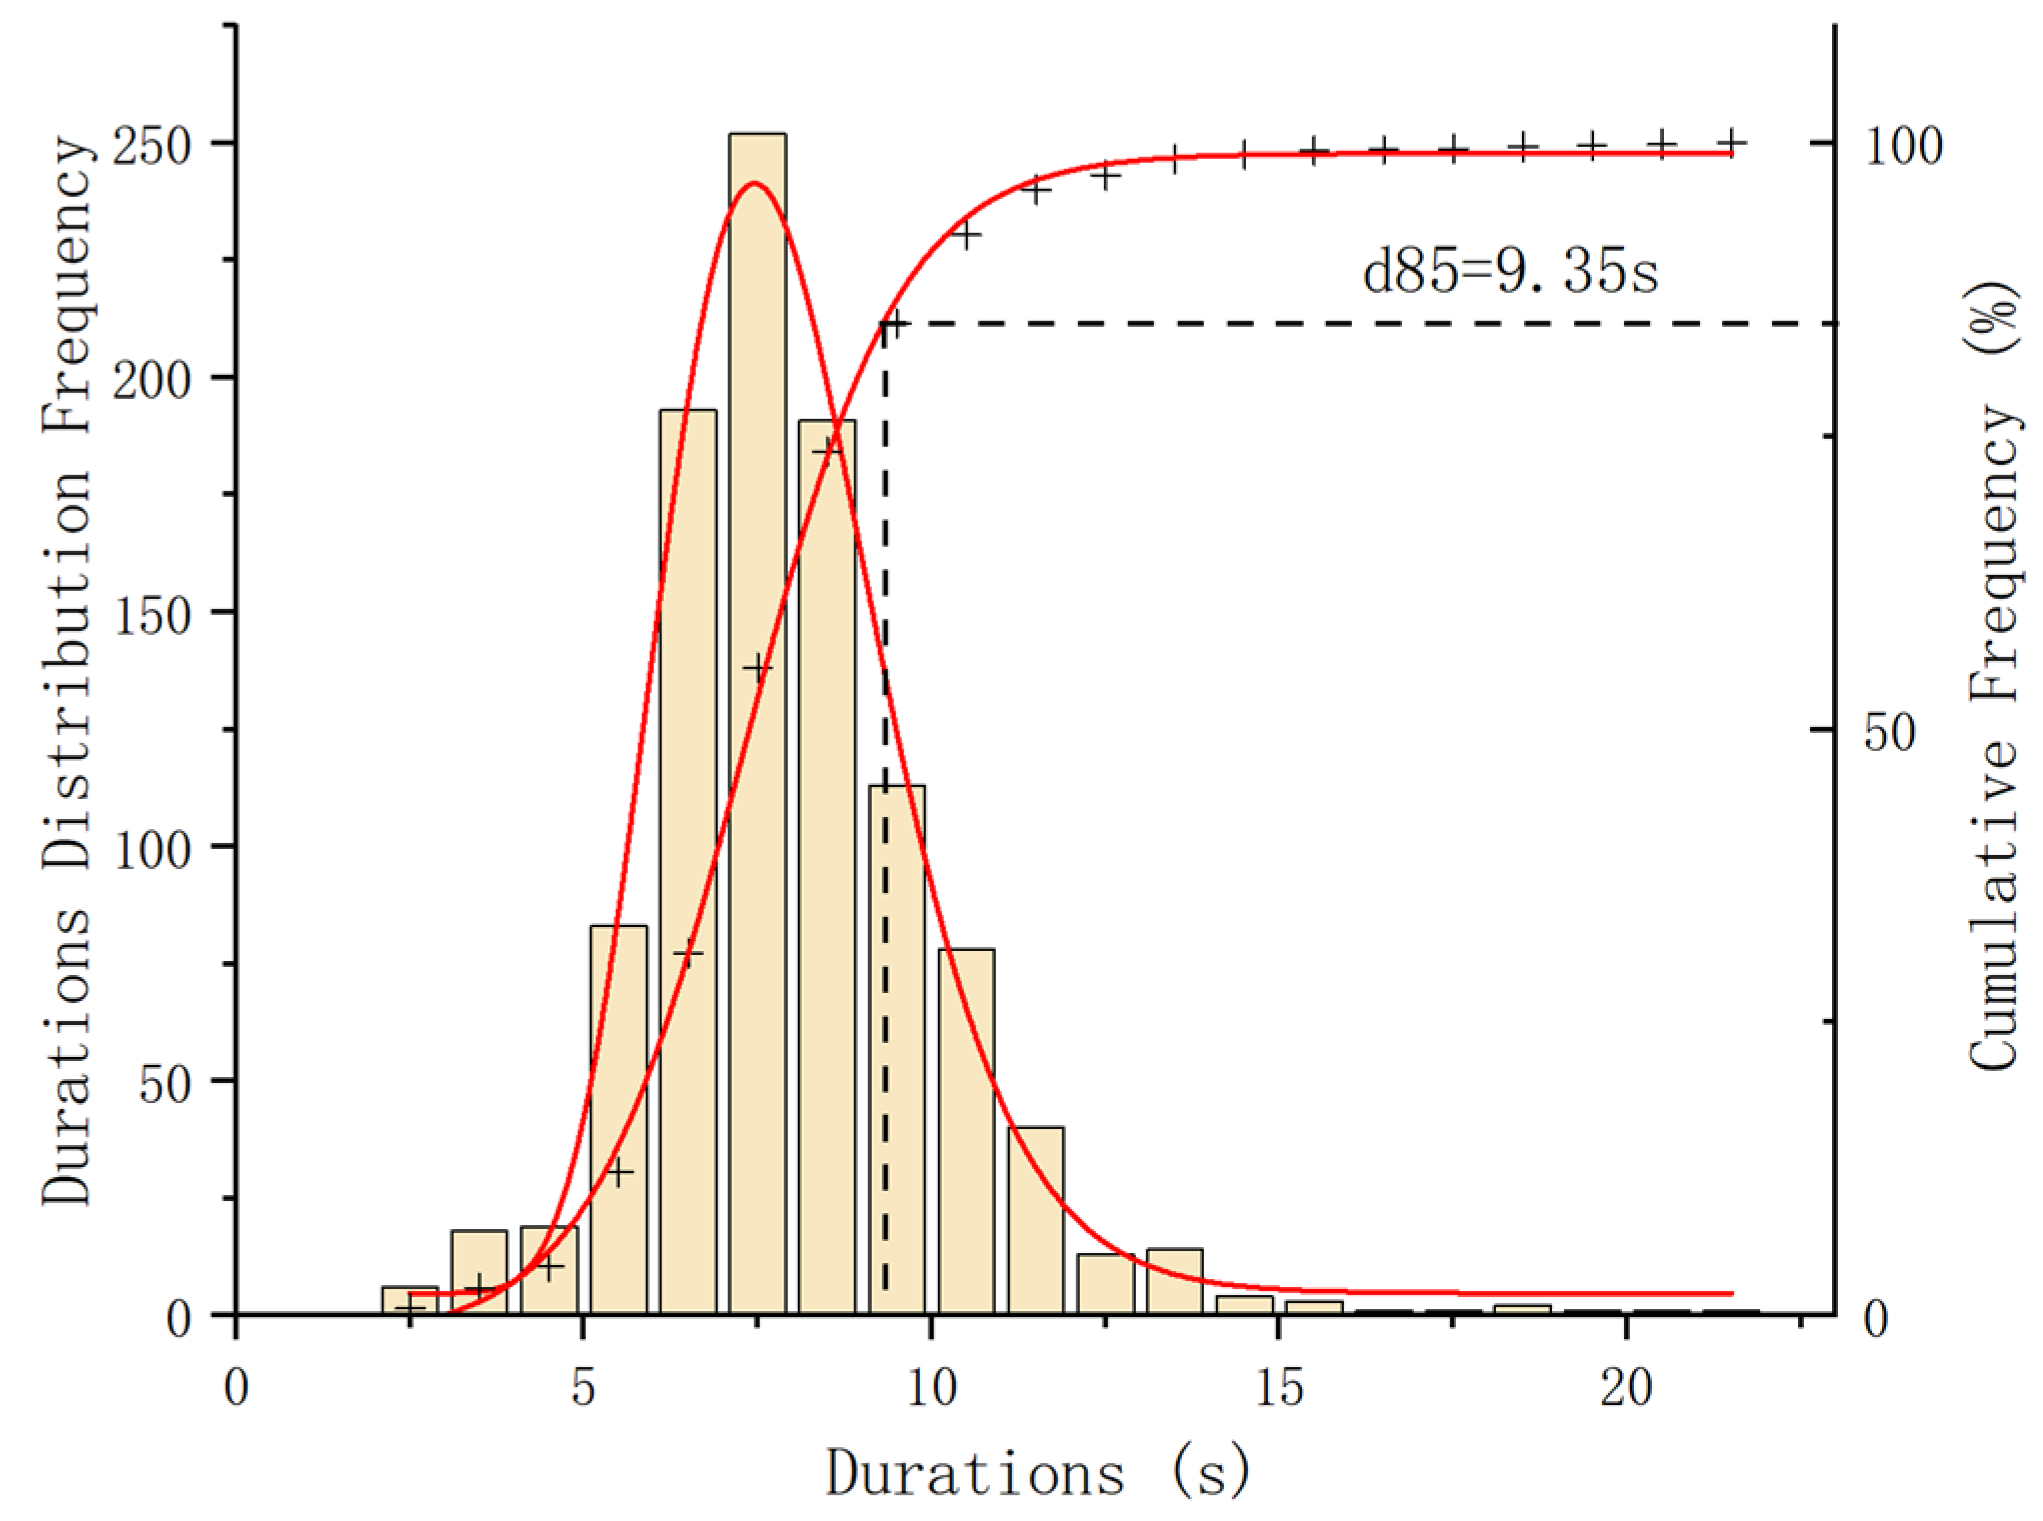
Following the established methodology for processing lane change sample data, 1034 valid lane change trajectories were identified, exhibiting durations spanning from 2.48 s to a maximum of 21.56 s. A comprehensive depiction of the distribution of lane change durations is presented in Figure 2. In the figure, the red line represents the lane change durations distribution frequency curve, while the red starred line represents the cumulative frequency curve of lane change durations distribution. From the cumulative frequency curve, it can be seen that 85% of vehicles completed their lane change within 9.35 s.

2.2. Methods

2.2.1. Problem Description

T denotes the duration of lane-changing for the target vehicle, which is a non-negative random variable. Its cumulative distribution function can be expressed as follows:
F t = P T t = 0 0 f x d x ,         t 0
where P represents the probability of an event occurring, f(x) is the probability density function of the survival time T, and t is any given time. The probability density function of the survival time T can be expressed as follows:
f t = d F t d t = lim Δ t 0 P t < T < t + Δ t Δ t ,       t 0
where Δ t is the instantaneous increment at time t.
The survival function of the duration T of lane-changing for the target vehicle represents the probability that the lane-changing duration exceeds t. The specific expression is
S t = P T > t = 1 F t = t f x d x ,     t 0
The lane change starts from the lateral displacement of the vehicle. When the lane change time T has continued to t, the instantaneous probability of completing the lane change process and driving to the center line of the target lane within time Δ t is represented by h(t), which is the risk function of the lane change duration T. This is expressed as follows:
h t = lim Δ t 0 P t < T < t + Δ t | T t Δ t = lim Δ t 0 S t S t + Δ t Δ t S t ,   t 0

2.2.2. COX Proportional Hazards Model

The Cox proportional hazards model is a semi-parametric model for multiplicative hazard rates, proposed by the British statistician David R. Cox in 1972 [36]. This model does not assume that survival data follow a specific distribution, and the estimated properties are not dependent on the chosen survival time distribution. It can analyze the distribution patterns of survival time as well as the impact of covariates on survival time.
t > 0 is the duration of lane-changing, and the vector X = [X1, …, Xn] represents the influencing factor variables (covariates) associated with t. Then, the hazard function considering the covariates is the following:
h t / X = h 0 t exp a X
where h0(t) is the baseline hazard function, which represents the hazard function when all covariates are zero or in their standard state, and it is generally unknown; X is the vector of influencing factors; and a is the vector of coefficients corresponding to the influencing factors.

2.2.3. Random Survival Forest Model

The random survival forest (RSF) model, proposed by Ishwaran [35], is a derivative model of random forests. The survival function of each tree in an RSF is obtained using the Nelson–Aalen estimator at the terminal nodes. For any terminal node h, ti,h is the death time of the i-th individual at node h. di,h and Yi,h represent the number of individuals who have ended and not ended at time ti,h, respectively. Then, the cumulative survival function H*(t) at terminal node h is defined as follows:
H * t = t i , h t d i , h Y i , h
The survival function of an RSF is obtained by averaging the survival functions of all the trees:
H t = 1 N b = 1 N t r e e H * t | x i
where Ntree is the number of survival trees in the RSF and xi is a covariate affecting the survival time t.

3. Results

The dataset comprising 1034 instances of vehicle lane-changing events was subjected to analysis and modeling using univariate and multivariate Cox proportional hazards regression methods. This approach was employed to identify significant factors influencing lane change durations and to construct variable groups for both univariate and multivariate Cox proportional hazards regression. The lane change data were randomly partitioned into training and validation sets in a 7:3 ratio, subsequently trained and validated using a random survival forest (RSF) model to assess the relative importance of each factor. Based on variable importance scores (VI), variables were categorized into distinct sets, and comparative experimental analyses were performed across the constructed models.

3.1. Analysis of CPH Model Results

The results of the univariate and multivariate Cox proportional hazards regressions are shown in Table 1, with regression coefficients a < 0 for the protective factor and vice versa for the risk factor and significance < 0.05 considered statistically significant. From the results of univariate Cox proportional hazards regression, a total of 11 variables were found to be significant. Among these, the length of lane-changing vehicles (Length), the time headway (THW), the speed difference with the following vehicle in the target lane (DelV4), and the standard deviation of the lane-changing vehicle’s speed (SD) are protective factors. An increase in these variables increases the probability of a longer lane-changing duration. On the other hand, the speed of lane-changing vehicles (V0), the distance headway (DHW), the speed of the leading vehicle in the current lane (V1), the distance to the following vehicle in the current lane (DV2), the speed difference with the leading vehicle in the target lane (DelV3), the distance to the leading vehicle in the target lane (DV3), and the distance to the following vehicle in the target lane (DV4) are risk factors. An increase in these variables increases the probability of a shorter lane change duration. From the multivariate Cox proportional hazards regression results, five variables were significant, of which the length of the lane-changing vehicle (Length) and the standard deviation of the lane-changing vehicle’s speed (SD) were protective factors, while the speed of the lane-changing vehicle (V0), the distance to the following vehicle in the current lane (DV2), and the distance to the following vehicle in the target lane (DV4) were risk factors.

3.2. Analysis of RSF Model Results

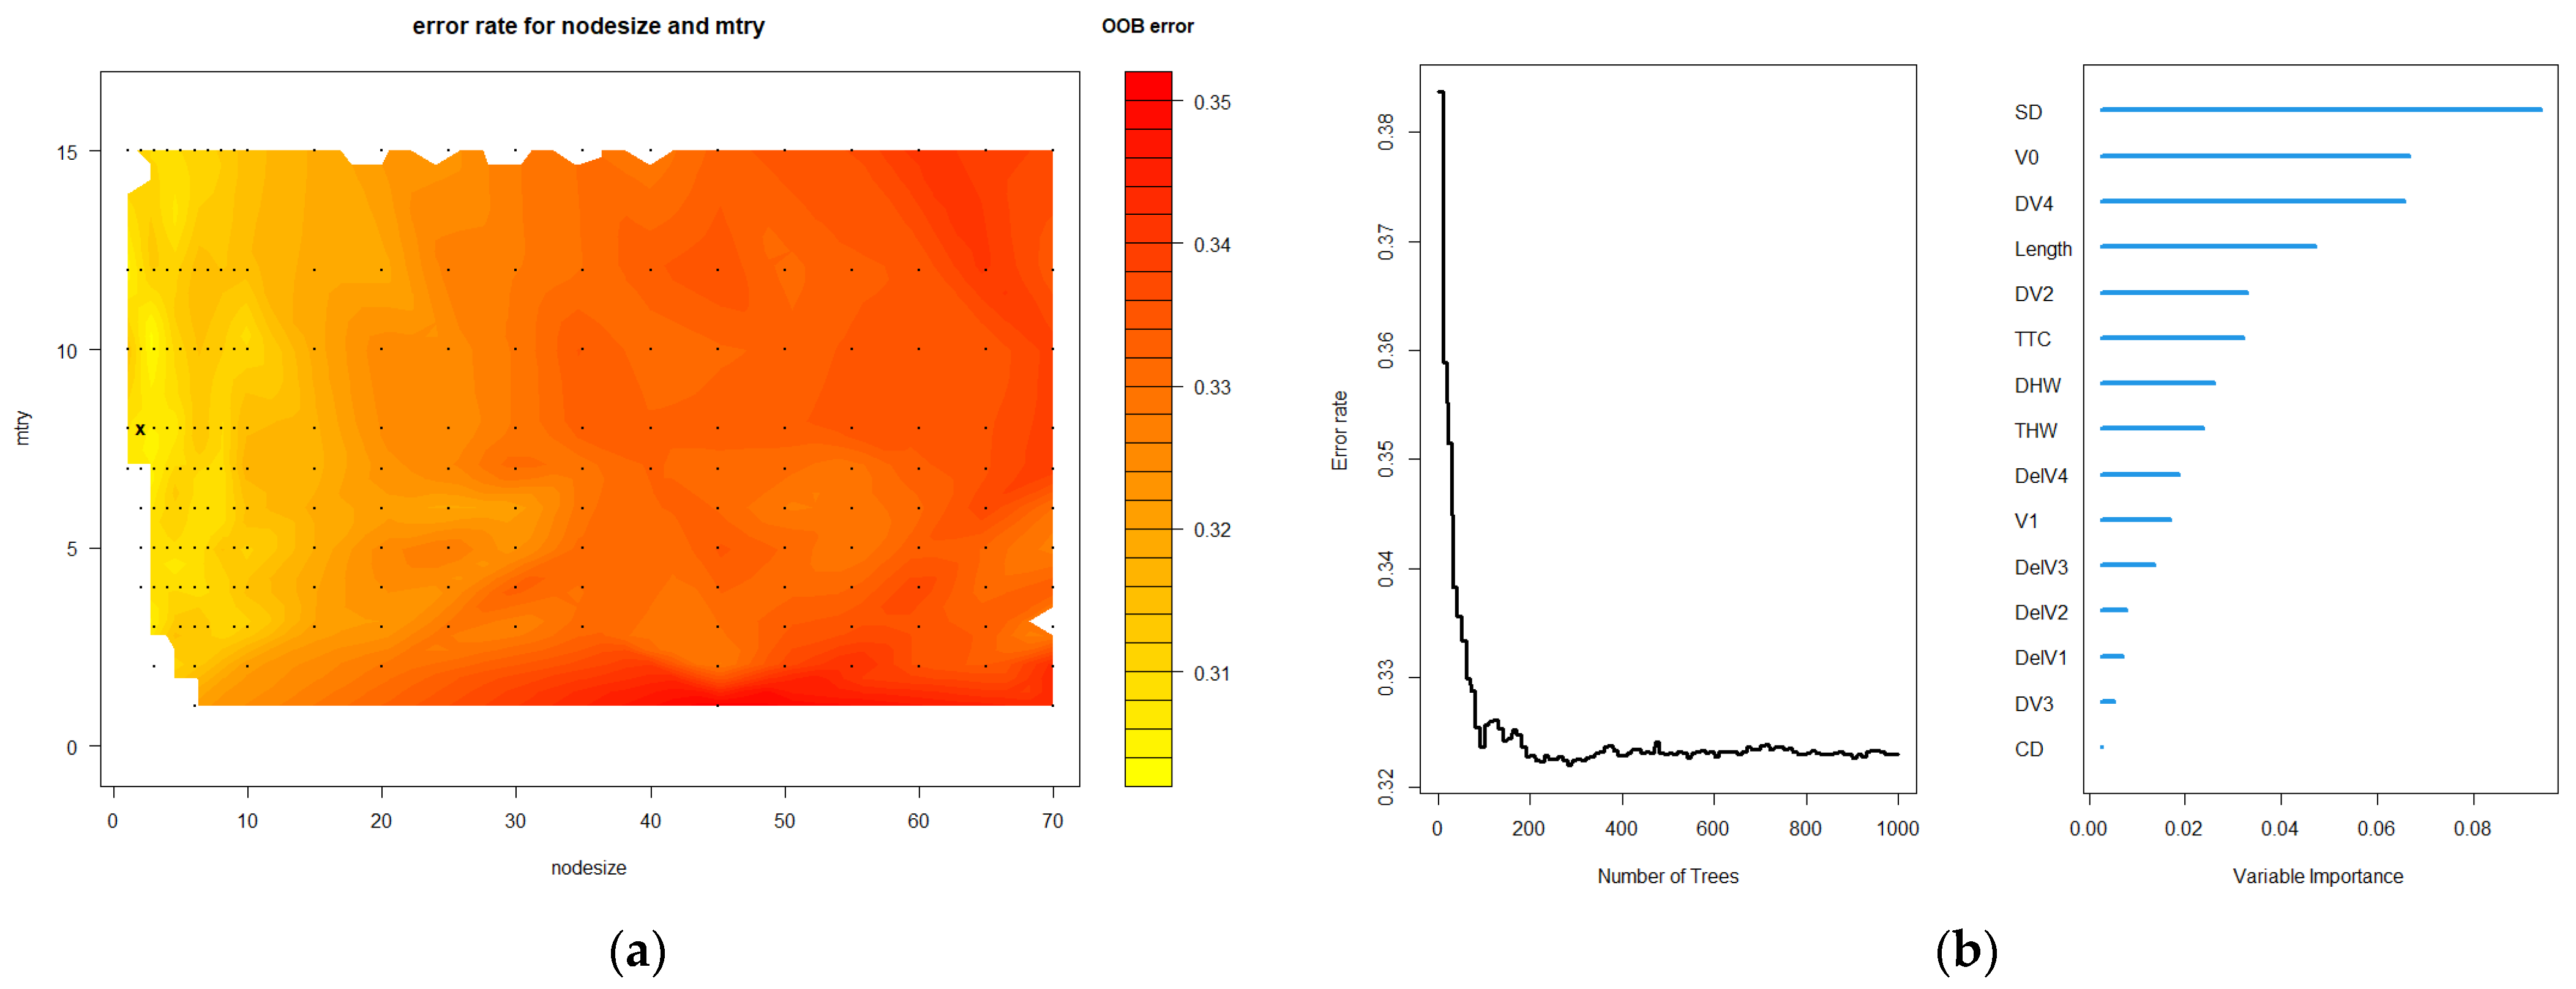
The RSF model was trained using all variables, with the hyperparameters optimized based on OOB error. The optimization results are shown in Figure 3a, where the optimal nodesize value is 8 and the optimal mtry value is 2. After setting the corresponding hyperparameters, the training results and the variable importance (VI) for the all-variable RSF (A-RSF) model are shown in Figure 3b.
Based on the VI values of the A-RSF model, variables were grouped as follows: the C1-variable group with VI > 0.01, the C2-variable group with VI > 0.02, and the C3-variable group with VI > 0.03. Combined with the significant variables identified from the Cox proportional hazards regression analysis, a total of six variable groups are divided, and the division of each variable group is shown in Table 2.
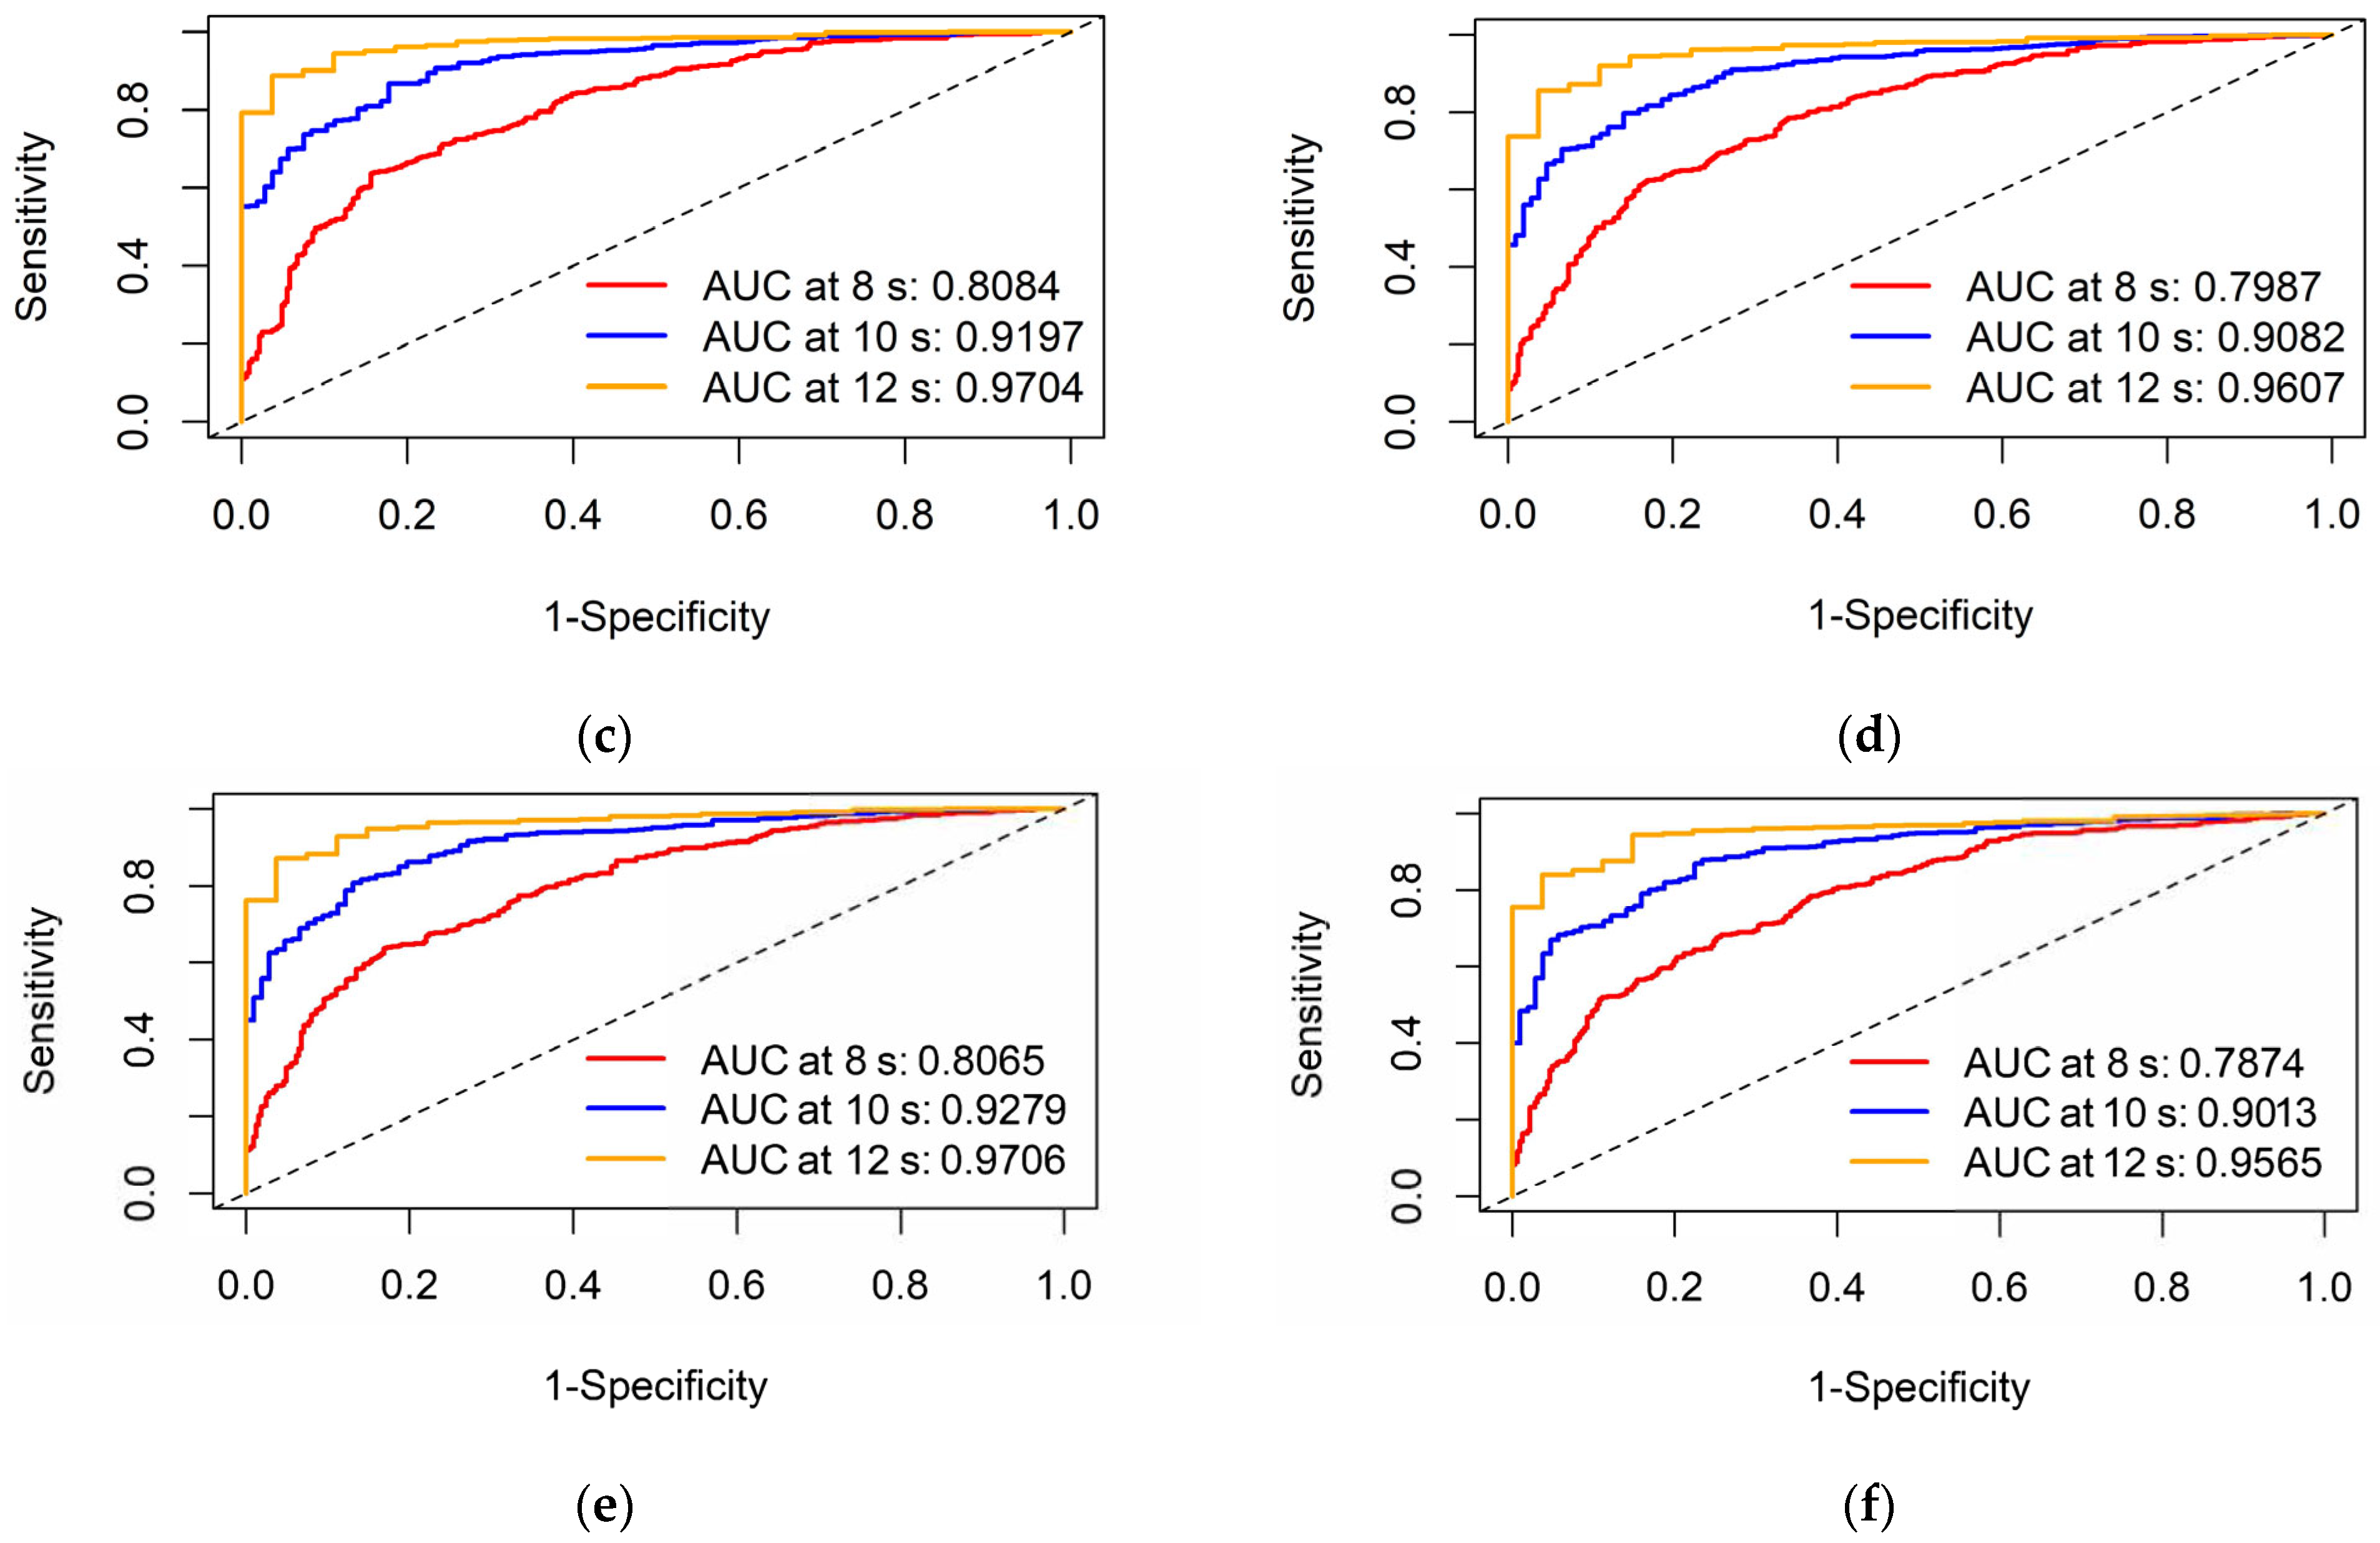
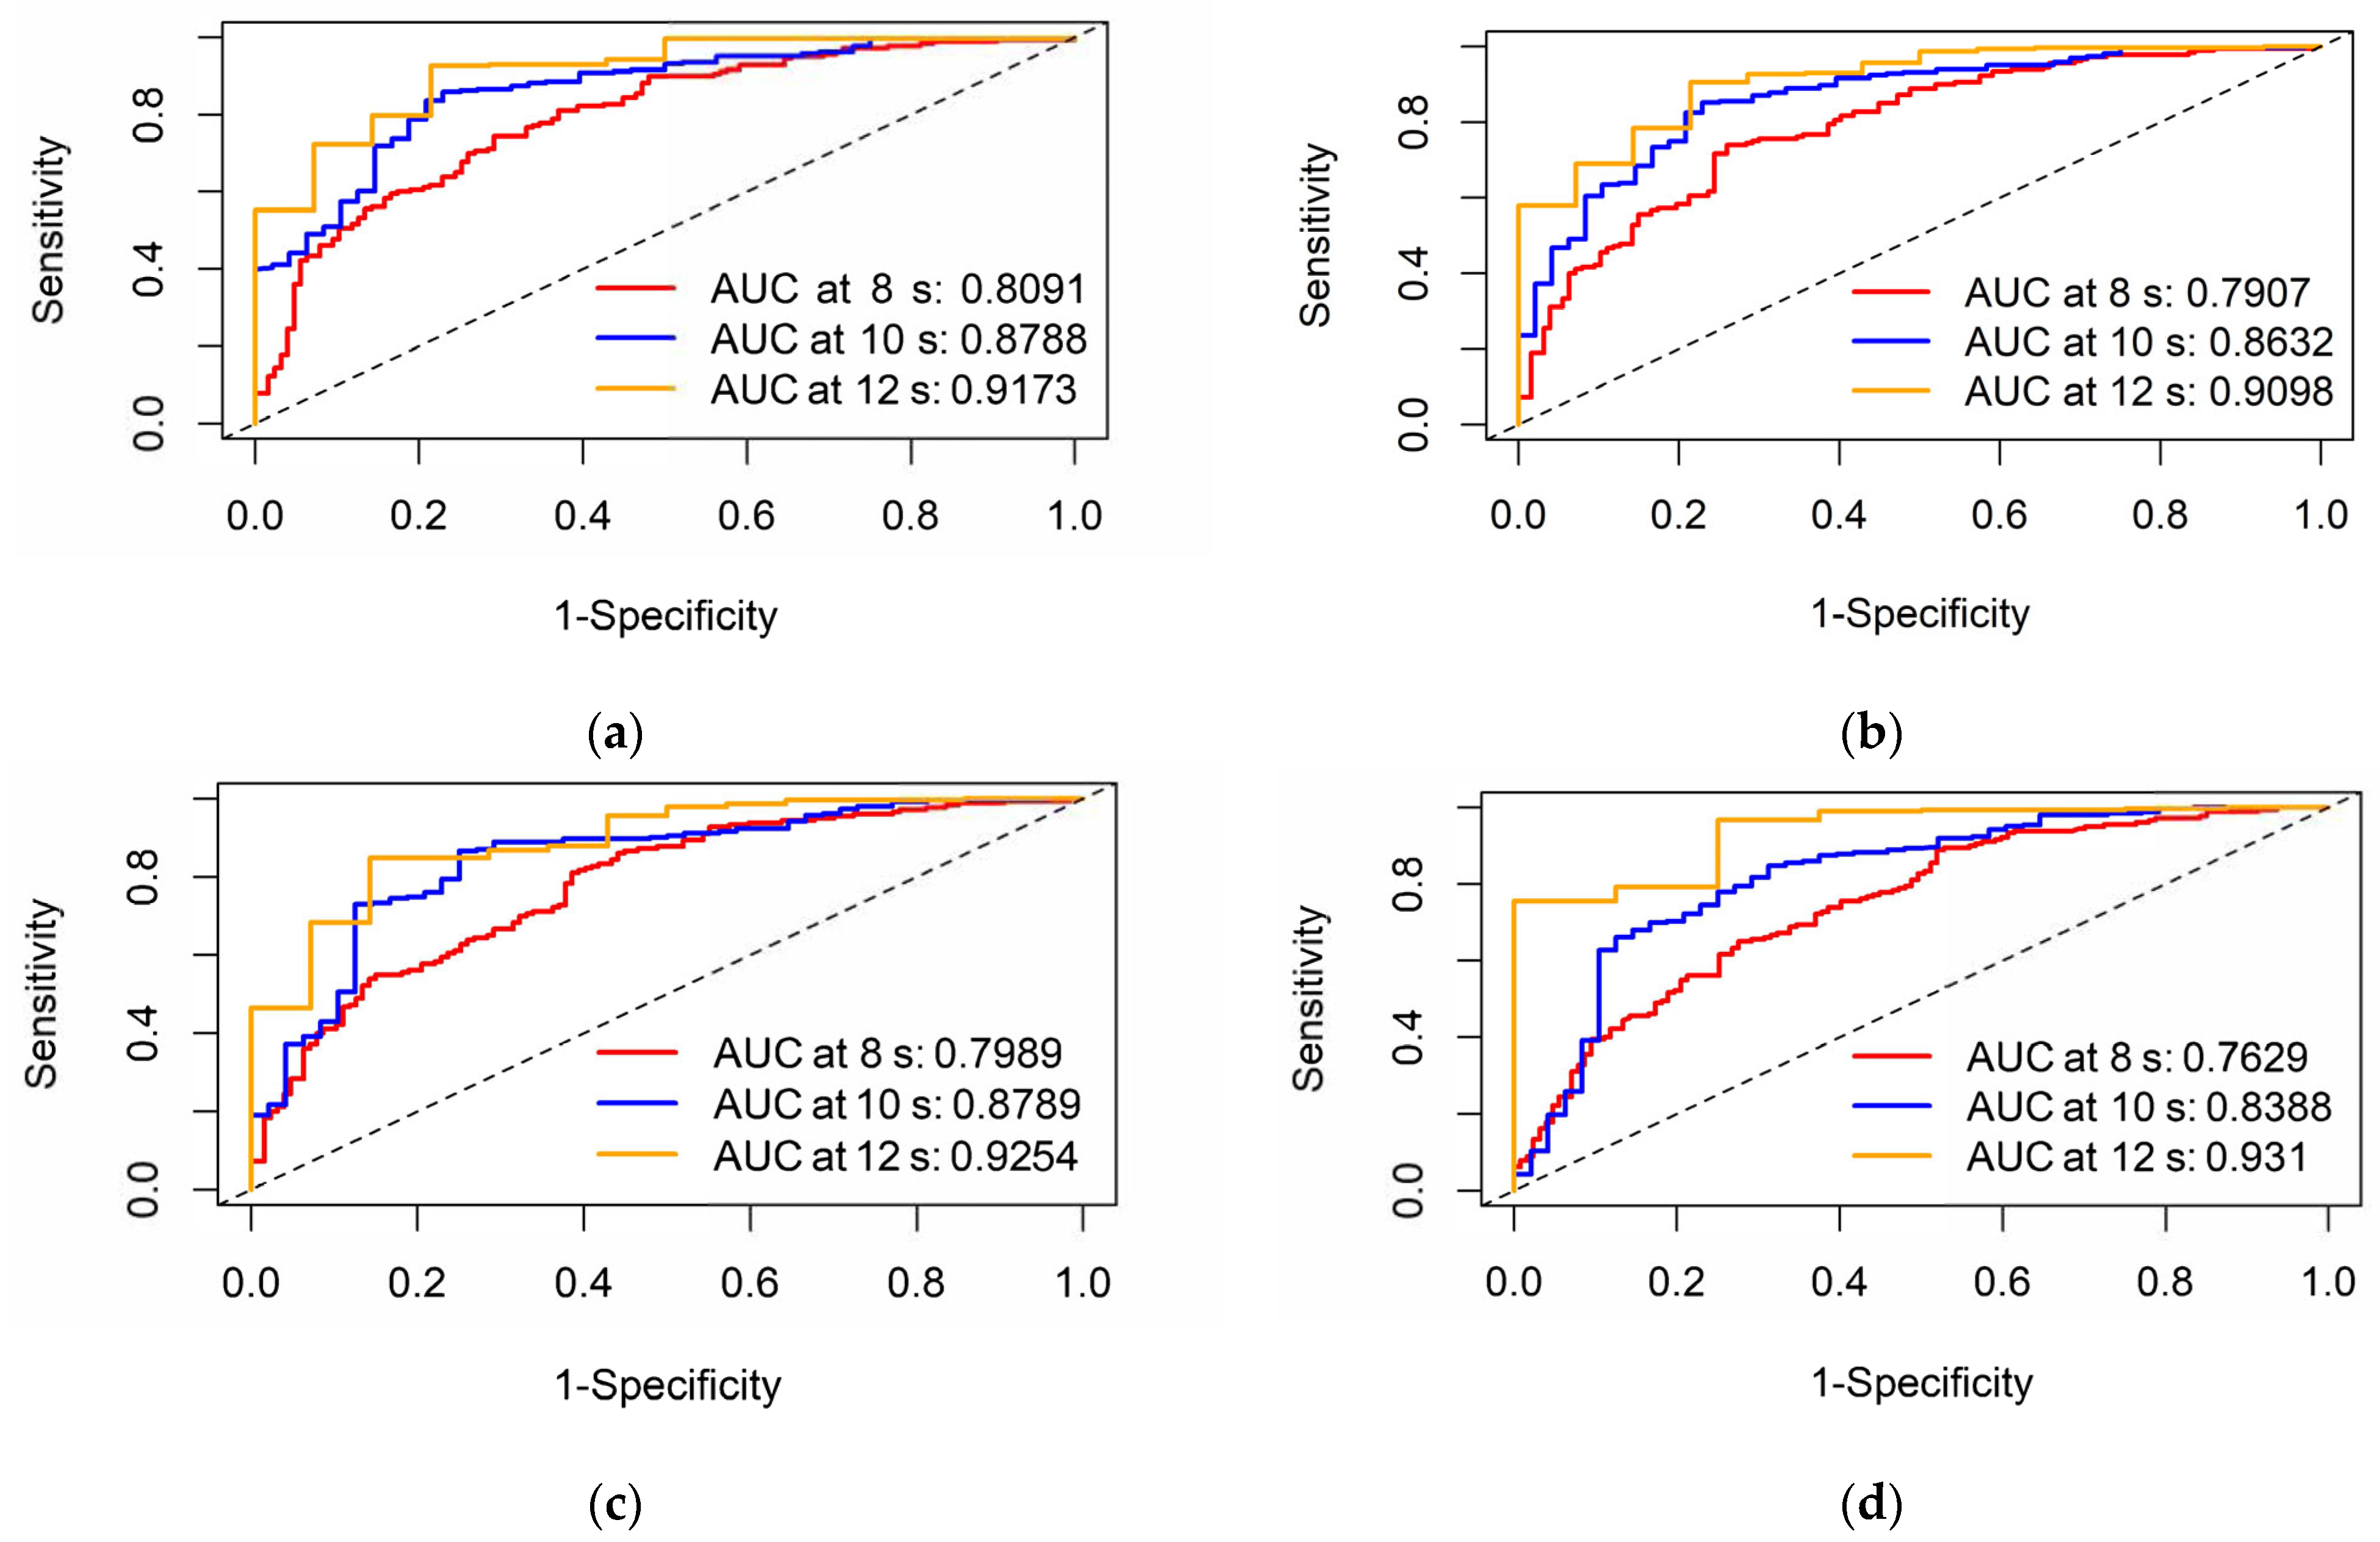
We constructed the following models: the all-variable group RSF (A-RSF) model, the C1-variable group RSF (C1-RSF) model, the C2-variable group RSF (C2-RSF) model, the C3-variable group RSF (C3-RSF) model, the single-variable group RSF (S-RSF) model, and the multi-variable group RSF (M-RSF) model. Each variable group was trained with the RSF model separately, and hyperparameters were optimized using OOB error. Comparative experimental analysis was conducted, and the training results for each model are shown in Figure 4 and Figure 5.

4. Discussion

Both the univariate and multivariate Cox proportional hazards regressions, as well as the RSF model, indicate that several variables—such as the standard deviation of the lane-changing vehicle’s speed (SD), the speed of the lane-changing vehicle (V0), the distance to the following vehicle in the target lane (DV4), the length of the lane-changing vehicle (Length), and the distance to the following vehicle in the current lane (DV2)—are significantly correlated with the duration of lane-changing. The results of univariate and multivariate Cox proportional hazards regression show that the standard deviation of the lane-changing vehicle’s speed (SD) is a protective factor. A higher SD implies a longer lane-changing duration, probably because the lane-changing vehicles are driving in poor conditions at this time, providing fewer suitable opportunities for lane-changing, thereby increasing the duration. The length of the lane-changing vehicle (Length) is also a protective factor, indicating that larger vehicles may have longer lane-changing durations. The speed of the lane-changing vehicle (V0) is a risk factor, meaning that higher speeds are associated with shorter lane-changing durations. The distances to the following vehicle in the current lane (DV2) and in the target lane (DV4) are risk factors as well; larger values for these variables mean less interference during the lane-changing, resulting in shorter durations.
The univariate Cox proportional hazards regression and the RSF model both indicate that distance headway (DHW) and time headway (THW) are also important variables. However, the univariate Cox proportional hazards regression results show that DHW is a risk factor, while THW is a protective factor, indicating different impacts on lane-changing duration. A larger DHW means less interference during lane-changing, resulting in shorter lane-changing durations. THW being a protective factor implies that a larger THW increases lane-changing duration. This conclusion is somewhat counterintuitive, but upon reviewing the lane-changing data, it was found that larger THWs were due to lower speeds of the lane-changing vehicle. This aligns with the conclusion that the speed of the lane-changing vehicle (V0) is a risk factor.
From the training results of the RSF models for each variable group, it can be found that feature selection did not improve the AUC value for the training set. The AUC values for the C3-RSF model and the M-RSF model showed a significant decrease, which may be due to the deletion of more feature variables. However, from the AUC values for the validation set, the model accuracy of the validation set can be improved by appropriate feature variable selection, and the C2-RSF model had better performance in both the test set and the validation set.
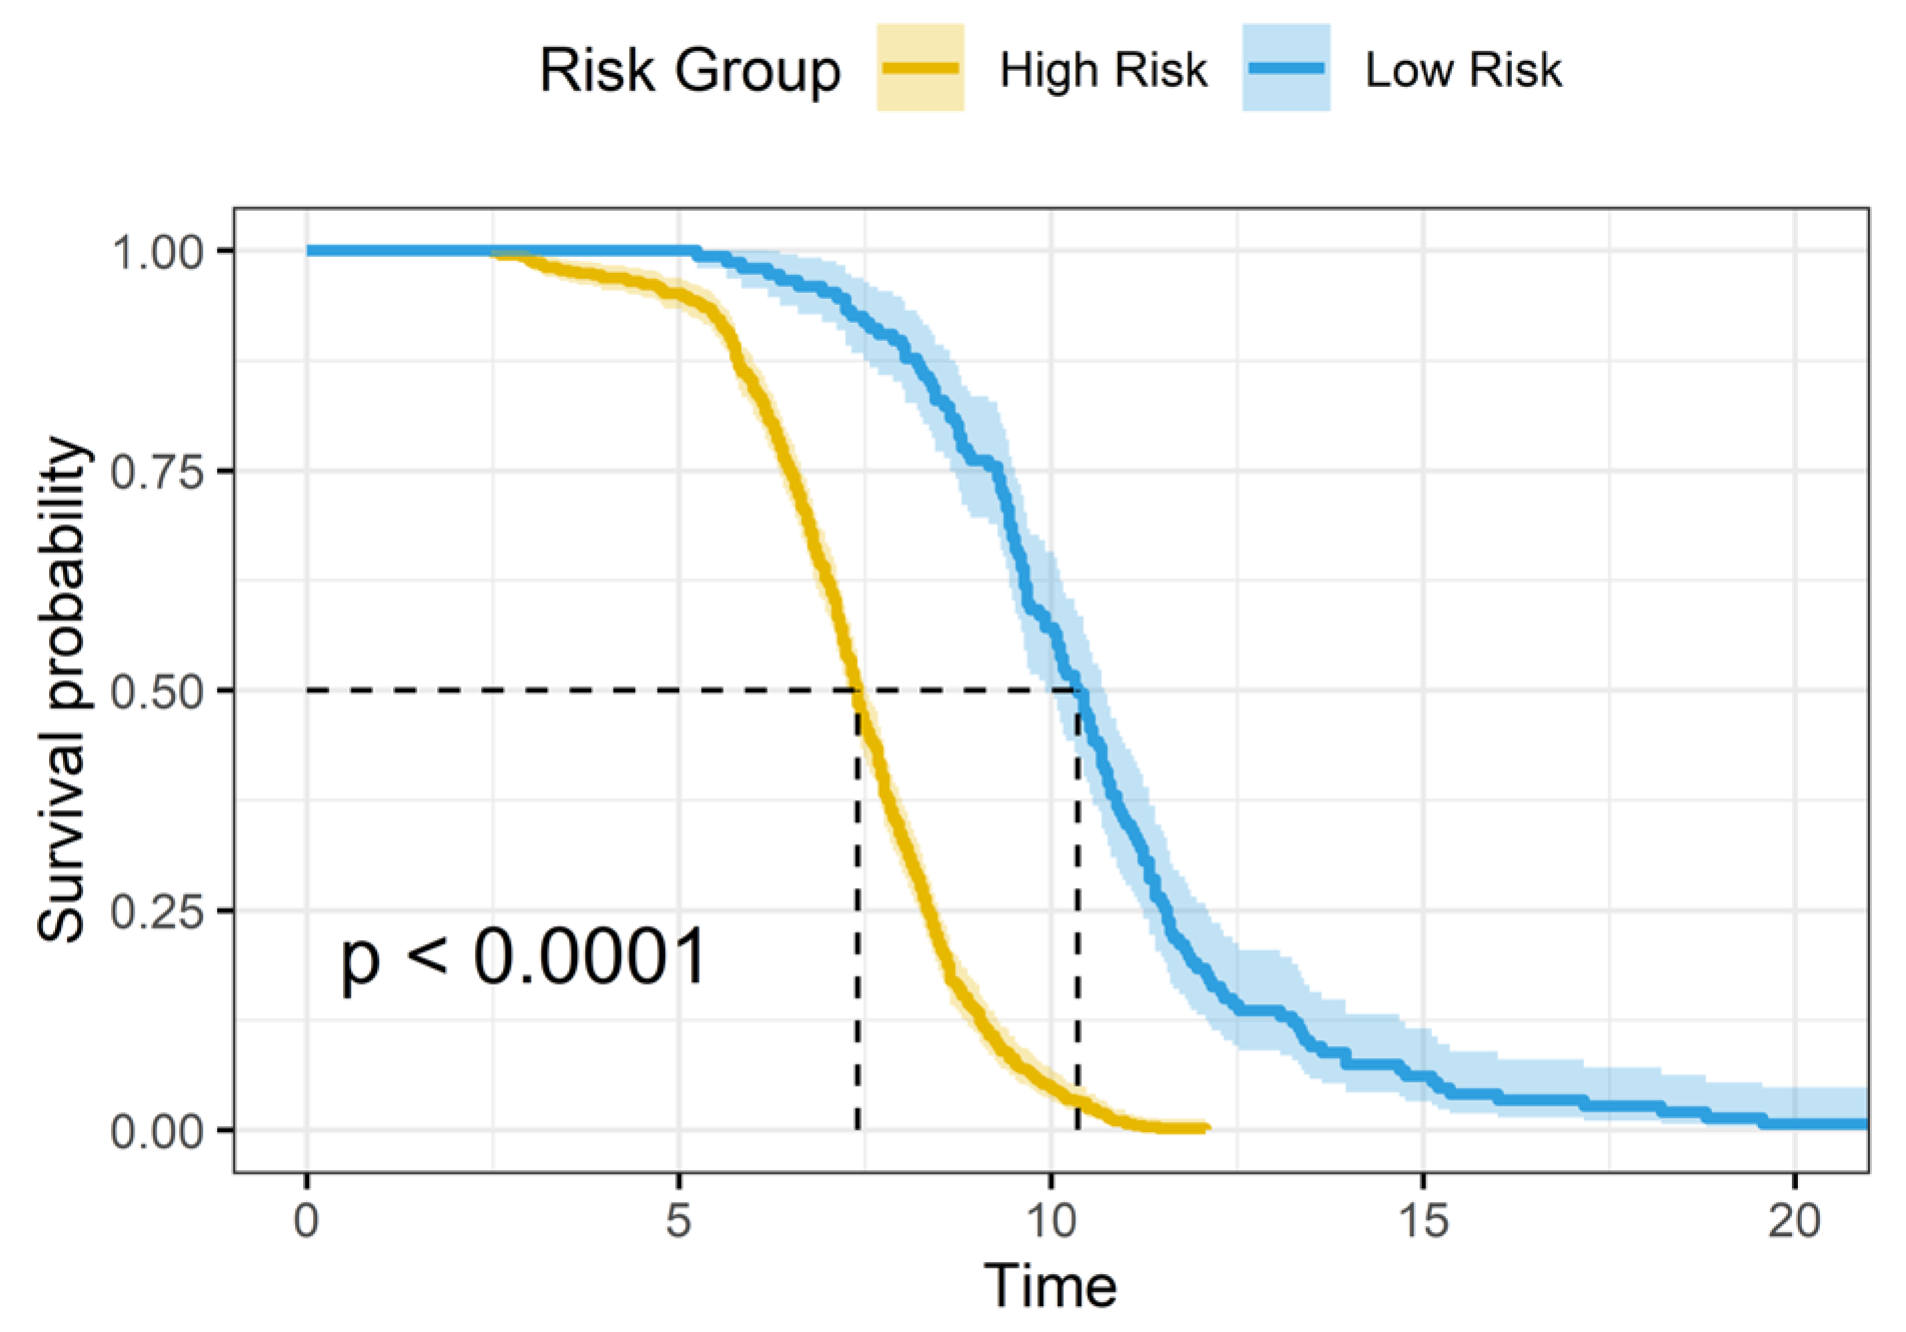
The RSF models for each variable group predicted the duration of lane change poorly for high-risk vehicles but performed well for low-risk vehicles. The Kaplan–Meier survival curve analysis was performed based on the C2-RSF model for the low-risk and high-risk groups, the results of which are shown in Figure 6, and its Log-rank test indicated a significant difference between the groups.

Author Contributions

Conceptualization, S.Z. and W.L.; methodology, S.Z.; software, S.Z. and S.H.; validation, H.W. and W.L.; formal analysis, S.Z.; investigation, S.Z. and S.H.; resources, S.Z. and S.H.; data curation, S.Z. and S.H.; writing—original draft preparation, S.Z. and S.H.; writing—review and editing, S.Z., S.H. and W.L.; visualization, S.Z. and S.H.; supervision, H.W.; project administration, H.W.; funding acquisition, H.W. All authors have read and agreed to the published version of the manuscript.

Funding

This research was funded by the National Natural Science Foundation of China, grant numbers 52372329 and 52172345.

Data Availability Statement

The data are available upon request.

Acknowledgments

The authors are grateful to the editor and anonymous reviewers for the remarks and comments that led to the improvement of the paper.

Conflicts of Interest

The authors declare no conflicts of interest.

References

  1. Nagatanit, T.; Yonekura, S. Multiple-vehicle collision induced by lane changing in traffic flow. Phys. A Stat. Mech. Its Appl. 2014, 404, 171–179. [Google Scholar] [CrossRef]
  2. Lisheng, J.; Wen-ping, F.; Ying-nan, Z.; Shuang-bin, Y.; Hai-jing, H. Research on safety lane change model of driver assistant system on highway. In Proceedings of the 2009 IEEE Intelligent Vehicles Symposium, Xi’an, China, 3–5 June 2009; pp. 1051–1056. [Google Scholar]
  3. Zheng, Z.; Ahn, S.; Monsere, C. Impact of traffic oscillations on freeway crash occurrences. Accid. Anal. Prev. 2010, 42, 626–636. [Google Scholar] [CrossRef]
  4. Ali, Y.; Haque, M.; Zheng, Z.; Washington, S.; Yildirimoglu, M. A hazard-based duration model to quantify the impact of connected driving environment on safety during mandatory lane-changing. Transp. Res. Part C Emerg. Technol. 2019, 106, 113–131. [Google Scholar] [CrossRef]
  5. Li, G.; Yang, Z.; Pan, Y.; Ma, J. Analysing and modelling of discretionary lane change duration considering driver heterogeneity. Transp. B Transp. Dyn. 2023, 11, 343–360. [Google Scholar] [CrossRef]
  6. Wen, X.; Huang, C.; Jian, S.; He, D. Analysis of discretionary lane-changing behaviours of autonomous vehicles based on real-world data. Transp. A Transp. Sci. 2023, 1–24. [Google Scholar] [CrossRef]
  7. Li, Y.; Wu, D.; Chen, Q.; Lee, J.; Long, K. Exploring transition durations of rear-end collisions based on vehicle trajectory data: A survival modeling approach. Accid. Anal. Prev. 2021, 159, 106271. [Google Scholar] [CrossRef] [PubMed]
  8. Liu, Y.; Fu, C.; Wang, W. Modeling duration of overtaking between non-motorized vehicles: A nonparametric survival analysis based approach. PLoS ONE 2021, 16, e0244883. [Google Scholar] [CrossRef]
  9. Jokhio, S.; Olleja, P.; Bärgman, J.; Yan, F.; Baumann, M. Analysis of time-to-lane-change-initiation using realistic driving data. IEEE Trans. Intell. Transp. Syst. 2023, 25, 4620–4633. [Google Scholar] [CrossRef]
  10. Li, Y.; Li, L.; Ni, D.; Zhang, Y. Comprehensive survival analysis of lane-changing duration. Measurement 2021, 182, 109707. [Google Scholar] [CrossRef]
  11. Wu, J.; Zhang, S.; Singh, A.; Qin, S. Hazard-based model of mandatory lane change duration. In Proceedings of the 17th COTA International Conference of Transportation Professionals, Shanghai, China, 7–9 July 2017; pp. 805–811. [Google Scholar]
  12. Zeng, Q.; Wang, F.; Chen, T.; Sze, N.N. Incorporating real-time weather conditions into analyzing clearance time of freeway accidents: A grouped random parameters hazard-based duration model with time-varying covariates. Anal. Methods Accid. Res. 2023, 38, 100267. [Google Scholar] [CrossRef]
  13. Ali, Y.; Sharma, A.; Chen, D. Investigating autonomous vehicle discretionary lane-changing execution behaviour: Similarities, differences, and insights from Waymo dataset. Anal. Methods Accid. Res. 2024, 42, 100332. [Google Scholar] [CrossRef]
  14. Ali, Y.; Zheng, Z.; Haque, M.; Yildirimoglu, M.; Washington, S. Understanding the discretionary lane-changing behaviour in the connected environment. Accid. Anal. Prev. 2020, 137, 105463. [Google Scholar] [CrossRef]
  15. Ali, Y.; Zheng, Z.; Haque, M. Modelling lane-changing execution behaviour in a connected environment: A grouped random parameters with heterogeneity-in-means approach. Commun. Transp. Res. 2021, 1, 100009. [Google Scholar] [CrossRef]
  16. Li, Y.; Li, L.; Ni, D. Exploration of lane-changing duration for heavy vehicles and passenger cars: A survival analysis approach. arXiv 2021, arXiv:2108.05710. [Google Scholar]
  17. Li, Y.; Li, L.; Ni, D. Comparative univariate and regression survival analysis of lane-changing duration characteristic for heavy vehicles and passenger cars. J. Transp. Eng. Part A Syst. 2022, 148, 04022109. [Google Scholar] [CrossRef]
  18. Balal, E.; Cheu, R.; Gyan-Sarkodie, T.; Miramontes, J. Analysis of discretionary lane changing parameters on freeways. Int. J. Transp. Sci. Technol. 2014, 3, 277–296. [Google Scholar] [CrossRef]
  19. Wang, Q.; Li, Z.; Li, L. Investigation of discretionary lane-change characteristics using next-generation simulation data sets. J. Intell. Transp. Syst. 2014, 18, 246–253. [Google Scholar] [CrossRef]
  20. Ataelmanan, H.; Puan, O.; Hassan, S. Examination of lane changing duration time on expressway. In Proceedings of the IOP Conference Series: Materials Science and Engineering, Bapatla, India, 7–8 May 2021; Volume 1144, p. 012078. [Google Scholar]
  21. Hamdar, S.; Mahmassani, H. Life in the fast lane: Duration-based investigation of driver behavior differences across freeway lanes. Transp. Res. Rec. 2009, 2124, 89–102. [Google Scholar] [CrossRef]
  22. Chauhan, P.; Kanagaraj, V.; Asaithambi, G. Understanding the mechanism of lane changing process and dynamics using microscopic traffic data. Phys. A Stat. Mech. Its Appl. 2022, 593, 126981. [Google Scholar] [CrossRef]
  23. Washington, S.; Karlaftis, M.; Mannering, F.; Anastasopoulos, P. Statistical and Econometric Methods for Transportation Data Analysis; Chapman and Hall/CRC: Boca Raton, FL, USA, 2020. [Google Scholar]
  24. Chen, Z.; Wen, H.-Y. Survival Analysis of Vehicle Lane-changing Duration on Road Segment Adjacent to Freeway Tunnels. J. Transp. Syst. Eng. Inf. Technol. 2022, 22, 210–217 and 227. [Google Scholar]
  25. Nan, S.; Yan, L.; Tu, R.; Li, T. Modeling lane-transgressing behavior of e-bike riders on road sections with marked bike lanes: A survival analysis approach. Traffic Inj. Prev. 2020, 22, 153–157. [Google Scholar] [CrossRef]
  26. Chen, H.; Zhao, X.; Li, Z.; Li, H.; Gong, J.; Wang, Q. Study on the influence factors of takeover behavior in automated driving based on survival analysis. Transp. Res. Part F Traffic Psychol. Behav. 2023, 95, 281–296. [Google Scholar] [CrossRef]
  27. Vlahogianni, E. Modeling duration of overtaking in two lane highways. Transp. Res. Part F Traffic Psychol. Behav. 2013, 20, 135–146. [Google Scholar] [CrossRef]
  28. Hou, L.; Lao, Y.; Wang, Y.; Zhang, Z.; Zhang, Y.; Li, Z. Time-varying effects of influential factors on incident clearance time using a non-proportional hazard-based model. Transp. Res. Part A Policy Pract. 2014, 63, 12–24. [Google Scholar] [CrossRef]
  29. Dhoke, A.; Kumar, A.; Ghosh, I. Hazard-based duration approach to pedestrian crossing behavior at signalized intersections. Transp. Res. Rec. 2021, 2675, 519–532. [Google Scholar] [CrossRef]
  30. Zou, Y.; Tang, J.; Wu, L.; Henrickson, K.; Wang, Y.; Sarkar, A.; Mansourkhaki, A.; Malakouti, M.; Yeganeh, S.; Zheng, X.; et al. Quantile analysis of factors influencing the time taken to clear road traffic incidents. In Proceedings of the Institution of Civil Engineers-Transport; Thomas Telford Ltd.: London, UK, 2017; Volume 170, pp. 296–304. [Google Scholar]
  31. Wali, B.; Khattak, A.; Liu, J. Heterogeneity assessment in incident duration modelling: Implications for development of practical strategies for small & large scale incidents. J. Intell. Transp. Syst. 2022, 26, 586–601. [Google Scholar]
  32. Shi, Y.; Zhang, L.; Liu, P. Survival analysis of urban traffic incident duration: A case study at shanghai expressways. J. Comput. 2014, 26, 29–39. [Google Scholar]
  33. Shang, T.; Lian, G.; Zhao, Y.; Liu, X.; Wang, W. Off-Ramp Vehicle Mandatory Lane-Changing Duration in Small Spacing Section of Tunnel-Interchange Section Based on Survival Analysis. J. Adv. Transp. 2022, 2022, 9427052. [Google Scholar] [CrossRef]
  34. Peng, J.; Wang, C.; Fu, R.; Yuan, W. Extraction of parameters for lane change intention based on driver’s gaze transfer characteristics. Saf. Sci. 2020, 126, 104647. [Google Scholar] [CrossRef]
  35. Ishwaran, H.; Lauer, M.S.; Blackstone, E.H.; Lu, M.; Kogalur, U.B. randomForestSRC: Random Survival Forests Vignette. Available online: https://ishwaran.org/vignettes/survival.pdf (accessed on 13 June 2024).
  36. Cox, D.R. Regression Models and Life-Tables on JSTOR. J. R. Stat. Soc. 1972, 34, 187–220. [Google Scholar] [CrossRef]
Figure 1. Distribution diagram of lane-changing vehicle and surrounding vehicles.
Bdcc 08 00114 g001
Figure 2. The distribution of lane change durations in the lane change sample data.
Bdcc 08 00114 g002
Figure 3. The training process of full-variable group random survival forest model (A-RSF): (a) random survival hyperparameter optimization of OOB values; (b) A-RSF model training result.
Bdcc 08 00114 g003
Figure 4. ROC curves of training sets of each random survival forest model: (a) ROC curve of training set of A-RSF model; (b) ROC curve of training set of C1-RSF model; (c) ROC curve of training set of C2-RSF model; (d) ROC curve of training set of C3-RSF model; (e) ROC curve of training set of S-RSF model; (f) ROC curve of training set of M-RSF model.
Bdcc 08 00114 g004aBdcc 08 00114 g004b
Figure 5. ROC curve of the validation set for each random survival forest model: (a) ROC curve of validation set of A-RSF model; (b) ROC curve of validation set of C1-RSF model; (c) ROC curve of validation set of C2-RSF model; (d) ROC curve of validation set of C3-RSF model; (e) ROC curve of validation set of S-RSF model; (f) ROC curve of validation set of M-RSF model.
Bdcc 08 00114 g005aBdcc 08 00114 g005b
Figure 6. Kaplan–Meier curve Log-rank test between high- and low-risk groups.
Bdcc 08 00114 g006
Table 1. Univariate and multivariate Cox proportional hazards regression analysis results.
Variable Name (Unit)SymbolMean
(Std. Dev)
Univariate Cox Regression AnalysisMultivariate Cox Regression Analysis
Coefficient of Regression aExp(a)Coefficient of Regression aExp(a)
Length of lane-changing vehicles (m)Length6.18 (3.73)−0.044 ***0.957−0.056 ***0.945
Speed of lane-changing vehicles (m/s)V027.82 (6.72)0.071 **1.0730.066 ***1.069
Distance headway (m)DHW60.63 (60.25)0.002 **1.002−0.0010.999
Time headway (s)THW2.16 (2.46)−0.026 *0.9740.0151.015
Time to collision (s)TTC95.72 (354.50)0.0001.0000.0001.000
Speed of the leading vehicle in the current lane (m/s)V127.77 (7.59)0.040 ***1.041−0.00150.985
Speed difference with the leading vehicle in the current lane (m/s)DelV1−0.29 (2.44)0.0101.010−0.0020.998
Speed difference with the following vehicle in the current lane (m/s)DelV20.32 (2.27)0.0151.0150.0221.022
Distance to the following vehicle in the current lane (m)DV251.62 (32.49)0.008 ***1.0080.004 **1.004
Speed difference with the leading vehicle in the target lane (m/s)DelV30.59 (4.53)0.015 *1.0160.0141.014
Distance to the leading vehicle in the target lane (m)DV377.47 (63.81)0.002 ***1.0020.0001.000
Speed difference with the following vehicle in the target lane (m/s)DelV4−0.11 (5.59)−0.0090.991−0.0060.995
Distance to the following vehicle in the target lane (m)DV447.78 (36.59)0.007 ***1.0070.007 ***1.007
Standard deviation of lane-changing vehicle’s speed (m/s)SD9.86 (8.50)−0.041 ***0.960−0.044 ***0.957
Lane-changing directionCD1.59 (0.49)−0.0120.988−0.1020.903
*** p < 0.001; ** p < 0.01; * p < 0.05.
Table 2. Division of variable groups.
Variable Group NameVariable Composition
All-variable groupSD, V0, DV4, DHW, Length, DV2, THW, TTC, DelV4, V1, DelV3, DelV1, DelV2, DV3, CD
C1-variable groupSD, V0, DV4, DHW, Length, DV2, THW, TTC, DelV4, V1, DelV3, DelV1, DelV2
C2-variable groupSD, V0, DV4, DHW, Length, DV2, THW, TTC, DelV4
C3-variable groupSD, V0, DV4, DHW, Length, DV2, THW
S-variable groupSD, V0, DV4, DHW, Length, DV2, THW, V1, DelV3, DV3
M-variable groupSD, V0, DV4, Length, DV2
Disclaimer/Publisher’s Note: The statements, opinions and data contained in all publications are solely those of the individual author(s) and contributor(s) and not of MDPI and/or the editor(s). MDPI and/or the editor(s) disclaim responsibility for any injury to people or property resulting from any ideas, methods, instructions or products referred to in the content.