1. Introduction
In recent years, corporate governance has emerged as a critical facet of organizational management, influencing performance outcomes and fostering diversity and inclusivity within corporate structures [
1]. As businesses navigate complex regulatory landscapes and strive for sustainable growth, integrating advanced technologies, particularly artificial intelligence (AI), has become increasingly indispensable [
2,
3,
4]. This study delves into the intersection of AI applications and corporate governance practices, aiming to explore how AI can help enhance performance metrics while fostering diversity and inclusion within organizational frameworks.
Corporate governance is the backbone of modern businesses, delineating power, responsibilities, and decision-making processes among stakeholders [
5]. Effective governance ensures accountability and transparency and is pivotal in driving organizational performance and mitigating risk [
6]. Moreover, in today’s interconnected global marketplace, diversity and inclusivity have emerged as imperatives for sustainable success [
7]. Integrating AI technologies into corporate governance processes represents a paradigm shift with the potential to significantly optimize decision-making, streamline operations, and unlock new avenues for growth. AI-driven analytics and predictive modeling can revolutionize traditional governance frameworks by enabling more informed and data-driven decision-making [
8,
9]. For instance, AI algorithms can analyze vast datasets more efficiently than human counterparts, providing insights that lead to enhanced strategic planning and operational efficiency [
10].
Moreover, AI technologies extend their transformative potential beyond operational efficiency to promote diversity and inclusion within corporate environments. AI can be instrumental in identifying and mitigating unconscious biases in hiring and promotion practices [
11,
12]. Through advanced analytics, organizations can better understand and address disparities, fostering a more inclusive workplace culture [
13].
Despite these advancements, challenges and ethical considerations remain prominent. Issues such as algorithmic bias and data privacy are critical concerns that necessitate careful scrutiny and robust governance mechanisms [
14,
15]. Ensuring transparency and accountability in AI systems is crucial for maintaining trust and fairness in decision-making processes [
16,
17].
In this context, this study aims to provide a comprehensive analysis of the practical applications of AI in corporate governance, focusing on enhancing performance metrics and fostering diversity and inclusivity within organizational structures. By synthesizing insights from academic literature [
8,
9], industry best practices [
10,
11], and real-world case studies [
12,
13], this research seeks to offer actionable recommendations for organizations aiming to harness the transformative potential of AI in their governance practices.
This study represents a concerted effort to unravel the intricate factors underlying corporate success in the digital age. By synthesizing empirical findings with theoretical frameworks, this study aims to contribute to the evolving discourse on corporate governance while offering practical guidance for organizations striving to thrive amidst uncertainty and change. While numerous studies have explored the link between gender diversity and financial performance, few have examined this relationship using nonlinear models or artificial intelligence (AI) techniques [
18]. Consequently, this study aims to contribute empirical insights into the impact of gender diversity on board composition and business outcomes using multi-break models and artificial neural networks (ANNs).
Despite the growing recognition of the benefits associated with gender diversity on boards, questions persist regarding the mechanisms through which women’s leadership translates into tangible business outcomes. The study seeks to address this gap by employing advanced analytical techniques, including multi-break models and artificial neural networks (ANNs), to explore the nuanced relationship between the presence of women on boards and critical performance indicators. Focusing on electronic companies listed in Taiwan from 2000 to 2021, the study aims to uncover insights into how gender diversity influences business performance within a specific industry context. Through rigorous empirical analysis, the study aims to provide actionable insights for organizations seeking to leverage the power of gender diversity to drive sustainable growth and competitiveness.
The multi-breakpoint regression analysis complements and extends the insights gained from artificial neural networks (ANNs). The primary objective of integrating multi-breakpoint regression was to provide a structured examination of how the impact of board diversity on company performance varies across different business conditions, which ANNs alone might not fully capture. This approach aimed to validate and refine the empirical findings by leveraging the strengths of both methodologies. While ANNs excel at uncovering complex, nonlinear relationships and offering predictive insights, multi-breakpoint regression adds depth by analyzing structural changes and identifying specific points where the effects of board diversity shift. By combining these techniques, the study achieves a more comprehensive understanding of board diversity’s influence on performance, ensuring the findings are robust and nuanced.
In essence, this study underscores the pivotal role of gender diversity in driving enhanced business performance and sustainability, highlighting the need for organizations to prioritize inclusivity and embrace diverse leadership perspectives.
2. Literature Review
The interaction of stakeholder theory, resource dependence theory, and leadership styles theory in the context of gender diversity offers a comprehensive framework for understanding organizational dynamics. Stakeholder theory emphasizes the importance of considering diverse stakeholder interests, including those related to gender diversity initiatives, thereby influencing organizational policies and practices [
19,
20,
21]. The resource dependence theory further elucidates how organizations secure the necessary resources to support these initiatives, highlighting the role of stakeholders in providing critical resources such as funding and talent [
22,
23]. The leadership styles theory complements these perspectives by examining how different leadership approaches can hinder or promote gender diversity efforts within an organization, influencing organizational culture and inclusivity [
24,
25]. These theoretical lenses provide a holistic view of how organizational strategies, resource allocation, and leadership behaviors influence gender diversity outcomes, offering valuable insights for scholars and practitioners aiming to foster inclusive workplaces.
The stakeholder theory suggests that businesses should manage relationships with all stakeholders who affect or are affected by the firm’s activities, including employees, customers, suppliers, local communities, and shareholders. Proponents argue that a board of directors that reflects this diversity of stakeholders can better anticipate and respond to their needs, ultimately enhancing firm performance and legitimacy [
19]. The stakeholder theory posits that a firm’s success depends on managing relationships with various stakeholders, including employees, customers, investors, and the broader community. Gender diversity on boards is seen as a mechanism to enhance stakeholder engagement by bringing diverse perspectives and experiences to decision-making. Studies by Yasser et al. [
26] and Jin et al. [
27] highlight the positive influence of female directors on a firm’s ability to manage social responsibilities ethically, aligning with stakeholder expectations.
However, the relationship between gender diversity and stakeholder engagement is not always straightforward. Cunningham et al. [
28] emphasize the evolving dynamics of stakeholder influence on board composition. While workforce and customer stakeholders have gained traction recently, traditional power players like boards, executives, and institutional investors continue to shape board diversity practices. Several studies have explored the impact of boardroom gender diversity on corporate governance outcomes. Research suggests a positive association between female directors and corporate social responsibility (CSR) initiatives. Studies by Liu et al. [
29] and Ali et al. [
30] highlight that female directors can enhance firm performance through more vital CSR practices. Ben Fatma and Chouaibi [
31] further emphasize that CSR strengthens the positive link between gender diversity and financial performance.
The financial performance itself presents mixed findings. While Inneh et al. [
32] find a positive impact of female board representation on earnings quality in Nigerian banks, Rodriguez-Dominguez et al. [
33] find no clear link between female directors and corporate ethics in a European context. These findings suggest that the influence of gender diversity on financial outcomes is likely contingent on other factors, such as the presence of independent directors and the firm’s overall governance structure.
Nguyen and Chen [
34] use a threshold regression model to show that female directors can enhance profitability under specific conditions, such as favorable capital adequacy ratios and smaller bank sizes. Nguyen [
35] complements this by demonstrating that female board representation positively influences financial stability, particularly in high-debt scenarios. These studies underscore the complex interplay between gender diversity on boards and bank performance, emphasizing the need for nuanced analytical approaches to capture the full range of effects across different environments.
Research explores the connection between gender diversity on corporate boards and various firm outcomes, using the resource dependence theory (RDT) as a guiding principle. This research suggests that diverse perspectives on boards lead to multifaceted benefits. Studies by Tran et al. [
36] and Teodosio et al. [
37] demonstrate how gender-diverse boards enhance strategic decision-making, particularly during M&A activities, and influence financial policies toward a more conservative and risk-averse approach, potentially reducing reliance on external resources. Cunningham and Ereddia [
28] highlight the evolving influence of stakeholders, particularly workforce and customer groups, in driving gender diversity on boards, especially in the U.S. context. Finally, Boffa et al. [
38] showcase how adopting a corporate social responsibility (CSR) model, like a benefit corporation, aligns with increased female board representation, suggesting firms leverage diversity to strengthen their reputation and legitimacy within their CSR initiatives. This research underscores the positive impact of gender diversity on corporate boards, emphasizing how it contributes to a company’s resilience and success through enhanced decision-making, risk management, and stakeholder engagement.
Several studies highlight the distinct leadership styles exhibited by female directors. For example, Gerged et al. [
39] find that women in hospitality and tourism firms tend to favor communal, participative, and democratic leadership approaches. This focus on collaboration and stakeholder engagement aligns with a broader commitment to societal impact beyond maximizing profit. Similarly, Miholić et al. [
40] identify a more collaborative and transformational leadership style trend among women in Croatian management positions. These findings suggest that gender diversity on boards can influence leadership dynamics, potentially improving organizational effectiveness.
Furthermore, research delves into the impact of female leadership styles on corporate outcomes. Chen and Kao [
41] examine Taiwanese manufacturing firms, demonstrating that female board representation can positively affect financial performance. Their findings suggest that women’s stakeholder-oriented perspectives lead to less aggressive downsizing strategies, ultimately enhancing firm results. Ren et al. [
42] further emphasize the positive influence of female leadership in Chinese companies, demonstrating that female directors significantly contribute to internal CSR initiatives, aligning with social role theory, suggesting that societal expectations and female leadership styles can promote ethical practices and corporate social responsiveness. Vieira et al. [
43] conducted a comprehensive review, highlighting the growing interest in how gender influences organizational leadership styles and decision-making. They emphasize the need for continued research to bridge knowledge gaps and develop practical implications for fostering inclusive leadership and sustainable corporate practices.
This review highlights the transformative potential of gender diversity in shaping leadership styles within corporate governance frameworks. Diverse boards can foster collaborative, participative, and stakeholder-oriented leadership, ultimately contributing to organizational resilience, more vital CSR initiatives, and improved overall performance.
3. Data, Methodology, and Empirical Results
Profit performance is one of the indicators reflecting the growth in the operation of the companies and is the primary goal in evaluating the managers’ success. The input data for the simulation is taken from the Taiwan Economic Journal (TEJ) and the Market Observation Post System (MOPS) database. The related data of 853 electronic companies listed on the Taiwan Stock Exchange from 2000 to 2021 are used for studying.
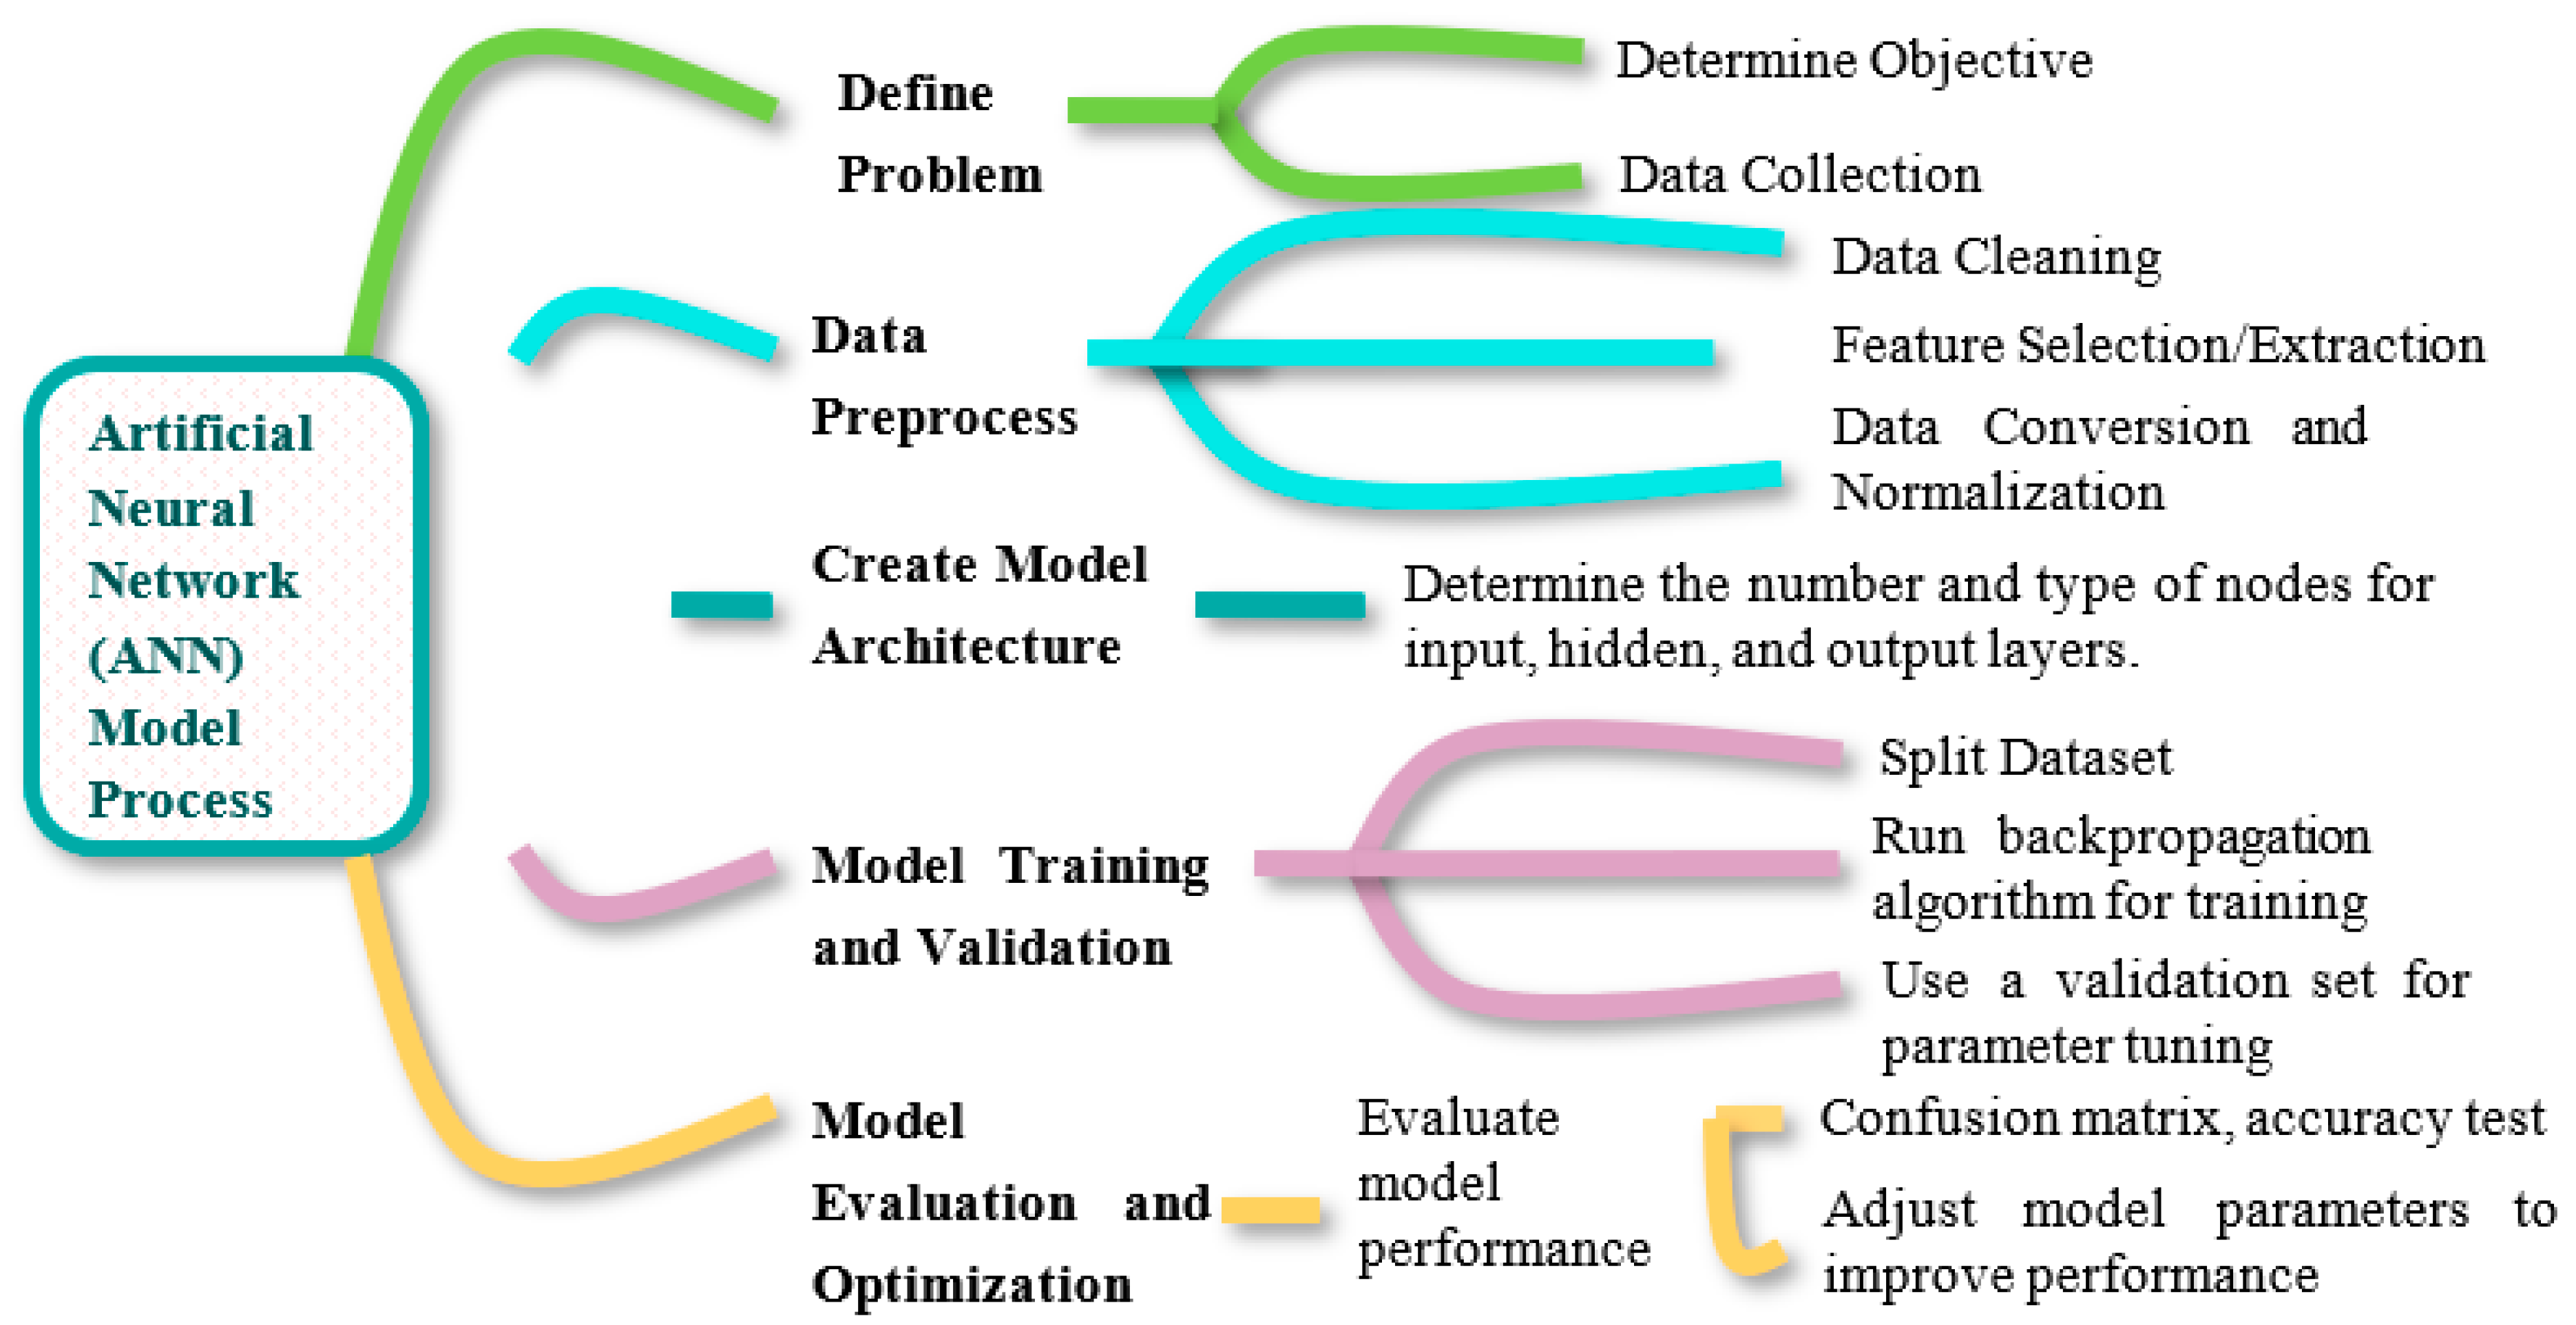
The artificial neural network (ANN) model process encompasses several methodical steps designed to build and train neural networks for various applications, including classification, regression, and pattern recognition tasks. This process is essential for leveraging the capabilities of ANNs to derive predictive insights from complex datasets.
Figure 1 outlines the key stages involved in the ANN model process:
Table 1 provides an overview of the variables used in the study, along with their descriptions.
The models used for this study are as follows:
Model 1 (WBD): ROA and Women on the Board
Model 2 (MBD): ROA and Men on the Board
Model 3 (BBD): ROA and Business on the Board
3.1. Data Description
Because the reliability of using the ANNs tool in ROA simulation is highly dependent on the data quality, it is necessary to conduct a raw data check before starting the simulation to eliminate the blank data. Data on Board features for 12 years (2000–2021) are checked to remove blank values. After processing, the data used for the study included 10,626 observations. Statistics on input data are displayed in
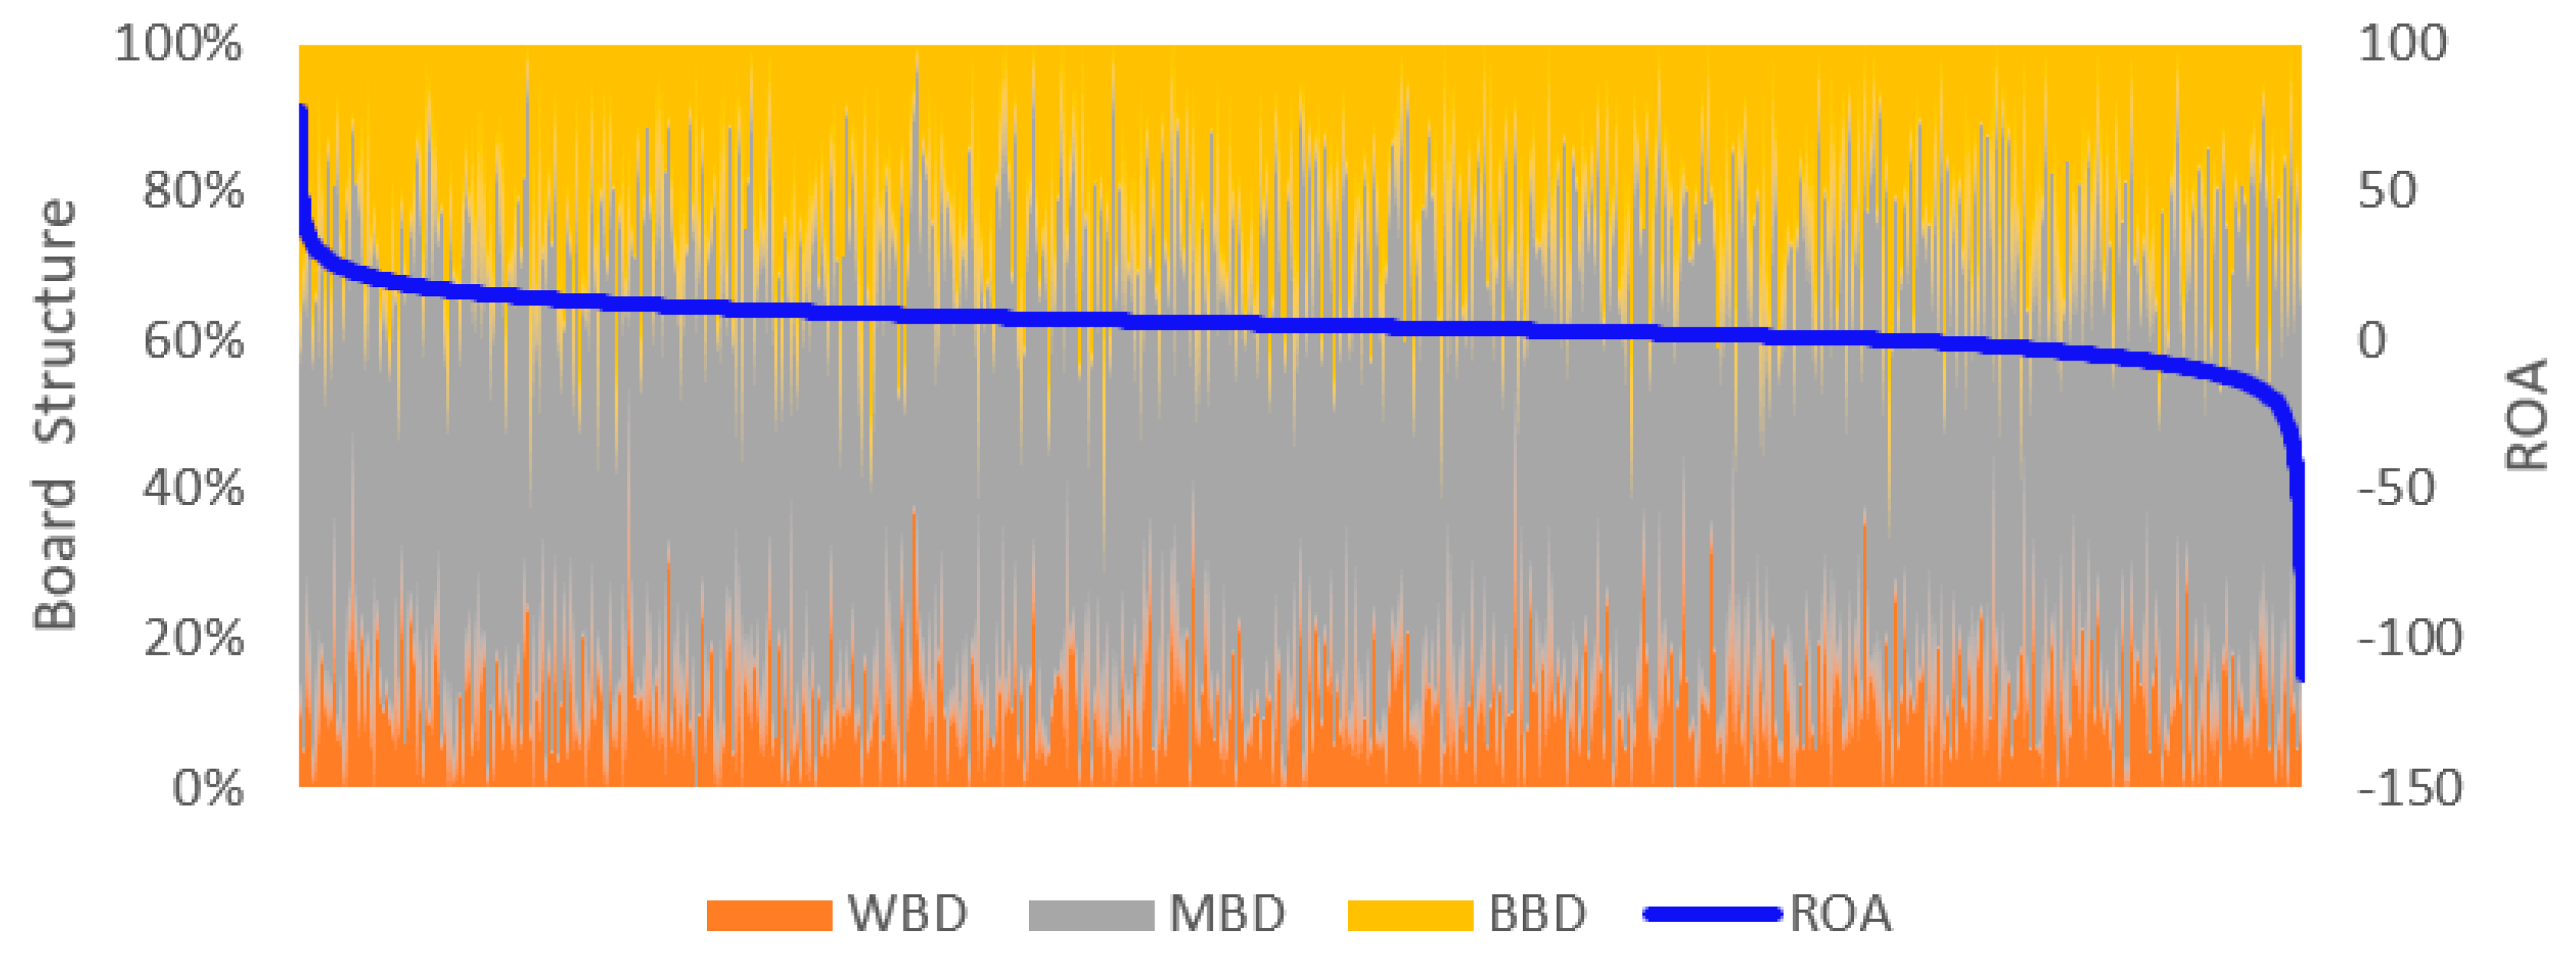
Table 2; Representative data graphs (ROA, WBD, MDB, and BBD) are pictured in
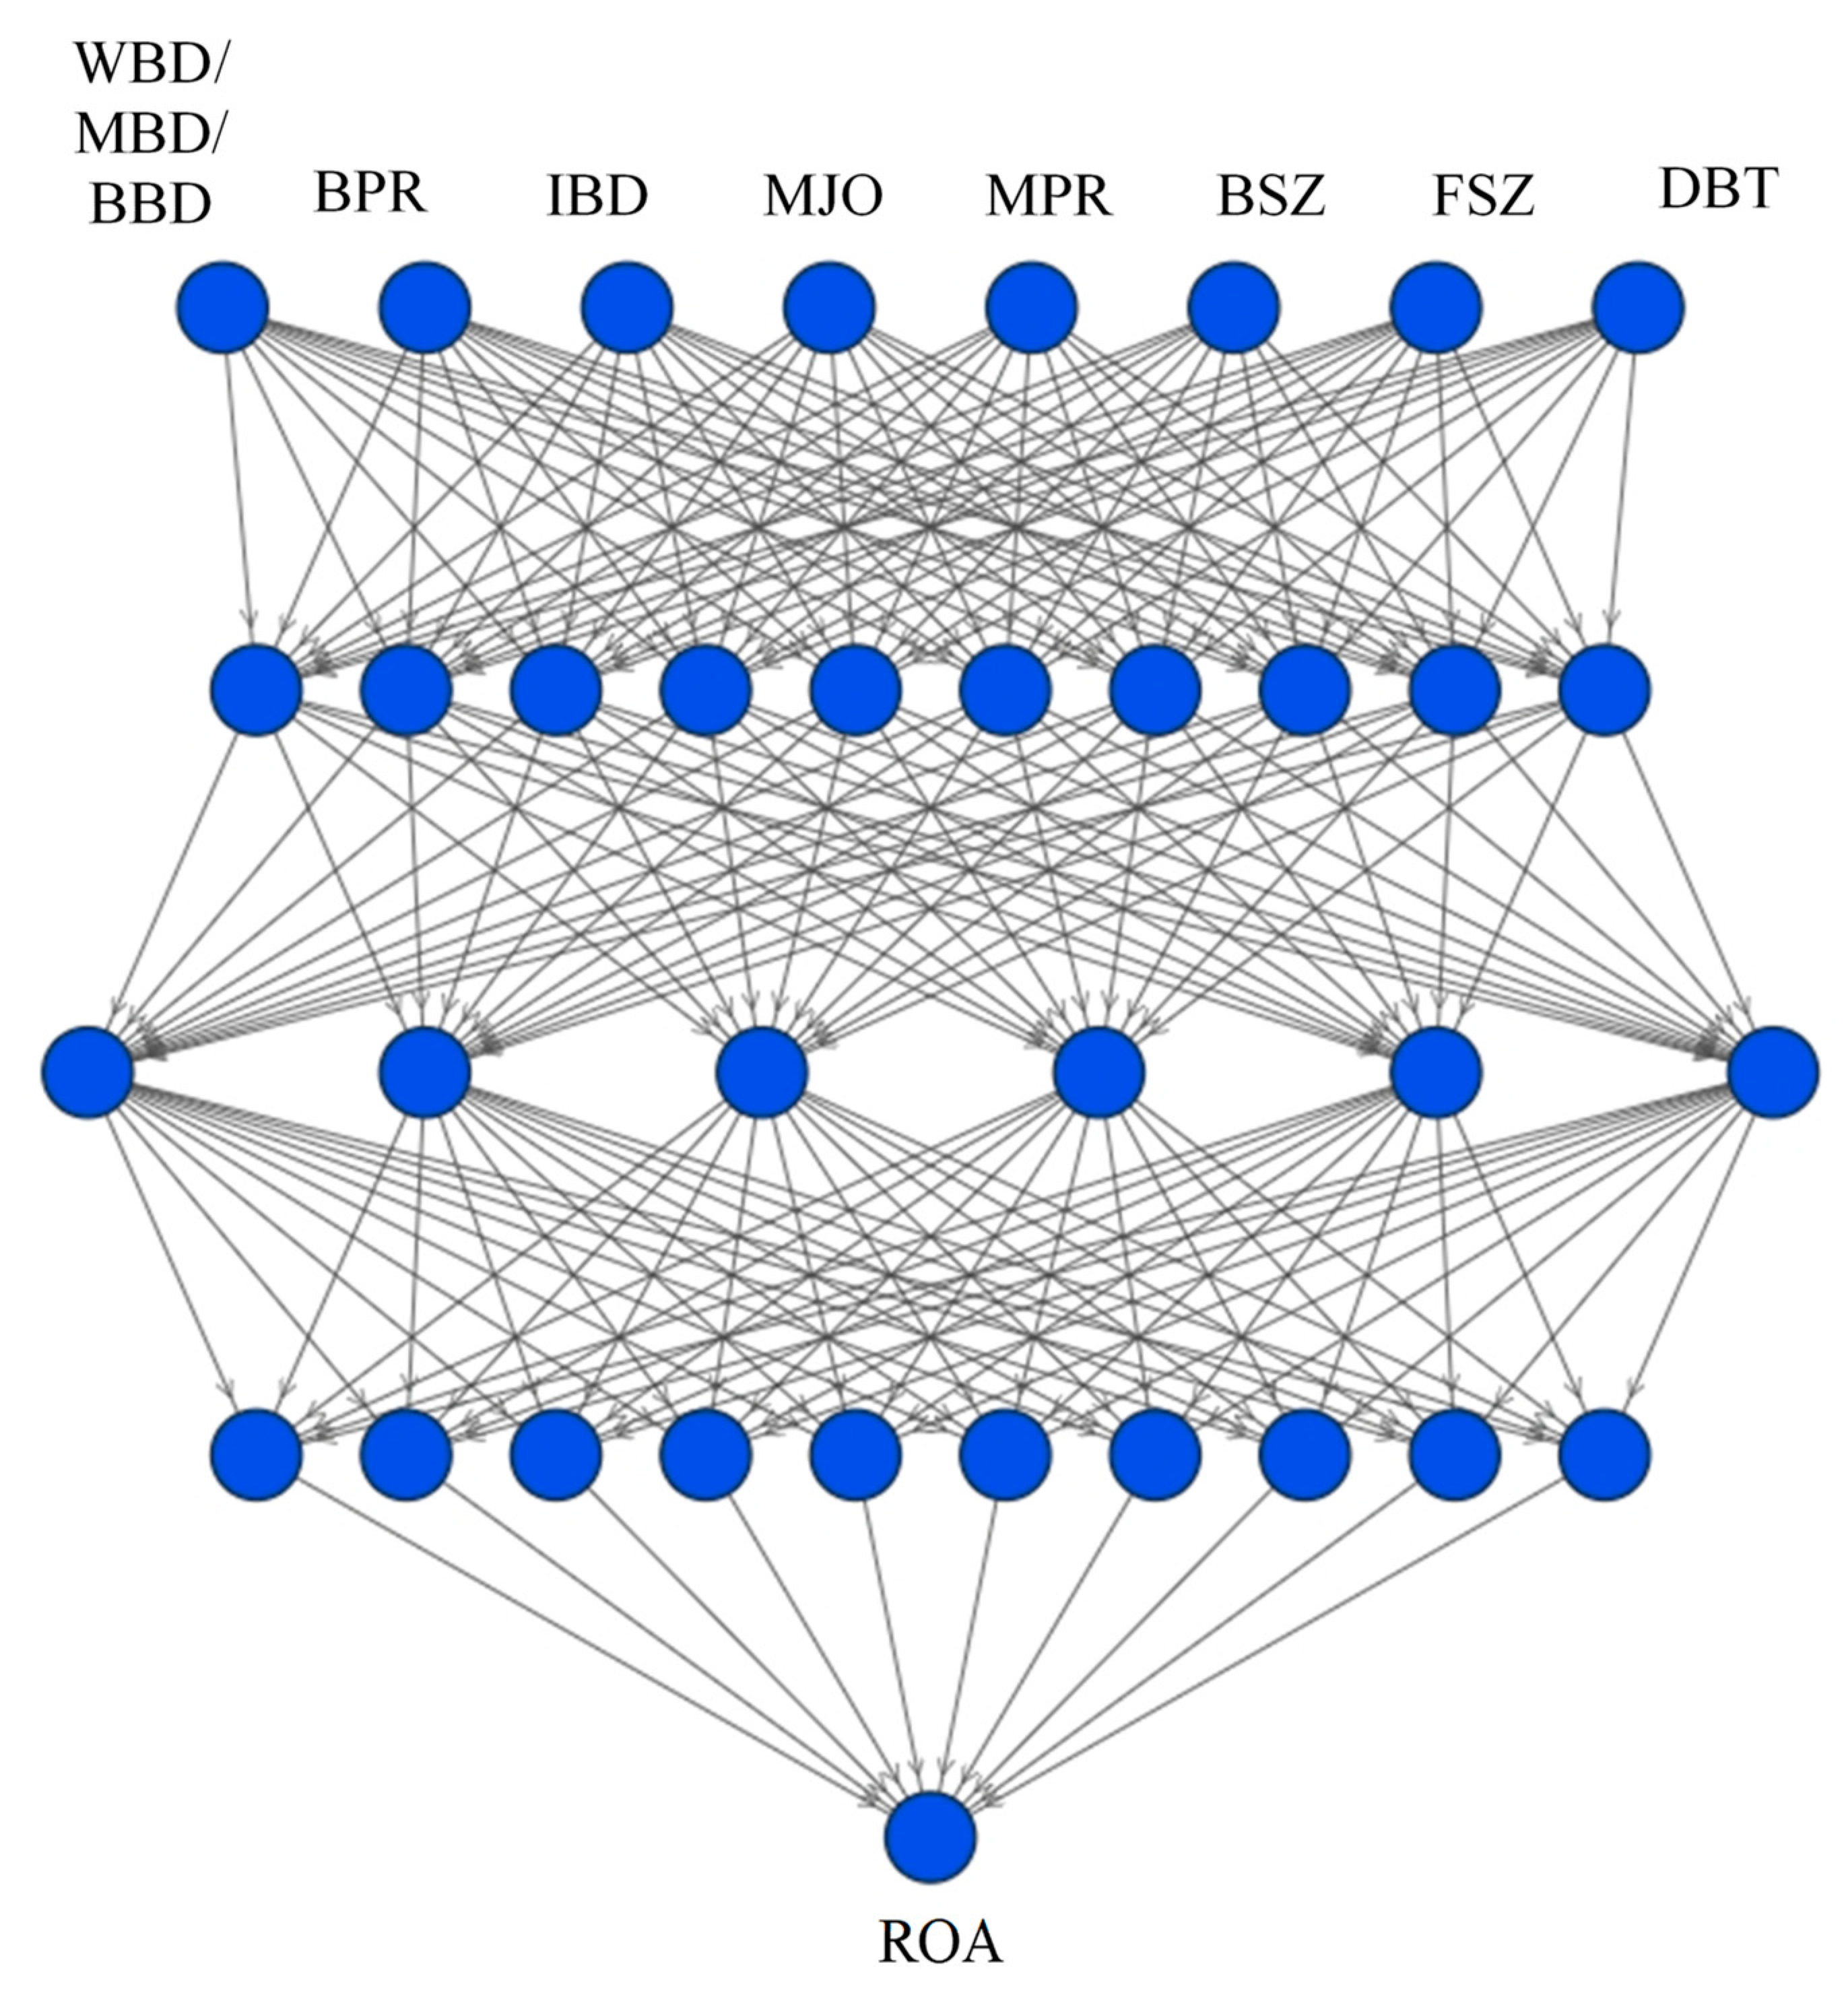
Figure 2. Each data sample includes information from 8 inputs (WBD/MBD/BBD, BPR, IBD, MJO, MPR, BSZ, FSZ, and DBT) with an output factor of ROA. The data were randomly selected at the rate of 70% of the samples for network training purposes and 30% for independent testing.
Table 2 shows that women currently account for an average of 13% of Taiwan’s electronics industry corporate boards. According to government statistics, female directors account for about 14.86% of listed over-the-counter (OTC) companies in Taiwan, which is far from 25% in the United States and 34.5% in the United Kingdom, indicating that there is still much room for improvement.
In the sample, the network of directors is strongly dominated by men, and it is felt that the company lacks qualified females for senior positions. This stems from the patriarchal nature of Eastern society, and as a result, business executives think that it is expected to have few female leaders on the board of directors.
The issue of gender equality has become a trend of globalization. Among the 17 sustainable development goals of the United Nations, the fifth is gender equality. Taiwan has promulgated the Gender Equality Policy Guidelines since 2011 and formulated the Gender Equality Promotion Plan in 2012. However, in the enterprise sector, more discussions are on women’s employment, workplace equality, and labor rights, and less on the development and succession of female leaders.
Pearson correlation analysis aims to assess the strength of the linear relationship between dependent and independent variables. For regression analysis, it is essential that these variables show a significant correlation. Additionally, if the independent variables are strongly correlated, it is essential to check for multicollinearity issues.
The results of the Pearson correlation analysis in
Table 3 show that the number of enterprises is proportional to ROA, while the number of male members is inversely proportional, and the number of female members on the board of directors is insignificant. Although most independent variables correlate, there is no sign of multicollinearity when all correlation coefficients ≥ |0.47|.
3.2. Unknown Breakpoint Test
Testing for structural changes in regression models is essential for extensive data analysis when choosing linear or nonlinear models for research data. Bai (1997) and Bai and Perron (1998, 2003a) provide theoretical and computational results allowing many unknown breakpoints.
A model with
breakpoints and
regimes is defined as:
where
,
variables are in the same regime, and
variables are regime-specific. The applied method checks the added breakpoint, which reduces the sum of squares. After testing for breakpoints of three models with female, male, and corporate members, respectively, the results are documented in
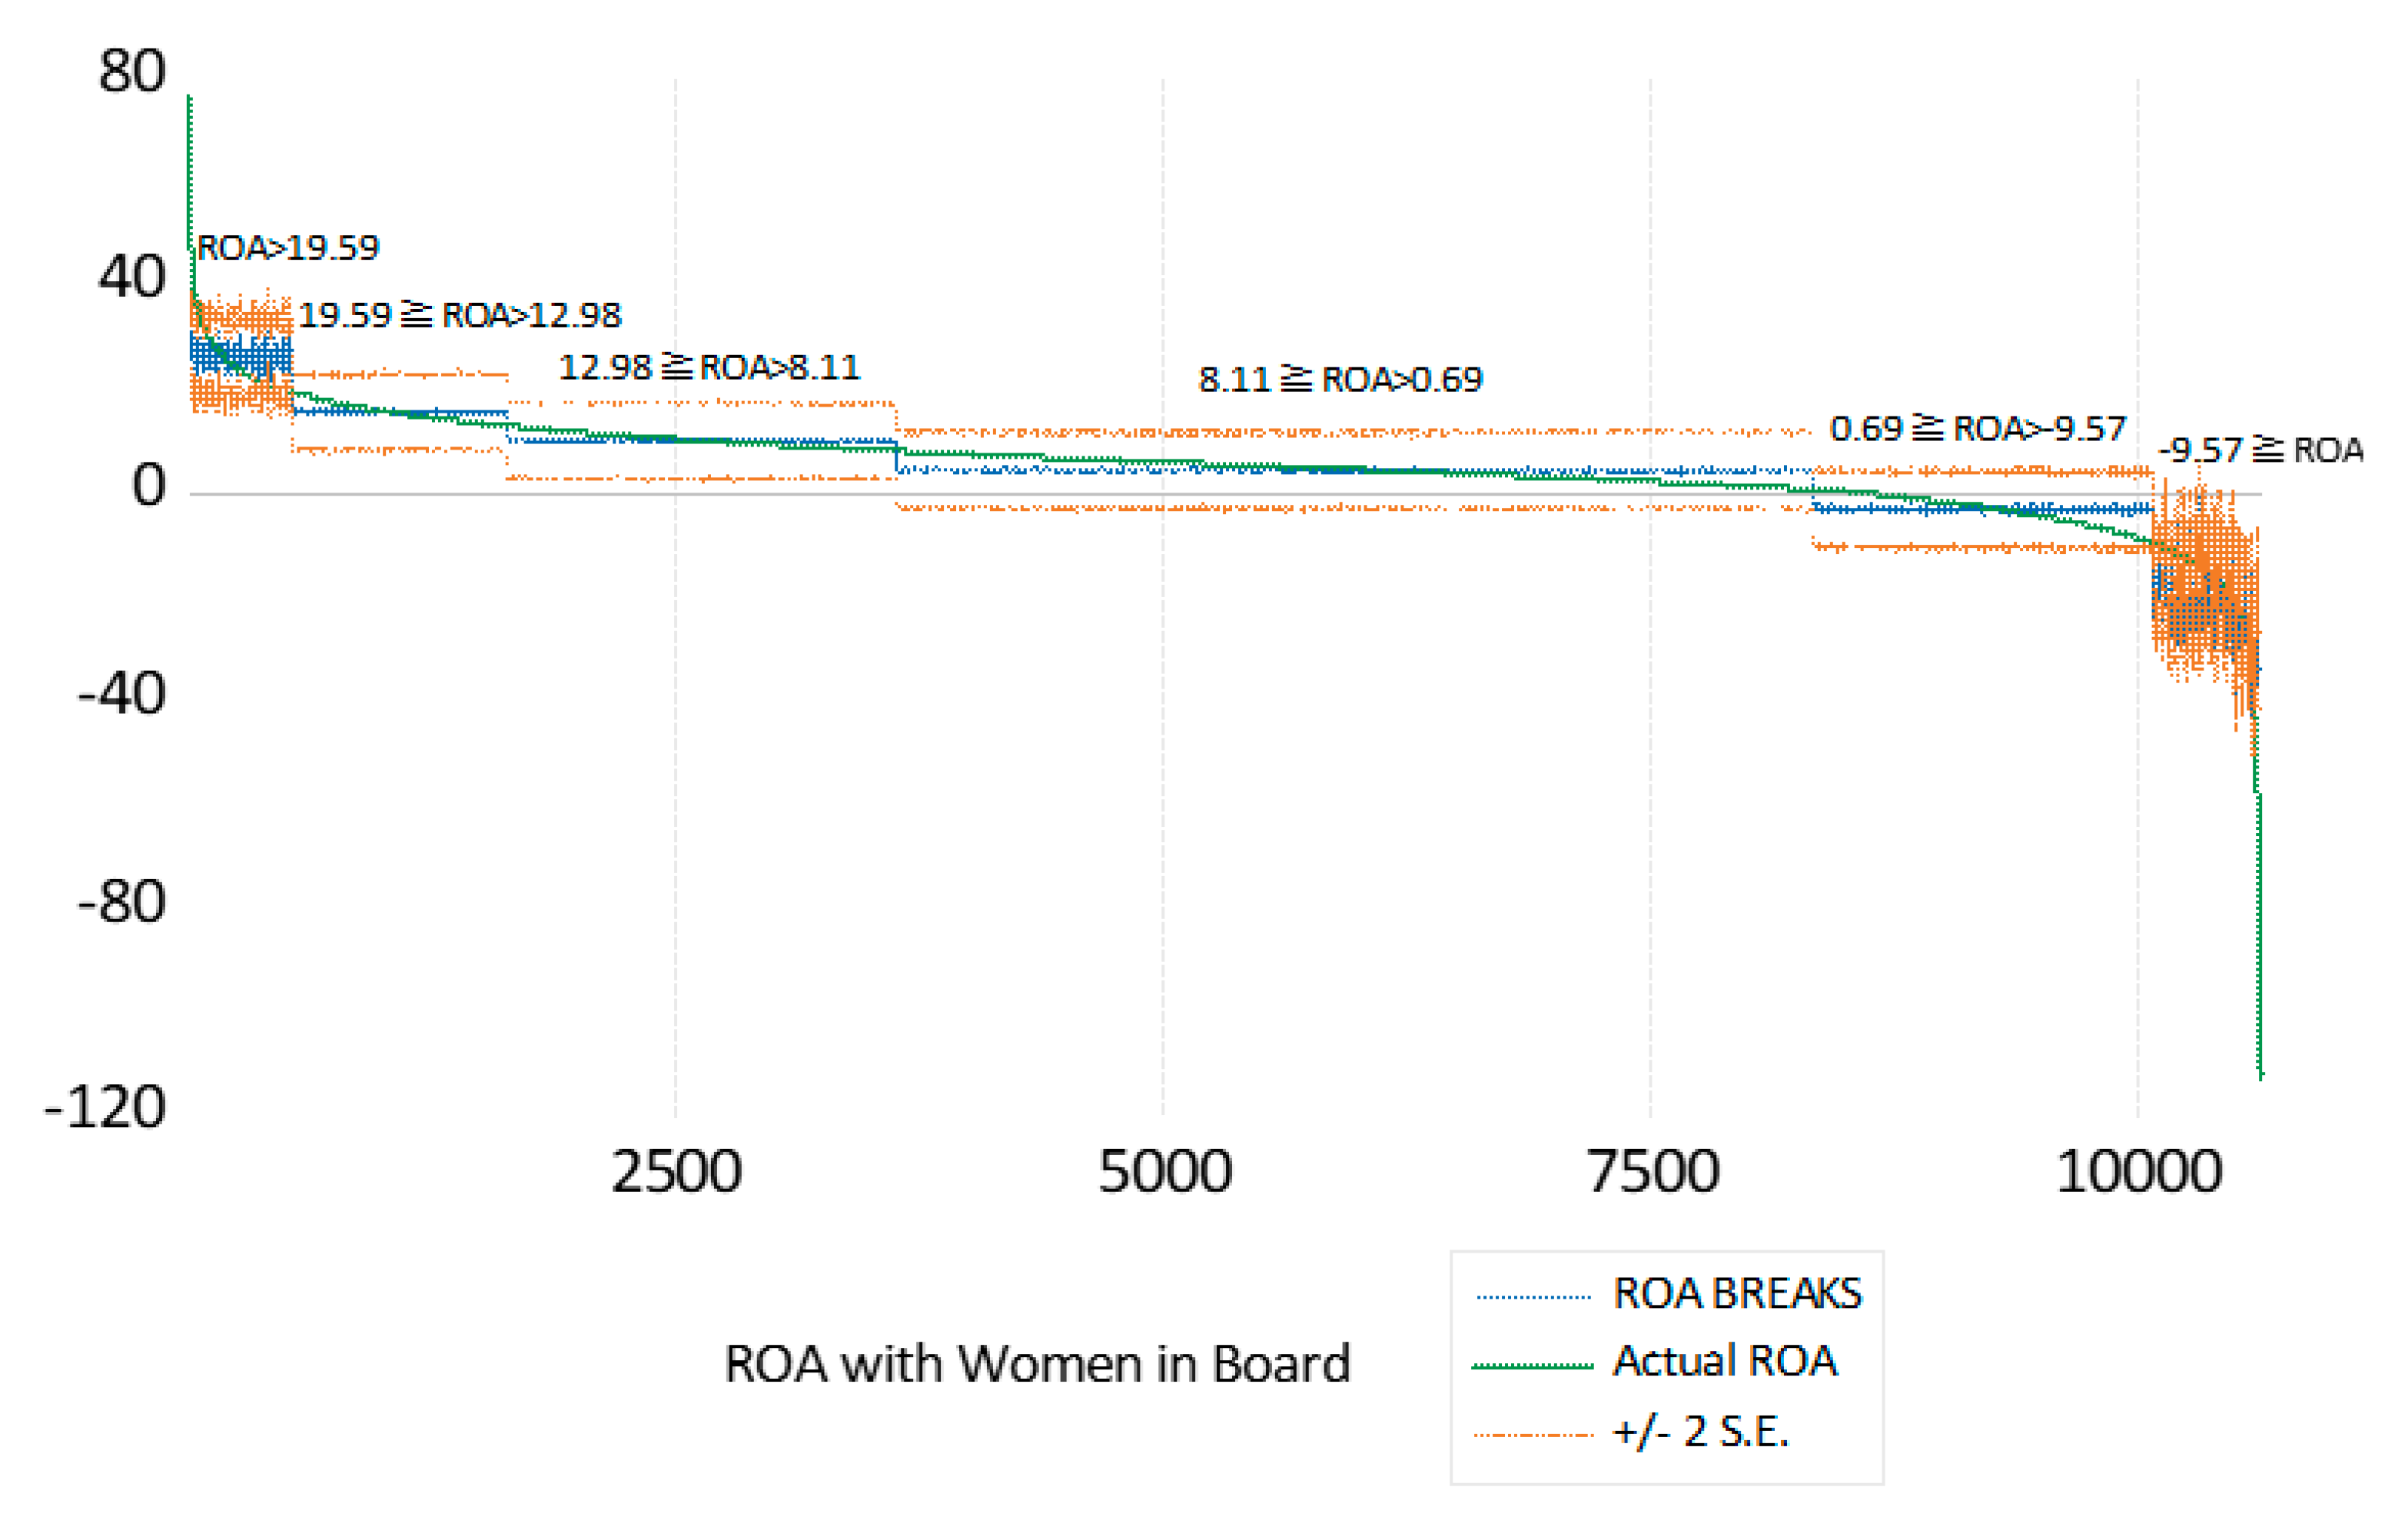
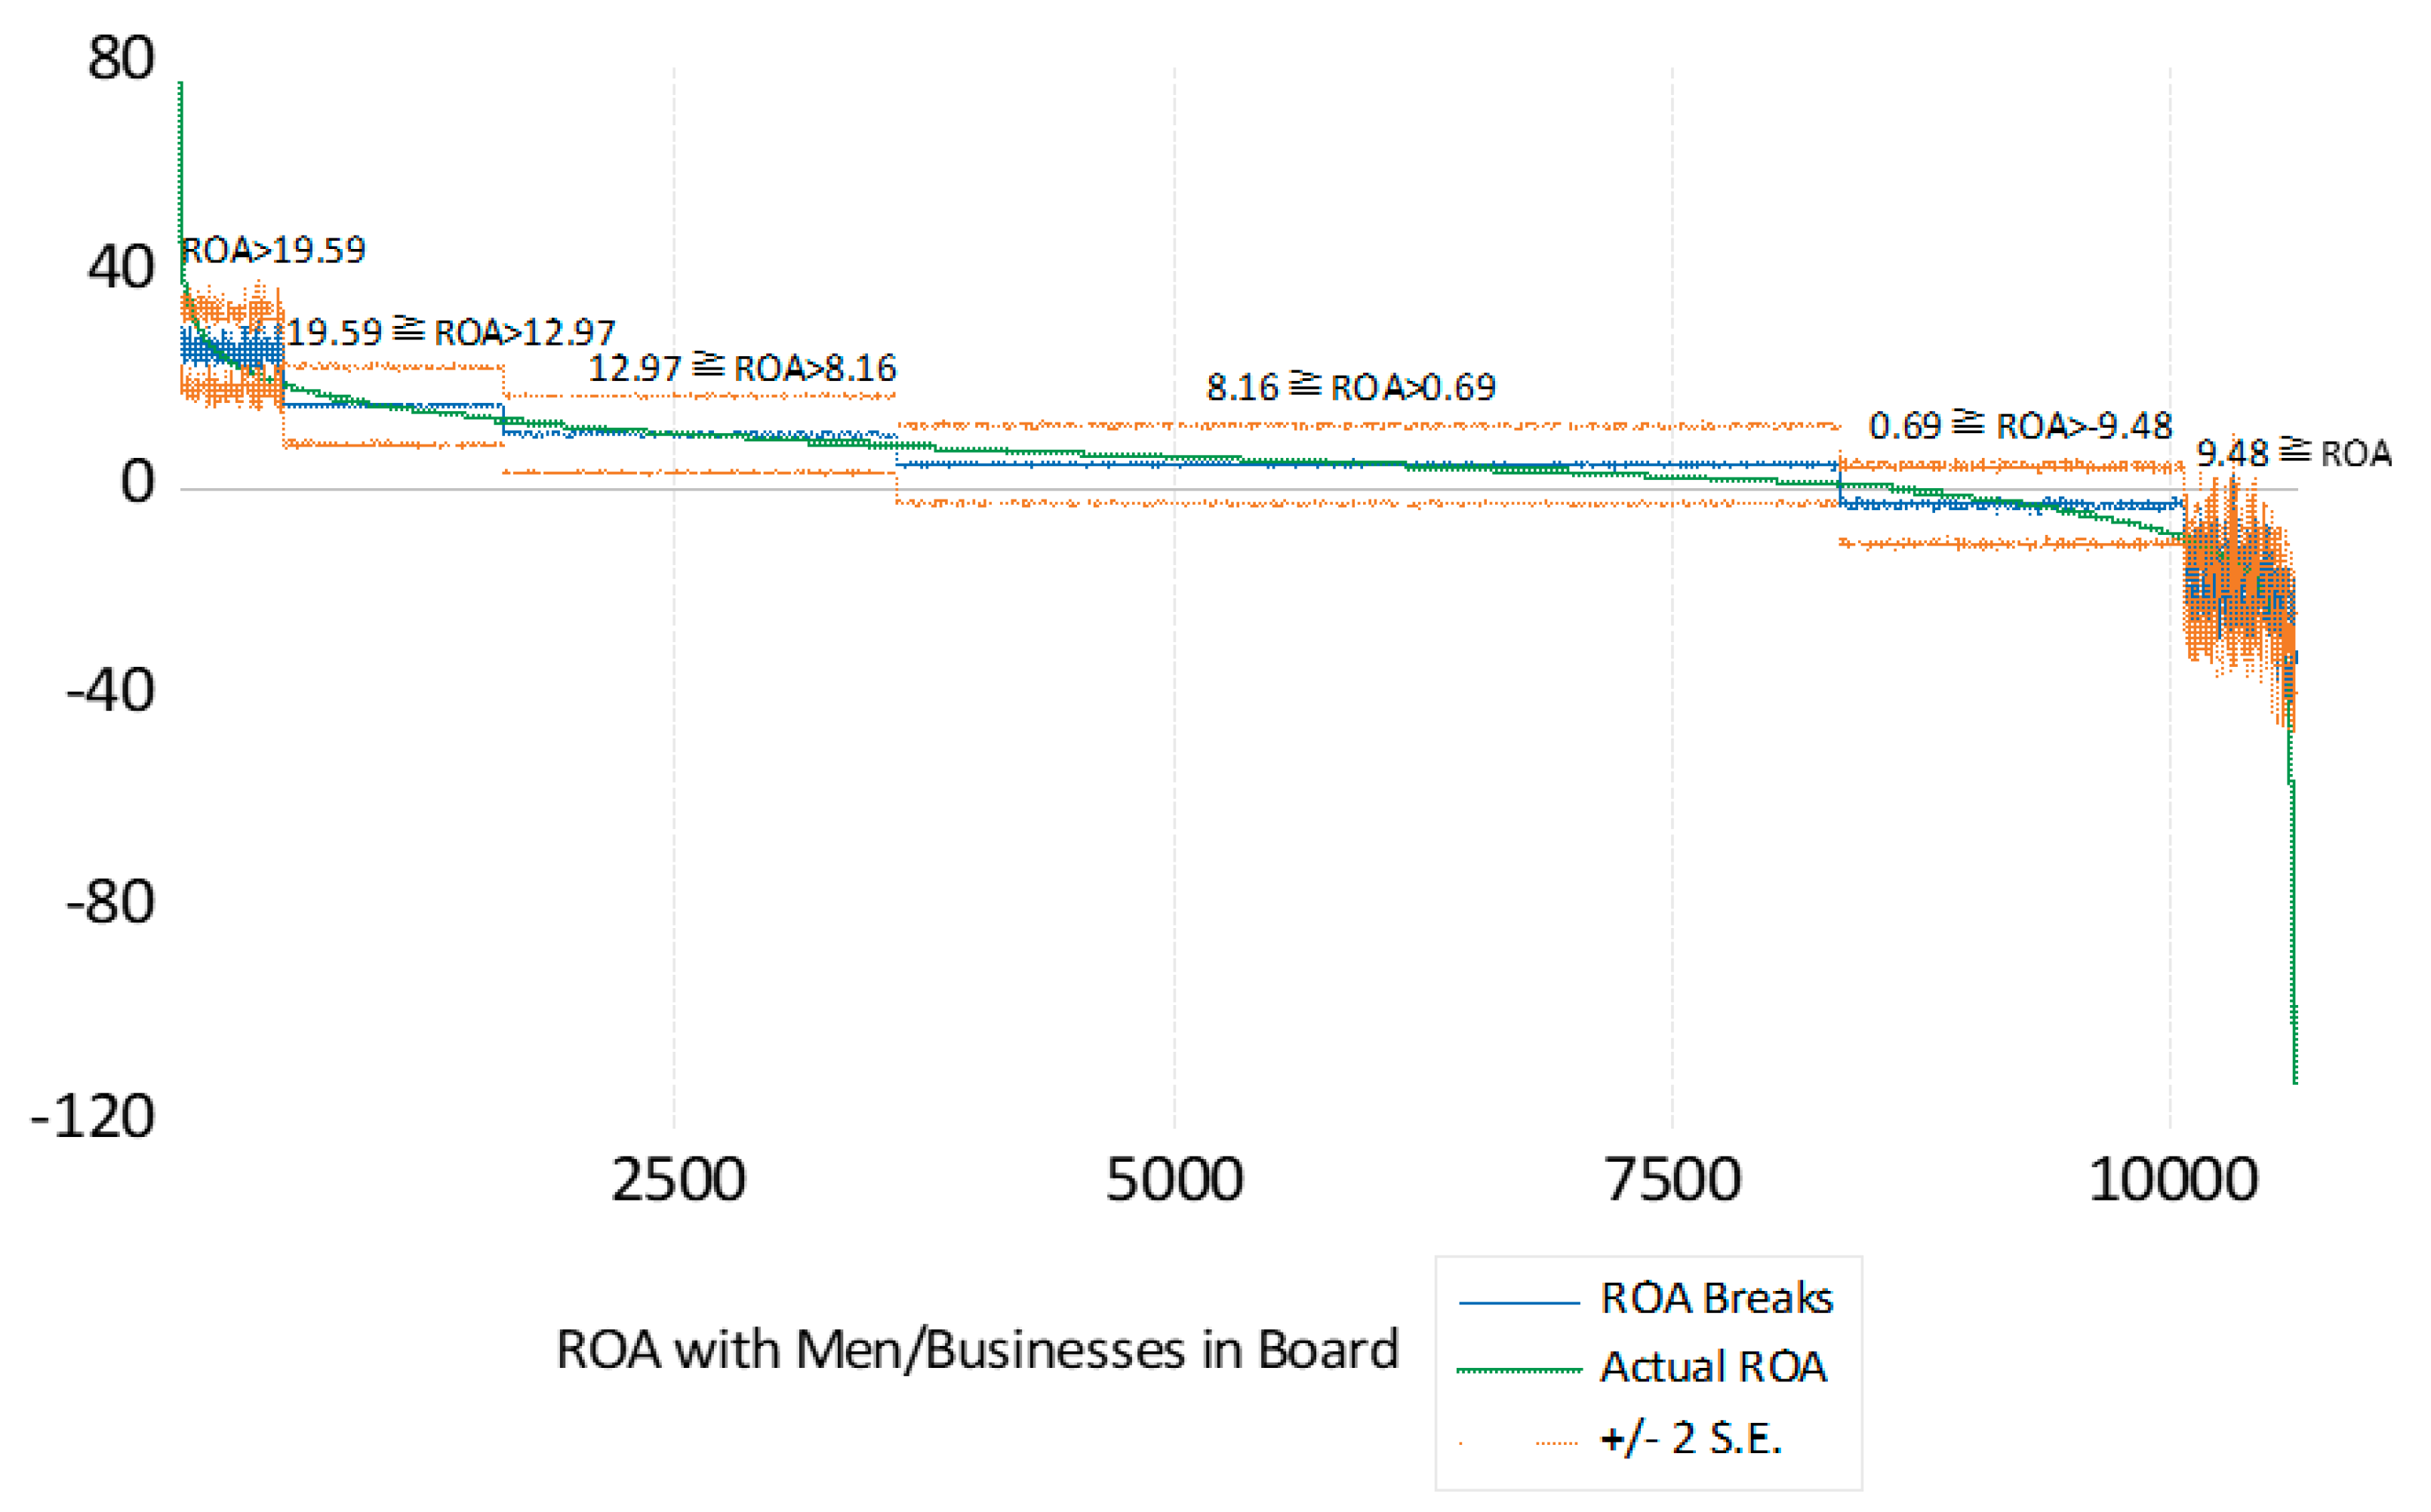
Table 4. Five breaks were detected in the three models; all F-statistics were significant at a 1% level. The breakpoints of Model 1 are at the following observations: 532nd, 1624th, 3628th, 8338th, and 10,080th. Model 2 and Model 3 have the same breakpoints at the following observations: 532nd, 1628th, 3607th, 8338th, and 10,072nd.
When these breaks correspond with ROA, the regimes of the models are formed as follows:
Model 1: ROA > 19.59; 19.59 ≥ ROA > 12.98; 12.98 ≥ ROA > 8.11; 8.11 ≥ ROA > 0.69; 0.69 ≥ ROA > −9.57; and −9.57 ≥ ROA.
Model 2 and Model 3: ROA > 19.59; 19.59 ≥ ROA > 12.97; 12.97 ≥ ROA > 8.16; 8.16 ≥ ROA > 0.69; 0.69 ≥ ROA > −9.48; and −9.48 ≥ ROA.
By observing
Figure 3 and
Figure 4, we can see that the three models’ first and last two regimes are relatively unstable. This detail shows that the change in these two regimes is quite robust; they can be generated by macro conditions and the management strategies adopted by the board.
3.3. Artificial Neural Networks (ANNs)
Artificial neural networks (ANNs) simulate biological neural networks as a block structure of simple interconnected computational units in which the connections between neurons determine the function of the network. The processing unit, also known as a neuron or a node as
Figure 5 depicted, does a straightforward job: It receives input signals from the front unit or an external source and then uses them to compute the signal output propagated to other units.
Each unit in a network combines values fed into it through links with other units, producing a value called net input. The function that performs this task is called the association function, which is defined by a specific propagation rule. In most neural networks, it is assumed that each unit provides an adder as input to the unit with which it is associated. The total unit input j is simply the weighted sum of the individual outputs from the connected units plus the threshold or bias
:
In case , the neuron is considered to be excited. Similarly, if , the neuron is restrained. Units with the above propagation rule are called sigma units.
Most units in a neural network pass net input using a scalar-to-scalar function called an activation function, the result of which is a value called the unit’s activation level. Excluding the possibility that the unit is in the output class, the activation value is included in one or more other units. Activation functions are often squeezed into a specific range of values called squashing functions.
Oostwal et al. [
44] analyze the training behavior of neural networks using Rectified Linear Units (ReLU) compared to sigmoidal activation functions, applying concepts from statistical physics. They find that ReLU networks exhibit continuous transitions in generalization performance as training set sizes increase, unlike sigmoidal networks, which experience discontinuous transitions and competing specialized states. Wang et al. [
45] assessed an improved dendritic learning (DL) framework for power load forecasting, testing five activation functions (sigmoid, tanh, ReLU, leaky ReLU, and ELU). The study found that the leaky ReLU–tanh combination provided superior performance in forecasting accuracy.
The activation functions used in this study are the rectified linear unit (ReLU) and hyperbolic tangent function (tanh):
In a neural network, there are three types of units: (1) input units receive signals from the outside; (2) output units send data to the outside; (3) hidden units, their input and output signals are in the network.
Each unit can have one or more inputs … but only one output . An input to a unit may be data from outside the network, the output of another unit, or its output. Transfer functions of hidden units are needed to represent nonlinearity in the network. The reason is that the composition of homogeneous functions is an identity function. However, its nonlinear nature (the ability to represent nonlinear functions) makes multilayer networks capable of representing nonlinear models.
The efficacy of artificial neural networks (ANNs) in predicting complex systems hinges critically on meticulous parameter selection. Key architectural components, including the number and size of hidden layers and the choice of activation functions, play a pivotal role in determining model performance. Properly tuning these parameters is essential, as they directly impact the network’s ability to learn intricate patterns and make accurate predictions.
Table 5 provides a detailed overview of the critical parameters used in the artificial neural network (ANN) architecture, including the number of layers, neurons per layer, and activation functions, all of which are pivotal in shaping the model’s ability to learn and generalize complex patterns from the data.
Figure 6 presents the optimal ANNs fitted for the data study, including eight input neurons and one output neuron. Three hidden layers (10-6-10) consist of 10, 6, and 10 hidden neurons, respectively.
The ANN model was trained with 70% data and tested with 30% for each WBD, MBD, and BBD model. The 70–30% split for dividing a dataset into training and testing subsets is a widely accepted practice in machine learning, including for artificial neural networks (ANNs), due to its balance between effective model training and rigorous evaluation. The larger portion (70%) provides sufficient data for the model to learn patterns and relationships, enhancing its generalization ability. The remaining 30% is used to evaluate the model’s performance on unseen data, ensuring a robust assessment of its generalization capabilities.
Validation is a critical step in machine learning, distinct from training and testing. It involves using a separate subset of the data, called the validation set, to tune hyperparameters and make decisions about the model’s configuration, helping to ensure that the model generalizes well to new, unseen data. The validation set is obtained by further splitting the training data rather than being part of the initial 70–30% split between training and testing. The training process involves dividing the training data so that 20% is used for validation. This split allows the model to be trained on 80% of the data while evaluating its performance on the 20% held-out validation set during training. The validation data help to tune hyperparameters and monitor generalization, ensuring that the model does not overfit the training data. The updates to the model occur every 15 samples, and the model undergoes five complete iterations over the training data.
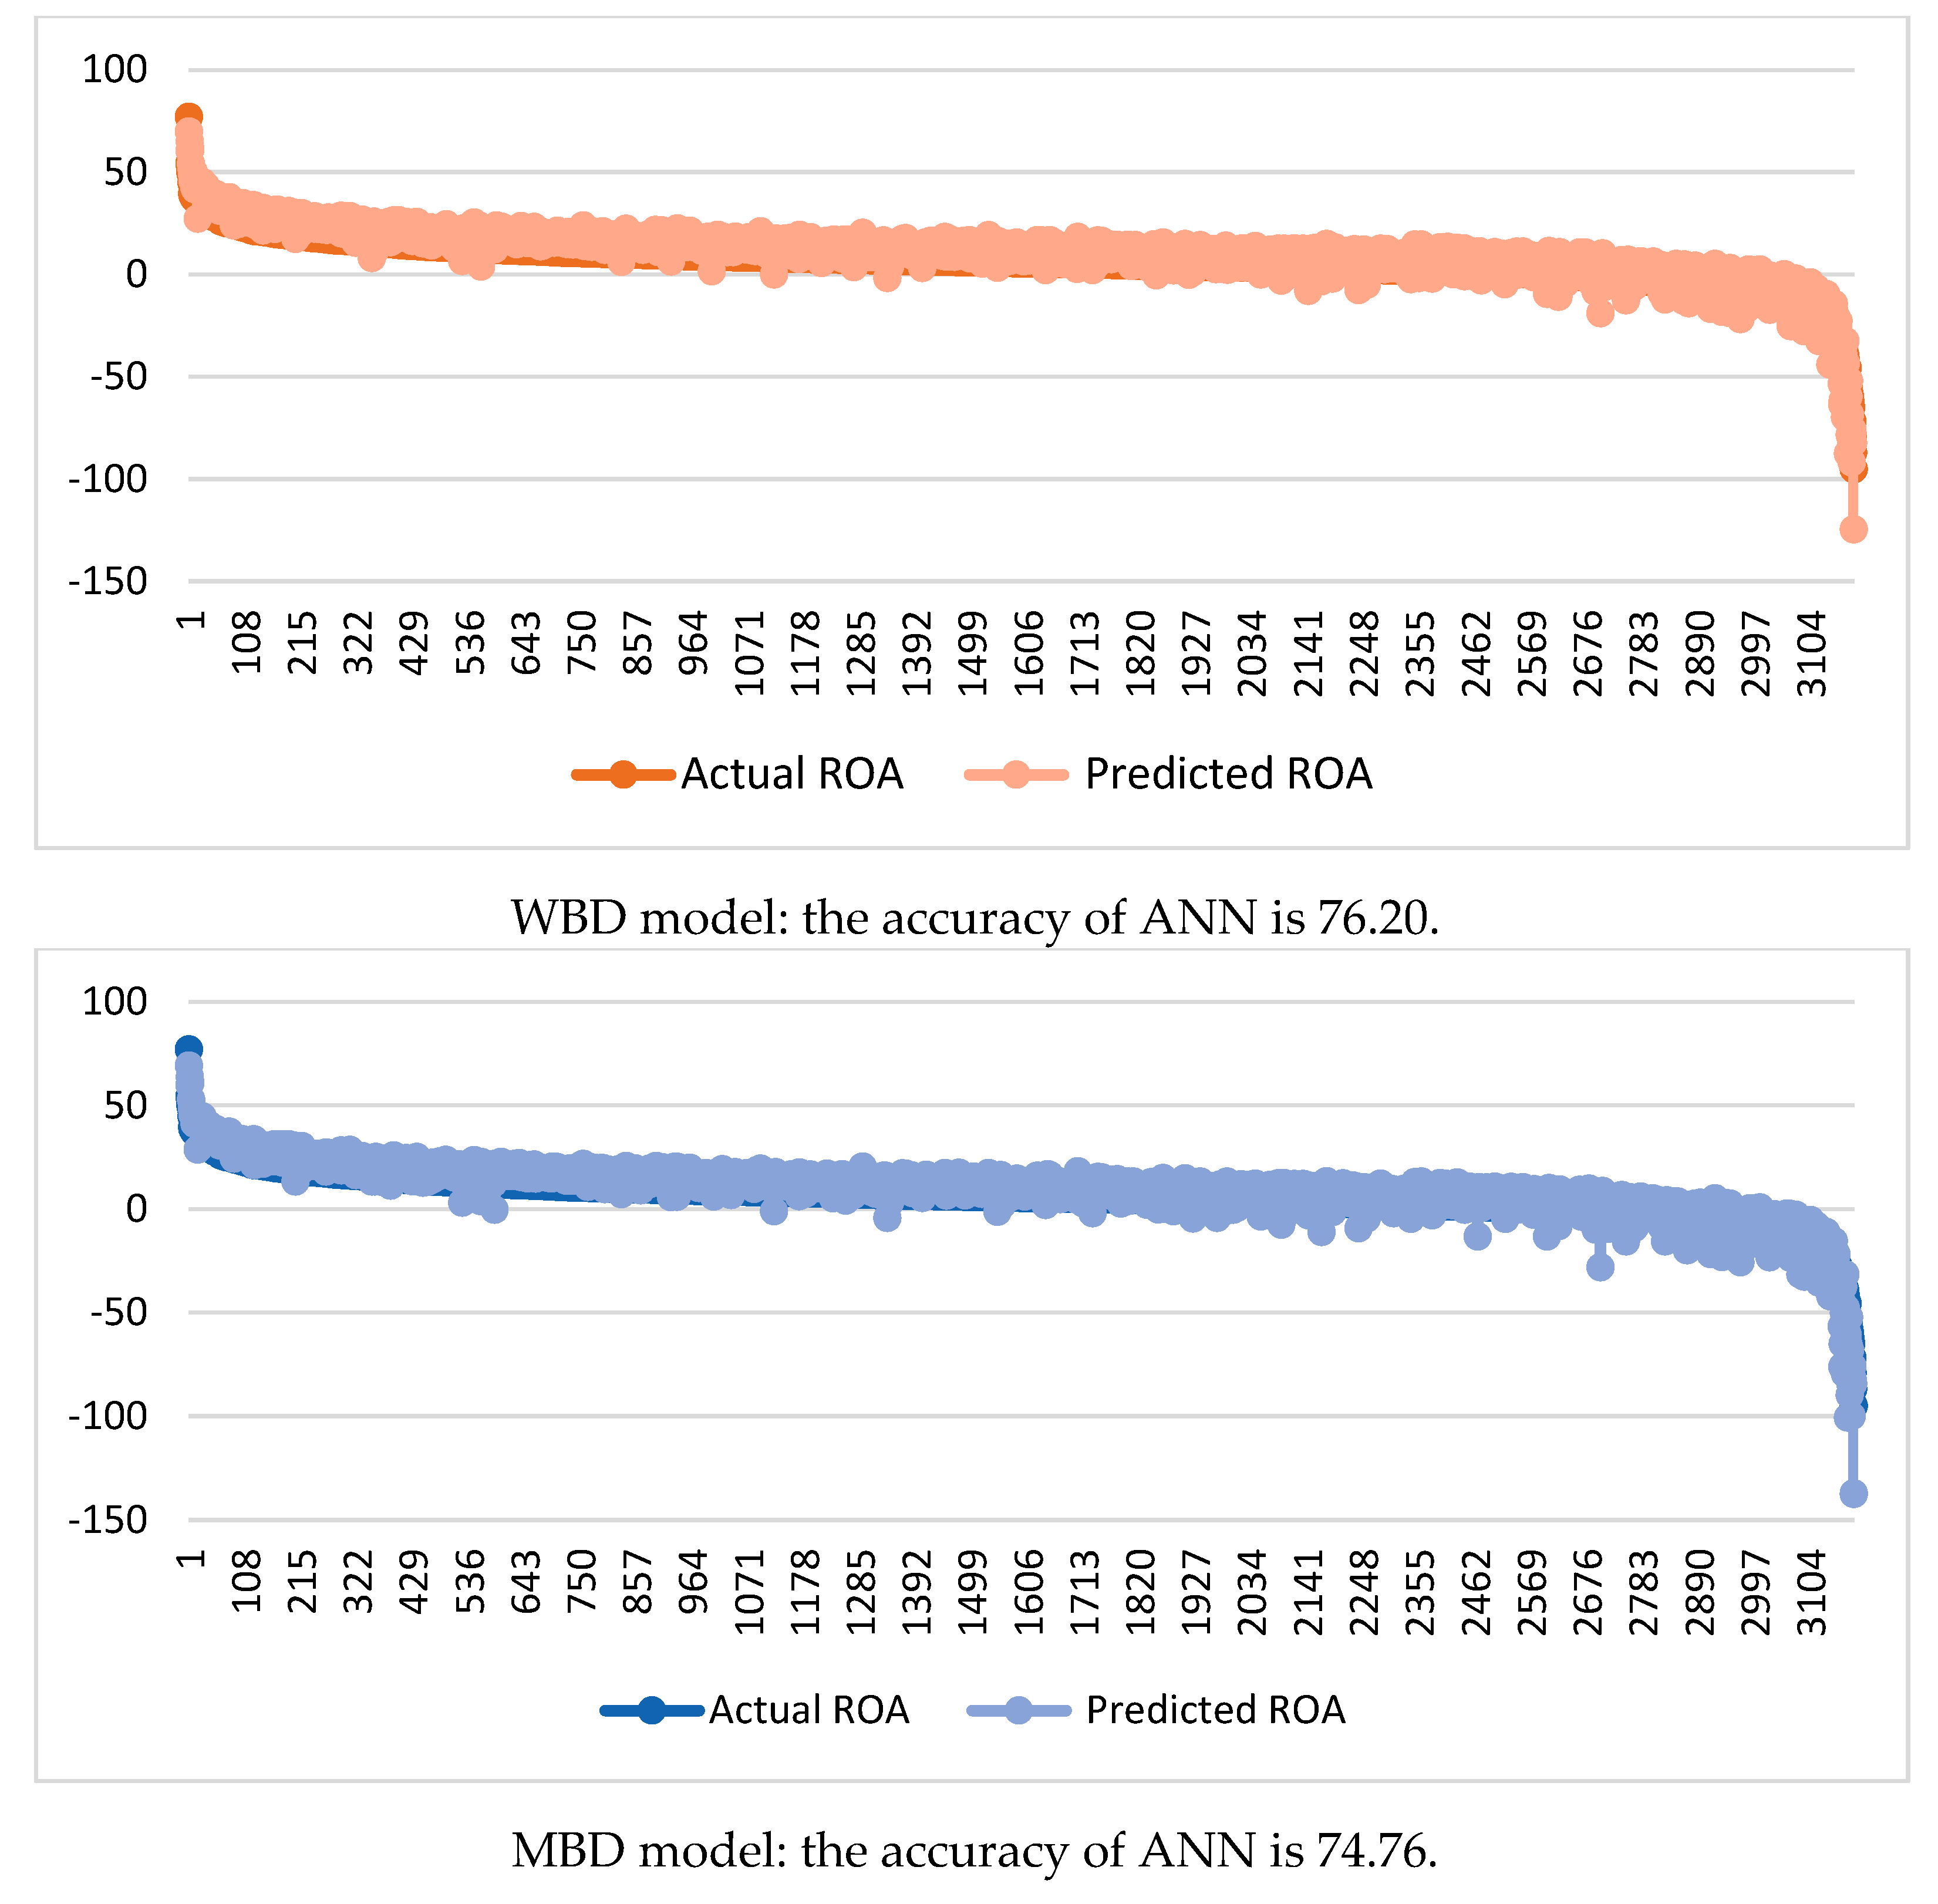
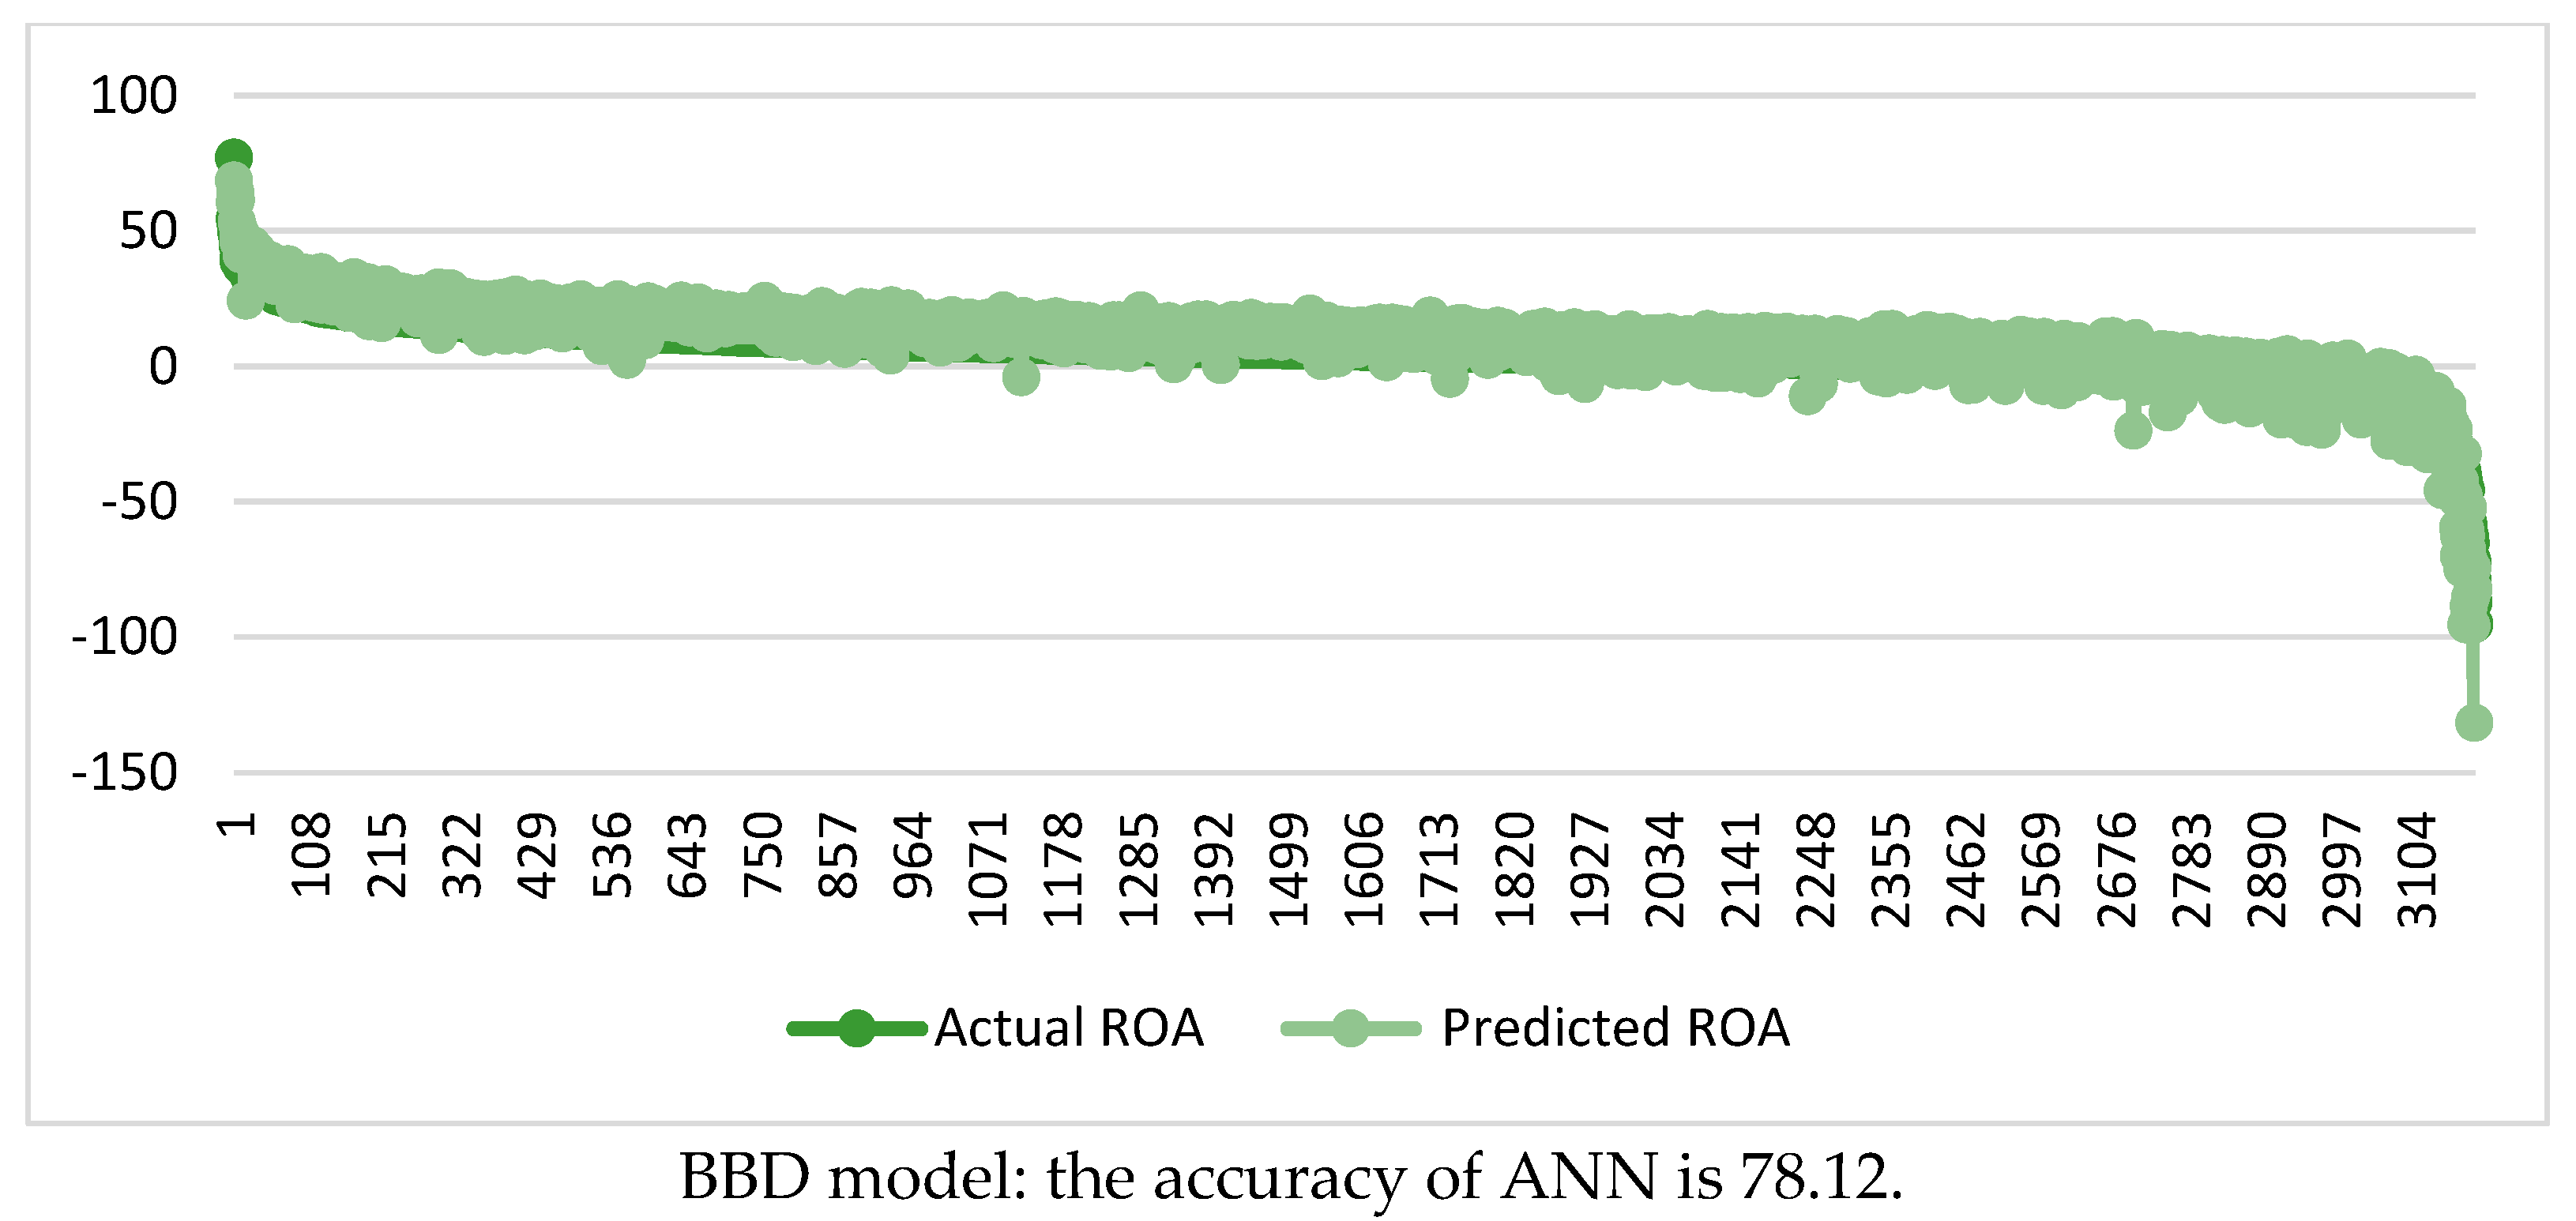
The error calculation is based on test data. Actual values are sketched in darker colors. A linear regression was conducted between the trained ANN predicted values and the actual values from the research data, including residuals from the regression. The results presented in
Figure 7 show that the accuracy of the ANN model is 76.20% when considering the influence of women members on ROA, 74.76% for male members, and 78.12% for business members.
The results indicate that the number of business board members offers the highest accuracy in predicting the return on assets. However, the role of female board members also warrants attention. The analysis reveals that female board members contribute a significant level of predictive accuracy, although slightly less than their business counterparts. This finding underscores the growing importance of gender diversity in boardrooms.
Female board members’ impact on ROA highlights their potential to bring unique perspectives and approaches that can positively influence company performance. While their predictive power is not as high as that of business board members, their involvement is still crucial. These results suggest that a balanced board composition, incorporating both business and female members, may provide a more comprehensive approach to enhancing firm performance.
3.4. Multi-Breakpoint Regression Analysis
While artificial neural networks (ANNs) provide valuable predictive insights into the effects of board diversity on company performance, multi-breakpoint regression analysis complements and extends these insights by elucidating how these effects vary across different business conditions. Specifically, ANNs excel at uncovering complex, nonlinear relationships and generating predictions based on diverse data patterns. In contrast, multi-breakpoint regression analysis identifies structural changes and specific thresholds where the influence of board diversity on performance shifts, offering a detailed understanding of how these effects differ in varying economic contexts. This combined approach allows for a more nuanced and comprehensive analysis of board diversity’s impact on corporate performance, integrating predictive power and contextual variability.
Table 6 shows the results of the regression of the business performance according to the independent variables and the control variables. The ratio of female members in the BOD positively correlates with ROA when ROA ≥ 12.98%, explaining that the presence of women on the board of directors contributes to an increase in ROA when the company is favorable in business and has high profits.
This result can be explained by the fact that only when the profits of companies are at their peak does the presence of women on the board of directors increase the supervisory capacity of the board, thereby improving the management mechanism and thereby improving the management system can improve a company’s competitive advantage. Thanks to this diversity, the council has more diverse opinions and perspectives, inspirational female role models, and seasoned mentors who can bring strategic information to the company.
Research indicates that female leaders often exhibit strong interpersonal skills and emotional intelligence, which are critical for effective leadership [
46,
47]. While some stereotypes label women as ‘emotional’, these emotional responses are often linked to greater empathy and sensitivity toward others’ feelings [
48,
49,
50]. Therefore, female leaders may be more adept at managing interpersonal relationships and understanding team dynamics, which can enhance their leadership effectiveness.
Table 7 shows that the proportion of male members on the board of directors positively correlates with ROA when ROA is <−9.48 and ≥19.59%. This means that male members positively contribute to the company’s profit when the business situation is at both extremes, extremely bad and extremely good.
Men’s leadership traits include decisiveness, vision, drive, and courage, while women are empathetic, subtlety, tolerant, caring, and affinity. Men prefer to deal with “things”, women prefer to deal with “people”, and leadership is often dealing with “people”. Therefore, when the company’s business situation is complex, the characteristics of male members come into play, contributing to improving the company’s profits. Past research has also provided evidence to support different traits in men and women, such as women being better at maintaining good relationships and more inclined to do ethical things, while men are more concerned about income and, therefore, risk more ethical violations [
48,
49,
50,
51].
Table 8 shows that the ratio of corporate members on the board of directors is negatively correlated with ROA when ROA ≥ 12.97%. A higher corporate membership ratio lowers a company’s ROA in high-profit regimes. In other words, business members want to hold back the high-yield company.
In addition, board size negatively correlates with performance measured by ROA at a 1% significance level when ROA is at the highest and lowest levels. This result implies that the larger the number of members on the board, the less effective the business strategies are, possibly because it is more challenging to achieve the consensus of the members.
The characteristics of the management board all affect the performance. Specifically, the power of the board of directors and the company’s significant shareholders are positively correlated with ROA. However, CEO power only has a positive relationship with ROA when ROA is not extremely low and reaches 1% significance when ROA is exceptionally high. Independent board members are unlikely to have a discernible effect on the company’s earnings. The results also show that the company’s size has a positive effect only when ROA is high. The higher the financial leverage, the lower the company’s profitability.
This study introduces a novel approach to management research, offering a nuanced perspective on how board diversity impacts firm performance across various conditions. The ANN analysis reveals that the number of business board members provides the highest accuracy in predicting Return on Assets, with female board members demonstrating strong, though slightly lower, predictive effectiveness. Notably, the presence of women on the board contributes positively to ROA, particularly when the company is experiencing favorable business conditions and high profitability. Our analysis further indicates that a higher percentage of male board members improves company performance, but this benefit is observed only under extreme conditions—both highly favorable and highly unfavorable. Conversely, an increased proportion of business board members tends to impact performance during times of high profitability negatively.
Additionally, the power held by the board of directors and significant shareholders positively correlates with company performance. In contrast, CEO power enhances performance primarily when it is not extremely low. Independent board members generally do not significantly affect profitability. The company’s asset value positively influences performance, especially when the return on assets is high, while increased financial leverage is associated with decreased profitability.
This study finds new and useful empirical evidence on the diverse influence of the board structure on the performance of Taiwanese companies. The results show that female, male, and business board memberships correlate with performance measured by ROA, which is different for each regime. Through the results of the empirical analysis, it is hoped that it may provide evidence from a new perspective on gender diversity in the board of directors to the performance of men and businesses and, simultaneously, encourage morale and inspiration for women.
4. Conclusions
This study integrates multi-breakpoint regression analysis with artificial neural networks (ANNs) to understand how board diversity impacts corporate performance comprehensively. While ANNs offer predictive insights into board diversity effects, multi-breakpoint regression analysis enhances these insights by identifying how these effects vary across different business conditions.
By integrating artificial neural networks (ANNs) with multi-breakpoint regression, this study pioneers a new approach to management research, offering a comprehensive view of how board diversity affects firm performance under varying conditions. The ANN analysis highlights that the number of business board members provides the most accurate Return on Assets prediction, with female board members also demonstrating strong predictive power. The nuanced understanding of female board members’ predictive capabilities implies that their role in governance should not be underestimated. Their contribution to board dynamics and decision-making processes can offer valuable insights, potentially leading to improved financial outcomes. As such, fostering greater gender diversity on boards could enhance overall organizational performance and accuracy in financial predictions.
Moreover, the findings reveal that a higher percentage of male board members improves company performance, but this benefit is observed only in highly favorable and unfavorable business conditions. Conversely, a higher percentage of business members negatively impacts company performance during periods of high profitability. Additionally, the power of the board of directors and significant shareholders is positively correlated with performance, while CEO power only positively influences performance under non-extreme conditions. Independent board members generally have minimal effects on profits. The company’s asset value enhances performance primarily when the return on assets is high, and higher financial leverage tends to reduce profitability. This approach introduces a novel area of management research by using ANNs to predict the impact of board diversity on firm performance. At the same time, multi-breakpoint regression analysis provides a framework to understand how these impacts vary under different conditions.
In an ever-evolving economy, the size and complexity of the job make it increasingly difficult and inefficient to run a company. In this situation, enterprises need managers with the right qualities and skills. Reality has set a requirement for the leadership to know how to grasp market movements and customer psychology well and to have a leadership style to create a friendly, positive working environment, which can be set out in the right direction for corporate value enhancement strategy. Faced with that requirement, the presence of women on the board of directors emerged as a solution. Both agency theory and stakeholder theory have mentioned the relationship between the presence of women on the board of directors and the value of enterprises.
For policymakers, along with drafting corporate governance codes, the issue of diversity in the board or executive board requires more attention. However, it should be noted that diversity is not just about gender. Important indicators of diversity, including skills, experience, education, and even age or nationality, also need to be scrutinized. Starting from gender diversity on boards, equal leadership opportunities for women can be a meaningful start for Taiwanese electronic companies and all companies in general.
The specific market conditions, corporate governance practices, and cultural context unique to Taiwan could influence the results in ways that may not apply to companies in other regions or markets. Future research could benefit from a comparative analysis involving companies from different countries or regions to enhance the robustness and applicability of the results.
This study seeks to contribute to the ongoing discourse on the role of AI in corporate governance, offering insights and recommendations to help organizations navigate the complexities of integrating AI technologies while advancing performance objectives and fostering diverse and inclusive corporate cultures. This interdisciplinary exploration aims to illuminate the path toward more effective, equitable, and sustainable governance practices in the digital age.
