Abstract
Predicting the directions of financial markets has been performed using a variety of approaches, and the large volume of unstructured data generated by traders and other stakeholders on social media microblog platforms provides unique opportunities for analyzing financial markets using additional perspectives. Pretrained large language models (LLMs) have demonstrated very good performance on a variety of sentiment analysis tasks in different domains. However, it is known that sentiment analysis is a very domain-dependent NLP task that requires knowledge of the domain ontology, and this is particularly the case with the financial domain, which uses its own unique vocabulary. Recent developments in NLP and deep learning including LLMs have made it possible to generate actionable financial sentiments using multiple sources including financial news, company fundamentals, technical indicators, as well social media microblogs posted on platforms such as StockTwits and X (formerly Twitter). We developed a financial social media sentiment analyzer (FinSoSent), which is a domain-specific large language model for the financial domain that was pretrained on financial news articles and fine-tuned and tested using several financial social media corpora. We conducted a large number of experiments using different learning rates, epochs, and batch sizes to yield the best performing model. Our model outperforms current state-of-the-art FSA models based on over 860 experiments, demonstrating the efficacy and effectiveness of FinSoSent. We also conducted experiments using ensemble models comprising FinSoSent and the other current state-of-the-art FSA models used in this research, and a slight performance improvement was obtained based on majority voting. Based on the results obtained across all models in these experiments, the significance of this study is that it highlights the fact that, despite the recent advances of LLMs, sentiment analysis even in domain-specific contexts remains a difficult research problem.
1. Introduction
The prediction of the price movement of global financial market trends, corporate earnings, and financial instruments such as stocks is considered to be a very challenging task because it depends on a multitude of complex factors. These factors include economic factors such as GDP and interest rates, fundamental indicators, technical indicators, political events, exchange rates, other external economic factors, etc. Fundamental indicators assess the financial situation of a business and the intrinsic value of its stock by analyzing the data about the firm’s business model, and there are several key indicators such as earnings per share (EPS), the price-to-earnings ratio (P/E), free cash flow (FCF), the price-to-book ratio (P/B), return on equity (ROE), and the debt-to-equity ratio (D/E) []. By contrast, technical indicators analyze past market data such as price and volume, to predict future stock price movements with the assumption that past stock price behavior influences the future market evolution []. Commonly used technical indicators include moving averages, the relative strength index (RSI), moving average convergence divergence (MACD), on-balance volume (OBV), the stochastic oscillator, Bollinger bands, the average directional index (ADI), etc. The technical indicator approach to stock price movement prediction contradicts the efficient market hypothesis (EMH) [,]. The EMH postulates that it is practically impossible to predict future price movements based on the historical market data because stock price movements are largely driven by new information, follow a random walk pattern, and do not follow any patterns or trends.
With the ubiquitous availability of social media services today, social media users and investors post vast amounts of information expressing some opinion or sentiment on financial instruments such as stocks. Real-time stock trading is a very dynamic and highly competitive activity in most financial markets. Investors use a combination of external information and internal company information to make investment decisions, and therefore, gaining an accurate vision of traders’ opinions at scale can give a trader an advantage in making investment decisions. The sentiments expressed in news and social media tweets have an impact on stock prices, and hence, constant tracking of these sentiments has become an important activity for many investors such as microblogs posted on social media platforms such as Twitter or StockTwits [,], where users express their opinions on a range of topics including stocks.
Sentiment analysis in the financial domain is particularly challenging because this domain uses its own jargon or vocabulary, which, therefore, requires domain-specific sentiment analysis. Many researchers have proposed various approaches that apply machine learning [], lexicon-based approaches together with machine learning [], deep learning approaches [,], and natural language processing (NLP) transformers [] to derive tweet sentiments and, hence, the directions of stock movements or other financial instruments. These approaches can be used to monitor market sentiments expressed in online news articles and/or social media posts in real time and leverage those sentiments in trading decisions. Using a related approach, Bloomberg reported that trading sentiment portfolios outperform the benchmark index significantly []. The significance of these approaches is also supported by Tetlock [] and Tetlock et al. [], who report that news articles and social media sentiments could be used to predict market return and firm performance.
As noted above, the prediction of the price movement of financial instruments such as stocks is a very challenging task as it depends on a multitude of complex factors; it is, therefore, necessary to integrate multiple data sources such as fundamental indicators, technical indicators, social media posts, and other relevant financial news articles for better performance. The observations above have formed the motivation for this research, and the objectives of this research are the following:
- Apply domain-specific sentiment analysis to develop LLMs for the prediction of financial instruments using multiple data sources from the financial domain.
- Enhance the model’s performance by leveraging pretraining and fine-tuning using financial corpora during model development.
- Compare the performance of the model against a set of sentiment analyzers, which consists of commercial sentiment analyzers, commercial generative AI models, academic sentiment analysis models, and open-source sentiment analyzers.
In our previous research, we developed FinSoSent, a domain-specific language representation model pretrained on financial corpora []. In this study, we report on additional work based on over 860 experiments, as explained in Section 3. The FinSoSent model outperforms some of the latest large language models (LLMs), such as, FinBERT and GPT-3.5-Turbo 16K (released in June 2023), in detecting the sentiment of social media posts. However, the model accuracy is in the 50–60% range, which is in line with the findings by Zimbra et al. [], who, in August 2018, before the release of the BERT model in October 2018, evaluated 28 state-of-the-art Twitter sentiment analysis systems across five domains (security, retail, technology, pharmaceuticals, and telecommunications) and found that the average classification accuracies of these systems ranged from 40% to 71%. The significance of this study is that it highlights that, despite the recent advances of LLMs, the sentiment analysis of social media posts in a domain-specific context remains a difficult research problem.
2. Related Work
Recent developments in NLP, deep learning, and transfer learning methods have made it feasible to produce actionable financial sentiments using financial texts found in financial news sources and on social media platforms such as X (formally Twitter) and StockTwits. NLP techniques can be used to better understand the large body of published financial text data. In particular, deep learning models such convolutional neural networks, recurrent neural networks (RNNs), and attention mechanisms are efficient and effective for NLP tasks because they require relatively little feature engineering, although they require a large corpora of training data []. Recent unsupervised pretraining of language models on large corpora, such as bidirectional encoder representations from transformers (BERT) [], ULMFit [], ELMo [], XLNet, and GPT [] have made significant performance improvements on many NLP tasks in different domains such as question answering, sentiment analysis, language inference, etc. In most cases, these language models are trained on general domain corpora such as news articles, books, and Wikipedia, which may not be suitable for sentiment analysis tasks in the financial domain, which uses its own vocabulary of terms whose semantics are different, as stated earlier.
It has been reported that pretraining a language model using a domain-specific corpus can further improve the task performance compared to fine-tuning a generic language model such as BERT, and some researchers have used this approach to create domain-specific BERT models, as explained briefly in the following examples. Beltagy et al. [] developed the SciBERT model by pretraining BERT using a large multi-domain corpus of scientific publications. Lee et al. [] developed a biomedical domain-specific language representation model called BioBERT by pretraining BERT using large-scale biomedical corpora, and Huang et al. [] developed ClinicalBERT by pretraining BERT with clinical notes for hospital readmission prediction tasks. Zimbra et al. [] conducted a thorough study and performance benchmark evaluation of Twitter sentiment analysis systems across five domains (security, retail, technology, pharmaceuticals, and telecommunications) using 28 state-of-the-art systems. They reported that the performance of these systems remains rather poor with tweet sentiment classification accuracies below 70%. According to their study, the main challenges impacting the accuracy of sentiment analysis systems identified include novel language with Twitter-specific communication elements, the brevity of tweets (140 characters), strong sentiment class imbalance because the sentiment categories are unequally distributed in datasets, and stream-based tweet generation. Overall, according to this study, the systems performed poorly with a wide range of average classification accuracies, which ranged from 40% to 71%; domain-specific approaches to sentiment analysis outperformed the general-purpose approaches with an improvement of 11%. This outcome supports the view that domain-specific approaches to sentiment analysis are required.
As explained above, recent developments in NLP, deep learning, and transfer learning have made significant improvements in the sentiment analysis of financial news and texts as supported by the research undertaken by Agaian and Kolm [], Man et al. [], Yang et al. [], and Zhao et al. []. For example, the work discussed by Zhao et al. revealed that BERT and RoBERTa have superior performance in financial sentiment analysis compared with dictionary-based models. RoBERTa is an optimized version of BERT retrained on a dataset ten times bigger using an improved training methodology and different hyperparameters, and it performs better than BERT on many NLP tasks including text classification []. Some researchers have used a similar approach to develop BERT-based models in the financial domain, and there are a number of such models, as explained below. Araci [,] developed a FinBERT model by pretraining BERT with a financial corpus and then fine-tuning it using a smaller financial dataset for sentiment classification in the financial domain. To create their FinBERT model, they first pretrained BERT with TRC2-financial, which is a subset of the Reuters dataset [], and then fine-tuned using the Financial PhraseBank dataset created by Malo et al. []. To validate their FinBERT, they implemented other pretrained language models using ELMo, LSTM, and ULMFit for financial sentiment analysis for comparison with FinBERT. Their FinBERT increased the classification accuracy by 15% compared with these other models. Desola et al. [] have developed three different versions of FinBERT by pretraining BERT with 10-K SEC filings, then testing using 10-Q SEC filings and earnings call transcripts. They reported that their FinBERT models outperform BERT on the masked language model and next sentence prediction tasks.
A different FinBERT model was developed by Liu et al. [] by starting with BERT and then taking BERT through six self-supervised pretraining tasks, then fine-tuning it with task-specific labeled financial data. They started by pretraining FinBERT simultaneously on a general corpus and a financial domain corpus and then moved on to the fine-tuning phase, where FinBERT is first initialized with the pretrained parameters and is then fine-tuned on task-specific supervised data. The pretraining datasets used are Financial Web [,], Yahoo! Finance [], the English Wikipedia and Books Corpus, and Reddit Finance QA []. The task-specific datasets for fine-tuning depend on the intended use such as financial question answering, financial sentence boundary detection, and financial sentiment analysis. The datasets used were FiQA Task 1 and FiQA Task2 [], Financial PhraseBank [], and the FinSBD Shared Task dataset []. The results of their experiments showed that their FinBERT outperforms all previous state-of-the-art models in financial question-answering applications, financial sentence boundary detection, and financial sentiment analysis, again supporting the view that domain-specific models have higher performance. Yang et al. [] developed their own version of a FinBERT model using a similar approach to the others. They started by compiling a large financial domain corpus using corporate 10-K and 10-Q reports, analyst reports, and earnings conference call transcripts. The corpus is then used to construct a financial vocabulary (FinVocab) for pretraining BERT. The Financial PhraseBank, FiQA Task 1 [], and AnalystTone datasets [] are then used to fine-tune the pretrained model, resulting in three different versions of FinBERT. The experimental results showed that their FinBERT models have higher performance compared with the generic BERT models. Wilksch and Abramova [] developed a model called PyFin-Sentiment for social media sentiment analysis in the financial domain. Their model was benchmarked against FinBERT [], VADER [], Twitter RoBERTa [], and NTUSD-Fin []; their model outperforms these models on financial social media sentiment classification task results obtained using the FinSoMe and their own financial dataset. Their dataset was created by collecting 3,757,384 financial tweets on S&P 500 tickers from Twitter from 1 April 2021 and 1 May 2022 that met certain criteria, then filtering and annotating them to end up with 2,755,824 tweets. Although BERT appears to have been widely experimented with, it has some shortcomings such as high computing demands needing a GPU/TPU, large memory needs, and long training times. There have been several efforts by different researchers to develop smaller and/or optimized versions of BERT. The XLNet model addresses these disadvantages of BERT by improving its architectural design for pretraining and produces results that outperform BERT on 20 different tasks []. Lan et al. [] developed ALBERT as a smaller and scalable successor of BERT that outperforms BERT on several tasks, including text classification, and reduces the number of parameters required in sentiment analysis compared to BERT. Sanh et al. [] developed DistilBERT based on a methodology that reduces the size of a BERT model by 40%, is 60% faster, and retained 97% of its language understanding capabilities. Facebook has also developed a novel transformer called BART [] with an architecture similar to GPT2 and BERT, and it outperforms other transformers in generation tasks such as text summarizing and question answering. These models have yet to be applied for sentiment analysis in the financial domain.
Mishev et al. [] designed an evaluation platform for assessing the performance of machine learning classifiers, deep learning classifiers, and fine-tuning NLP transformers. The platform includes capabilities for preprocessing, text feature extraction, and encoding for financial sentiment analysis. Their results show that Facebook’s BART outperforms BERT-based models such as BERT, RoBERTa, ALBERT, and DistilBERT, as well as XLNet in financial sentiment analysis. Unlike Mishev et al., in this work, we focus exclusively on social media texts in our financial sentiment analysis.
3. Materials and Methods
3.1. Datasets and Data Preparation
The FinSoSent model is a domain-specific sentiment analyzer. In this study, we used seven financial domain-specific datasets to pretrain, fine-tune, and test the model. The datasets consist of Twitter and StockTwits posts that are related to the financial markets. Below, we describe these datasets and their application to the model-building process.
3.1.1. Pretraining Dataset
Pretraining provides an opportunity to provide more information to the model before fine-tuning it on downstream tasks. A domain-specific set of documents was extracted from a well-known dataset, the Thomson Reuters Text Research Collection (TRC2) corpus, which comprises 1,800,370 news stories covering the period from 1 January 2008, until 28 February 2009 []. We used a custom bag-of-financial-terms classifier to extract 290,444 financial news articles from the TRC2 corpus. This domain-specific dataset, which we refer to as FinTRC2, was used to pretrain our model.
A similar classification of documents in the TRC2 dataset by Araci [] generated 46,143 financial documents; however, in that work, no details of the classification process were provided other than that it was keyword-based. In this work, we created a custom dictionary with 98 financial terms. As shown in Figure 1, each document in the TRC2 corpus was preprocessed as follows: first, the document was parsed to identify the lexeme type of each token, such as, for example, digits, words, complex words, and email addresses, then linguistics rules were applied to normalize the lexemes to their infinitive form; finally, the preprocessed document was stored as a sorted array of lexemes []. Each term in the custom dictionary was parsed to a lexeme. We searched the preprocessed document lexemes for each dictionary lexeme. If a preprocessed document had at least 3 dictionary lexemes, we classified the corresponding TRC2 document as a financial document. We used the full-text search (FTS) feature in PostgreSQL to preprocess each document in the TRC2 corpus and stored it as a tsvector. We then performed the search of the dictionary lexemes on the tsvectors using tsquery and the other FTS operators.
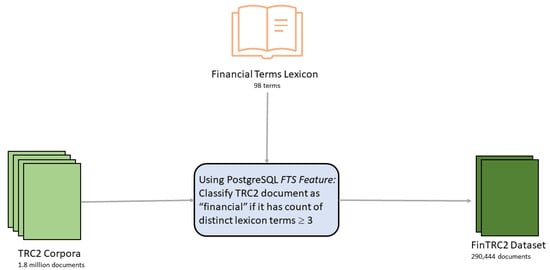
Figure 1.
Generating the FinTRC2 dataset.
3.1.2. Fine-Tuning Datasets
Social Sentiment Indices powered by X-Scores (SSIX): The FinSoSent model was fine-tuned on the SSIX dataset. This dataset consists of 2886 financial messages from StockTwits and Twitter with opinion targets []. The period of collection for this dataset was between October 2011 and June 2015. This dataset was annotated by financial experts using a scale of 1 to 7 for negative to positive sentiment at an entity level. This integer scale was eventually consolidated into a real number sentiment score in the [−1, 1] range for each message. In our class of labeled datasets, the SSIX dataset provided the best sentiment class distribution at 23% for negative, 34% for neutral, and 44% for positive, as shown in Figure 2, so we chose to use it to train our model.
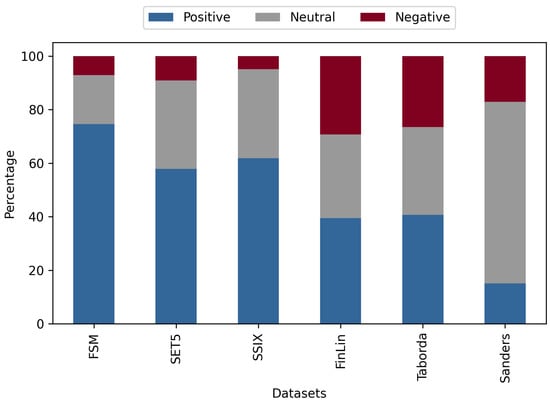
Figure 2.
Distributionof sentiment classes for all datasets.
Fin-SoMe (FSM): The FSM dataset consists of 10,000 messages from StockTwits []. Chen et al. did not provide a time period for when these StockTwits messages were collected. The FSM dataset is a gold standard that was annotated by experts working in a bank’s treasury marketing and risk management units. The market sentiment of each message in the FSM dataset was labeled as either bullish, bearish, or neither.
SemEval-2017 Task 5 (SET5): This dataset was posted 6 September 2016 for the Subtask 1 of the SemEval-2017 Task 5 Fine-Grained Sentiment Analysis on Financial Microblogs and News data. It consists of 1285 StockTwits and Twitter messages containing a cashtag, which is a company stock symbol preceded by a “$” []. Each message has a sentiment score between −1 and 1.
3.1.3. Testing Datasets
For testing the FinSoSent model, as well as the other five comparative sentiment analyzers, we used the following four datasets:
Fin-Lin (FL_ST): The parent dataset (Fin-Lin) consists of 3811 documents, comprised of microblogs from StockTwits, news articles from Yahoo! News, financial reports for publicly traded companies, and analyst reports from 1 July 2018 to 30 September 2018 []. We extracted only the StockTwits data from Fin-Lin to create the FL_ST dataset, which consisted of 3204 stocktwits/messages. Each message in the FL_ST dataset was labeled with a numeric sentiment score in the [−1, 1] range.
Sanders: The Sanders dataset consists of 5512 tweets on four different topics (Apple, Google, Microsoft, and Twitter). This dataset is a gold standard with each tweet manually labeled by one annotator as either positive, negative, neutral, or irrelevant with respect to the topic []. These tweets were collected between 2007 and 2011.
Taborda-L: The Taborda labeled dataset consists of 1300 tweets, which were collected between 9 April 2020 and 16 July 2020, using the following Twitter tags as the search parameters: #SPX500, #SP500, SPX500, SP500, $SPX, #stocks, $MSFT, $AAPL, $AMZN, $FB, $BBRK.B, $GOOG, $JNJ, $JPM, $V, $PG, $MA, $INTC $UNH, $BAC, $T, $HD, $XOM, $DIS, $VZ, $KO, $MRK, $CMCSA, $CVX, $PEP, and $PFE. The tweets were manually annotated with positive, neutral, or negative sentiment classes [].
The summary data of the testing datasets is shown in Table 1.

Table 1.
Summary statistics of all the datasets. “Avg. FT” is the average of the three fine-tuning datasets, and “Avg. Test” is the average of the three testing datasets. The “Avg. doc length” is the average document length in characters.
The sentiment class distribution of the testing datasets is shown in Figure 2.
3.1.4. Data Preprocessing
The goal is to be able to build a sentiment analysis model that is able to generalize well across many texts; in order to do so, we experimented on the six datasets mentioned above for the fine-tuning and testing of the models. The datasets range from unbalanced datasets to more properly distributed sets, in the time periods of the data recording, and finally, their size. Minor processing of the data was needed in order to have a classification represented by an integer of [0, 1, 2]; this required converting text-based classification labels and floating-point representations into the integer form mentioned above.
Before training and testing the models on the datasets, it is important to harmonize the datasets. This included understanding what makes the datasets different concerning the sentiment labeling technique and the text represented within the datasets.
Social Sentiment Indices powered by X-Scores (SSIX): For this dataset, it was identified that there were 1029 duplicate documents, and only 285 documents were unique. All duplicates were removed, and the first instance of the document was kept. We also noted that the duplicates had different sentiment average scores. For determining the classification, we used the score provided and re-labeled as follows: negative [−1.0, −0.1), neutral [−0.1, 0.1], and positive (0.1, 1.0].
Fin-SoMe (FSM): The FSM data required cleaning up, and all duplicates that were identified were from the ticker sign “$”. All duplicates were removed, and the first instance of the document was kept. The dataset had three classifications “negative”, “unsure”, and “positive”; unsure in this case was changed to represent “neutral” in order to normalize our experiments.
SemEval-2017 Task 5 (SET5): SET5 experienced duplicate documents, which required the removal of 152 records, where the first instance of the document was kept. It is noted that the duplicate values had differing sentiment values from the first record. For determining the classification, we used the score provided and re-labeled as follows: negative [−1.0, −0.1), neutral [−0.1, 0.1], and positive (0.1, 1.0].
Fin-Lin (FL_ST): Fin-Lin experienced duplicate documents, and all duplicates were removed and the first instance of the document kept. The dataset also had a category determining the source of the documents; the dataset was then filtered to only contain data from StockTwits, designated as “SW”. For determining the classification, we used the score provided and re-labeled as follows: negative [−1.0, −0.1), neutral [−0.1, 0.1], and positive (0.1, 1.0].
Sanders: No duplicates were observed with the Sanders dataset, but what was observed was that many documents were from a different language; this was determined by using the langdetect package, which leverages a library from Google’s language-detection. Out of the 5113 documents, all documents were removed that were not labeled as English, resulting in the removal of 1477 documents. Finally, the dataset had four remaining classifications: “negative”, “irrelevant”, “neutral”, and “positive”; irrelevant in this case was removed in order to normalize our experiments.
Taborda-L: Taborda experienced duplicate documents, which required the removal of 16 records, where the first instance of the document was kept. We also noted that the duplicates had different sentiment average scores and different “created_at” values.
The numerical values chosen for representing floating-point values in the classifications were selected to maximize the identification of text that expressed emotions; the ranges from positive and negative captured 0.9, respectively, while neutral was 0.2.
The FinSoSent model was built using the pretrained BERT model, which uses the transformer architecture, which performs well for sentiment analysis due to the ability to capture long-range dependencies without relying on sequential processing. BERT converts text embeddings, establishing token similarities and understanding through its encoder mechanism. According to Devlin et al. [], the BERT transformer uses bidirectional self-attention, and this is supported by the pretraining task they used, which included mask LM and next sentence prediction.
The benefit of using BERT for sentiment analysis is that we can add additional domain-related information as a pretraining step. Pretraining allows us to initialize the weights of the model; in our case, we would like to train the model using financial-related information as tokens. To use pretraining, we needed to procure a corpus of financial-related information, and we are able to leverage the Thomas Reuters Corpus to identify quality articles and, thus, documents that we will sample as a pretraining dataset. As shared by Devlin et al. [], document-level sentiment analysis samples are preferred to extract long contiguous text, and the Thomas Reuters Corpus gave us this ability. The approach treated each article in the corpus as a document, which was then tokenized, and the tokens were evaluated for financial content. The creation of the pretraining datasets included the requirement of validating tokens such that they matched a list of targeted financial tokens. Each document was required to meet a threshold of matching tokens, similar to a bag-of-words approach. In total, we were able to create a dataset of 49 million words. The different versions of FinBERT are briefly explained in Section 2, and we compared our approach to two of those FinBERT models, the FinBERT model by Liu et al. [] and the FinBERT model by Yang et al. []. Liu et al. took the approach of using FinancialWeb and YahooFinance data with a crawler and Reddit FinanceQA for Reddit posts with more than 4 up votes in total, creating a pretraining dataset of 12.71 billion words. Yang et al. used SEC annual filing reports from 10-K and 10-Q documents, earnings call transcripts, and analyst reports, totaling 4.9 billion words.
The datasets used for fine-tuning remained in their raw state including misspelled words, emojis, emoticons, jargon, numbers, and connotations. The decision was made to use the power of embeddings to create the relationships of the tokens within the given document. As we explored preprocessing the text, we noticed that the original understanding of the document was lost and was nearly illegible. Preprocessing complex text like social media jargon or domain-specific information in finance may result in losing its meaning and understanding. An example of this is shown in Figure 3.
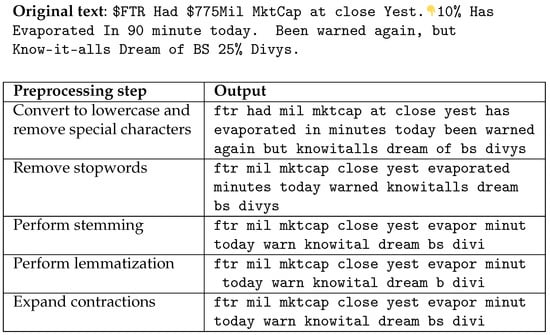
Figure 3.
An example of preprocessing a social media post.
You will notice that much the original meaning is lost if not completely changed after foregoing a few preprocessing steps that are often recommended. In addition, there was an inability to handle abbreviated words like “mktcap”, which represents “market cap”, as well as introducing an increase in misspelled words like “minutes” to “minut”. An alternative approach to preprocessing can be to leverage generative text large language models or LLMs, something we will continue to experiment with in future works.
According to Balaji et al. [], sentiment analysis has different classifications, which differ in granularity, from the document level down to more granular classifications like the phrase level. Each type of classification has its benefits and drawbacks. The document level benefits from having a sentiment classification for possibly one or many different topics; the inverse of this is that the sentiment classification given can be misleading as the document as a whole may inherit positive, neutral, or negative pieces of information.
The datasets we used during the experimentation ranged from an average of 17 to 32 tokens, while the testing datasets averaged 25 tokens. In addition, the word restrictions from Twitter posts make it complicated to have the ability to convey different contradicting sentiments. Within the Model Development Results Section, error analysis was conducted supporting this claim that the sentences largely are not incredibly long or complex, as can be seen in row 3 of Table 1.
3.2. Model Development
To identify the best-performing model for predicting the correct classification, there was a series of configuration changes of the hyperparameters. All experiments were trained in the same manner, other than the specific use case displayed in the tables below in Section 3.2.1, Section 3.2.2, Section 3.2.3, Section 3.2.4 and Section 3.2.5.
3.2.1. Pretraining
Pretraining offers the ability to provide more information to the model before fine-tuning it on a downstream task; this was explained in depth in the Methodology Section. We experimented with training the models on different variations of the documents to see if there were improvements and compared them with a model without the pretraining step. The pretraining TRC5K dataset has 2 million tokens, TRC100K 43 million tokens, and TRC150K 61 million tokens. Each TRC dataset, as its document size increases, includes the tokens from the smaller datasets. Based on our experimental results in Table 2 and Table 3, the model showed insignificant improvement when pretrained with a 0.01 improvement of the F1-weighted score. Although pretraining a model properly will show more consistent predictions balanced across the dataset, this is shown as the difference in accuracy between no pretraining and TRC100K pretraining and the weighted F1-score.
Table 2.
Model accuracy, when the pretraining dataset is variable and all other parameters are fixed. With fine-tuning of the dataset: FSM, learning rate: 2 , epochs: 50, batch size: 128. The bolded average value represents the optimal dataset.
Table 3.
Model weighted F1-score, when the pretraining dataset is variable and all other parameters are fixed. With fine-tuning of the dataset: FSM, learning rate: 2 , epochs: 50, batch size: 128. The bolded average value represents the optimal dataset.
3.2.2. Fine-Tuning
To train a model to make predictions, a dataset must contain a set of documents with the corresponding sentiment classification. This can be expressed as a range from [−1, 1], as text, or as a numerical representation for each classification. Financial instruments can move in three directions: up, down, or sideways. To support the mobility of assets in a market, a dataset or a derivative of a dataset containing three sentiment labels is required to train the model for those predictions. We can take advantage of a technique in machine learning called fine-tuning. The benefit of fine-tuning is that you can train a model to make better predictions about a downstream task, as explained earlier.
The results in Table 4 and Table 5 bear out that selecting the right dataset for fine-tuning is critical. When comparing across three datasets FSM, SET5, and SSIX, we have a large range of performance from [0.336, 0.572] contributing to a performance boost at a baseline of 70.2%. Once we identified that the FSM dataset’s performance was the best, we wanted to optimize the model by training it on a balanced dataset using SMOTE []. SMOTE is a technique that allows us to balance an unbalanced dataset; in our case, it will synthetically provide representation across all sentiment classes for training to be at 33.3%. This technique showed the complexity of selecting the proper fine-tuning dataset as we saw a degradation of performance from the model when training across the board. The same conclusion was reached when we experimented with ADASYN, which provides a balanced distributed dataset based on the difficulty of a document, but focused on the minority classification within the dataset [].
Table 4.
Model accuracy, when the fine-tuning dataset is variable and all other parameters are fixed. With pretraining of the dataset: TRC100K, learning rate: 2 , epochs: 50, batch size: 128. The bolded average value represents the optimal dataset.
Table 5.
Model weighted F1-score, when the fine-tuning dataset is variable and all other parameters are fixed. With pretraining of the dataset: TRC100K, learning rate: 2 , epochs: 50, batch size: 128. The bolded average value represents the optimal dataset.
3.2.3. Learning Rate
In the same vein that the fine-tuning dataset is critical for performance, we found that the learning rate is important as well. Research work conducted by Li et al. [] concluded that, when fine-tuning a BERT model, selecting the appropriate learning rate is important for capturing details and general feature information. This was revealed in an experiment focused on fine-tuning the learning rate and batch size hyperparameters. As is evident in Table 6 and Table 7 below, there are large variances in selecting a particular learning rate ranging between abysmal results with the weighted F1-score to an acceptable model. Results vary due to a few factors, but in particular, training a model and tuning this hyperparameter varied its effectiveness in learning the downstream task. While training a model, we optimized for the loss function; the learning rate determines how large the step we need to take is while achieving a minimal loss.
Table 6.
Model accuracy, variable learning rate, with all other parameters fixed. With pretraining of the dataset: TRC100K, fine-tuning dataset: FSM, epochs: 50, batch size: 128. The bolded average value represents the optimal dataset.
Table 7.
Model weighted F1-score, variable learning rate, with all other parameters fixed. With pretraining of the dataset: TRC100K, fine-tuning dataset: FSM, epochs: 50, batch size: 128. The bolded average value represents the optimal dataset.
When selecting a model based on the optimization of the loss function, it is critical to understand how the model performed relative to the loss function while testing the results. A large learning rate like 2 does not reach the global or local minima, in addition to possibly leading to large updates or changes, further leading to the inability to reach an acceptable performance. This was further refined as we also noticed that making too many small changes like 2 did not achieve optimal results when compared to a relatively larger learning rate like 2 . Similarly, Li et al. concluded that a lower learning rate provided the best results when training a BERT model across different domains, as they compared learning rates of 4 , 3 , and 2 and found 2 to perform the best.
3.2.4. Epoch
The epoch is a hyperparameter that is important for controlling the learning capabilities of a neural network model. While evaluating FinSoSent, we found, as shown in Table 8 and Table 9, that using the largest epoch did not constitute the best performance, but rather, settling at around 50 epochs improved performance on average by 10% when compared to the 15 epoch training set for the weighted F1-score. Devlin et al. [] originally trained the BERT model to perform across multiple tasks, but we found more success using a larger epoch count like 50.
Table 8.
Model accuracy, variable epoch, with all other parameters fixed. With pretraining of the dataset: TRC100K, fine-tuning dataset: FSM, learning rate: 2 , batch size: 128. The bolded average value represents the optimal dataset.
Table 9.
Model weighted F1-score, variable epoch, with all other parameters fixed. With pretraining of the dataset: TRC100K, fine-tuning dataset: FSM, learning rate: 2 , batch size: 128. The bolded average value represents the optimal dataset.
3.2.5. Batch Size
Another hyperparameter that contributes to the number of samples the model is given, similar to the epoch, is the batch size. According to Popel and Bojar, the batch size is defined as, “is the number of training examples used by one GPU in one training step” []. Their findings always concluded that larger batch sizes led to a quality model in their transformer model for language translations. We arrived at a similar conclusion when comparing four different sets of batch sizes when averaged across all test datasets, as shown in Table 10 and Table 11. It is also important to note that larger batch sizes also contribute to larger training times when compared against the other evaluated models with lower batch sizes.
Table 10.
Model accuracy, variable batch size, with all other parameters fixed. With pretraining of the dataset: TRC100K, fine-tuning dataset: FSM, learning rate: 2 , epochs: 50. The bolded average value represents the optimal dataset.
Table 11.
Model weighted F1-score, variable batch size, with all other parameters fixed. With pretraining of the dataset: TRC100K, fine-tuning dataset: FSM, learning rate: 2 , epochs: 50. The bolded average value represents the optimal dataset.
3.2.6. Handling Imbalanced Classification Datasets
We recognize we are training a model that has an imbalanced classification set for fine-tuning, and to resolve this limitation in the dataset, we trained two models to compare against a baseline model. As stated earlier, we incorporated ADASYN and SMOTE to compare different techniques in search of an increase in performance. Our results are shown in Table 12 and Table 13. Although, for one dataset, ADAYSN outperformed the other models, it did not have increased performance on the datasets with a lower weighted F1-score and accuracy. It is undetermined if a balanced distribution of labels can lead to a performance increase, and this is represented in the testing dataset and Section 3.2.2, where the most balanced fine-tuning dataset available in this experimentation did not yield the best results.
Table 12.
Model accuracy, when the fine-tuning dataset is variable and all other parameters are fixed. With pretraining of the dataset: TRC100K, learning rate: 2 , epochs: 50, batch size: 128. The bolded average value represents the optimal dataset.
Table 13.
Model weighted F1-score, when the fine-tuning dataset is variable and all other parameters are fixed. With pretraining dataset: TRC100K, learning rate: 2 , epochs: 50, batch size: 128. The bolded average value represents the optimal dataset.
3.3. Model Development Results
Upon conducting many thorough experiments almost similar to a grid search using different datasets and hyperparameters, we were able to build a sentiment analyzer that performs well on a trinary classification problem for financial texts in social media. Some hyperparameters provided a boost to the model beyond the data that were used. There are a few steps when training a model for sentiment analysis that is profound, like the selection of the fine-tuning dataset, the learning rate, and the batch size. We observed that all datasets are not created equal, where specific datasets optimize the learning from the machine learning model and the testing datasets also provide complexities where, on average, the models perform well. We also observed that finding the correct balance in the learning rate is essential for finding great increases in performance, in addition to the batch size used. From our experimentation and expectations, it was astonishing to notice that the pretraining datasets used reached inconclusive results with evidence of marginally better performance.
To further understand the performance of our FinSoSent model, error analysis was conducted comparing the ground truth with the FinSoSent prediction. We found no conclusive evidence in the text structure across the three tested datasets of Fin-Lin, Taborda, and Sanders that made them grammatically different. We recorded the number of tokens and the sum of nouns present in each document within the datasets on average. We will first define severely inaccurate as inaccurate predictions within the polar extremes of sentiment analysis, for example the prediction is positive when the ground truth is negative.
When reviewing the results in Table 14, Table 15 and Table 16, you will find that accurately, inaccurately, and severely inaccurately predicted documents all have relatively the same structure across the sentiment classifications. Between accurate and inaccurate predictions, we noticed on average only one token count difference across the datasets. In a comparison between severely inaccurate token counts, the profile of the text is similar to an exception from Sanders, where in the positive classification, there is a significant drop in the token count when compared to the accurate and inaccurate comparisons. When reviewing noun count, it is also inconclusive, as there are samples where a larger noun count does not always signify that our model provided an accurate prediction across the board.
Table 14.
Results of sentiment classification by token count and parts-of-speech for the Fin-Lin dataset.
Table 15.
Results of sentiment classification by token count and parts-of-speech for the Taborda dataset.
Table 16.
Results of sentiment classification by token count and parts-of-speech for the Sanders dataset.
When evaluating the documents of severely inaccurate samples, we identified a few types of text that FinSoSent struggled to predict. The types of text ranged from the usage of complex social media or loose English verbiage like “nuked”, “GG”, or “weeeeeee”, documents with multiple sentiments, and processing text with emotions of regret or humor like “$TSLA LMAO RIP to those that followed ryan brinkman and bought $GM $F”. A sentiment analysis model like FinSoSent is only aware of the raw text it is presented, and this creates a gap in understanding additional information before deciding on a sentiment classification. This is better explained as we start to compare texts from authors with conflicting motivations or perspectives. In investing, typically, an asset increasing in price represents a positive sentiment for the investor, as its goal is to optimize and maximize profits through the increase in the value; the counterexample is a bear investor, who benefits from a decrease in value. When a text is presented to a model, it takes the information given at “face value”, unaware of the motivating factors of the author, as shown in Table 17.
Table 17.
Types of complexities in document sentiment analysis.
4. Results
4.1. Base Model Performance
After the training of the FinSoSent model, we settled on the best-performing model, and we will compare it against alternative sentiment analyzers. We compared the performance of the FinSoSent model against a set of sentiment analyzers, which consists of commercial sentiment analyzers, commercial generative AI models, academic sentiment analysis models, and open-source sentiment analyzers. In these experiments, we compared FinSoSent with Amazon-Comprehend [,], FinBERT [], GPT-3.5-Turbo 16K [], IBM WATSON [,], SentiStrength [], and VADER []. The results are shown in Table 18 and Table 19. FinSoSent outperforms all models in accuracy, but not in the weighted F1-score across all three test datasets. Overall, either FinSoSent or VADER marginally outperform each other. We also noticed that a generative AI model like GPT 3.5-Turbo performs third best, but is a standard deviation away from VADER and FinSoSent. Overall, there is not a large difference between sentiment scores, and the results show that improvements in this field are mostly marginal due to the complexity of this task.
Table 18.
Accuracy of the FinSoSent model compared to a set of commercial, generative AI, academic, and open-source sentiment analysis models. The bolded average value represents the optimal model.
Table 19.
Weighted F1-score of the FinSoSent model compared to a set of commercial, generative AI, academic, and open-source sentiment analysis models. The bolded average value represents the optimal model.
4.2. Ensemble Models’ Performance
The method of ensembling provided an additional boost in performance through the use of the soft voting and majority voting techniques. With soft voting, we can use the combination of probabilistic predictions from the FinSoSent, VADER, and IBM Watsons models to create a mean to determine the sentiment; on the other hand, majority voting uses the classification prediction made between the models, and the most agreed-upon label will be chosen, while if there is no agreement, neutral is used as the final prediction. Both techniques enhanced the performance of predicting over any individual model, but it was a modest improvement. The performance of these ensemble models is shown in Table 20 and Table 21.
Table 20.
Accuracy of the ensemble models with FinSoSent, VADER, and IBM Watson as the component models. The bolded average value represents the optimal model.
Table 21.
Weighted F1-score of the ensemble models with FinSoSent, VADER, and IBM Watson as the component models. The bolded average value represents the optimal model.
4.3. Study Limitations
We note a few limitations with this study. The fine-tuning datasets range in size from 2886 to 10,000 documents, while the testing datasets range from 1300 to 5512 documents. These are relatively small datasets, which could potentially impact the results of this study. While a manual step-by-step approach in the more than 860 experiments was used to select the optimal model, other approaches such as grid search or random search could also have been used to identify the optimal fine-tuned model.
5. Conclusions and Future Work
This work developed a model called FinSoSent, which pretrained a BERT-based model and fine-tuned it downstream for sentiment analysis without preprocessing the text. We believe there is scope for more improvement in three different areas: the usage of a model with larger parameters, changing the scope of sentiment analysis, and a novel idea for preprocessing the input. Firstly, training a model on BERT-large will provide an increase in the number of encoders, bidirectional self-attention heads, and parameters; this may provide more robust and better understanding of the input documents. Secondly, we would also like to address an inherited problem with document-based sentiment analysis as discussed by Balaji et al. [] and Hoang et al. [], by exploring aspect-based sentiment analysis, which allows us to address the challenges of multiple sentiments being present in a document. Lastly, we have experimented with a novel preprocessing step that uses generative text models to identify complex verbiage in social media into something that can be embedded and tokens that can be represented within the BERT vocabulary. Figure 4 shows a social media post that was preprocessed using the novel idea mentioned earlier using GPT 3.5-turbo into a structured form that is more understandable.
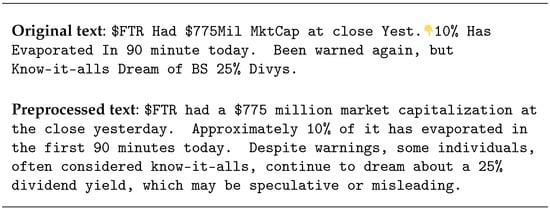
Figure 4.
Using GPT 3.5 to preprocess a sample social media post.
Using generative AI text models provides a set of benefits in addition to tradeoffs; the benefits include transforming the original text to be clearer concerning its context and expanding acronyms including ticker symbols. This process would be difficult with traditional NLP preprocessing steps as it usually makes the input smaller and, sometimes, less understandable. By enabling this capability, we leverage the benefit of using generative AI, but by using this technology, we are now exposed to the weaknesses of these systems. As discussed by Goertzel [], self-attention has limitations with structure language due to the finite vocabulary and sentence structures, making it a liability in NLP scenarios. In addition, Goertzel discusses the limitation of LLMs for NLP use cases; Goertzel mentioned that general models cannot outperform fine-tuned models in NLP use cases, but perform well across many NLP tasks. Finally, Goertzel states that LLMs hallucinate and lack episodic life history for the task of processing for clarifying text from a user of social media. Clarifying text from a user of social media may entail understanding what the user is talking about, which may span across different social media posts or even news events.
This is a benefit that can be leveraged in making it clearer to predict sentiment by reproducing the original text and providing additional context to acronyms, which may not be well understood by BERT’s vocabulary set. The challenge of using generative AI LLMs is that these introduce the inability to reproduce results and hallucinations, which may misrepresent acronyms and text, ultimately changing the original sentiment. To combat this, we incorporated a sentence similarity score using the cosine similarity to compare the original text and the preprocessed text, ensuring the quality of the integrity of the original text; this is a widely used metric for comparing two texts and their similarity. This technique is used in search engines to compare a query with the search results; technically speaking, cosine similarity is comparing terms between documents; however, this does not include the semantic similarity of text, as elaborated by Rahutomo et al. [] and Raju et al. []. In Table 22, we present a zero-shot cosine similarity score between the original and the LLM-preprocessed results from GPT 3.5-turbo. We expect to receive better cosine similarity results by changing the prompt from zero-shot to few-shot prompting in future works.
Table 22.
Cosine similarity measure of the fine-tuning datasets.
Author Contributions
Conceptualization, C.M., J.D. and J.K.; Methodology, C.M., J.D. and J.K.; Investigation, J.D.; Data curation, J.D.; Writing—original draft, C.M., J.D. and J.K.; Writing—review & editing, C.M., J.D. and J.K. All authors have read and agreed to the published version of the manuscript.
Funding
This research received no external funding.
Data Availability Statement
The data presented in this study are available on request from the corresponding author.
Conflicts of Interest
The authors declare no conflicts of interest.
Abbreviations
The following abbreviations are used in this manuscript:
| Abbreviation | Definition |
| NLP | natural language processing |
| LLM | large language model |
| BERT | bidirectional encoder representations from transformers |
| FinBERT | BERT model for financial sentiment analysis |
| RNN | recurrent neural network |
| CNN | convolutional neural network |
| LSTM | long short-term memory |
| ELMo | embeddings from language model |
| XLNet | eXtreme multi-label text classification |
| ULMFit | universal language model fine-tuning |
| GPT | generative pretrained transformers |
| FSA | financial sentiment analysis |
| FSM | Fin-SoMe |
| SET5 | SemEval-2017 Task 5 |
| EMH | efficient market hypothesis |
| SSIX | social sentiment indices powered by X-scores |
| TRC2 | Thomson Reuters Text Research Collection |
| NTUSD-Fin | National Taiwan University social media dataset financial |
| EPS | earnings per share |
| P/E | price-to-earning ratio |
| FCF | free cash flow |
| ROE | return on equity |
| RSI | relative strength index |
| MACD | moving average convergence |
| OBV | on-balance volume |
| D/E | debt-to-equity ratio |
| P/B | price-to-book ratio |
| FTS | full-text search |
| VADER | Valence Aware Dictionary and sEntiment Reasoner |
| ADASYN | adaptive synthetic sampling |
| SMOTE | synthetic minority over-sampling technique |
References
- Financial Terms Dictionary. Investopedia. Available online: https://www.investopedia.com/financial-term-dictionary-4769738 (accessed on 30 November 2021).
- Fama, E.F. Random Walks in Stock Market Prices. Financ. Anal. J. 1965, 21, 55–59. [Google Scholar] [CrossRef]
- Fama, E.F. Efficient Capital Markets: A Review of Theory and Empirical Work. J. Financ. 1970, 25, 383–417. [Google Scholar] [CrossRef]
- Twitter, Inc. Available online: https://twitter.com/ (accessed on 30 November 2021).
- StockTwits, Inc. Available online: https://stocktwits.com/ (accessed on 30 November 2021).
- Wang, G.; Wang, T.; Wang, B.; Sambasivan, D.; Zhang, Z.; Zheng, H.; Zhao, B.Y. Crowds on Wall Street: Extracting value from collaborative investing platforms. In Proceedings of the 18th ACM Conference on Computer Supported Cooperative Work & Social Computing, Vancouver, BC, Canada, 14–18 March 2015; pp. 17–30. [Google Scholar]
- Sohangir, S.; Petty, N.; Wang, D. Financial sentiment lexicon analysis. In Proceedings of the IEEE 12th IEEE International Conference on Semantic Computing (ICSC), Laguna Hills, CA, USA, 12 April 2018; pp. 286–289. [Google Scholar]
- Sohangir, S.; Wang, D.; Pomeranets, A.; Khoshgoftaar, T.M. Big data: Deep learning for financial sentiment analysis. J. Big Data 2018, 5, 3. [Google Scholar] [CrossRef]
- Zhang, L.; Wang, S.; Liu, B. Deep learning for sentiment analysis: A survey. Wiley Interdiscip. Rev. Data Min. Knowl. Discov. 2018, 8, e1253. [Google Scholar] [CrossRef]
- Zhao, L.; Li, L.; Zheng, X. A BERT Based Sentiment Analysis and Key Entity Detection Approach for Online Financial Texts. arXiv 2020, arXiv:2001.05326. [Google Scholar] [CrossRef]
- Cui, X.; Lam, D.; Verma, A. Embedded Value in Bloomberg News and Social Sentiment Data; Bloomberg, Technical Report. 2016. Available online: https://developer.twitter.com/content/dam/developer-twitter/pdfs-and-files/Bloomberg-Twitter-Data-Research-Report.pdf (accessed on 30 November 2021).
- Tetlock, T.C. Giving Content to Investor Sentiment: The Role of Media in the Stock Market. J. Financ. 2007, 62, 1139–1168. [Google Scholar] [CrossRef]
- Tetlock, P.C.; Saar-Tsechansky, M.; Macskassy, S. More Than Words: Quantifying Language to Measure Firms’ Fundamentals. J. Financ. 2008, 63, 1437–1467. [Google Scholar] [CrossRef]
- Delgadillo, J.; Kinyua, J.D.; Mutigwe, C. A BERT-based Model for Financial Social Media Sentiment Analysis. In Proceedings of the International Conference on Applications of Sentiment Analysis (ICASA 2022), Cairo, Egypt, 15–16 December 2022. [Google Scholar]
- Zimbra, D.; Abbasi, A.; Zeng, D.; Chen, H. The State-of-the-Art in Twitter Sentiment Analysis: A Review and Benchmark Evaluation. ACM Trans. Manag. Inf. Syst. 2018, 9, 1–29. [Google Scholar] [CrossRef]
- Sun, C.; Shrivastava, A.; Singh, S.; Gupta, A. Revisiting Unreasonable Effectiveness of Data in Deep Learning Era. In Proceedings of the 2017 IEEE International Conference on Computer Vision, Venice, Italy, 22–29 October 2017; pp. 843–852. [Google Scholar]
- Devlin, J.; Chang, M.-W.; Lee, K.; Toutanova, K. BERT: Pretraining of Deep Bidirectional Transformers for Language Understanding. In Proceedings of the 2019 Conference of the North American Chapter of the Association for Computational Linguistics: Human Language Technologies, Minneapolis, MN, USA, 2–7 June 2019; Volume 1 (Long and Short Papers), pp. 4171–4186. [Google Scholar]
- Howard, J.; Ruder, S. Universal Language Model Fine-tuning for Text Classification. In Proceedings of the 56th Annual Meeting of the Association for Computational Linguistics, Melbourne, Australia, 15–20 July 2018; Volume 1: Long Papers, pp. 328–339. [Google Scholar]
- Peters, M.E.; Neumann, M.; Iyyer, M.; Gardner, M.; Clark, C.; Lee, K.; Zettlemoyer, L. Deep Contextualized Word Representations. In Proceedings of the 2018 Conference of the North American Chapter of the Association for Computational Linguistics: Human Language Technologies, New Orleans, LA, USA, 1–6 June 2018; Volume 1 (Long Papers), pp. 2227–2237. [Google Scholar]
- Radford, A.; Wu, J.; Child, R.; Luan, D.; Amodei, D.; Sutskever, I. Language models are unsupervised multitask learners. OpenAI Blog 2019, 1, 8. [Google Scholar]
- Beltagy, I.; Lo, K.; Cohan, A. SciBERT: A Pretrained Language Model for Scientific Text. In Proceedings of the 2019 Conference on Empirical Methods in Natural Language Processing and the 9th International Joint Conference on Natural Language Processing (EMNLP-IJCNLP), Hong Kong, China, 3–7 November 2019; pp. 3615–3620. [Google Scholar]
- Lee, J.; Yoon, W.; Kim, S.; Kim, D.; Kim, S.; So, C.H.; Kang, J. BioBERT: A pretrained biomedical language representation model for biomedical text mining. Bioinformatics 2019, 36, 1234–1240. [Google Scholar] [CrossRef] [PubMed]
- Huang, K.; Altosaar, J.; Ranganath, R. ClinicalBERT: Modeling clinical notes and predicting hospital readmission. arXiv 2019, arXiv:1904.05342. [Google Scholar]
- Agaian, S.; Kolm, P. Financial sentiment analysis using machine learning techniques. Int. J. Invest. Manag. Financ. Innov. 2017, 3, 1–9. [Google Scholar]
- Man, X.; Luo, T.; Lin, J. Financial Sentiment Analysis (FSA): A Survey. In Proceedings of the IEEE International Conference on Industrial Cyber Physical Systems (ICPS), Taipei, Taiwan, 6–9 May 2019; pp. 617–622. [Google Scholar]
- Yang, S.; Rosenfeld, J.; Makutonin, J. Financial aspect-based sentiment analysis using deep representations. arXiv 2018, arXiv:1808.07931. Available online: http://arxiv.org/abs/1808.07931 (accessed on 30 November 2021).
- Liu, Y.; Ott, M.; Goyal, N.; Du, J.; Joshi, M.; Chen, D.; Levy, O.; Lewis, M.; Zettlemoyer, L.; Stoyanov, V. RoBERTa: A Robustly Optimized BERT Pretraining Approach. arXiv 2019, arXiv:1907.11692. Available online: http://arxiv.org/abs/1907.11692 (accessed on 30 November 2021).
- Araci, D. FinBERT: Financial Sentiment Analysis with Pretrained Language Models. arXiv 2019, arXiv:1908.10063. Available online: http://arxiv.org/abs/1908.10063 (accessed on 30 November 2021).
- Araci, D.T.; Zulkuf Genc, Z.; FinBERT: Financial Sentiment Analysis with BERT. Prosus AI Tech Blog. 2020. Available online: https://medium.com/prosus-ai-tech-blog/finbert-financial-sentiment-analysis-with-bert-b277a3607101 (accessed on 1 July 2022).
- Reuters Corpora (RCV1, RCV2, TRC2). National Institute of Standards and Technology. 2004. Available online: https://trec.nist.gov/data/reuters/reuters.html (accessed on 6 April 2023).
- Malo, P.; Sinha, A.; Korhonen, P.; Wallenius, J.; Takala, P. Good debt or bad debt: Detecting semantic orientations in economic texts. J. Assoc. Inf. Sci. Technol. 2014, 65, 782–796. [Google Scholar] [CrossRef]
- Desola, V.; Hanna, K.; Nonis, P. FinBERT: Pretrained Model on SEC Filings for Financial Natural Language Tasks; Technical Report; University of California: Los Angeles, CA, USA, 2019. [Google Scholar]
- Liu, Z.; Huang, D.; Huang, K.; Li, Z.; Zhao, J. FinBERT: A Pretrained Financial Language Representation Model for Financial Text Mining. In Proceedings of the Twenty-Ninth International Joint Conference on Artificial Intelligence (IJCAI-20), Virtual, 7–15 January 2021; pp. 4513–4519. [Google Scholar]
- Common Crawl. Available online: https://commoncrawl.org/ (accessed on 30 November 2021).
- FinancialWeb. Available online: https://www.finweb.com/ (accessed on 30 November 2021).
- Yahoo! Finance. Available online: https://finance.yahoo.com/ (accessed on 30 November 2021).
- Reddit. Available online: https://www.reddit.com/ (accessed on 30 November 2021).
- Financial Opinion Mining and Question Answering. 2017. Available online: https://sites.google.com/view/fiqa/ (accessed on 30 November 2021).
- The First Workshop on Financial Technology and Natural Language Processing (FinNLP) with a Shared Task for Sentence Boundary Detection in PDF Noisy Text in the Financial Domain (FinSBD). [n. d.]. Available online: https://sites.google.com/nlg.csie.ntu.edu.tw/finnlp/ (accessed on 30 November 2021).
- Yang, Y.; UY, M.C.S.; Huang, A. FinBERT: A Pretrained Language Model for Financial Communications. arXiv 2020, arXiv:2006.08097. Available online: https://arxiv.org/abs/2006.08097 (accessed on 30 November 2021).
- Huang, A.H.; Zang, A.Y.; Zheng, R. Evidence on the Information Content of Text in Analyst Reports. Account. Rev. 2014, 89, 2151–2180. [Google Scholar] [CrossRef]
- Wilksch, M.; Abramova, O. PyFin-sentiment: Towards a machine-learning-based model for deriving sentiment from financial tweets. Int. J. Inf. Manag. Data Insights 2023, 3, 100171. [Google Scholar] [CrossRef]
- Hutto, C.; Gilbert, E. VADER: A Parsimonious Rule Based Model for Sentiment Analysis of Social Media Text. In Proceedings of the International AAAI Conference on Web and Social Media, Ann Arbor, MI, USA, 1–4 June 2014; pp. 216–225. [Google Scholar]
- Chen, C.-C.; Huang, H.-H.; Chen, H.-H. NTUSD-Fin: A market sentiment dictionary for financial social media data applications. In Proceedings of the 1st Financial Narrative Processing Workshop (FNP 2018), Miyazaki, Japan, 7–12 May 2018; pp. 37–43. [Google Scholar]
- Yang, Z.; Dai, Z.; Yang, Y.; Carbonell, J.; Salakhutdinov, R.; Lee, Q.V. XLNet: Generalized Autoregressive Pretraining for Language Understanding. In Proceedings of the 33rd International Conference on Neural Information Processing Systems (NeurIPS 2019), Vancouver, BC, Canada, 8–14 December 2019; pp. 5753–5763. [Google Scholar]
- Lan, Z.; Chen, M.; Goodman, S.; Gimpel, K.; Sharma, P.; Soricut, R. ALBERT: A Lite BERT for Self-Supervised Learning of Language Representations. arXiv 2019, arXiv:1909.11942. Available online: http://arxiv.org/abs/1909.11942 (accessed on 30 November 2021).
- Sanh, V.; Debut, L.; Chaumond, J.; Wolf, T. DistilBERT, a Distilled Version of BERT: Smaller, Faster, Cheaper and Lighter. arXiv 2019, arXiv:1910.01108. Available online: http://arxiv.org/abs/1910.01108 (accessed on 30 November 2021).
- Lewis, M.; Liu, Y.; Goyal, N.; Ghazvininejad, M.; Mohamed, A.; Levy, O.; Stoyanov, V.; Zettlemoyer, L. BART: Denoising Sequence-to-Sequence Pretraining for Natural Language Generation, Translation, and Comprehension. arXiv 2019, arXiv:1910.13461. Available online: http://arxiv.org/abs/1910.13461 (accessed on 30 November 2021).
- Mishev, K.; Gjorgjevikj, A.; Vodenska, I.; Chitkushev, L.T.; Trajanov, D. Evaluation of Sentiment Analysis in Finance: From Lexicons to Transformers. IEEE Access 2020, 8, 131662–131682. [Google Scholar] [CrossRef]
- Bartunov, O.; Sigaev, T. Full-Text Search in PostgreSQL—Gentle Introduction; Technical Report; Moscow University: Moscow, Russia, 2007. [Google Scholar]
- Gaillat, T.; Zarrouk, M.; Freitas, A.; Davis, B. The SSIX Corpora: Three Gold Standard Corpora for Sentiment Analysis in English, Spanish and German Financial Microblogs. In Proceedings of the Eleventh International Conference on Language Resources and Evaluation (LREC 2018), Miyazaki, Japan, 7–12 May 2018; pp. 2671–2675. [Google Scholar]
- Chen, C.-C.; Huang, H.-H.; Chen, H.-H. Issues and Perspectives from 10,000 Annotated Financial Social Media Data. In Proceedings of the 12th Language Resources and Evaluation Conference, Marseille, France, 11–16 May 2020; pp. 6106–6110. [Google Scholar]
- SemEval-2017 Task 5: Fine-Grained Sentiment Analysis on Financial Microblogs and News. Available online: https://alt.qcri.org/semeval2017/task5/ (accessed on 30 November 2021).
- Daudert, T. A Multi-Source Entity-Level Sentiment Corpus for the Financial Domain: The Fin-Lin Corpus. arXiv 2020, arXiv:2003.04073. Available online: http://arxiv.org/abs/2003.04073 (accessed on 30 November 2021). [CrossRef] [PubMed]
- Saif, H.; Fernández, M.; He, Y.; Alani, H. Evaluation datasets for Twitter sentiment analysis: A survey and a new dataset, the STS-Gold. In Proceedings of the 1st International Workshop on Emotion and Sentiment in Social and Expressive Media: Approaches and Perspectives from AI (ESSEM 2013), Turin, Italy, 3 December 2013. [Google Scholar]
- Taborda, B.; de Almeida, A.; Dias, J.C.; Batista, F.; Ribeiro, R. Stock Market Tweets Data. IEEE Dataport 2021. [Google Scholar] [CrossRef]
- Balaji, P.; Nagaraju, O.; Haritha, D. Levels of Sentiment Analysis and its Challenges: A Literature Review. In Proceedings of the International Conference of Big Data Analytics and Computational Intelligence (ICBDAC), Chirala, India, 23–25 March 2017; pp. 400–403. [Google Scholar]
- Chawla, N.V.; Bowyer, K.W.; Hall, L.O.; Kegelmeyer, W.P. SMOTE: Synthetic Minority Over-sampling Technique. J. Artif. Intell. Res. 2002, 16, 321–357. [Google Scholar] [CrossRef]
- He, H.; Bai, Y.; Garcia, E.A.; Li, S. ADASYN: Adaptive synthetic sampling approach for imbalance learning. In Proceedings of the 2008 IEEE International Conference on Neural Networks (IJCNN 2008), Hong Kong, China, 1–8 June 2008; pp. 1322–1328. [Google Scholar]
- Li, X.; Wang, X.; Liu, H. Research on fine-tuning strategy of sentiment analysis model based on BERT. In Proceedings of the 2021 IEEE 3rd International Conference on Communications, Information System and Computer Engineering (CISCE), Beijing, China, 14–16 May 2021; pp. 798–802. [Google Scholar]
- Popel, M.; Bojar, O. Training Tips for the Transformer Model. arXiv 2018, arXiv:1804.00247. Available online: https://arxiv.org/pdf/1804.00247.pdf (accessed on 25 June 2022). [CrossRef]
- Amazon Web Services. Amazon Comprehend: Features. Available online: https://aws.amazon.com/comprehend/features (accessed on 25 June 2022).
- Amazon Web Services. Amazon Comprehend Developer Guide. Available online: https://docs.aws.amazon.com/comprehend/latest/dg/comprehend-dg.pdf.how-sentiment (accessed on 25 June 2022).
- OpenAI, GPT-3.5 Turbo. Available online: https://platform.openai.com/docs/models/gpt-3-5-turbo (accessed on 15 March 2024).
- IBM Cloud API Docs: Natural Language Understanding. Available online: https://cloud.ibm.com/apidocs/natural-language-understanding?code=python (accessed on 25 June 2022).
- IBM. Watson Natural Language Understanding: Features. Available online: https://www.ibm.com/cloud/watson-natural-language-understanding/details (accessed on 25 June 2022).
- SentiStrength. Available online: http://sentistrength.wlv.ac.uk/ (accessed on 25 June 2022).
- Hoang, M.; Bihorac, O.A.; Rouces, J. Aspect-Based Sentiment Analysis using BERT. In Proceedings of the 22nd Nordic Conference on Computational Linguistics, Turku, Finland, 30 September–2 October 2019; pp. 187–196. Available online: https://aclanthology.org/W19-6120/ (accessed on 30 November 2021).
- Goertzel, B. Generative AI vs. AGI: The Cognitive Strengths and Weaknesses of Modern LLMs. 2023. Available online: https://arxiv.org/pdf/2309.10371.pdf (accessed on 25 June 2022).
- Rahutomo, F.; Kitasuka, T.; Aritsugi, M. Semantic Cosine Similarity. In Proceedings of the 7th International Student Conference on Advanced Science and Technology, Seoul, Republic of Korea, 29–30 October 2012; Available online: https://www.researchgate.net/publication/262525676_Semantic_Cosine_Similarity (accessed on 30 November 2021).
- Nora Raju, T.; Rahana, P.A.; Moncy, R.; Ajay, S.; Nambiar, S.K. Sentence Similarity—A State of Art Approaches. In Proceedings of the International Conference on Computing, Communication, Security and Intelligent Systems (IC3SIS), Kochi, India, 23–25 June 2022; pp. 1–6. [Google Scholar]
Disclaimer/Publisher’s Note: The statements, opinions and data contained in all publications are solely those of the individual author(s) and contributor(s) and not of MDPI and/or the editor(s). MDPI and/or the editor(s) disclaim responsibility for any injury to people or property resulting from any ideas, methods, instructions or products referred to in the content. |
© 2024 by the authors. Licensee MDPI, Basel, Switzerland. This article is an open access article distributed under the terms and conditions of the Creative Commons Attribution (CC BY) license (https://creativecommons.org/licenses/by/4.0/).