Article

Data-Driven Short-Term Load Forecasting for Multiple Locations: An Integrated Approach

1
College of Science and Engineering, Central Michigan University, Mount Pleasant, MI 48858, USA
2
Department of Robotics and Mechatronics Engineering, University of Dhaka, Dhaka 1000, Bangladesh
3
Department of Computer Science and Engineering, Institute of Science and Technology, Dhaka 1209, Bangladesh
4
Department of Electrical and Computer Engineering, University of Alaska Fairbanks, Fairbanks, AK 99775, USA
*
Author to whom correspondence should be addressed.
Big Data Cogn. Comput. 2024, 8(2), 12; https://doi.org/10.3390/bdcc8020012
Submission received: 25 October 2023 / Revised: 21 January 2024 / Accepted: 23 January 2024 / Published: 26 January 2024

Abstract

:
Short-term load forecasting (STLF) plays a crucial role in the planning, management, and stability of a country’s power system operation. In this study, we have developed a novel approach that can simultaneously predict the load demand of different regions in Bangladesh. When making predictions for loads from multiple locations simultaneously, the overall accuracy of the forecast can be improved by incorporating features from the various areas while reducing the complexity of using multiple models. Accurate and timely load predictions for specific regions with distinct demographics and economic characteristics can assist transmission and distribution companies in properly allocating their resources. Bangladesh, being a relatively small country, is divided into nine distinct power zones for electricity transmission across the nation. In this study, we have proposed a hybrid model, combining the Convolutional Neural Network (CNN) and Gated Recurrent Unit (GRU), designed to forecast load demand seven days ahead for each of the nine power zones simultaneously. For our study, nine years of data from a historical electricity demand dataset (from January 2014 to April 2023) are collected from the Power Grid Company of Bangladesh (PGCB) website. Considering the nonstationary characteristics of the dataset, the Interquartile Range (IQR) method and load averaging are employed to deal effectively with the outliers. Then, for more granularity, this data set has been augmented with interpolation at every 1 h interval. The proposed CNN-GRU model, trained on this augmented and refined dataset, is evaluated against established algorithms in the literature, including Long Short-Term Memory Networks (LSTM), GRU, CNN-LSTM, CNN-GRU, and Transformer-based algorithms. Compared to other approaches, the proposed technique demonstrated superior forecasting accuracy in terms of mean absolute performance error (MAPE) and root mean squared error (RMSE). The dataset and the source code are openly accessible to motivate further research.

1. Introduction

The significant growth of the population, economic activities, and living standards has led to an increase in electricity demand, creating the need for greater electricity production [1]. Load forecasting (LF) is a critical component of power system management due to the unpredictable and inconsistent nature of load demand [2]. LF aims to predict future load demands based on current and historical data [3]. LF is commonly classified into three distinct types. The initial category, short-term load forecasting (STLF), involves predicting energy demand within a timeframe spanning from a few hours to several days [4,5]. The second category, known as midterm load forecasting, anticipates energy demand from one week to several months and occasionally extends to a year [6]. Long-term load forecasting focuses on predicting energy consumption over a timeframe exceeding a year [7]. While short- and mid-term forecasting are instrumental for efficient system operation management, long-term electricity demand forecasting facilitates the development of power system infrastructure [8]. Accurate load forecasting enables more effective planning for constructing distribution and transmission networks, leading to substantial reductions in investment costs [9]. The power grid system is becoming more complex and unstable due to the penetration of distributed renewable energy sources (DRES). Addressing this challenge necessitates dynamic operation and control. STLF plays a pivotal role in the context of advanced power grid systems. Leveraging the vast amount of data generated by smart grid infrastructure allows for the precise estimation of energy demand, contributing to enhanced management of energy distribution, economy, and security. Furthermore, STLF also aids in the balancing of energy supply and demand, helping grid operators avert issues such as system imbalances and power outages.
First-generation LF algorithms encompass statistical and machine learning (ML) methods such as regression, wavelet transform (WT), support vector machine (SVM), Random Forest (RF), autoregressive-moving average (ARMA), autoregressive-integrated moving average (ARIMA), among others [10]. In a study [11] for the Greek Electric Network Grid, the authors proposed an STLF model utilizing SVM, ensemble XGBoost, RF, k-nearest neighbours (KNN), neural networks (NN), and decision trees (DT) based on historical meteorological parameters. This model demonstrated a 4.74% decrease in prediction error compared to industry predictions in Greece, using mean absolute percentage error (MAPE) as a performance metric. The study by Srivastava et al. [12] aims to improve accuracy in short-term load forecasting (STLF) for the Australian electricity market. It proposes a novel hybrid feature selection (HFS) algorithm that combines an elitist genetic algorithm (EGA) with a random forest method to select the most relevant features, and then uses the M5P forecaster for prediction. The study found that HFS-selected features consistently outperformed those with larger feature sets and M5P forecaster with HFS was more accurate compared to other Bagging approaches. Phyo et al. [13] introduced an advanced ML-based bagging ensemble model that integrates linear regression (LR) and support vector regression (SVR). Their training utilized a two-year dataset from five distinct regions. In contrast to our approach, they focused on predicting the net load demand for these regions. The ensemble model they proposed exhibited performance closely aligned with baseline DL methods. The study underscored that temperature might not consistently serve as a reliable feature for load prediction, as their findings indicated that incorporating temperature did not contribute to increased accuracy. Another study by Yao et al. [14] employed the maximal information coefficient (MIC) to screen and select feature sets, including climate and delayed load data, for load prediction using LightGBM and XGBoost models. The proposed MOEC-LGB-XGb model outperformed RF, ARIMA, and SVR models on two years of historical demand dataset from Northwest China. ML models exhibit superior performance with linear data but face challenges with highly non-linear datasets, such as real-world power system demand data. To address non-linearities, Ribeiro et al. [15] separated trend, seasonality, and residual components using locally weighted regression and applied variational mode decomposition (VMD) to the residual data. They employed an ensemble of ML algorithms to optimize XGBoost model hyperparameters. In a comparative study by Tarmanini et al. [10], load forecasting was performed using both ARIMA and artificial neural network (ANN). The ANN method demonstrated lower error (MAPE) and a regression factor (R) closer to 1, indicating superior performance compared to ARIMA. Ibrahim et al. [16] utilized various ML and deep learning (DL) algorithms, including XGBoost, AdaBoost, SVR, and ANN, for 24 h ahead predictions, with ANN exhibiting superior performance in terms of MAPE, RMSE, and  R 2 , despite longer training times and higher computational expenses for DL algorithms.
Although the first-generation methods were successful in the past, researchers continue to utilize them for feature extraction purposes [17,18]. In recent years, ANN-based models have been widely adopted, primarily due to their proficiency in processing non-linear data. Recurrent neural network (RNN) and convolutional neural network (CNN) have proven particularly effective in handling time series data. Notably, RNN, unlike traditional ANN, possesses the capability to remember and manage temporal sequences. The use of attention-based RNN for electrical load prediction, as discussed in [19], is noteworthy; however, the model’s precision diminishes with an extended prediction interval. The development of a long short-term memory (LSTM) model, which permits the network to maintain long-term dependencies, has resolved the vanishing gradient problem in RNN [20]. The study in [21] introduces an LSTM-based model for STLF, using both single and multi-step predictions. However, an increase in the size of the look-back window results in decreased prediction accuracy. Another alternative for time series forecasting is the Gated Recurrent Unit network (GRU), which exhibits shorter execution times than LSTM by consolidating forget and input gates into a single update gate [22]. In [23], Ijaz et al. propose an ANN-LSTM model for predicting hour-ahead load demand, where the ANN functions as a temporal feature extractor. The proposed model, evaluated against CNN-LSTM, outperforms the latter. The dataset comprises two years of hourly demand data for a city region, considering various features such as temperature, humidity, and holidays. Wang et al. in [17] suggested using variational mode decomposition (VMD), empirical mode decomposition (EMD), and empirical wavelet transform (EWT) to convert time-domain demand data into the frequency domain. The processed data are then passed to a Bi-LSTM layer before signal reconstruction at the output. However, this method comes with a more extended training period due to extensive preprocessing and challenges in optimizing hyperparameters. In their study, Abumohsen et al. [24] employed RNN, LSTM, and GRU models to conduct STLF using a real-world power system dataset from Palestine. The electrical load dataset was collected from SCADA at one-minute intervals over the course of a year. The research highlighted the superior performance of the GRU model compared to other RNN variants. It also illustrated that datasets with fewer intervals resulted in higher accuracy.
CNN, on the other hand, can learn spatial pattern hierarchies that are translation-invariant. The time series models alone cannot effectively handle various types of high-dimensional data in the power system, including spatiotemporal matrices and image information. Still, the CNN is considered the optimal choice for processing such high-dimensional data [25]. In a study by Amarasinghe et al. [26], the effectiveness of CNNs for load forecasting in individual buildings was explored, yielding outcomes comparable to LSTM. While CNNs are proficient in extracting spatial information, they are less effective at capturing temporal information. In contrast, RNNs specialize in learning temporal patterns. Recognizing the strengths of both architectures, researchers have introduced hybrid approaches combining CNNs and RNNs to enhance Short-Term Load Forecasting (STLF) accuracy [27,28]. To predict the performance of a smart grid system located in Saudi, different hybrid DL models were used in [29], with CNN-GRU achieving the highest forecasting accuracy. Haque et al. [27] used 1D CNN as a preprocessing step before LSTM to predict week-ahead load data, demonstrating the efficiency of CNN as a feature extractor for sequence learning. This hybrid model outperformed the LSTM and GRU models when they are used directly. Sekhar et al. [30] utilized a combination of bidirectional LSTM and CNN to forecast short-term building energy demand. They employed Grey Wolf Optimization (GWO) to optimize the parameters for their proposed method. The research revealed that their approach demonstrated superior performance compared to unidirectional LSTM, CNN, and the CNN-LSTM hybrid method. However, the study did not investigate the impact of additional features, such as temperature and weekday, on the predictive performance. Similarly, in [7], the combination of genetic algorithm (GA) and bidirectional gated recurrent unit (Bi-GRU) was proposed for STLF in Bangladesh, outperforming other techniques with only a minimal decrease of 18.13% and 19.82% in RMSE and MAPE, respectively. Another hybrid method, proposed by Chen et al. [31], combines Residual Neural Network (ResNet) and LSTM to accurately forecast short-term load for Queensland, Australia. However, the proposed model architecture is more computationally expensive and requires a larger training and inference period.
Despite the success of mainstream algorithms like CNNs and RNNs, they face challenges in completely overcoming gradient vanishing limitations, making it difficult to capture very long-term dependencies. Transformer-based algorithms, initially developed for machine translations, are gaining prominence as state-of-the-art solutions in sequence learning tasks. Qu et al. [32] proposed a day-ahead load forecasting method using Forwardformer, a Transformer architecture variant incorporating multi-scale forward self-attention (MSFSA). Their model, adopting an encoder–dual decoder architecture instead of the conventional encoder–decoder model, outperforms other transformers, Facebook Prophet, and sequence models [32]. In a hybrid architecture introduced by Ran et al. [18], Complete Ensemble Empirical Mode Decomposition with Adaptive Noise (CEEDMAN), sample entropy (SE), and Transformer are combined. The decomposition algorithm reduces the non-stationary components of the data, while SE minimizes the complexity of each decomposed element. This hybrid transformer architecture demonstrated excellent performance in predictions ranging from 4 to 24 h. Transfer learning has also recently gained a lot of interest in LF. Yuan et al. [33] presented a pre-trained model based on CNN-LSTM with attention to predicting buildings’ peak energy demand and total energy consumption. Comparisons with direct learning algorithms such as ANN, RF, and LSTM showed the proposed model to outperform them. However, due to the dependence of large-scale power systems on geographic and demographic information, utilizing a source domain dataset for the target domain proves challenging.
Table 1 provides a brief overview of recent studies in STLF along with their limitations. Most previous research on STLF has focused on predicting electricity demand at minute-long, hourly, or daily intervals. While this approach is advantageous for real-time scenarios with rapid fluctuations in demand, weekly forecasting presents certain benefits, including improved maintenance planning, enhanced system operation, and more effective resource management [1]. Moreover, after reviewing the existing literature, we have identified that the majority of the past studies focused on predicting load demand in particular regions. A study is yet to be done to forecast loads from different locations simultaneously that can cover a country’s total load demand. Bangladesh has an installed power capacity of 25 GW with a maximum demand of 21 GW. The country is divided into nine power zones—Barishal, Chattogram, Dhaka, Khulna, Rajshahi, Rangpur, Mymensingh, Cumilla, and Sylhet—each having unique demographic and economic characteristics, resulting in varying load demands. The National Load Dispatch Centre (NLDC) manages power distribution and generation throughout the country. However, they use traditional statistical methods to estimate load demand. The economic stakes of even minor STLF errors are high in developing nations, driving the need for further research. In this study, we propose a novel STLF method based on CNN-GRU to predict the week-ahead load demand of different power zones that cover the entire country simultaneously. Our system offers improved accuracy, enhanced reliability, effective resource allocation, better planning, and cost savings. Our proposal is also compared with other state-of-the-art techniques, including LSTM, GRU, CNN-LSTM, Transformer, CNN-Transformer, and LSTM-Transformer. Our contributions are as follows:
  • We have developed a novel STLF model based on CNN-GRU hybrid model that can simultaneously forecast the week-ahead load demand of nine different power zones of Bangladesh. The proposed model can be trained to make predictions for all of the locations at the same time instead of having to build separate models for each one, which can take a lot of time and computational power.
  • The performance of the proposed model is compared with six other DL approaches including three Transformer-based models.
  • We have prepared our historical demand dataset from the PGCB website and, based on these data, we have created our own interpolated data. The raw collected dataset along with the clean and interpolated demand data are made publicly available, which is missing in most research works (https://github.com/gcsarker/Multiple-Regions-STLF, accessed on 20 October 2023).
Table 1. Review and limitations of recent studies.
AuthorsObjectivesDatasetModel UsedLimitations
Ribeiro et al. [34]12 and 24 h ahead LFElectricity demand for five Australian regions in 2019 (not open)Ensemble ML
  • Lacking comparison of the proposed ensemble model with other state-of-the-art models
  • Different regions are forecasted separately
Yuan et al. [33]STLF based on transfer learning with attentionTwo years of load data from a large-scale shopping mallPretrained CNN-LSTM with attention
  • The proposed approach may not be applicable to large power systems
  • Limited dataset
Haque et al. [27]Weekly LF with hybrid DL modelPGCB electricity demand dataset from Mymensingh, Bangladesh (open)CNN-LSTM
  • No outlier and noise reduction method
Inteha et al. [7]Day-ahead LFPGCB total demand dataset of Bangladesh, not openGA-BiGRU
  • Bidirectional should not be appropriate
  • No noise and outlier detection method applied
Tarmanini et al. [10]Household STLFHourly demand dataset of 709 households in Ireland (not open)ARIMA, ANN
  • No comparison with state-of-the-art models
  • No outlier detection
  • Visualization and details of the dataset missing
Wang et al. [17]STLF based on wavelet transform and NNHousehold-level smart meter dataVMD, EMD, EWT, LSTM
  • Longer training and inference time.
  • Hyperparameter optimization is challenging.
Ran et al. [18]STLF based on CEEDMAN and TransformerNew York City demand dataset (open)CEEDMAN-SE-Transformer
  • High time complexity
Srivastava et al. [12]Day-ahead load forecastHalf-hourly dataset of New South Wales, Australia from Australian Energy Market Operator (AEMO)M5P + HFS (EGA and RF)
  • Lacking comparison with other state-of-the-art models
Chen et al. [31]STLF with weather paramater forecastingFour-year historical demand dataset from Queens, Australia (open)Resnet + LSTM
  • High computational cost
  • The models are considered as blackboxes (lacking explanation of why Resnet architecture performs better compared to CNN in the context of time series).
Abumohsen et al. [24]STLFOne-year minute-wise electrical load demand dataset from PalestineRNN, LSTM, GRU
  • The justification for the choices of the simulated models is missing
  • Relying on training and evaluating with data from just a single year may not adequately capture the increasing demand trend for future years
  • Lacks specification of the forecast horizon
ProposedWeek-ahead LF in multiple zones simultaneouslyPGCB daily load demand of Bangladesh (Open)CNN-GRU-

2. ML Models

2.1. GRU

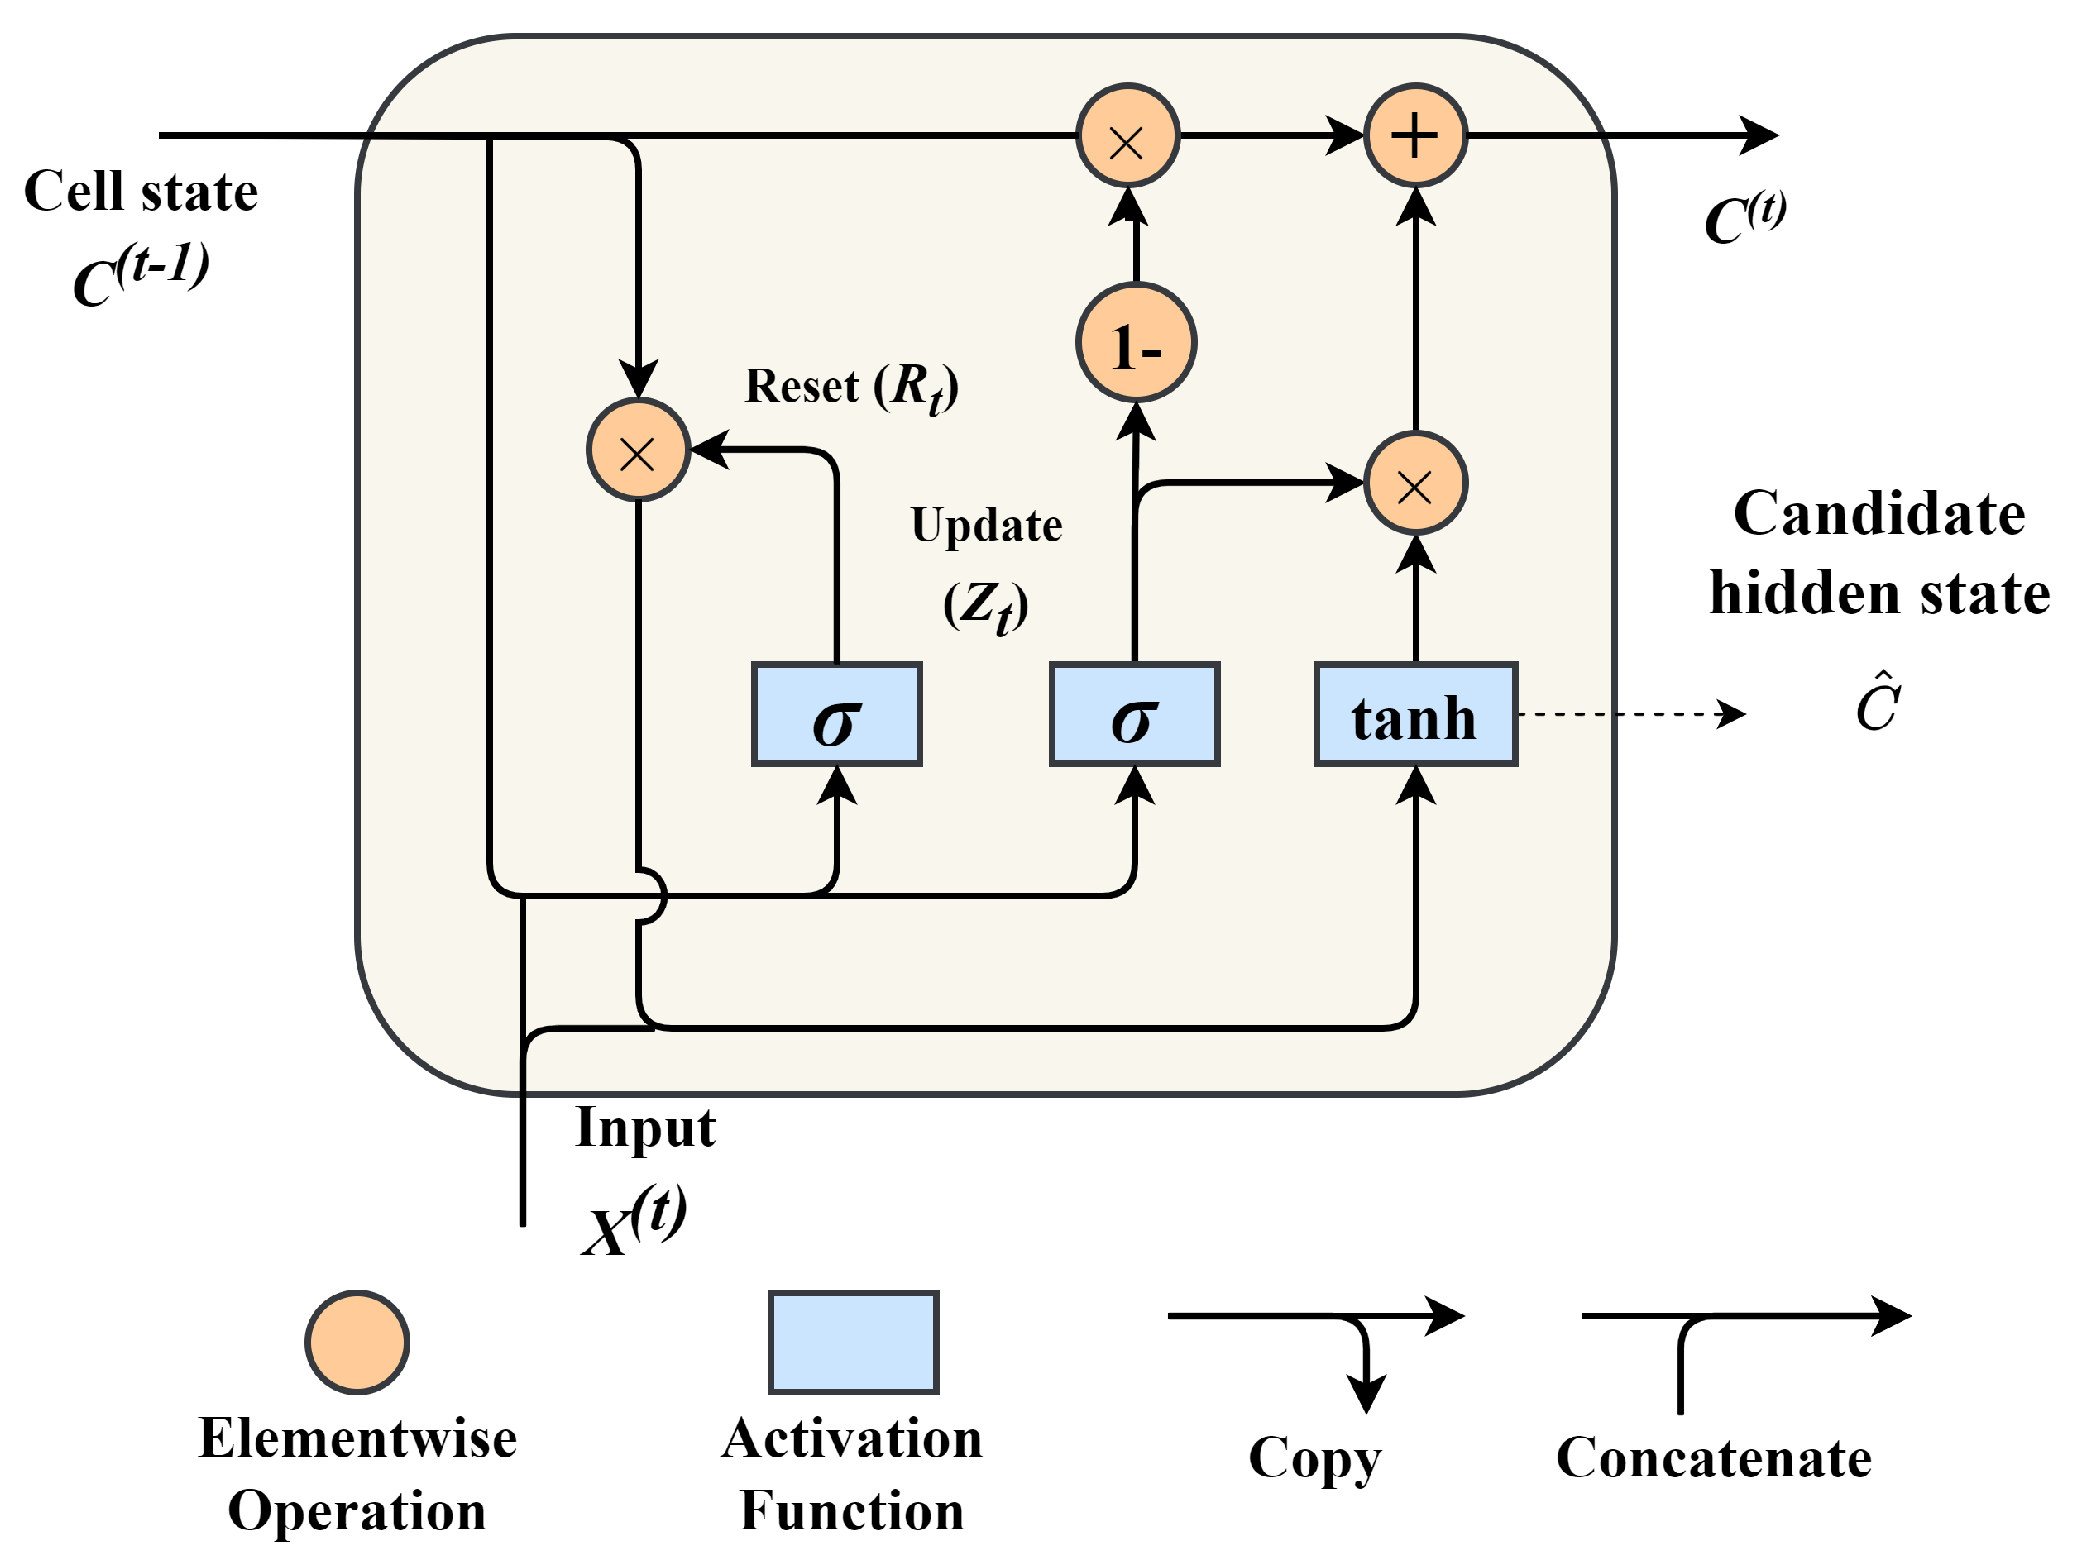
GRU is a modified version of Recurrent Neural Network (RNN). GRU has two gates: an update gate and a reset gate. There are no memory cells inside. Less operating time is required compared to other variants of RNN, such as LSTM, since the gating mechanism in GRU is more straightforward than in LSTM. The update gate establishes the proportion of prior state data that must be sent to the following step. Using this feature reduces the fundamental RNN’s vanishing gradient problem. The operations of a GRU cell are depicted by Equations (1)–(4) and a diagram of a GRU cell is shown in Figure 1. Table 2 provides a brief overview of each paramter presented in the equations. We derived the figure and equations from the study in [35].
Z t = σ ( W u [ C ( t 1 ) , x ( t ) ] + b u )
R t = σ ( W r [ C ( t 1 ) , x ( t ) ] + b r )
C ^ ( t ) = t a n h ( W c [ R t × C ( t 1 ) , x ( t ) ] + b c )
C ( t ) = ( 1 Z t ) × C ( t 1 ) + Z t × C ^ ( t )

2.2. CNN

Unlike conventional neural networks, convolutional deep neural networks can recognize the specific pattern inside an input sequence. The 1D CNN model’s input consists of n input sequences, each comprising multivariate features. A collection of 1D kernels, commonly called filters with fixed window sizes, is selected. The convolution process between the kernels and the input sequence creates the output features. Kernels with window sizes of k slide over the sequence in this procedure with fixed strides. These feature maps encode the response of a filter pattern at various points in the input sequence. Equation (5) illustrates the initial convolution operation close to the multivariate input sequence S if we consider the L convolutional layer [35].
C 1 , i = R e L U ( S w 1 , i + b 1 , i )
where C 1 , i is the output feature map of the first convolutional layer. The convolution operation is denoted by (*). w 1 , i represents the ith kernel and b 1 , i represents the bias term. The rectified linear unit (ReLU) is utilized to introduce non-linearity. So, the  ith feature space of the Jth convolutional layer C J , i can be written as
C J , i = R e L U ( C J 1 , i w J , i + b J , i )
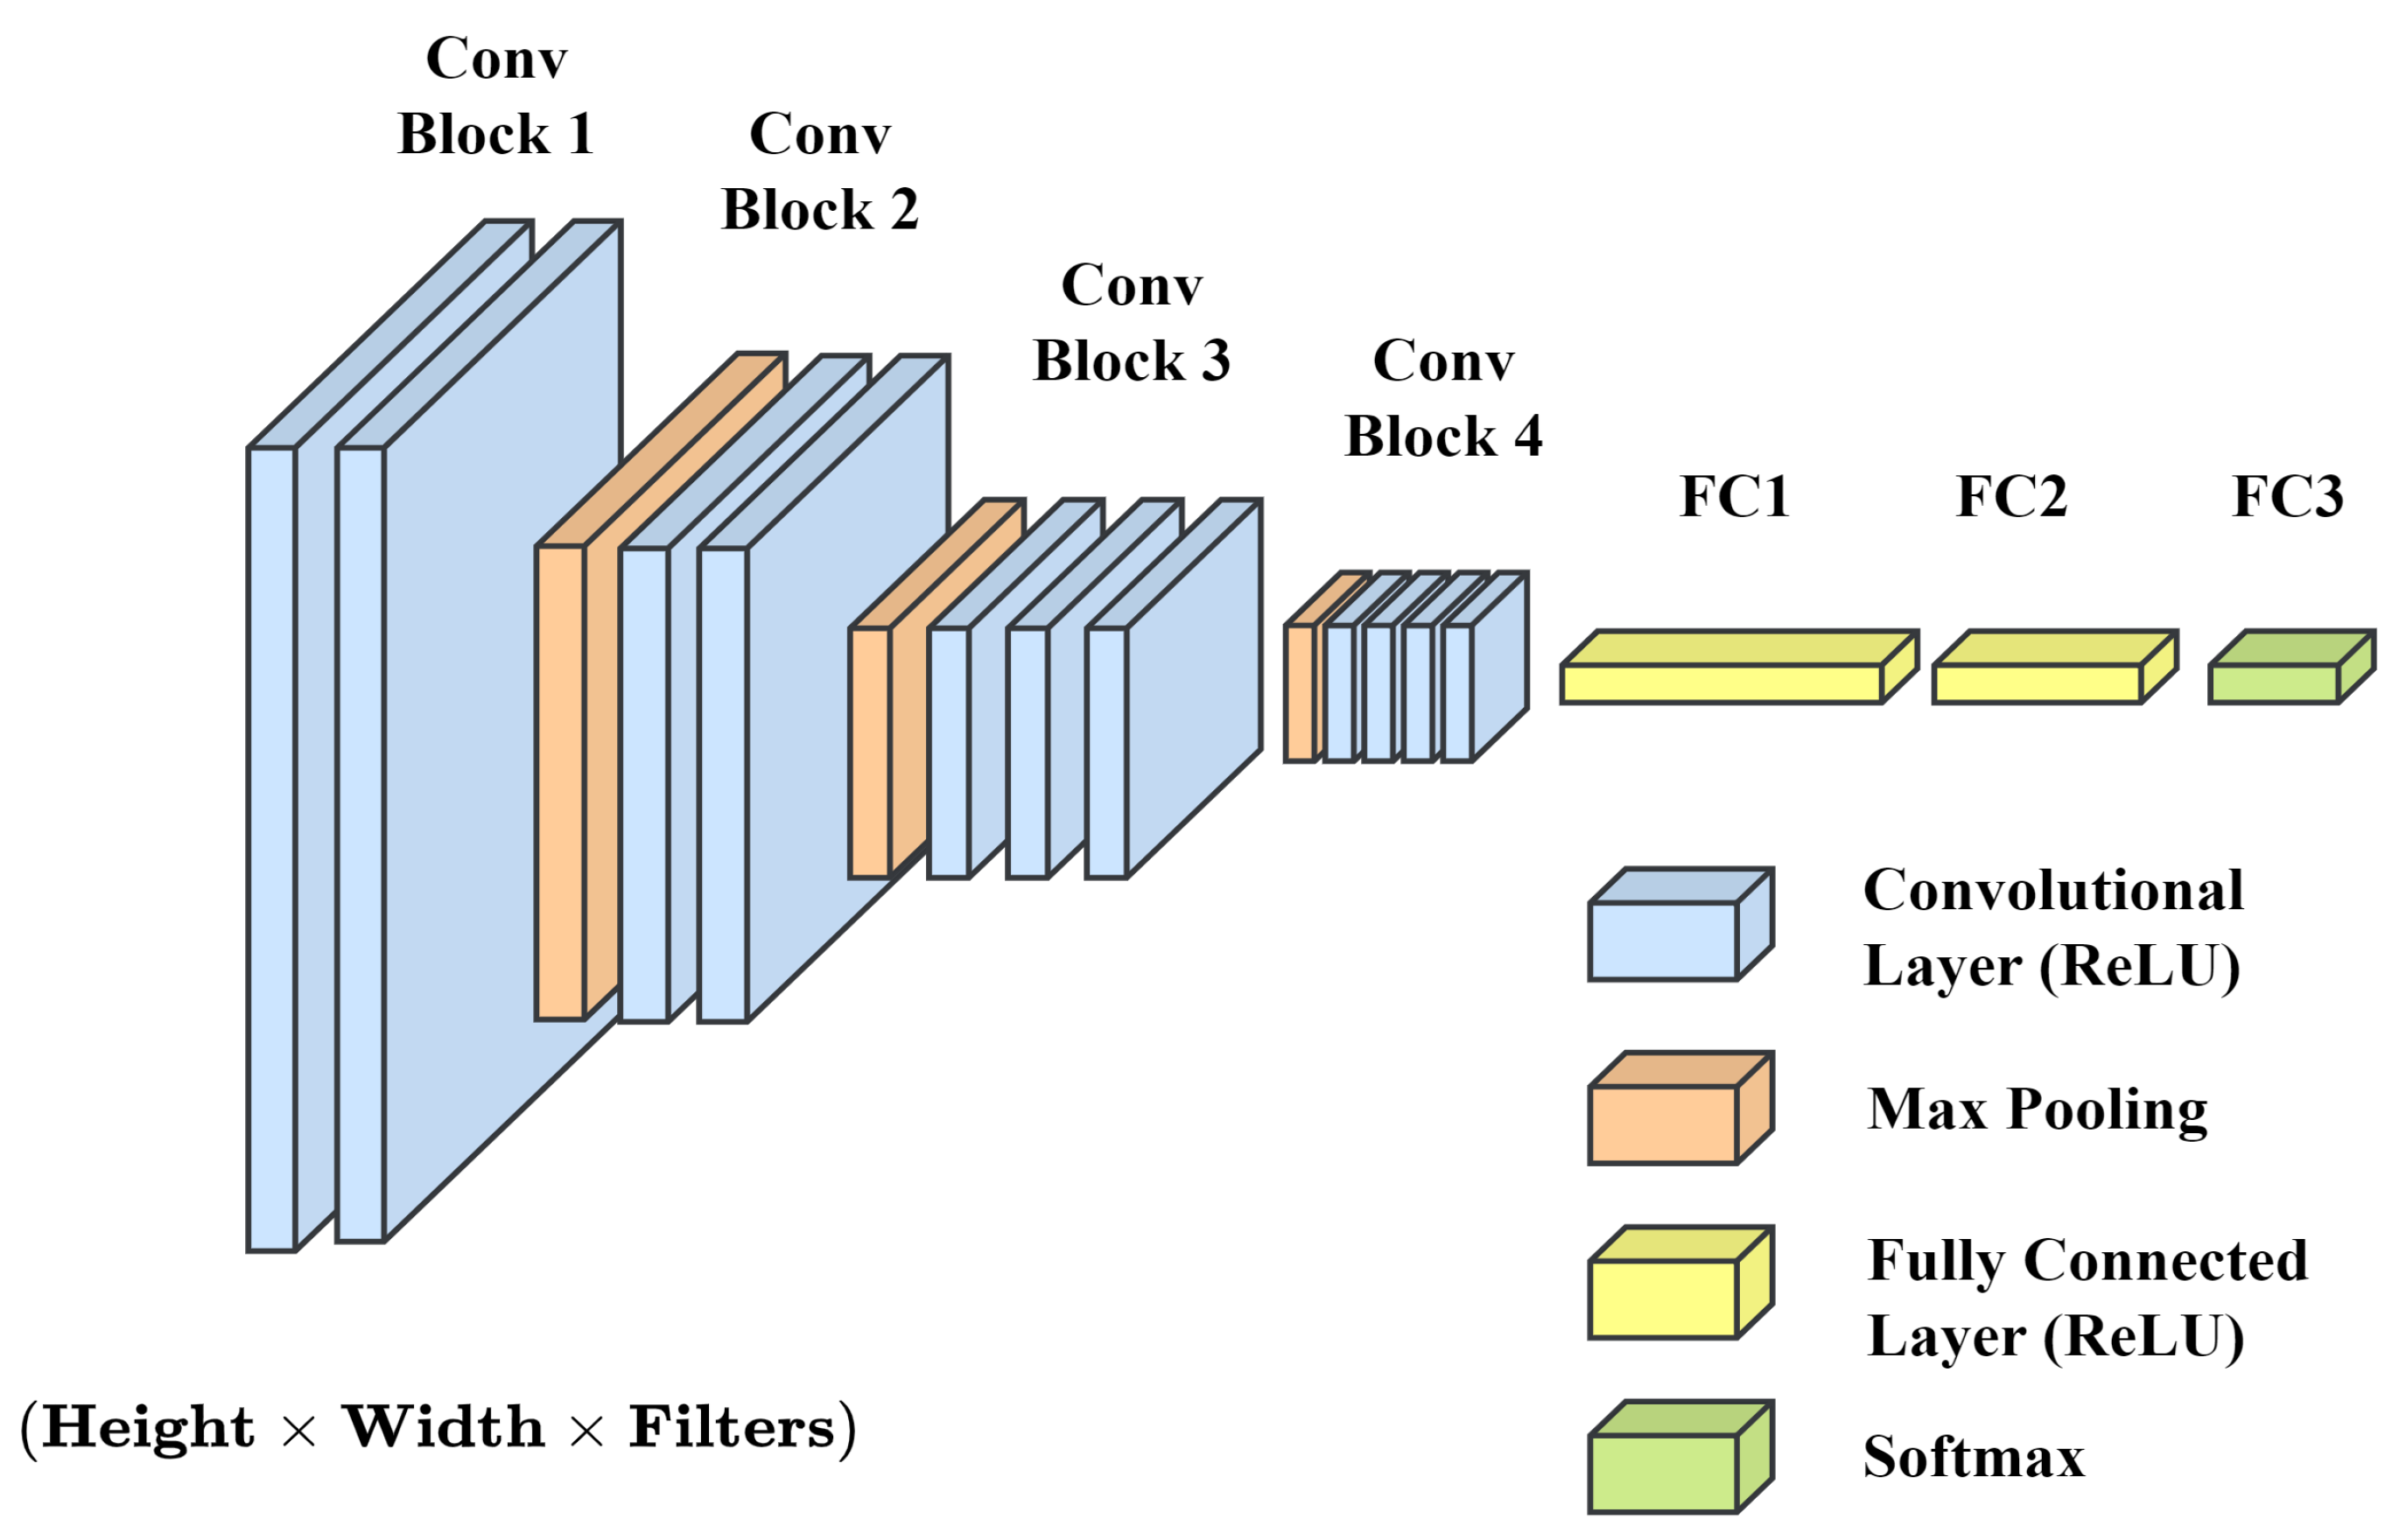
We require the earlier feature maps and kernels to create the feature map of the Jth convolutional layer. The pooling procedure is used to reduce the dimensionality of the input and, at the same time, make the computation efficient. Max pooling includes finding the maximum value using sliding windows over the feature maps. A CNN structure is shown in Figure 2.

3. Methodology

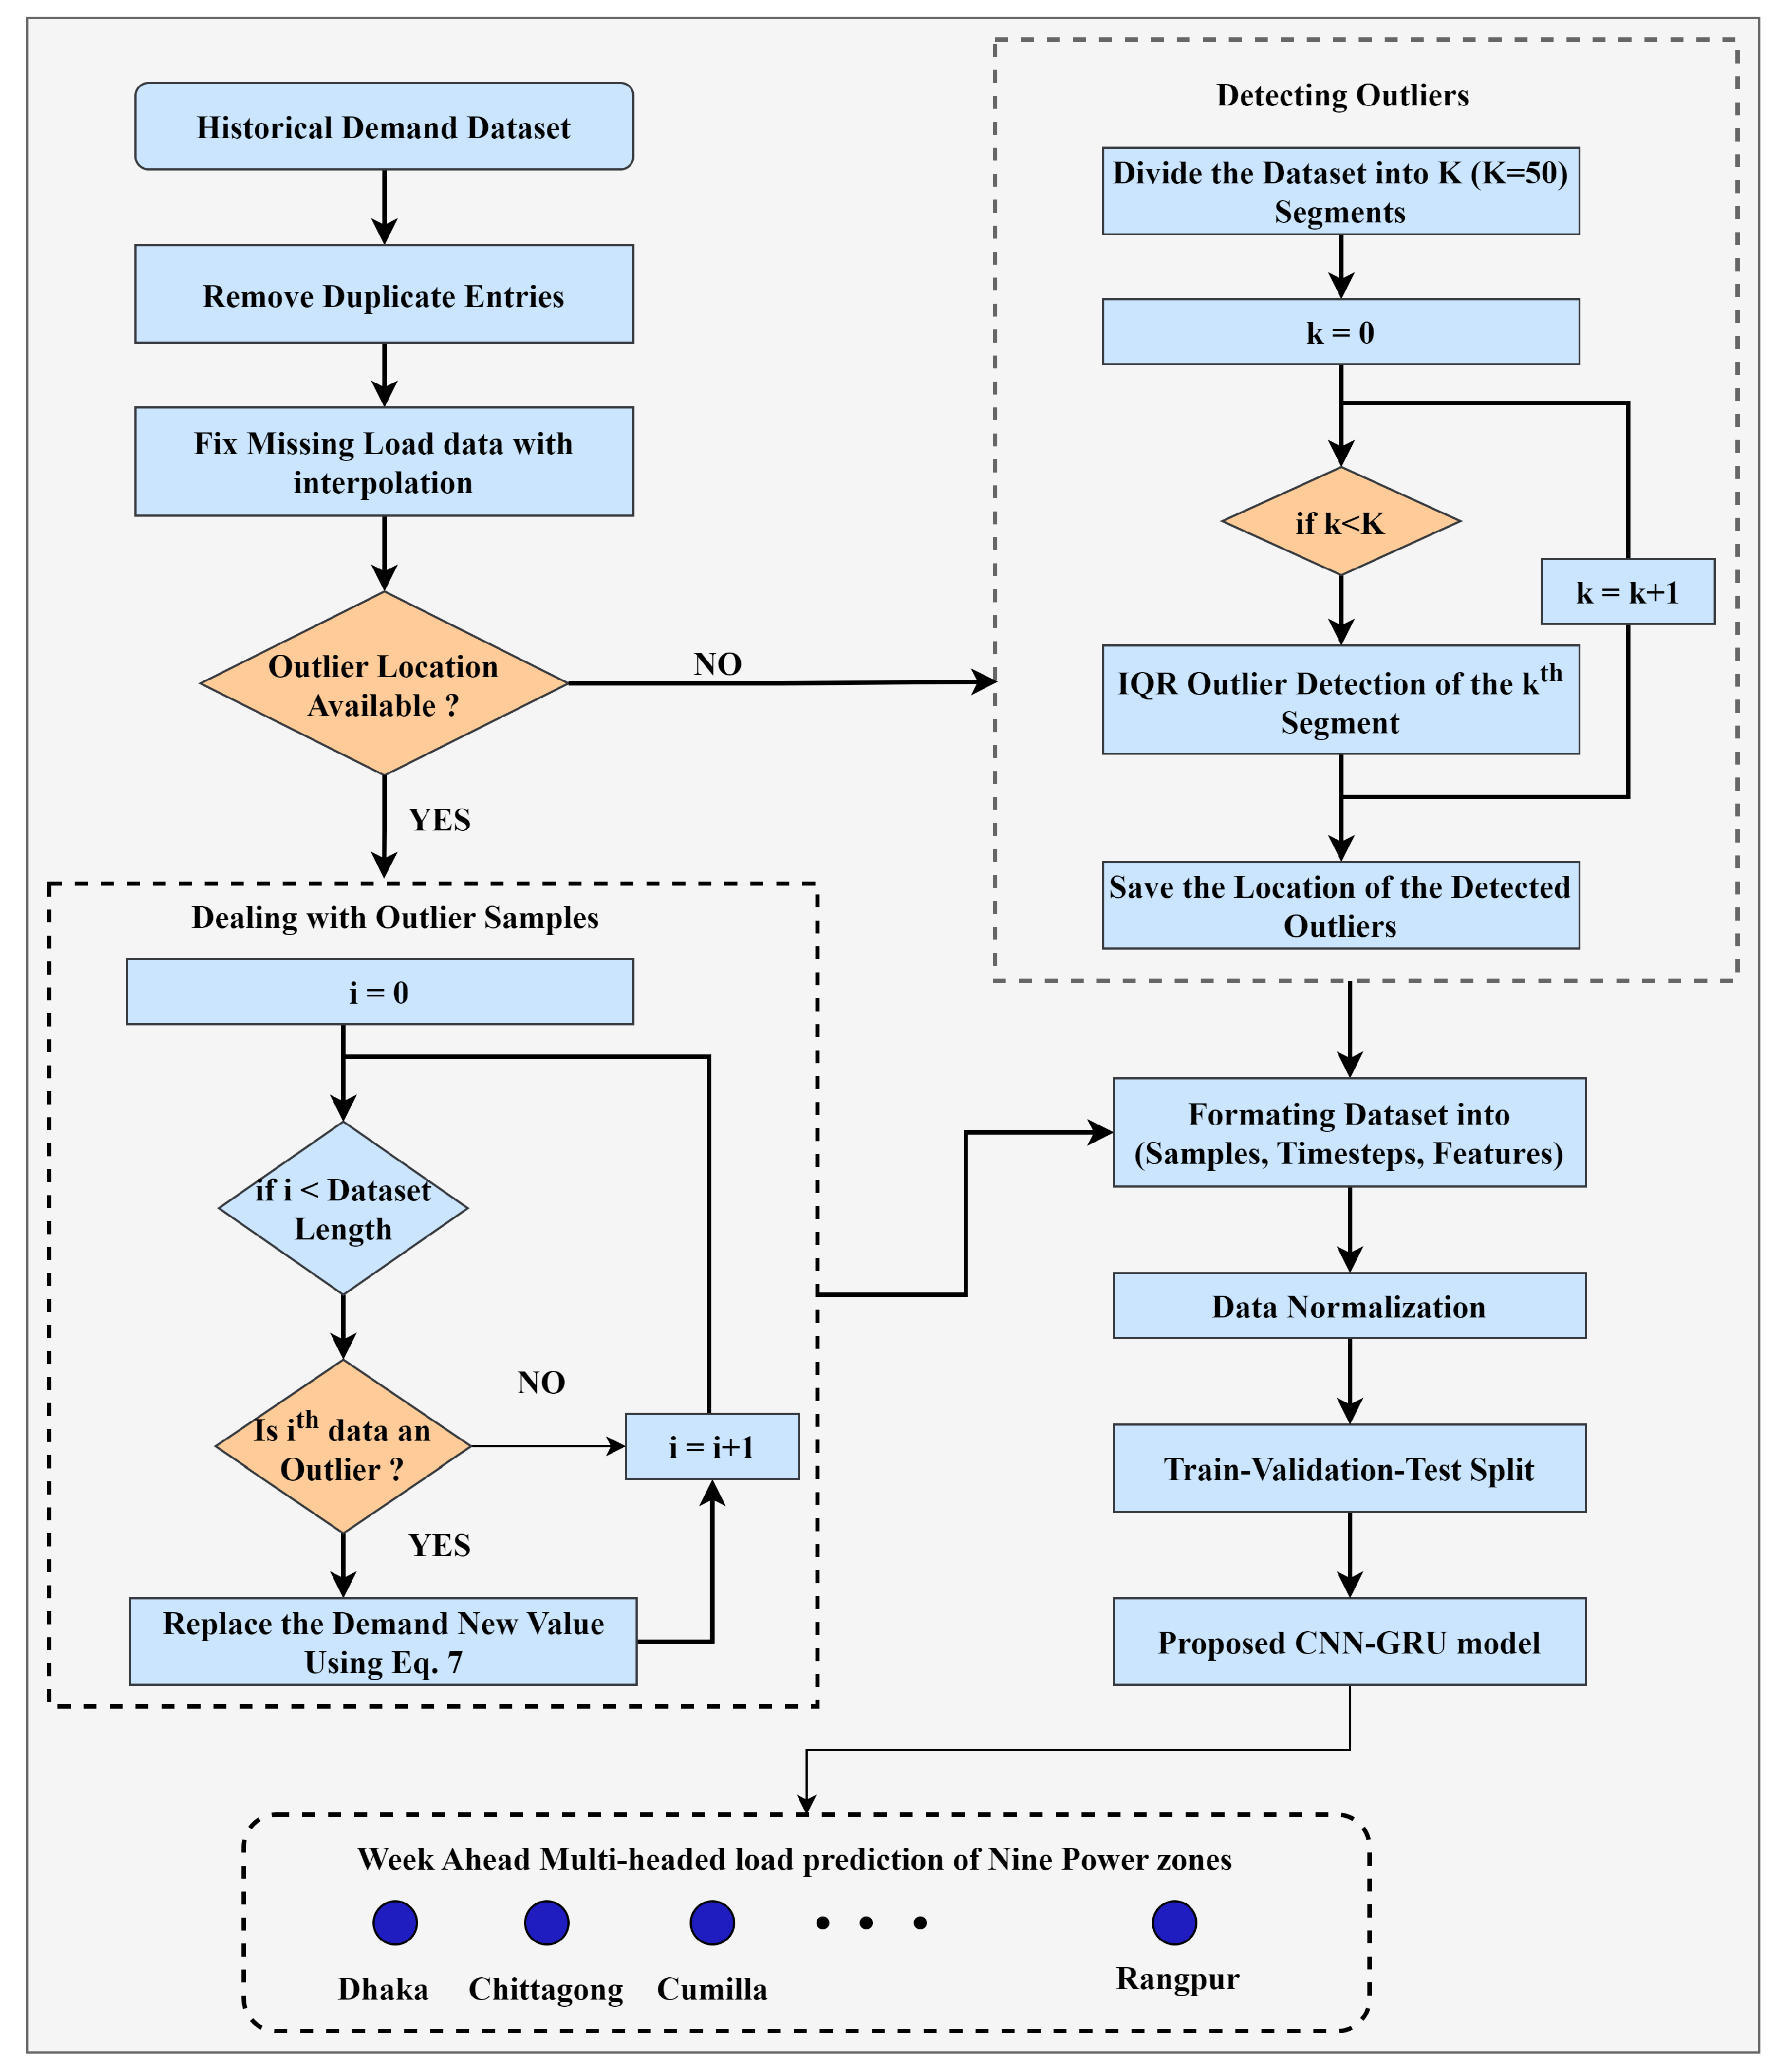
The workflow of this study is depicted in Figure 3. After collecting the historical demand dataset, we eliminated duplicate values and addressed any missing demands. Subsequently, an outlier detection technique was applied to detect outlier indices. Upon identifying outlier samples, we corrected them using a straightforward averaging technique. Finally, the dataset underwent normalization and was partitioned into training, testing, and validation sets before being fed into the forecasting models to predict load demand across multiple regions. The approach taken in this research can be seen as the combination of the following key steps.

3.1. Data Preprocessing

This section outlines the collection of raw data from scratch and the subsequent preparation of these data for deep learning models. Initially, the data are preprocessed to eliminate outliers, missing values, and redundant information. The training utilizes input datasets that have been standardized by employing standard min–max scalar techniques to normalize them within a specific range.
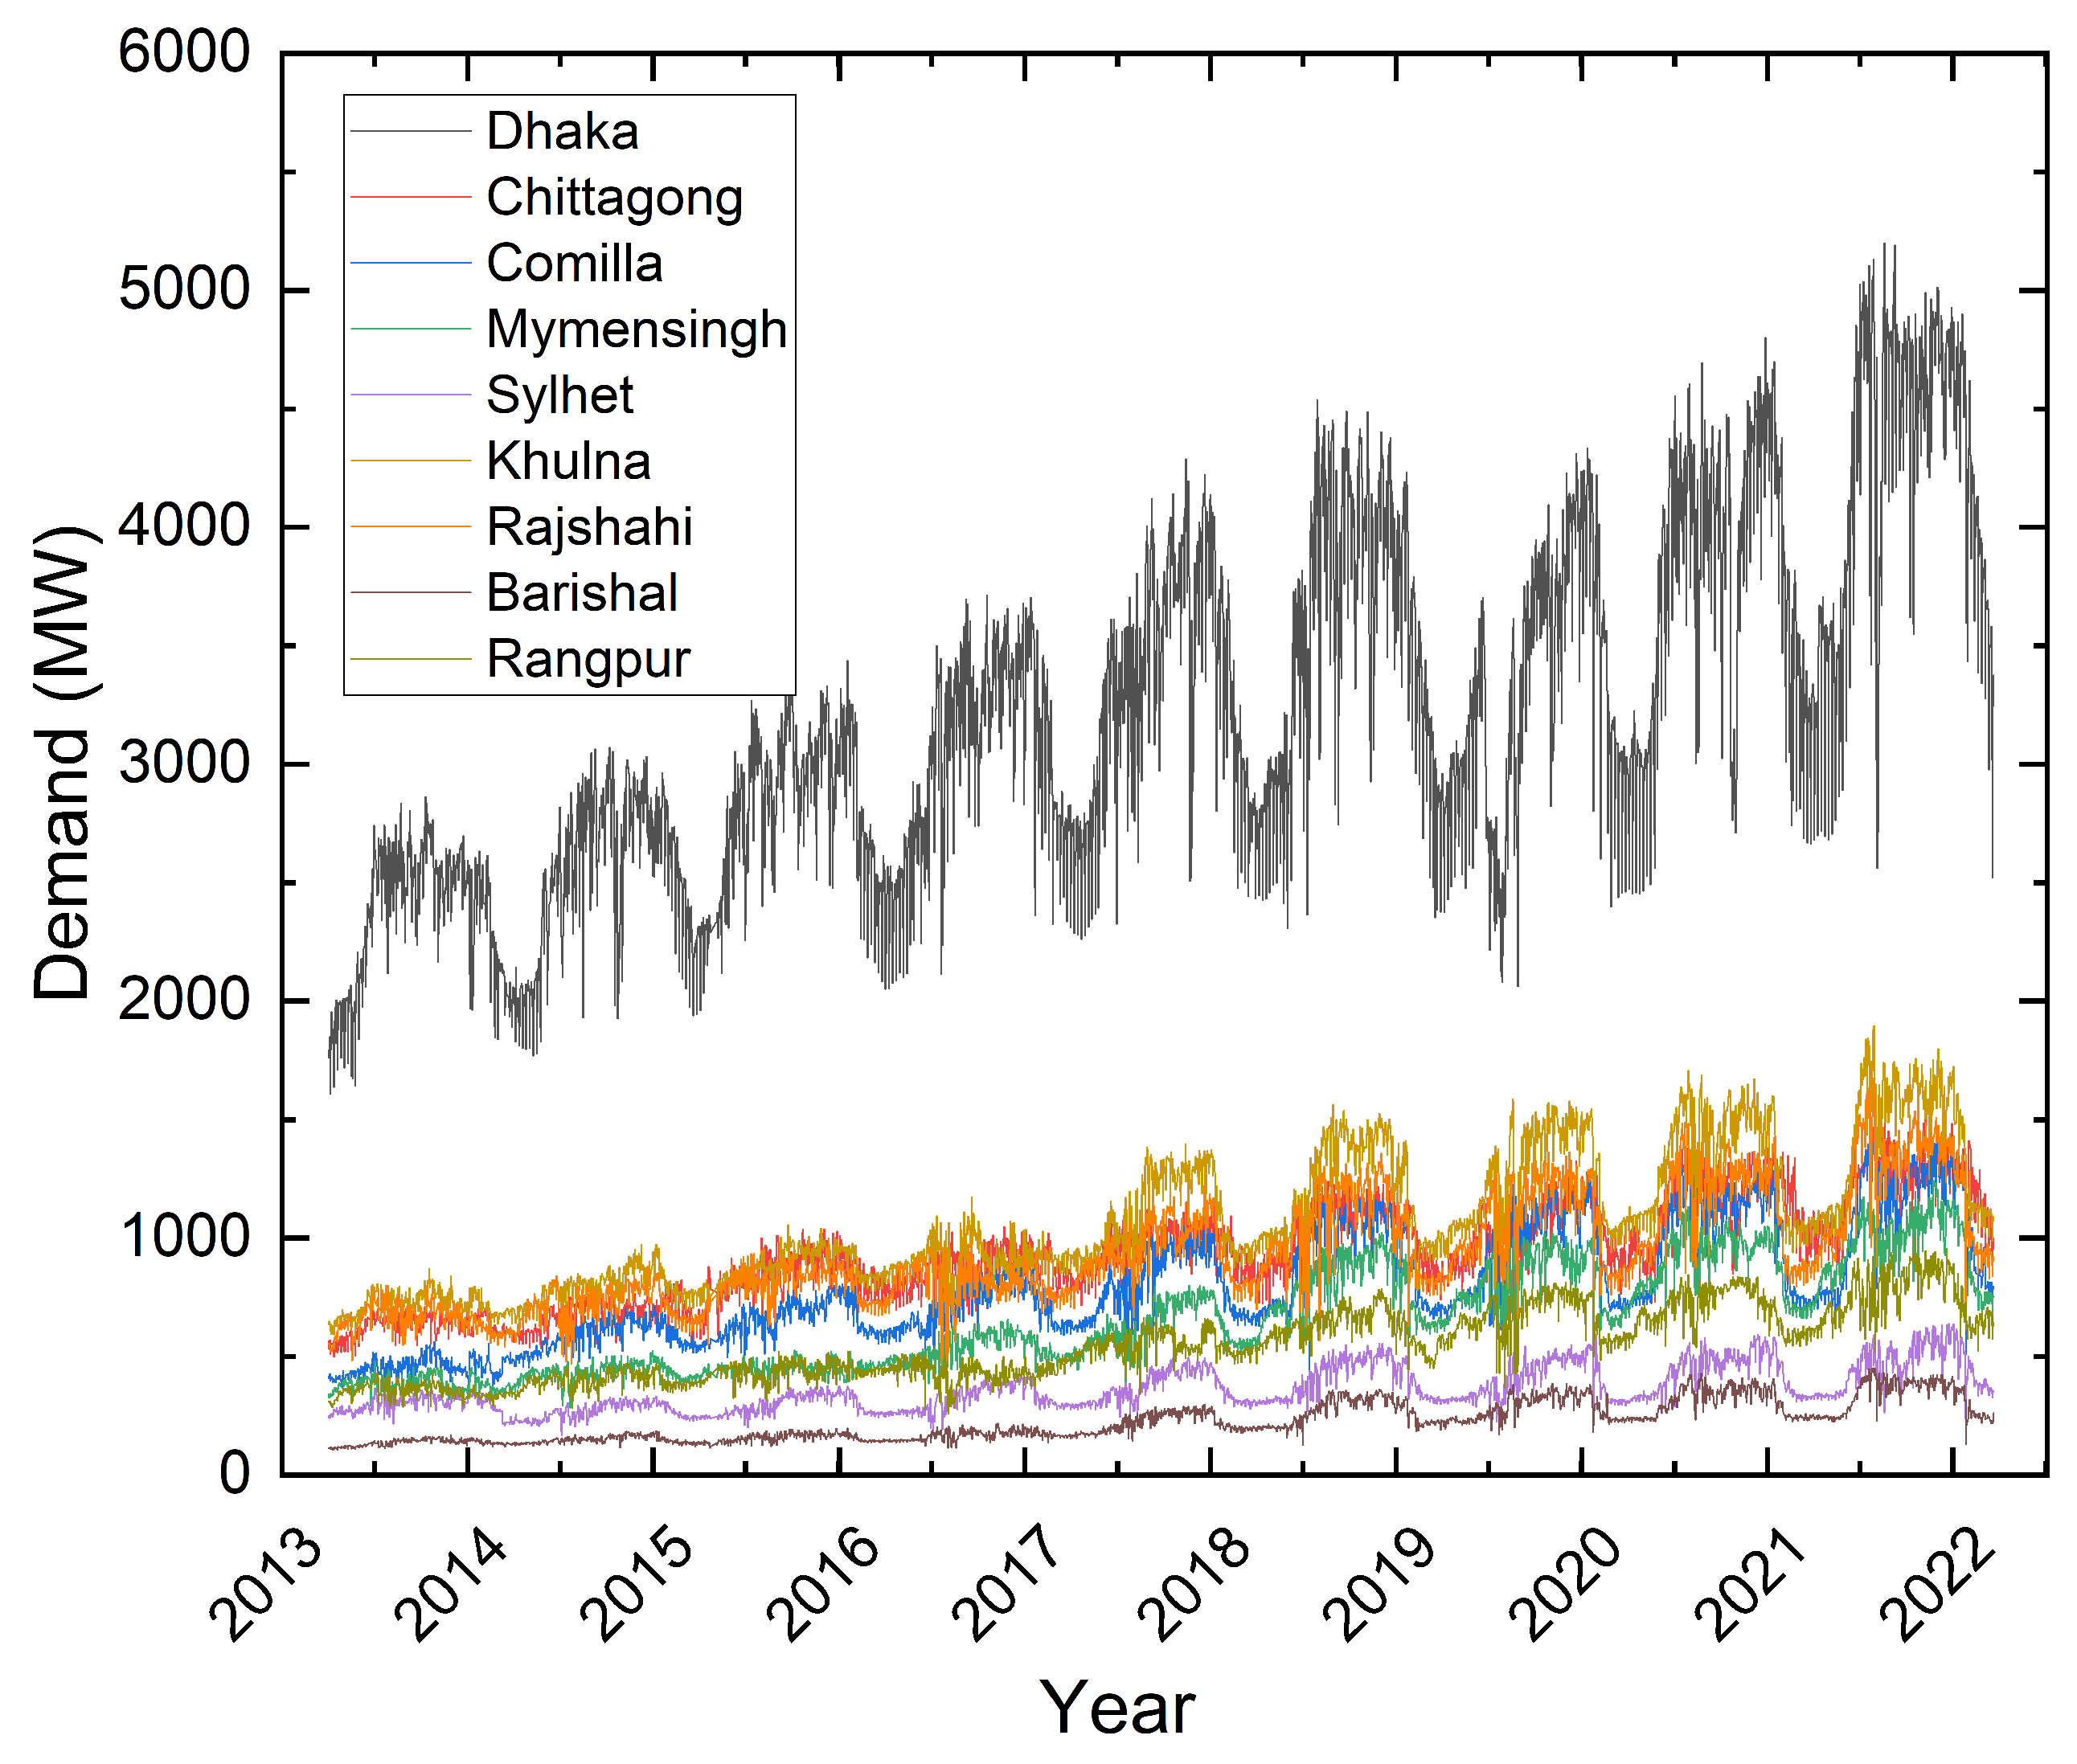
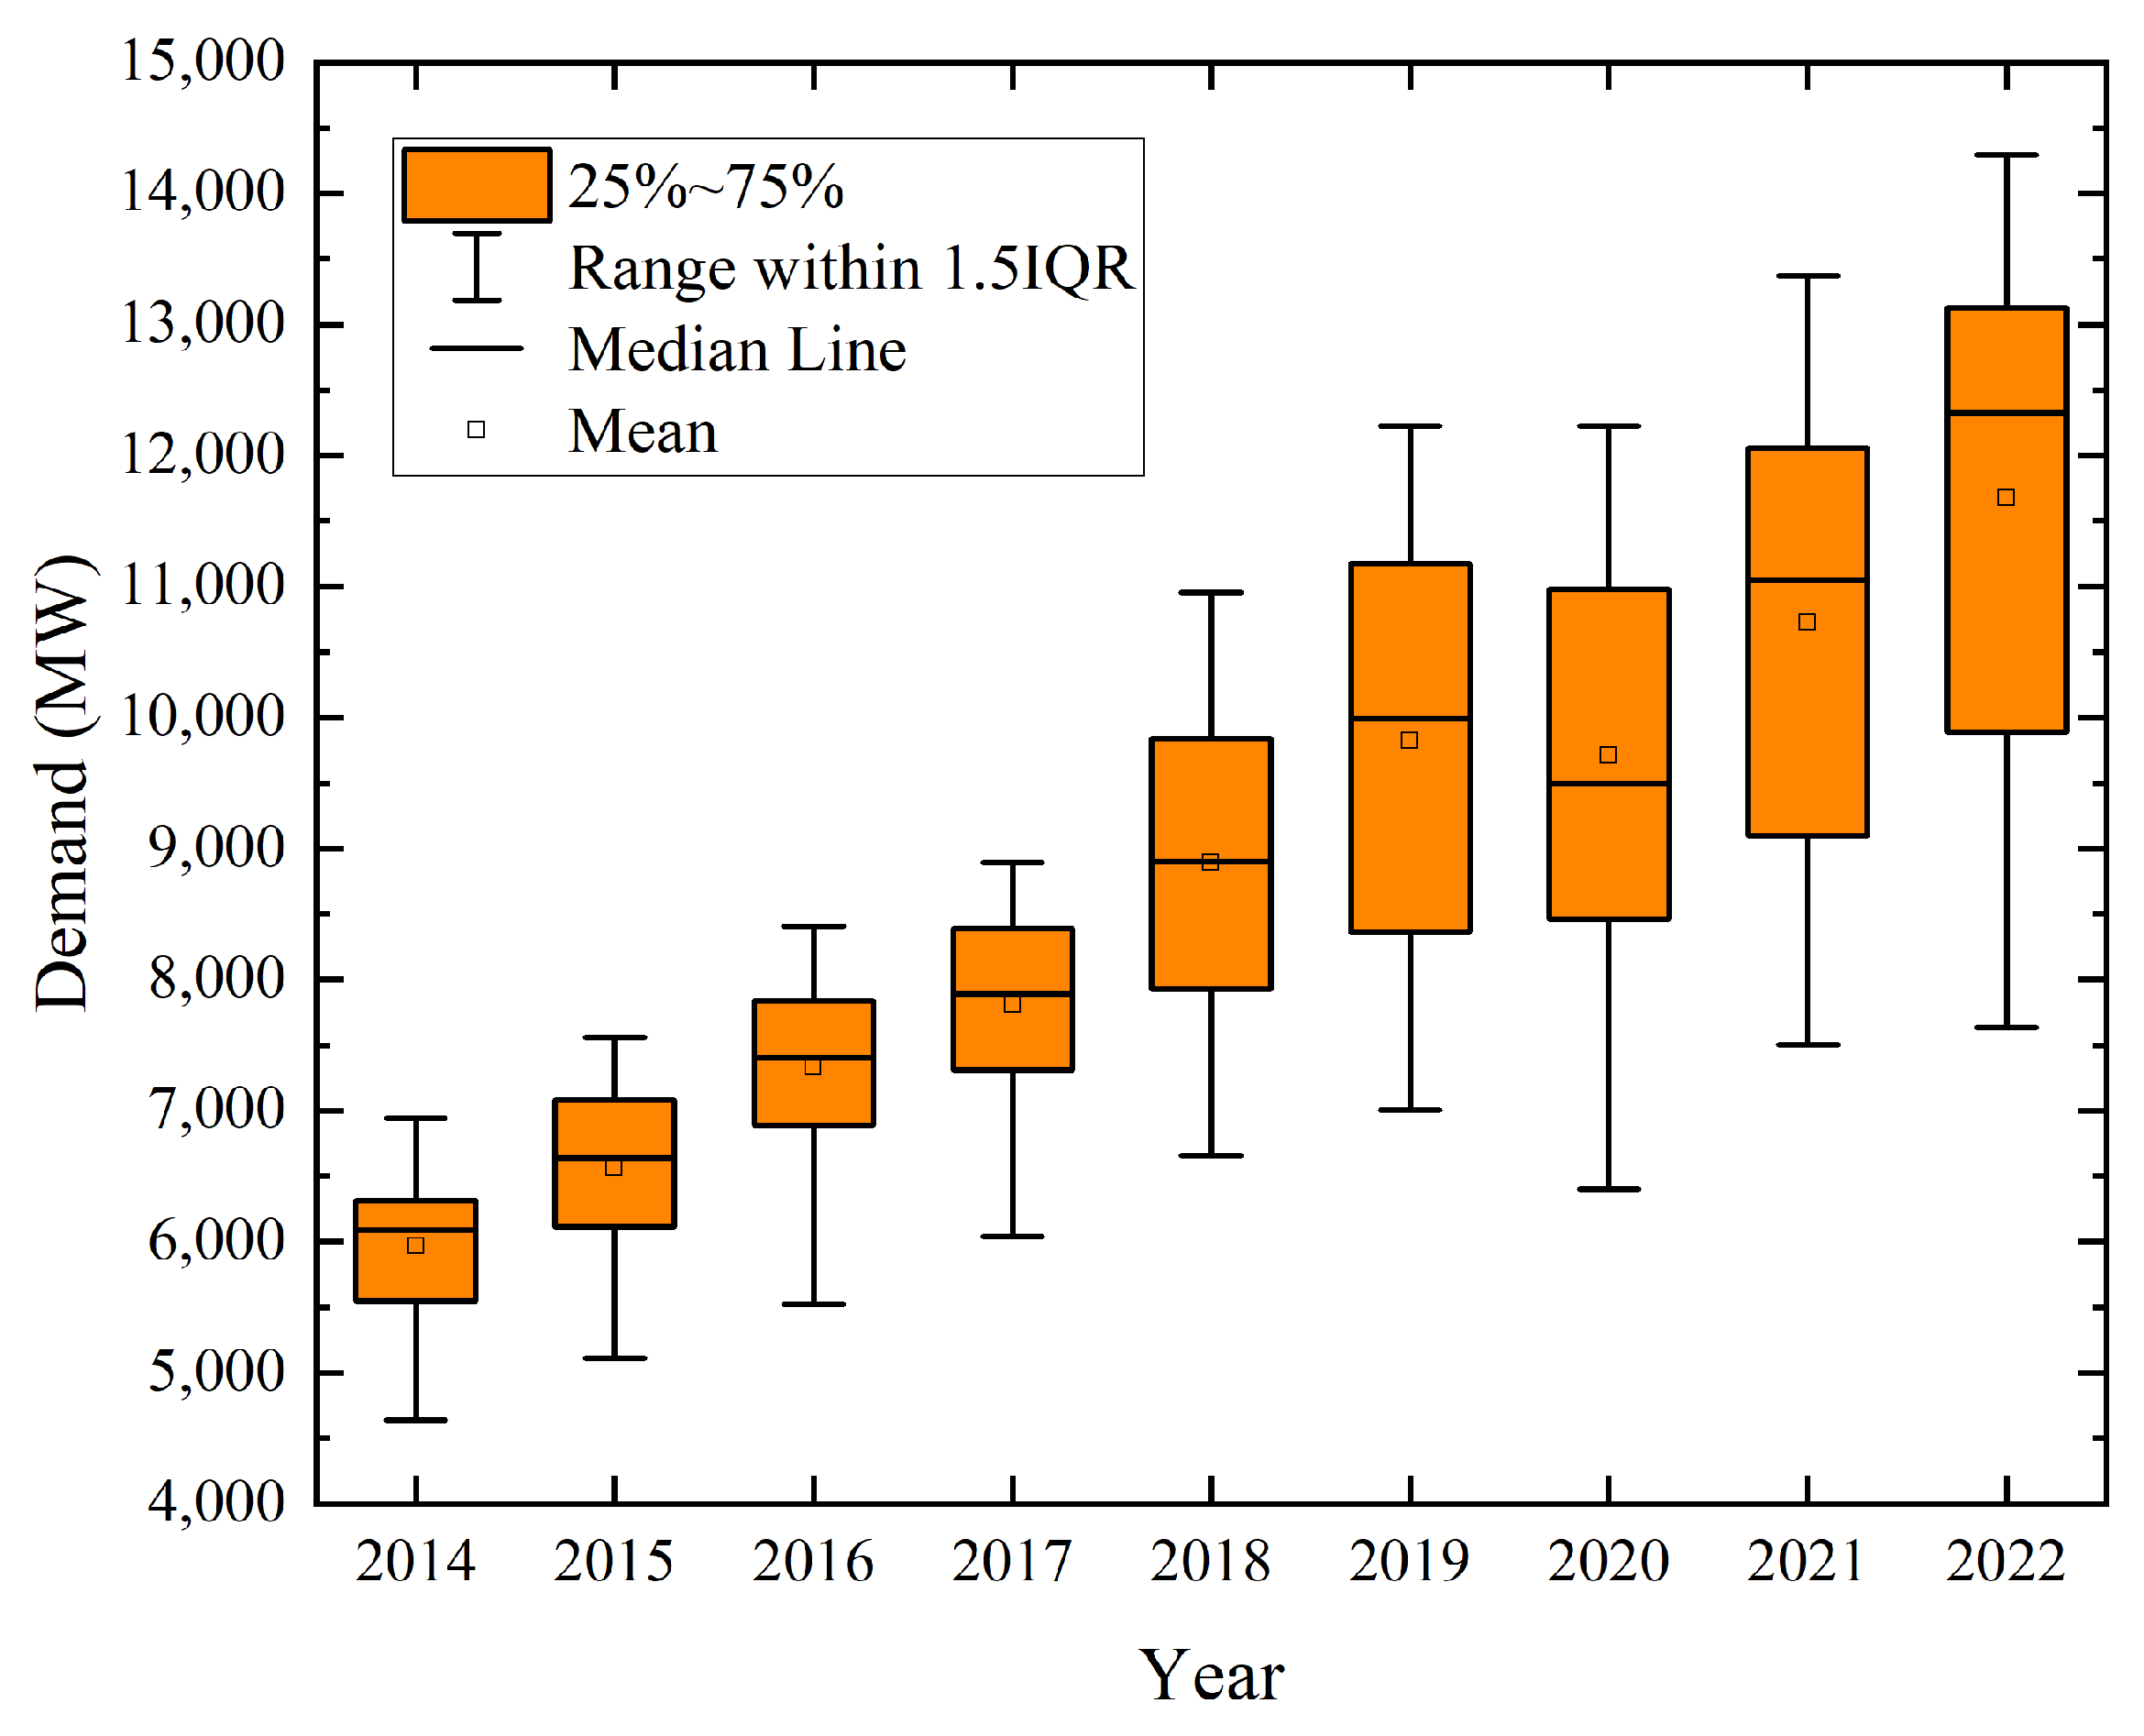
  • Data Collection: The Power Grid Company of Bangladesh (PGCB) website openly provides daily records of the country’s power system, encompassing details like load demand, energy consumption, and load curves for various regions. Our dataset was compiled by retrieving these records from January 2014 to April 2023, resulting in 3407 data points. Bangladesh, being a subtropical monsoon country, is divided into eight major divisions. However, the power demand of the population is managed through nine distinct power zones that cover the entire country. We collected individual area loads to cover the load demand of the whole country. Subsequently, these data are organized in an Excel spreadsheet for closer examination. The nine different zones’ load patterns are presented in Figure 4. It is apparent from the figure that the load demand has increased over the years. Notably, the dataset exhibits significant noise, reflecting the complexities of real-world data. The total yearly demand in Bangladesh is displayed in the box plot in Figure 5, which outlines each year’s mean, standard deviations, and interquartile range. Compared to the earlier years in the observation period, there has been more variation in demand in recent years. This overall upward trend underscores the increasing need for electricity each year.
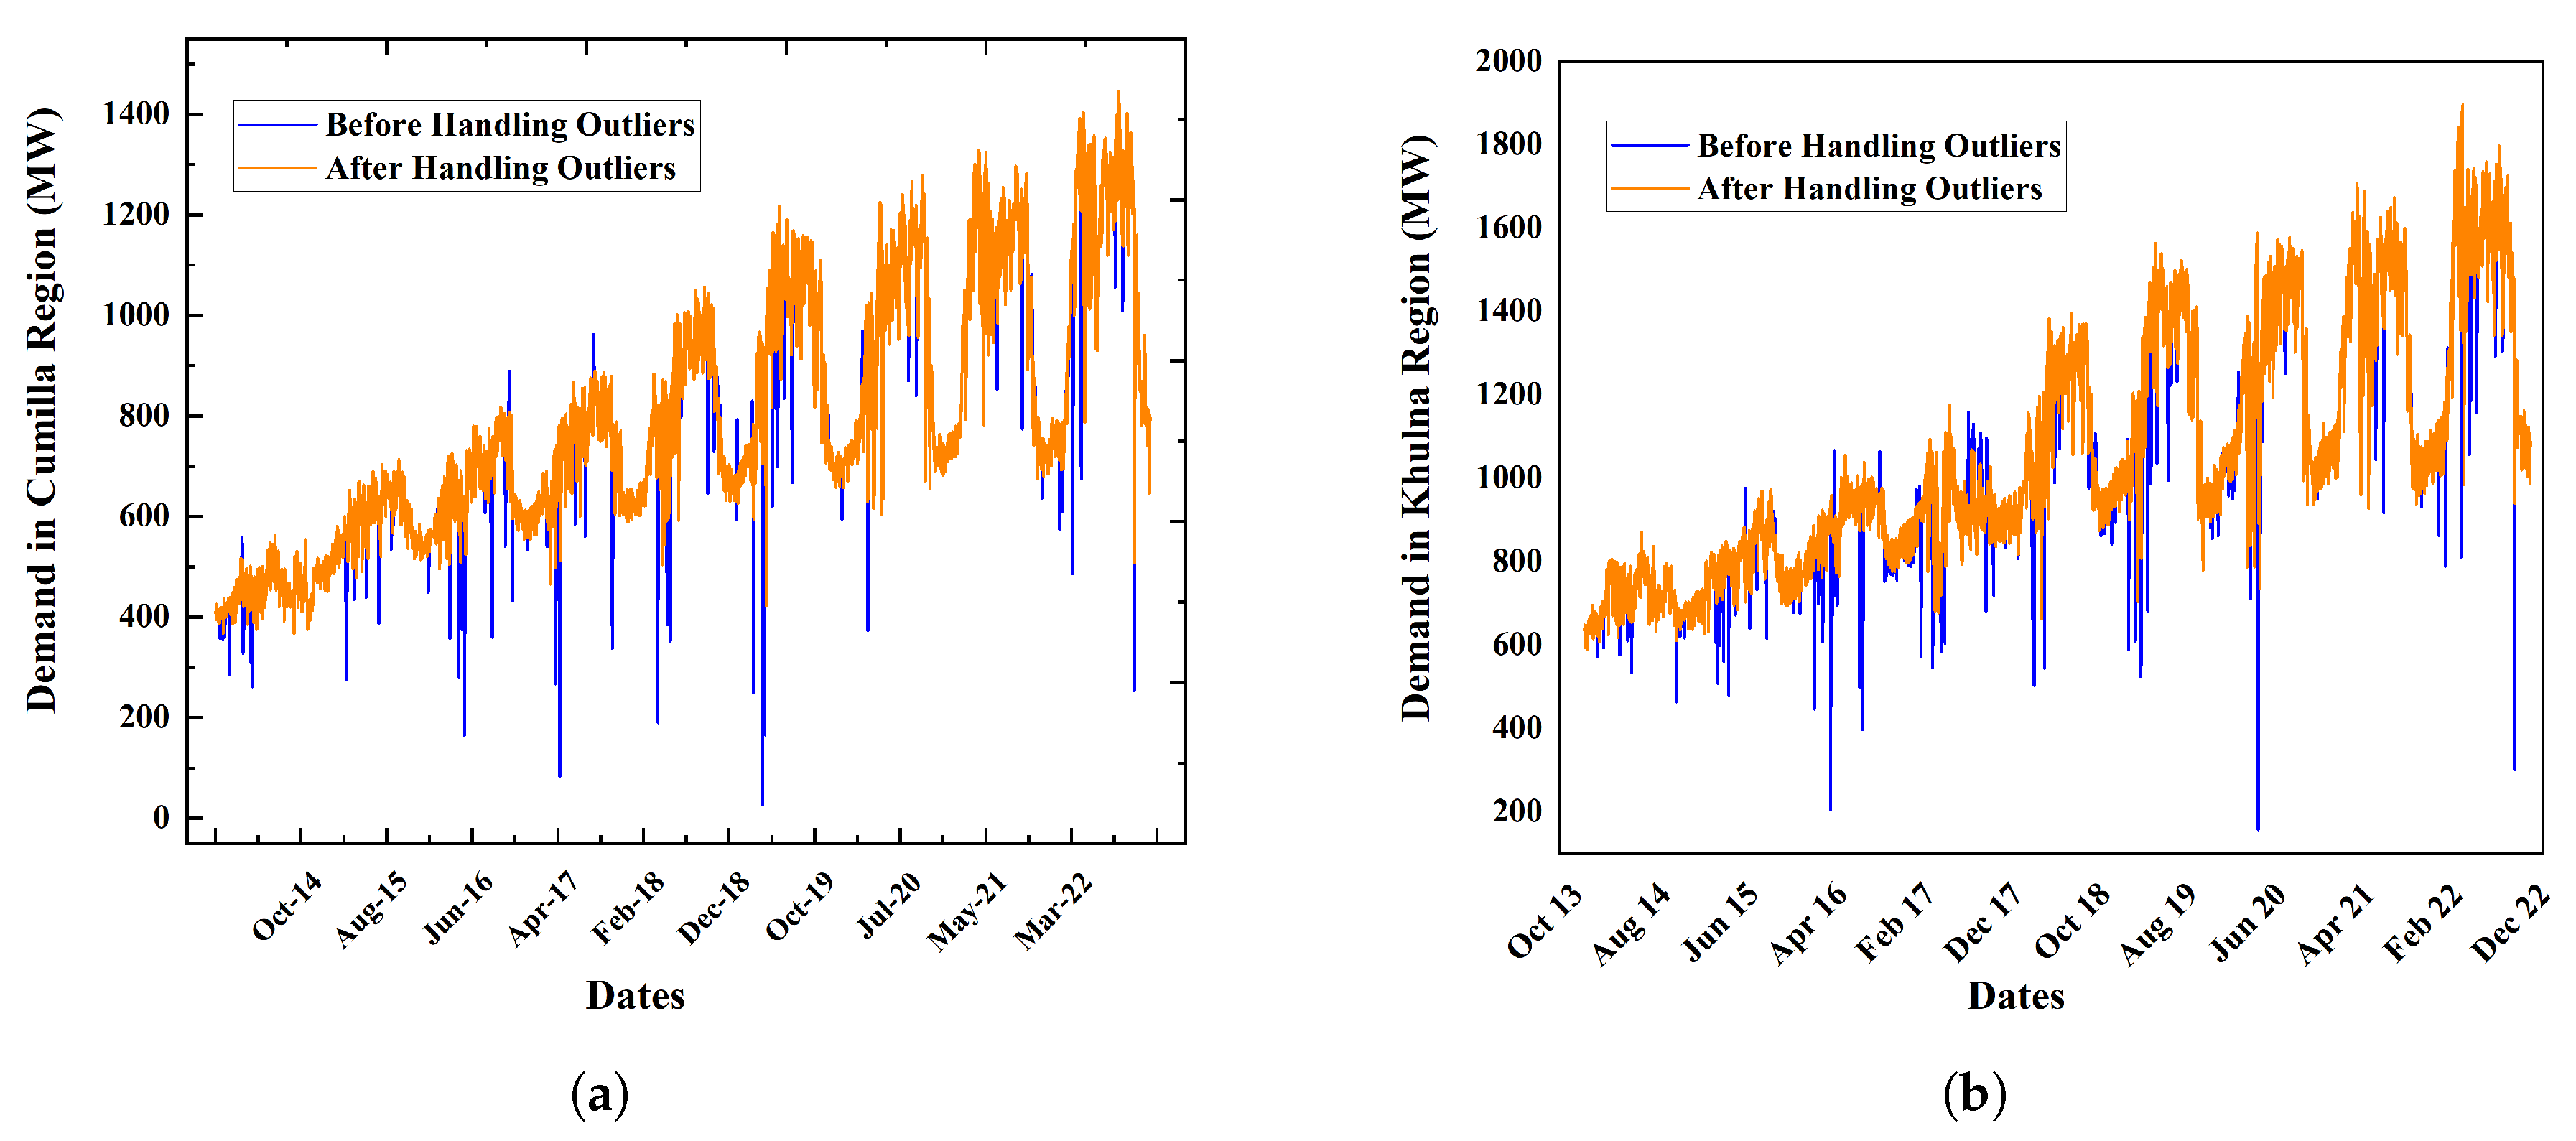
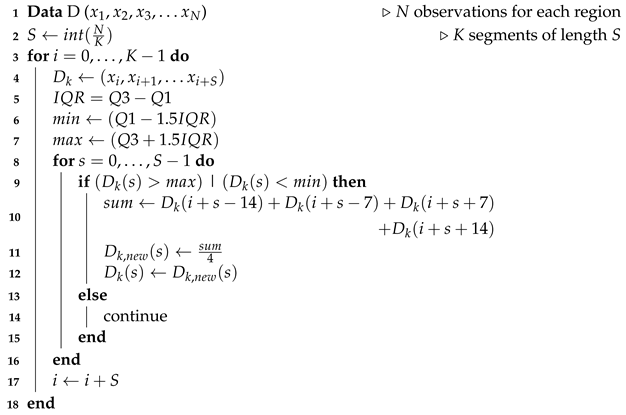
  • Outlier Detection: The initially collected dataset includes a considerable amount of outlier observations. Due to the non-stationary characteristics present in our dataset, it is challenging to adopt traditional outlier detection mechanisms. Hence, we have implemented a simple yet efficient mechanism to detect problematic measurements effectively. We have divided our dataset into K subsections for this technique. Then, we calculated the interquartile range ( I Q R ) in each subsection. A sample is considered an outlier if the value is less than ( Q 1 1.5 I Q R ) and greater than ( Q 3 + 1.5 I Q R ) . Many studies consider removing the outlier values. However, we uniquely fix the outliers in this research. Since the electrical demand dataset also has weekly seasonality, we consider the average of 4 days, which is the value of two weeks in the past and future, instead of the previous outlier value as shown in Equation (7). Here, D ( i ) represents the electricity demand of ith index for any segment. The pseudocode for the outlier detection is presented in Algorithm 1. For simplicity of illustration, we focused on two cities, Cumilla and Khulna, in Figure 6. These figures illustrate the demand of these two regions before and after handling outlier measurements. Evidently, the proposed technique in this study can successfully identify and fix the outliers.
    D n e w ( i ) = D ( i 14 ) + D ( i 7 ) + D ( i + 7 ) + D ( i + 14 ) 4
Algorithm 1: Proposed outlier detection method
Bdcc 08 00012 i001
3.
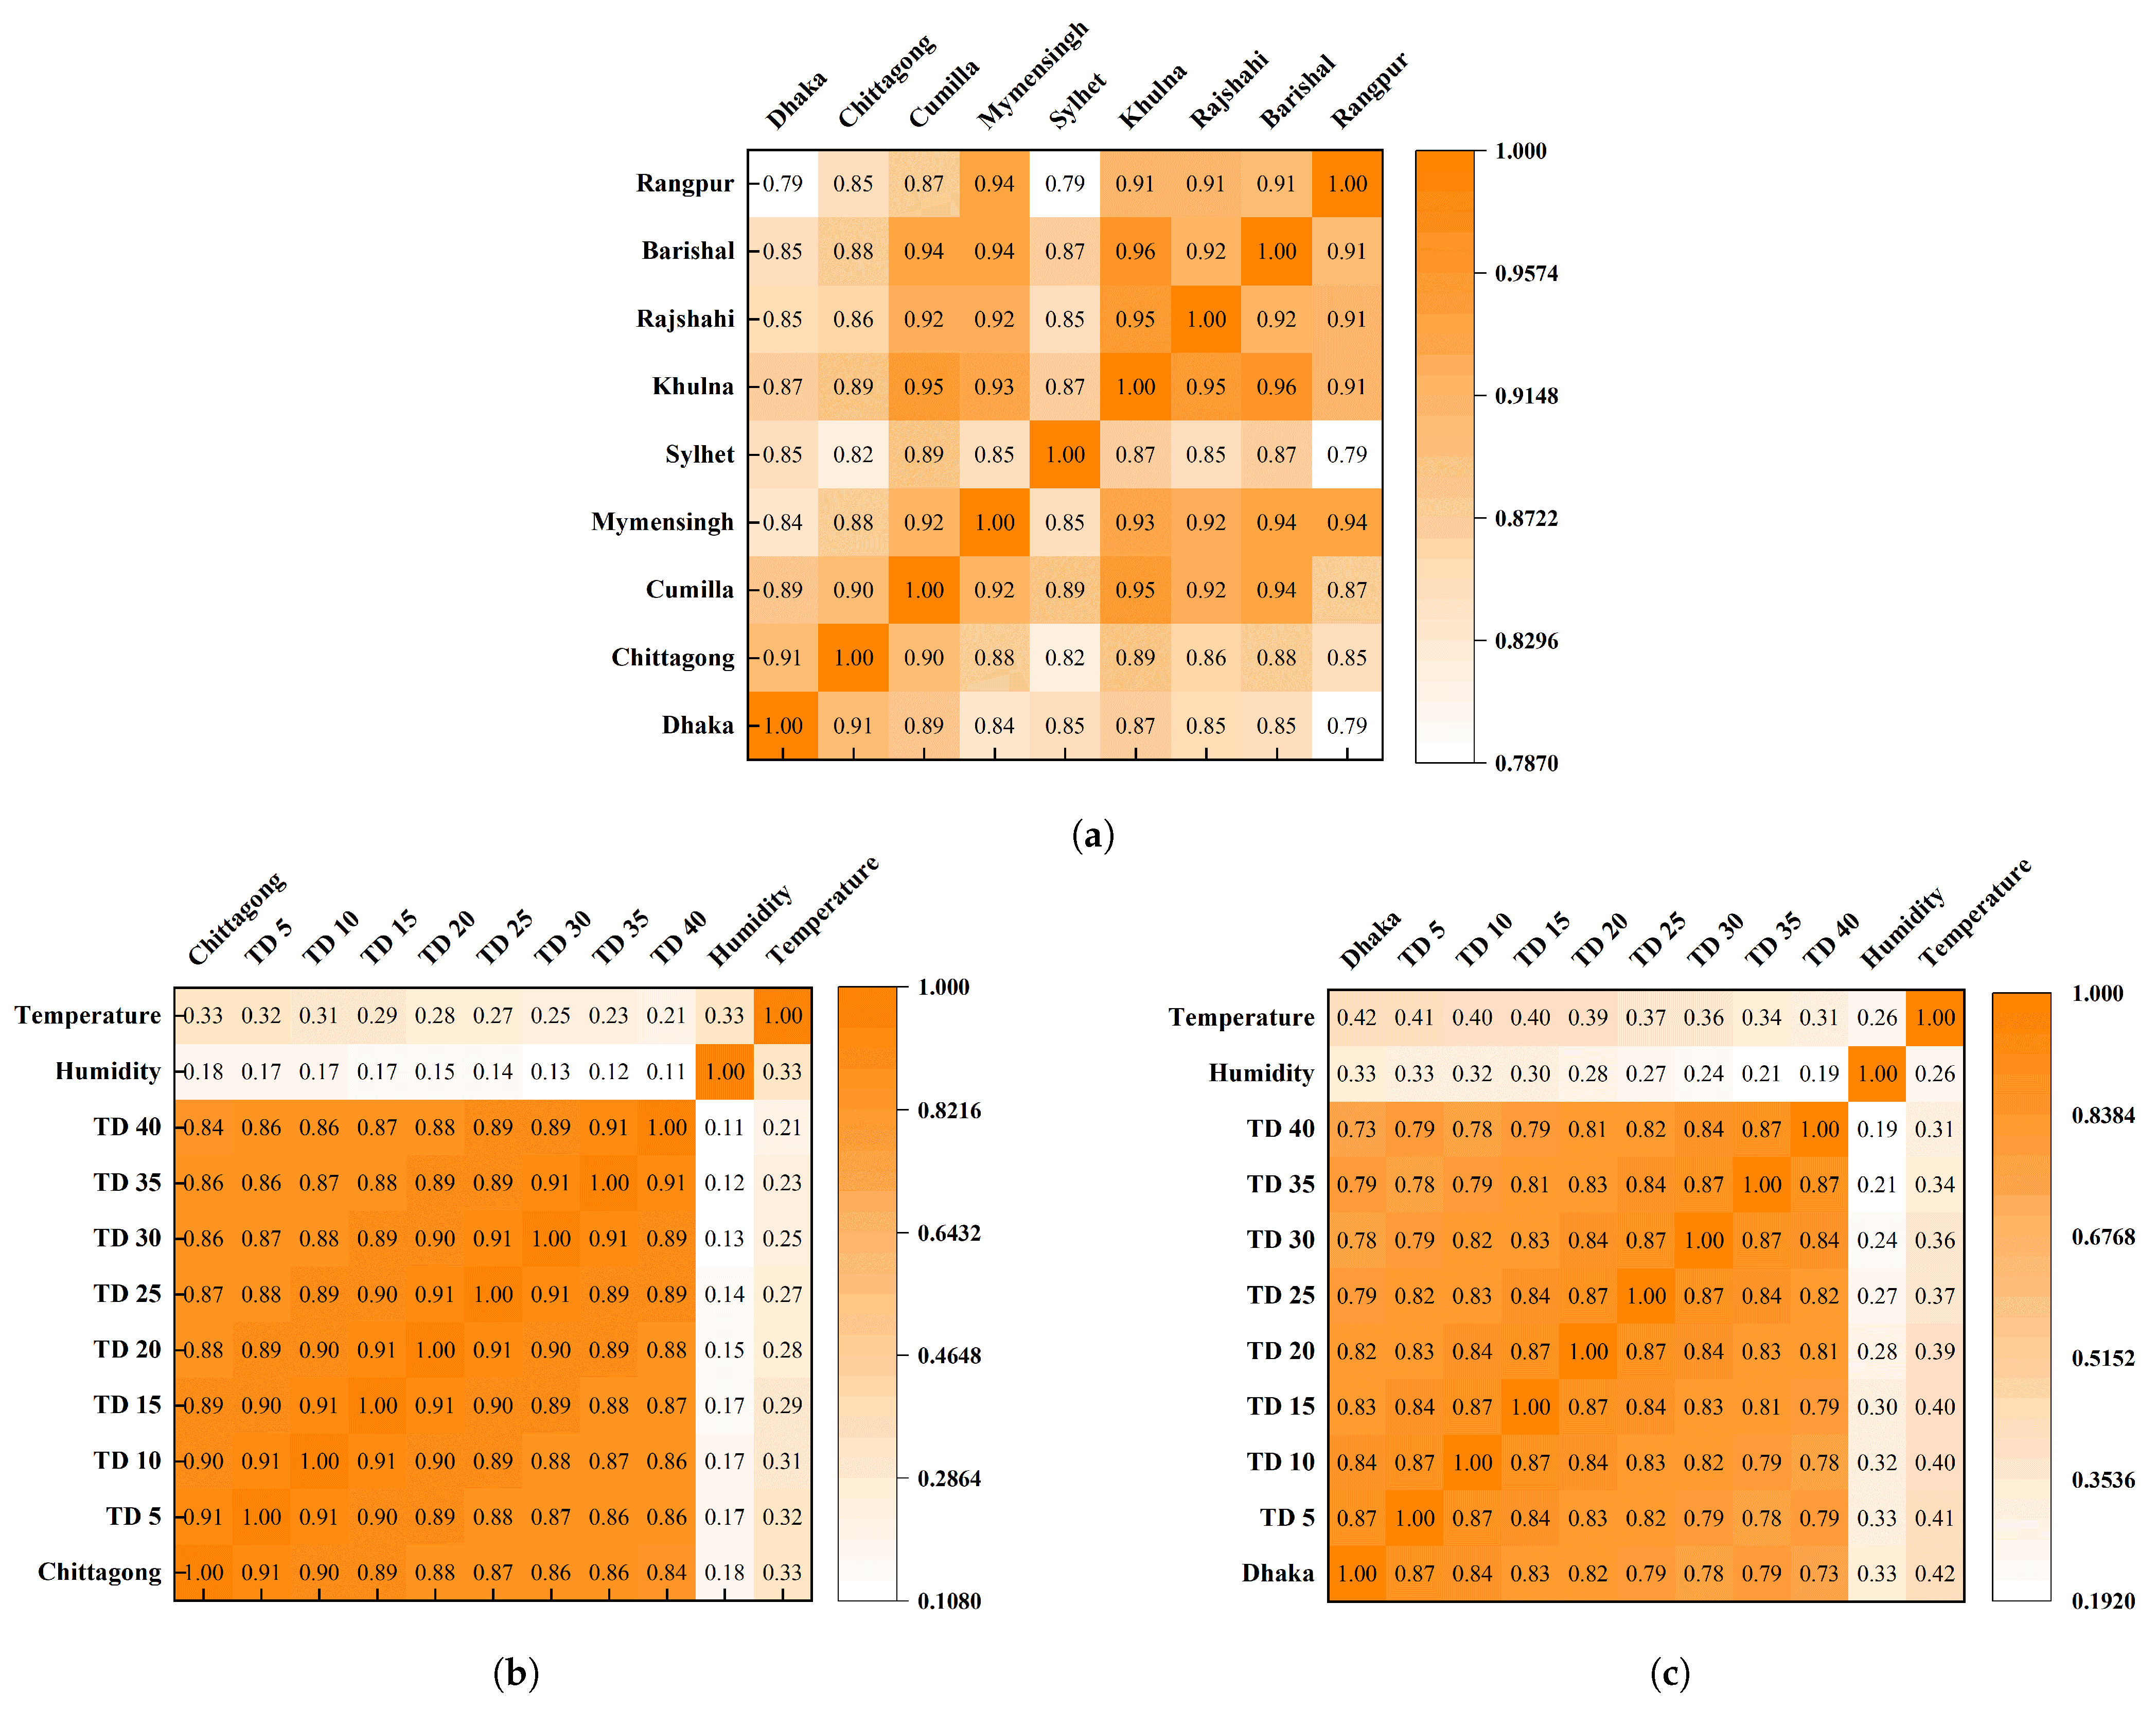
Feature Selection: Choosing the right features is essential for building a load forecasting model. Too few features may lead to inaccurate predictions, while having too many may increase the computational burden. Figure 4 reveals that the load changes periodically throughout nine years. At first, the demand of different areas, time lags, temperature, relative humidity, and month are considered the feature vectors following the convention of existing studies [1]. This research leverages the Pearson correlation matrix of features to determine and assess the correlation between load demand and other relevant factors. We begin by visualizing the relationships between individual load values from nine different locations in a correlation matrix, shown here in Figure 7a, which reveals a strong relationship with values between 1.00 and 0.80 and indicates that the demand of one region may also be dependent on the load dynamics from other areas. Various time delay (TD) variables are constructed by concatenating load data from earlier instances to select the appropriate lookback window for the DL models. In other words, we must determine how much we have to look into the past to predict the future. The dataset contains various time delay (TD) variables that incorporate past load values like the previous (5–40)th days’ load, which is represented by ( T D 5 , T D 10 , T D 15 , , T D 40 ) These variables are generated by stacking previous values of the dataset’s load. For simplicity, we focus on just two regions here, Dhaka and Chittagong, when showing the correlation matrix in Figure 7b,c. The correlation values of the time delays for Dhaka and Chittagong are 0.87–0.73 and 0.91–0.84, respectively, which is very impressive. However for the sake of computational efficiency, we have selected 20 as the lookback window. From Figure 7b,c, low correlation values for variables like temperature and humidity suggest a poor or nonexistent linear relationship with the load. Thus, only the demands of individual areas and months are considered fit for use as features in deep learning (DL) model construction. In total, we have 3407 samples with ten features; nine are electrical loads of nine different areas, and the rest one is month.
4.
Data Augmentation: We have augmented the primary clean dataset, which offers finer granularity than the initial one. This augmentation is achieved through linear Interpolation, as illustrated in the Equation (8). Interpolation is a technique for estimating or forecasting new values from known or existing values. The main dataset is filled with interpolated measurement data at every one-hour interval, giving 81,768 samples. In the equation, Y 1 and Y 2 represent measurement data at any two adjacent days X 1 and X 2 . For any hour x ϵ ( x 1 , x 2 , , x 24 ) between X 1 and X 2 , the demand data are denoted by y.
y = Y 1 + ( x X 1 ) ( Y 2 Y 1 ) ( X 2 X 1 )
5.
Normalization: Electric load is recorded on a large scale, commonly in megawatts (MW). However, DL models are more effective when working with smaller value ranges. To ensure optimal performance, the load features have been reduced to the range [0, 1] using the min–max scaling method in Equation (9). Here, x is the real value of some feature that is to be transformed, x n e w is the post-normalization value, x m a x and x m i n represents the highest and lowest value in the feature measurements.
x n e w = ( x x m i n ) ( x m a x x m i n )
6.
Data Framing: After scaling the load data, they are separated into three sets: training, validation, and test sets. The test dataset included data from July 2022 to April 2023, while the training period spanned from January 2014 to June 2022. Validation data are taken from the training data (last 10%), yielding an 90:10 training-to-validation data ratio. Our model is trained on the augmented data and tested on the original historical data. Each set is converted into (samples, time sequence, features) format.
Figure 7. Correlation matrix of the features. (a) Correlation matrix among different power zones. (b) Correlation matrix of load demand with time delay (TD) and weather parameters in Chittagong. (c) Correlation matrix of load demand with time delay (TD) and weather parameters in Dhaka.
Bdcc 08 00012 g007

3.2. Development Environment

All DL models in this study are trained and tested using the Python-based Keras Tensorflow Module, an open-source ML framework. Our modeling was conducted on a MacBook Pro (13-inch, model M1, 2020) with 16 GB of RAM and two core processors. We have selected the platform due to its high computational capacity and energy efficiency compared to widely used alternative platforms such as Google Colab and NVIDIA GPUs for training DL models. The unique hardware features of the MacBook Pro, coupled with a focus on leveraging existing resources, not only make it a viable option but also empower researchers to conduct impactful and environmentally conscious academic work while maintaining financial prudence.

3.3. Model Architecture

Existing studies demonstrated the effectiveness of DL-based models such as ANN, CNN, and LSTM compared to conventional ML-based algorithms [10,16]. RNN is a type of DL algorithm that utilizes feedback connection, enabling it to transfer information from one timestep to another. Thus, it allows the learning of a power system’s load dynamic over time. To address the gradient vanishing problem, variants of RNN, such as GRU and LSTM that utilize cell state to carry information across many timesteps, are developed. Thus, as shown in the existing literature, they successfully analyze time sequence data, such as historical load demand. On the other hand, CNN can learn temporal and spatial patterns in load data. Hence, they can extract meaningful features that enable hybrid approaches combined with other techniques. So, we have selected several deep learning and hybrid models, such as LSTM, GRU, CNN-LSTM, and CNN-GRU to compare their performance in this study. Transformer, a state-of-the-art DL algorithm that has a multiheaded self-attention mechanism, was first introduced for machine translation [36]. It removes the sequential information processing limitation of RNNs, allowing parallel computations. In recent years, Transformer and its variant algorithms have been widely used in many time series forecasting, outperforming LSTMs. So, we have also experimented with Transformer, CNN-Transformer, and Transformer-LSTM to compare their performance with other DL-based models. A naive predictor is also chosen as a baseline to evaluate the experimented algorithms. This simple baseline model predicts the load demand equal to the demand of the day one week ago. Our study found that the CNN-GRU model outperformed the other models, achieving the lowest error score. A block diagram representation of the proposed model’s architecture is illustrated in Figure 8.
Properly selecting hyperparameters, such as the number of hidden layers, the size of each layer, the activation function, and the learning rate, holds significant importance in designing the architecture of DL-based models. Large values for these hyperparameters can lead to overfitting, while small values may result in a lack of convergence during training. Finding the optimum set of hyperparameters is a challenging task that is inherently non-deterministic and polynomial. In this study, the hyperparameters of the proposed model were chosen using a trial and error method while experimenting with different ranges of values. In the proposed model architecture, a 1D-CNN is employed to extract features from the historical load dataset, where the number of filters and kernel size are crucial parameters. Various experiments were conducted with different numbers of filters (32, 64, 128) and different kernel sizes (3, 5, 7). It was observed that 128 filters with a window size of 3 generate the lowest validation loss. The CNN layer is followed by a max-pooling layer to downsample the number of parameters. The features extracted by the ConvNet and max-pooling layer are then passed on to a GRU layer, the role of which is to learn the temporal characteristics of the inputs. Various experiments were conducted with different numbers of hidden units for the GRU layer, with the optimum value of 64 units.
We have employed the rectified linear unit (ReLU) as the activation function for each hidden layer in the CNN module within our model. ReLU’s simple yet effective non-linearity facilitates modeling complex patterns in time series data by enabling the network to learn quickly and avoid saturation. Compared to traditional activation functions such as sigmoid or hyperbolic tangent (tanh), ReLU does not suffer from vanishing gradients, which is crucial for capturing long-term dependencies in sequential data. On the other hand, we have adopted tanh activation in the GRU layer. Because GRU is internally designed with gating mechanisms to regulate the flow of information through the network, the tanh activation function is often chosen because its output range aligns well with the gating logic, allowing the gates to control the information flow more effectively. Dropout is a regularization technique that randomly deactivates neurons in the Neural Network. We have incorporated dropout as a regularization technique, which randomly deactivates neurons in the Neural Network to mitigate overfitting and enhance generalization. A dropout rate of 0.1 was chosen for this study, as excessively large dropout rates can hinder convergence, leading to underfitting. The Adam optimizer was selected for training the model weights due to its adaptability to sparse and noisy gradients, efficient memory usage, and robustness to initial learning rate selection. A dense layer follows the GRU layer, and the output is obtained from nine heads with linear activation for regression, each corresponding to the demand output for different regions. Integrating CNN and GRU in a hybrid approach aims to leverage the strengths of both models to enhance accuracy. In Table 3, the details of parameters are depicted. In our study, all models were trained over 100 epochs with Keras’s early stopping callback. The proposed model is trained and validated on interpolated data, and the test is performed on the real data set. The models’ ability to forecast a seven-day-ahead load was assessed using the test set, which represented unobserved data for the models.

4. Results

In this section, we discuss the model performances on the test observations. The proposed technique in this study simultaneously predicts week-ahead demand in all divisions in Bangladesh. To evaluate the performance of our forecasting model, we have used root mean squared error (RMSE) and mean absolute percentage error (MAPE). Equations (10) and (11) demonstrate the mathematical formulation for RMSE and MAPE respectively, where y i and y i ^ are the actual and predicted values of N samples. These metrics have become widely used for their effectiveness in assessing the accuracy of forecasting results.
R M S E = i = 1 N ( y i y ^ ) 2 N
M A P E = 100 % N i = 1 N ( y i y ^ i ) y i
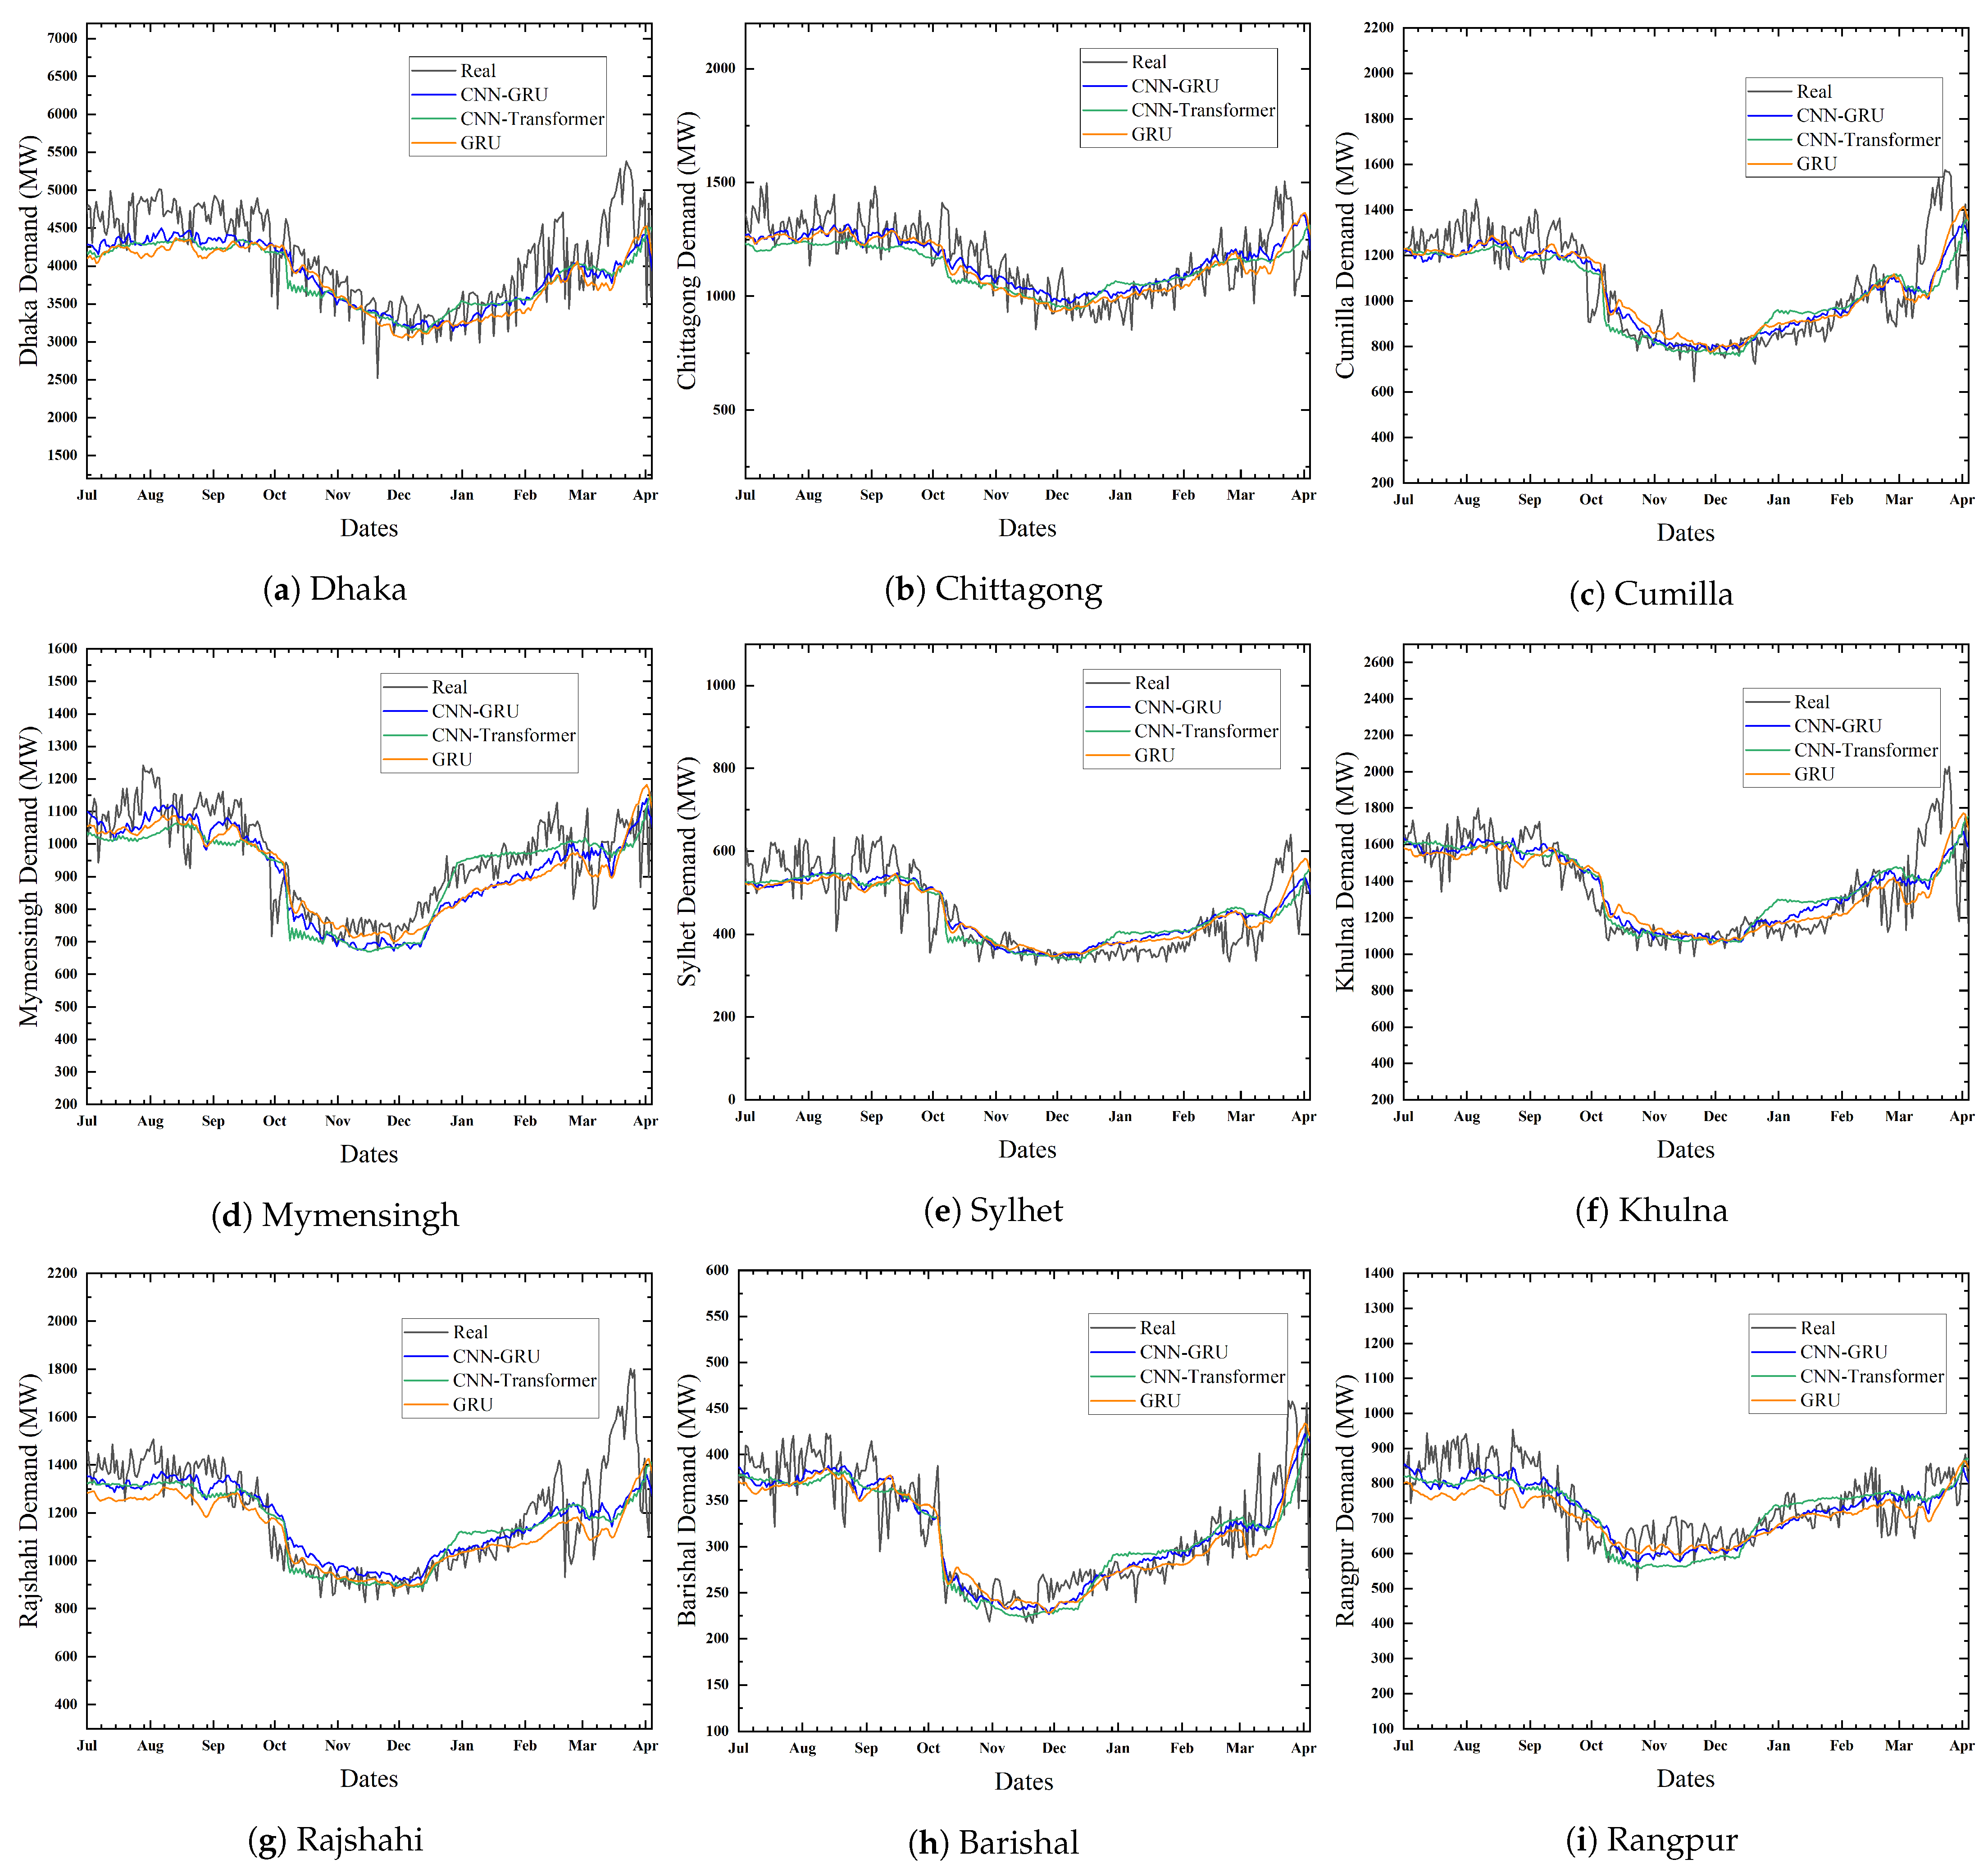
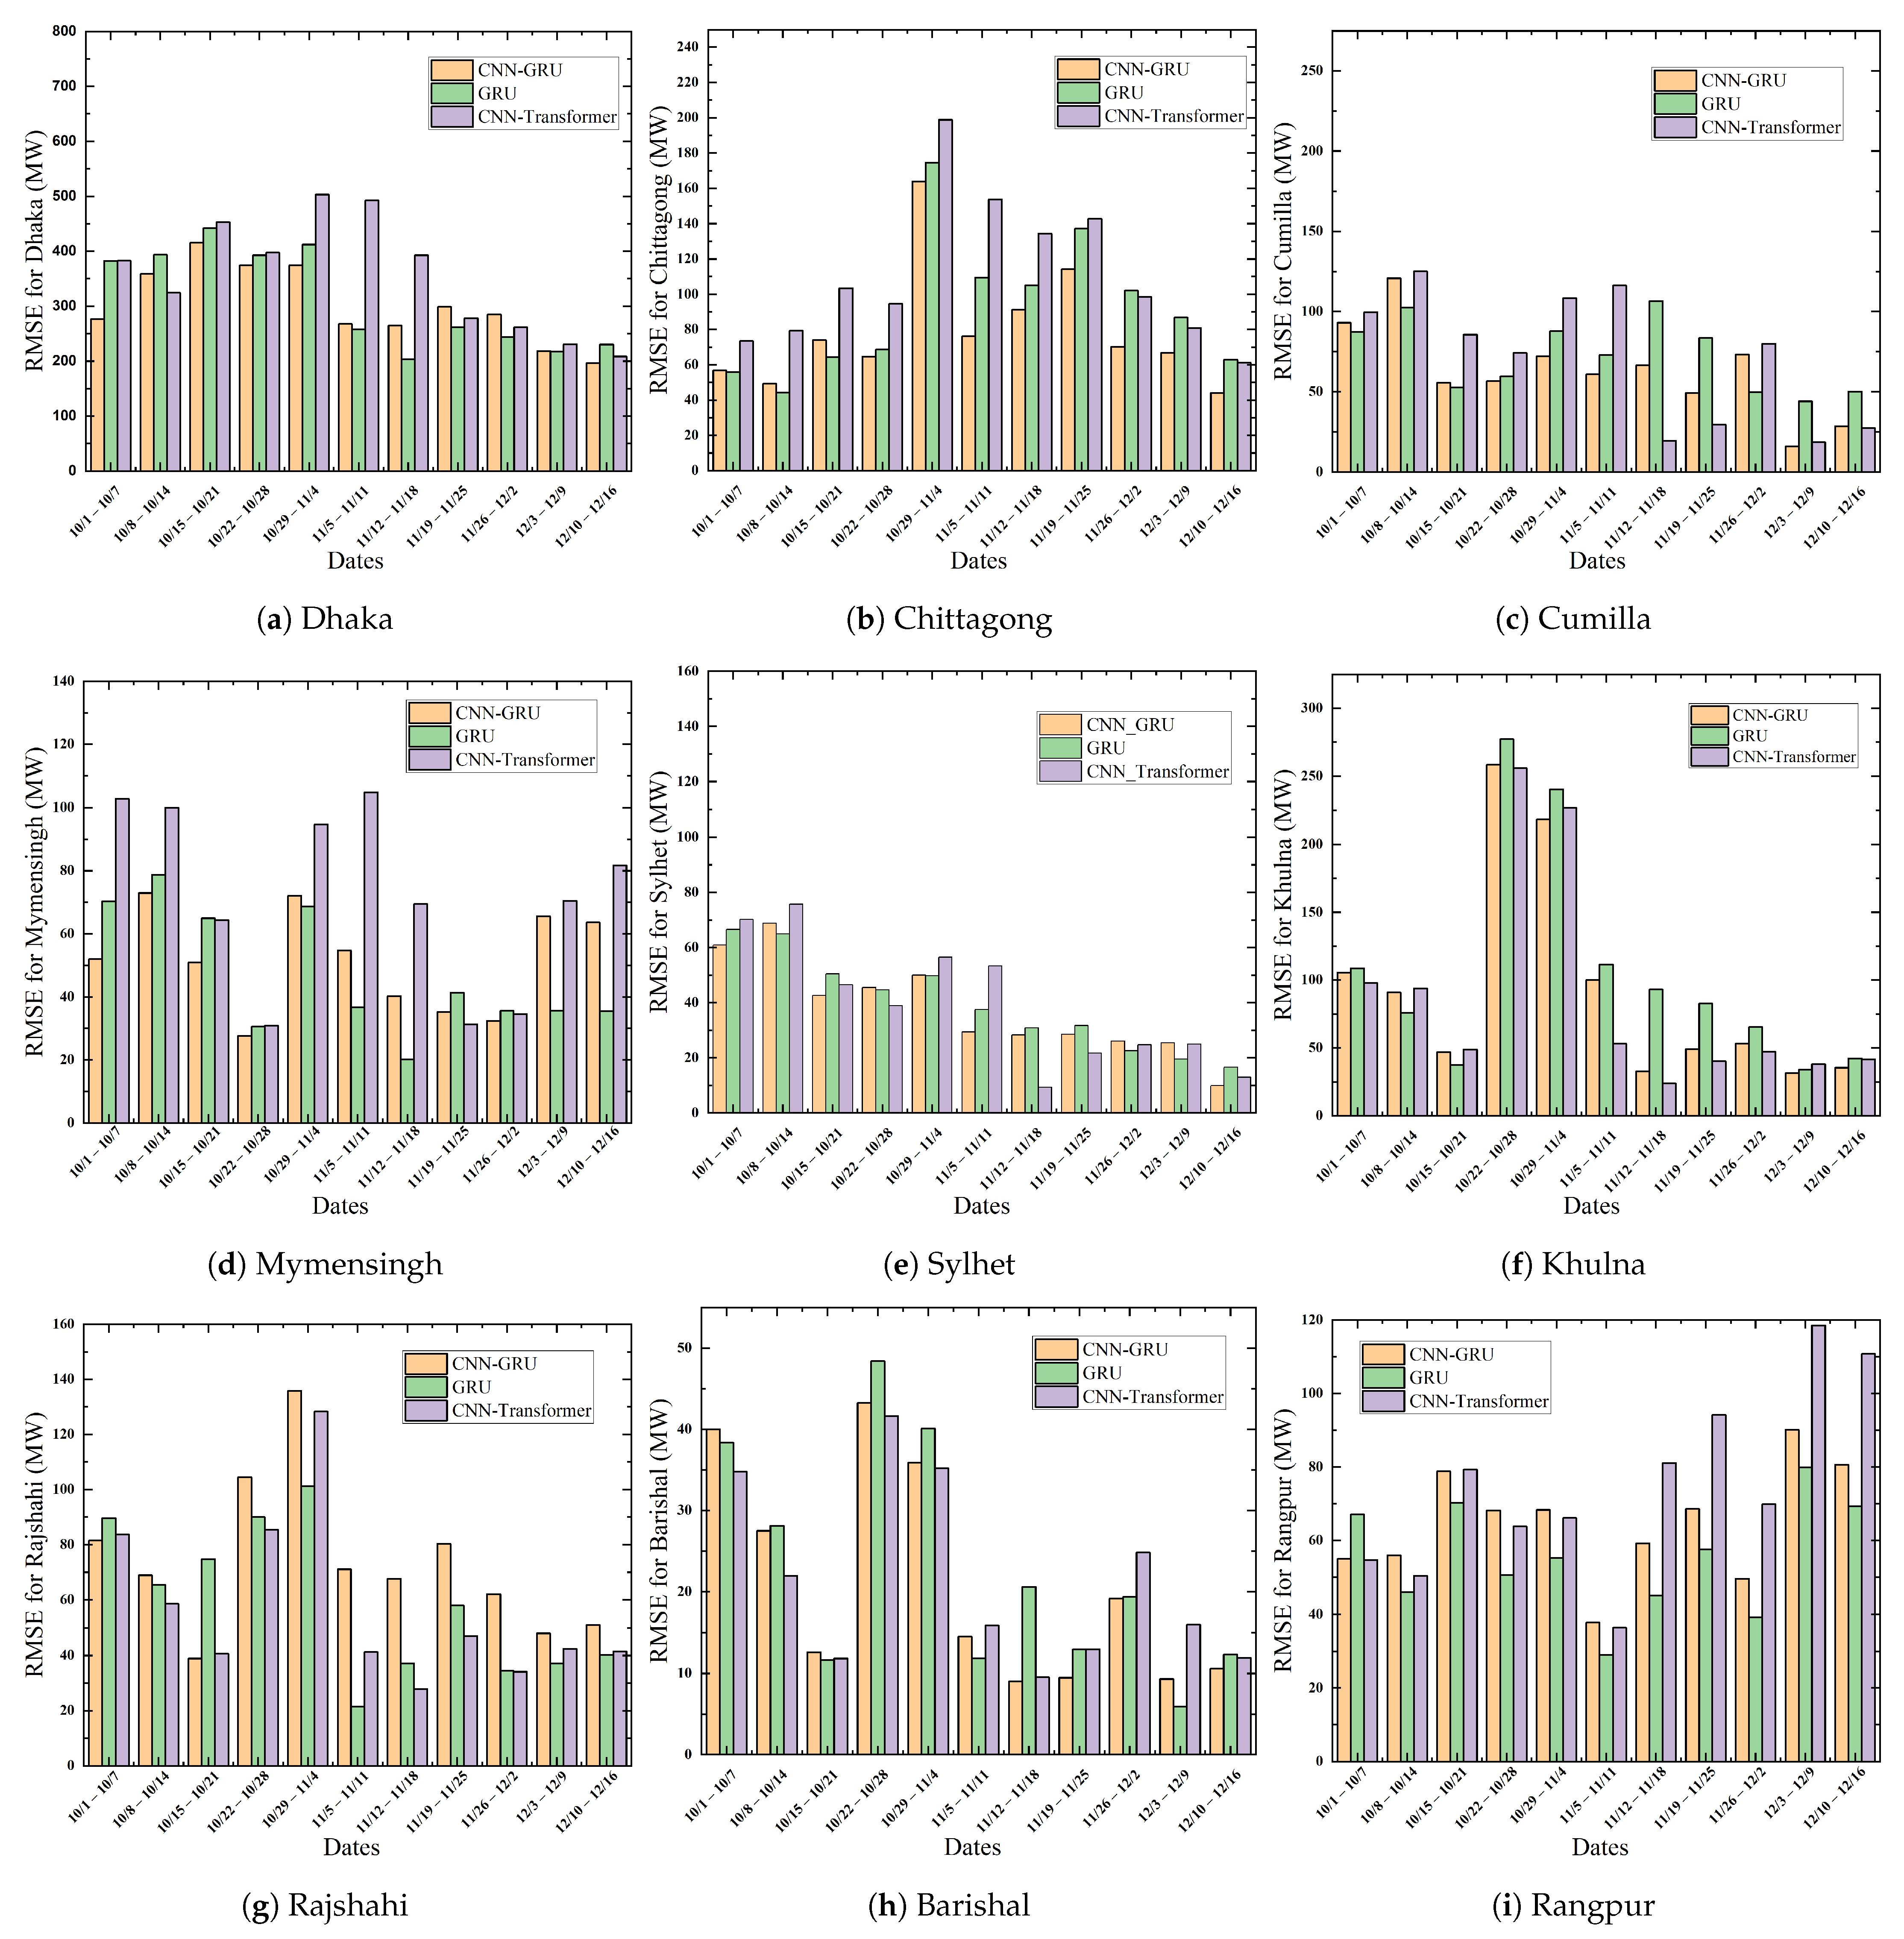
The real-world power system is massive and very complex. The power system’s highly non-linear properties and randomness introduce prediction challenges. This can be observed in the figures where the actual data consist of sudden variations. To keep the illustrations clear and concise, we showcase the prediction outcomes of only the three top-scoring models: CNN-GRU, GRU, and CNN-Transformer. The figures verify that the CNN-GRU model can follow the demand trend more closely than other models. Table 4 compares the MAPE of several models over a seven-day forecasting period in nine distinct zones for the time period between July and December 2022. The RMSE error obtained from different models for the same time period is listed in Table 5. The MAPE scores of the naive predictor for nine different zones are 0.0539, 0.0641, 0.0845, 0.0729, 0.1227, 0.0689, 0.0583, 0.0977, and 0.0774, respectively, and for the corresponding areas, the RMSE scores are 310.9725, 100.9114, 132.3682, 94.7536, 76.7995, 135.4886, 98.0518, 43.4898, and 74.0442. Evidently, the proposed CNN-GRU model is more effective than the naive baseline as well as other DL approaches, achieving the least MAPE of 0.0544 in the Chittagong Region and the highest score of 0.0905 in Sylhet. Similarly, the lowest and highest RMSE scores of the proposed model are 33.5080 and 378.2723, respectively, for Barishal and Dhaka. In comparison, the second best model, namely GRU, achieved MAPE score ranging from 0.0602 to 0.0931 across all division on test data. The proposed model significantly outperforms GRU in all of the regions. We have investigated the outcome of famous transformer architecture on our task. Among the transformer models, only the CNN-Transformer hybrid approach performed better, obtaining the least RMSE of 33.1362 in Barishal and the highest of 434.7402 in Dhaka. In comparison, the proposed technique performed 15.98% and 25.37% better in these two regions, respectively. Although CNN-Transformer performed better than the proposed method in Barishal Division, both RMSE and MAPE scores are close for both models. The graphical representation in Figure 9 illustrates the forecast results for the nine regions spanning from July 2022 to April 2023. The figures validate the seasonal variations as shown in our prediction curve during the summer, winter, spring, and autumn months. It is worth noting that, in certain regions, as the prediction timeframe extends further from the training period, the models exhibit suboptimal performance. This can be attributed to the limitation of traditional DL models, as these algorithms require complete retraining with new observations. MAPE error rates for all the weeks from July to December 2022 are illustrated in Figure 10 concerning the three best-performing models. Similarly, the RMSE scores for the same observation periods are depicted in Figure 11. Overall, CNN-GRU achieved the lowest MAPE error across the observation periods for all regions.
5. Conclusions

STLF significantly contributes to the planning and control of modern smart grid systems. While research in STLF mainly focuses on predicting load demand in particular regions, our study revealed that learning the load dynamic in the different areas also increases forecasting accuracy. This study proposes CNN-GRU, a hybrid deep learning approach that simultaneously predicts the week-ahead load demand of nine different power zones. This hybrid approach allows the CNN to be used as a feature extractor while GRU learns the temporal dynamics of the load demand. The historical demand dataset of this study is developed from the daily records of PGCB from 2014 to 2023. Due to the uncertain nature of the power demand, it consists of many noise and outlier components. We have adopted IQR and load-averaging techniques to fix the outliers. Moreover, we have employed data augmentation by employing linear interpolation to increase model performance. The proposed model is compared with other widely used DL approaches such as LSTM, GRU, CNN-LSTM, and Transformer using MAPE and RMSE. Achieving better forecasting accuracy in all regions is challenging, but overall, CNN-GRU outperformed the other models, reaching the lowest error score in most of the nine areas. Although we augmented the daily demand data, using hourly or half-hourly data could further improve the accuracy of our model by providing more precise information on the trends and patterns in the data. We did not consider weather parameters such as temperature and humidity as they lack a strong correlation with the other parameters in our dataset. This finding is inconsistent with the previous literature, suggesting that weather-related features may not significantly impact the accuracy of electrical load forecasting for countries with a relatively stable climate, such as subtropical regions like Bangladesh. The dataset and the developed system are fully accessible to motivate further research. Despite being successful in many sequence learning tasks, the Transformer fails to perform better than CNN-GRU. This may be due to the higher complexity of its structure. However, it might demonstrate superior performance for longer intervals. Thus, in the future, we aim to investigate the performance of Transformer-based models for mid-term and long-term load forecasting. We also plan to explore strategies for decomposing time series and leverage the trend, seasonality, and residual data as features in combination with hybrid machine learning approaches to develop a powerful load forecasting system.

Author Contributions

Conceptualization, G.C.S. and A.B.; methodology, G.C.S.; software, G.C.S.; validation, G.C.S. and A.B.; formal analysis, A.B.; investigation, A.B. and G.C.S.; resources, G.C.S.; data curation, G.C.S.; writing—original draft preparation, A.B. and G.C.S.; writing—review and editing, G.C.S., A.B., P.S. and U.M.; visualization, G.C.S. and A.B.; supervision, A.A.; project administration, A.A.; funding acquisition, A.A. All authors have read and agreed to the published version of the manuscript.

Funding

This research received no external funding.

Institutional Review Board Statement

Not applicable.

Informed Consent Statement

Not applicable.

Data Availability Statement

The dataset as well as the source code is made openly accessible in the github repository (https://github.com/gcsarker/Multiple-Regions-STLF (accessed on 20 October 2023)).

Conflicts of Interest

The authors declare no conflicts of interest.

Abbreviations

The following abbreviations are used in this manuscript:
CNNConvolutional Neural Network
DLDeep Learning
GRUGated Recurrent Unit
LFLoad Forecasting
LSTMLong Short-Term Memory Network
MAPEMean Absolute Percentage Error
MLMachine Learning
PGCBPower Grid Company of Bangladesh
RMSERoot Mean Squared Error
STLFShort-Term Load Forecasting

References

  1. Habbak, H.; Mahmoud, M.; Metwally, K.; Fouda, M.M.; Ibrahem, M.I. Load Forecasting Techniques and Their Applications in Smart Grids. Energies 2023, 16, 1480. [Google Scholar] [CrossRef]
  2. Zhang, W.; Chen, Q.; Yan, J.; Zhang, S.; Xu, J. A novel asynchronous deep reinforcement learning model with adaptive early forecasting method and reward incentive mechanism for short-term load forecasting. Energy 2021, 236, 121492. [Google Scholar] [CrossRef]
  3. Dewangan, F.; Abdelaziz, A.Y.; Biswal, M. Load Forecasting Models in Smart Grid Using Smart Meter Information: A Review. Energies 2023, 16, 1404. [Google Scholar] [CrossRef]
  4. Liao, Z.; Pan, H.; Huang, X.; Mo, R.; Fan, X.; Chen, H.; Liu, L.; Li, Y. Short-term load forecasting with dense average network. Expert Syst. Appl. 2021, 186, 115748. [Google Scholar] [CrossRef]
  5. Alotaibi, M.; Ibrahem, M.I.; Alasmary, W.; Al-Abri, D.; Mahmoud, M. UBLS: User-Based Location Selection Scheme for Preserving Location Privacy. In Proceedings of the 2021 IEEE International Conference on Communications Workshops (ICC Workshops), Montreal, QC, Canada, 14–23 June 2021; pp. 1–6. [Google Scholar]
  6. Matrenin, P.; Safaraliev, M.; Dmitriev, S.; Kokin, S.; Ghulomzoda, A.; Mitrofanov, S. Medium-term load forecasting in isolated power systems based on ensemble machine learning models. Energy Rep. 2022, 8, 612–618. [Google Scholar] [CrossRef]
  7. Inteha, A.; Nahid-Al-Masood; Hussain, F.; Khan, I.A. A Data Driven Approach for Day Ahead Short Term Load Forecasting. IEEE Access 2022, 10, 84227–84243. [Google Scholar] [CrossRef]
  8. Kong, W.; Dong, Z.Y.; Jia, Y.; Hill, D.J.; Xu, Y.; Zhang, Y. Short-term residential load forecasting based on LSTM recurrent neural network. IEEE Trans. Smart Grid 2017, 10, 841–851. [Google Scholar] [CrossRef]
  9. Xu, A.; Tian, M.W.; Firouzi, B.; Alattas, K.A.; Mohammadzadeh, A.; Ghaderpour, E. A New Deep Learning Restricted Boltzmann Machine for Energy Consumption Forecasting. Sustainability 2022, 14, 10081. [Google Scholar] [CrossRef]
  10. Tarmanini, C.; Sarma, N.; Gezegin, C.; Ozgonenel, O. Short term load forecasting based on ARIMA and ANN approaches. Energy Rep. 2023, 9, 550–557. [Google Scholar] [CrossRef]
  11. Kouroupetroglou, P.N.; Tsoumakas, G. Machine Learning Techniques for Short-Term Electric Load Forecasting; Aristotle University of Thessaloniki: Thessaloniki, Greece, 2017. [Google Scholar]
  12. Srivastava, A.K.; Pandey, A.S.; Houran, M.A.; Kumar, V.; Kumar, D.; Tripathi, S.M.; Gangatharan, S.; Elavarasan, R.M. A Day-Ahead Short-Term Load Forecasting Using M5P Machine Learning Algorithm along with Elitist Genetic Algorithm (EGA) and Random Forest-Based Hybrid Feature Selection. Energies 2023, 16, 867. [Google Scholar] [CrossRef]
  13. Phyo, P.P.; Jeenanunta, C. Advanced ml-based ensemble and deep learning models for short-term load forecasting: Comparative analysis using feature engineering. Appl. Sci. 2022, 12, 4882. [Google Scholar] [CrossRef]
  14. Yao, X.; Fu, X.; Zong, C. Short-term load forecasting method based on feature preference strategy and LightGBM-XGboost. IEEE Access 2022, 10, 75257–75268. [Google Scholar] [CrossRef]
  15. Ribeiro, M.H.D.M.; da Silva, R.G.; Ribeiro, G.T.; Mariani, V.C.; dos Santos Coelho, L. Cooperative ensemble learning model improves electric short-term load forecasting. Chaos Solitons Fractals 2023, 166, 112982. [Google Scholar] [CrossRef]
  16. Ibrahim, B.; Rabelo, L.; Gutierrez-Franco, E.; Clavijo-Buritica, N. Machine learning for short-term load forecasting in smart grids. Energies 2022, 15, 8079. [Google Scholar] [CrossRef]
  17. Wang, Y.; Guo, P.; Ma, N.; Liu, G. Robust Wavelet Transform Neural-Network-Based Short-Term Load Forecasting for Power Distribution Networks. Sustainability 2023, 15, 296. [Google Scholar] [CrossRef]
  18. Ran, P.; Dong, K.; Liu, X.; Wang, J. Short-term load forecasting based on CEEMDAN and Transformer. Electr. Power Syst. Res. 2023, 214, 108885. [Google Scholar] [CrossRef]
  19. Sehovac, L.; Grolinger, K. Deep learning for load forecasting: Sequence to sequence recurrent neural networks with attention. IEEE Access 2020, 8, 36411–36426. [Google Scholar] [CrossRef]
  20. Gunawan, J.; Huang, C.Y. An extensible framework for short-term holiday load forecasting combining dynamic time warping and LSTM network. IEEE Access 2021, 9, 106885–106894. [Google Scholar] [CrossRef]
  21. Hossain, M.S.; Mahmood, H. Short-Term Load Forecasting Using an LSTM Neural Network. In Proceedings of the 2020 IEEE Power and Energy Conference at Illinois (PECI), Champaign, IL, USA, 27–28 February 2020; pp. 1–6. [Google Scholar]
  22. Li, D.; Sun, G.; Miao, S.; Gu, Y.; Zhang, Y.; He, S. A short-term electric load forecast method based on improved sequence-to-sequence GRU with adaptive temporal dependence. Int. J. Electr. Power Energy Syst. 2022, 137, 107627. [Google Scholar] [CrossRef]
  23. Ijaz, K.; Hussain, Z.; Ahmad, J.; Ali, S.F.; Adnan, M.; Khosa, I. A novel temporal feature selection based LSTM model for electrical short-term load forecasting. IEEE Access 2022, 10, 82596–82613. [Google Scholar] [CrossRef]
  24. Abumohsen, M.; Owda, A.Y.; Owda, M. Electrical load forecasting using LSTM, GRU, and RNN algorithms. Energies 2023, 16, 2283. [Google Scholar] [CrossRef]
  25. LeCun, Y.; Bengio, Y.; Hinton, G. Deep learning. Nature 2015, 521, 436–444. [Google Scholar] [CrossRef] [PubMed]
  26. Amarasinghe, K.; Marino, D.L.; Manic, M. Deep neural networks for energy load forecasting. In Proceedings of the 2017 IEEE 26th International Symposium on Industrial Electronics (ISIE), Edinburgh, UK, 19–21 June 2017; pp. 1483–1488. [Google Scholar]
  27. Haque, S.A.; Sarker, G.C.; Sadat, K.M. Short-Term Electrical Load Prediction for Future Generation Using Hybrid Deep Learning Model. In Proceedings of the 2022 International Conference on Advancement in Electrical and Electronic Engineering (ICAEEE), Gazipur, Bangladesh, 24–26 February 2022; pp. 1–6. [Google Scholar]
  28. Khan, N.; Haq, I.U.; Khan, S.U.; Rho, S.; Lee, M.Y.; Baik, S.W. DB-Net: A novel dilated CNN based multi-step forecasting model for power consumption in integrated local energy systems. Int. J. Electr. Power Energy Syst. 2021, 133, 107023. [Google Scholar] [CrossRef]
  29. Alrasheedi, A.; Almalaq, A. Hybrid Deep Learning Applied on Saudi Smart Grids for Short-Term Load Forecasting. Mathematics 2022, 10, 2666. [Google Scholar] [CrossRef]
  30. Sekhar, C.; Dahiya, R. Robust framework based on hybrid deep learning approach for short term load forecasting of building electricity demand. Energy 2023, 268, 126660. [Google Scholar] [CrossRef]
  31. Chen, X.; Chen, W.; Dinavahi, V.; Liu, Y.; Feng, J. Short-Term Load Forecasting and Associated Weather Variables Prediction Using ResNet-LSTM Based Deep Learning. IEEE Access 2023, 11, 5393–5405. [Google Scholar] [CrossRef]
  32. Qu, K.; Si, G.; Shan, Z.; Wang, Q.; Liu, X.; Yang, C. Forwardformer: Efficient Transformer with Multi-Scale Forward Self-Attention for Day-Ahead Load Forecasting. IEEE Trans. Power Syst. 2023, 39, 1421–1433. [Google Scholar] [CrossRef]
  33. Yuan, Y.; Chen, Z.; Wang, Z.; Sun, Y.; Chen, Y. Attention mechanism-based transfer learning model for day-ahead energy demand forecasting of shopping mall buildings. Energy 2023, 270, 126878. [Google Scholar] [CrossRef]
  34. Ribeiro, A.M.N.; do Carmo, P.R.X.; Endo, P.T.; Rosati, P.; Lynn, T. Short-and very short-term firm-level load forecasting for warehouses: A comparison of machine learning and deep learning models. Energies 2022, 15, 750. [Google Scholar] [CrossRef]
  35. Baul, A.; Sarker, G.C.; Sadhu, P.K.; Yanambaka, V.P.; Abdelgawad, A. XTM: A Novel Transformer and LSTM-Based Model for Detection and Localization of Formally Verified FDI Attack in Smart Grid. Electronics 2023, 12, 797. [Google Scholar] [CrossRef]
  36. Vaswani, A.; Shazeer, N.; Parmar, N.; Uszkoreit, J.; Jones, L.; Gomez, A.N.; Kaiser, Ł.; Polosukhin, I. Attention is all you need. Adv. Neural Inf. Process. Syst. 2017, 30, 5998–6008. [Google Scholar]
Figure 1. An unit GRU block. Here X ( t ) = input variable at time t; C ( t ) , C ( t 1 ) = hidden state output at time t and ( t 1 ) .
Bdcc 08 00012 g001
Figure 2. A CNN architecture.
Bdcc 08 00012 g002
Figure 3. Flow chart representing the workflow of this study.
Bdcc 08 00012 g003
Figure 4. Load demand of nine regions from 2014 to 2022.
Bdcc 08 00012 g004
Figure 5. Box plot of the total load demand from 2014 to 2022.
Bdcc 08 00012 g005
Figure 6. Handling outlier measurements with IQR and load averaging. (a) Before and after handling outliers of load demand in Cumilla region. (b) Before and after handling outliers of load demand in Khulna region.
Bdcc 08 00012 g006
Figure 8. Structure of the proposed CNN-GRU model.
Bdcc 08 00012 g008
Figure 9. Load demand prediction for nine regions from July 2022 to April 2023 using GRU, CNN-Transformer, and the proposed CNN-GRU method.
Bdcc 08 00012 g009
Figure 10. MAPE loss of different weeks in nine regions for October, November, and December.
Bdcc 08 00012 g010
Figure 11. RMSE for different weeks in nine regions for October, November, and December.
Bdcc 08 00012 g011
Table 2. Parameters of an unit GRU block.
VariableMeaning
x ( t ) Input from training dataset
c ( t 1 ) Hidden state from previous timestep
c ( t ) Output hidden state of the unit cell
σ and tanh Activation function
R t Reset gate (Outputs [−1, 1])
Z t Update gate (Outputs [0, 1])
W u , W r , W c Learnable parameters
b u , b r , b c Bias values
Table 3. Hyperparameters of the proposed hybrid CNN-GRU model.
ParameterSetting
OptimizerAdam
Activation functionRelu (CNN), tanh(GRU)
Loss functionMean squared error (MSE)
Learning rate 10 5
Batch size64
Epoch100
Time lag20 days look back
Train functiongradient descent
Dropout0.1
Number of hidden units128 (CNN), 64 (GRU)
Table 4. Week-ahead forecasting MAPE scores on the test dataset for various models spanning from July to December 2022.
ModelDhakaChittagongComillaMymensinghSylhetkhulnaRajshahiBarishalRangpur
Naive Predictor0.05390.06410.08450.07290.12270.06890.05830.09770.0774
Transformer0.09390.06810.07610.09220.09330.06190.06480.07490.1092
Transformer-LSTM0.11170.08710.08140.08320.10070.07970.08760.10880.1041
CNN-Transformer0.08700.07160.07160.08010.09110.05490.06190.07620.0882
LSTM0.10940.07660.08200.10310.09860.07920.06800.08760.1085
CNN-LSTM0.10720.06830.09940.10420.10460.07620.07800.08560.0894
GRU0.08970.06020.07630.06270.09310.06960.07950.08780.0908
CNN-GRU0.07490.05440.07040.06230.09050.05670.06470.07570.0782
Table 5. Week-ahead forecasting RMSE scores on the test dataset for various models spanning from July to December 2022.
ModelDhakaChittagongCumillaMymensinghSylhetkhulnaRajshahiBarishalRangpur
Naive Predictor310.9725100.9114132.368294.753676.7995135.488698.051843.489874.0442
Transformer469.0362107.0261108.3956105.593259.3066114.3125104.304832.671499.9648
CNN-Transformer434.7402113.7197107.698093.599958.4233108.5053101.662133.136279.0824
Transformer-LSTM539.9371132.2475115.1292102.625365.5684138.2863133.716642.829695.3580
LSTM533.1599120.9533120.9803127.322363.6375146.2571111.722536.6356104.2182
CNN-LSTM523.2939106.9882141.4147127.659766.5430135.7652124.204535.264484.1895
GRU459.561895.2821109.674380.223959.3868125.3311131.545237.931089.2588
CNN-GRU378.272987.3899105.866874.876757.9106108.753098.799433.508071.7949
Disclaimer/Publisher’s Note: The statements, opinions and data contained in all publications are solely those of the individual author(s) and contributor(s) and not of MDPI and/or the editor(s). MDPI and/or the editor(s) disclaim responsibility for any injury to people or property resulting from any ideas, methods, instructions or products referred to in the content.