Article

Threat Hunting Architecture Using a Machine Learning Approach for Critical Infrastructures Protection

by
Mario Aragonés Lozano
*,
Israel Pérez Llopis
and
Manuel Esteve Domingo
Department of Communications, Universitat Politècnica de València, 46022 Valencia, Spain
*
Author to whom correspondence should be addressed.
Big Data Cogn. Comput. 2023, 7(2), 65; https://doi.org/10.3390/bdcc7020065
Submission received: 8 February 2023 / Revised: 10 March 2023 / Accepted: 23 March 2023 / Published: 30 March 2023

Abstract

:
The number and the diversity in nature of daily cyber-attacks have increased in the last few years, and trends show that both will grow exponentially in the near future. Critical Infrastructures (CI) operators are not excluded from these issues; therefore, CIs’ Security Departments must have their own group of IT specialists to prevent and respond to cyber-attacks. To introduce more challenges in the existing cyber security landscape, many attacks are unknown until they spawn, even a long time after their initial actions, posing increasing difficulties on their detection and remediation. To be reactive against those cyber-attacks, usually defined as zero-day attacks, organizations must have Threat Hunters at their security departments that must be aware of unusual behaviors and Modus Operandi. Threat Hunters must face vast amounts of data (mainly benign and repetitive, and following predictable patterns) in short periods to detect any anomaly, with the associated cognitive overwhelming. The application of Artificial Intelligence, specifically Machine Learning (ML) techniques, can remarkably impact the real-time analysis of those data. Not only that, but providing the specialists with useful visualizations can significantly increase the Threat Hunters’ understanding of the issues that they are facing. Both of these can help to discriminate between harmless data and malicious data, alleviating analysts from the above-mentioned overload and providing means to enhance their Cyber Situational Awareness (CSA). This work aims to design a system architecture that helps Threat Hunters, using a Machine Learning approach and applying state-of-the-art visualization techniques in order to protect Critical Infrastructures based on a distributed, scalable and online configurable framework of interconnected modular components.

1. Introduction

In today’s hyper-connected world, the dependency on the internet of production processes and activities is absolute, leaving useless any service offered, not only by big companies, agencies and SMEs (Small and Medium Enterprises), but also by critical infrastructures if internet access is lost, even for a few hours, thus leading to substantial economic losses and high severity cascading effects. This fact is well-known and exploited by cybercriminals who set cyber-attacks the order of the day.
To prevent cyber-attacks or, at least, to address them properly, critical infrastructures are investing big amounts of money in the improvement of their Information Technology (IT) security departments by making them bigger. The desired outcome is to avoid data loss, data exfiltration, maintain the reputation, and, probably the most important concern, minimize any impact in business continuity. Whether or not the previously stated desired outcomes are achieved by increasing in number the employee workforce, it is needed to continuously invest in highly skilled and specialized personnel who, without specific and useful tools, may end up overflowed by vast amounts of near real-time data and are unable to spot complex attacks, which are very quiet and remain in the protected infrastructure for a long time.
Nevertheless, a huge amount of the actionable data, both in the network and host, are related to harmless actions of the employees (such as DNS requests or WEB browsing). Moreover, surveys conducted with Threat Hunters [1] on the traits of those datasets concluded that there were specific and characterizable patterns for each of the studied actions, resulting in them being harmless or potentially dangerous. Being that Machine Learning is a scientific field characterized by providing outstanding techniques and procedures in extracting models from raw data [2], it follows that using well-designed, adequately tuned and scenario-customized ML algorithms can be helpful in classifying data samples according to how benign or malign they are.
Furthermore, according to several studies [3,4,5], human cognition tends to predict words, patterns, etc. strongly influenced by the context [6], even further if they seem to be under stress conditions [7]. In fact, those stressful conditions are suffered by Threat Hunters when they must face big amounts of data in highly dynamic scenarios where the smallest mistake can have a very high impact. Moreover, Threat Hunting is a complex decision-making process that encompasses many uncontrolled factors, typically working with limited and incomplete information and possibly facing unknown scenarios, for instance, zero-day attacks [8]. As a consequence, paying attention to the previously stated strong dependency on context in prediction by human cognition, an attack quite similar in behavior to a non-attack could be seen as such due to human bias; however, a Machine Learning system could discriminate between both more accurately than humans do. Thus, with all the data provided by the output of ML systems (such as likelihoods, feasibility thresholds, etc.), Threat Hunters could be able to understand better what is going on at the operations theater.
Moreover, it is well known that the human brain processes visual patterns more quickly and accurately than any textual or speech report, gaining understanding at a glimpse, and this, naturally, also happens in cybersecurity [9,10]; as a consequence, representing the data (both raw and ML processed data) properly is also a decisive factor for Threat Hunters in order to achieve Situational Awareness [11,12] and therefore an early detection of any threat. Some studies have been trying to classify which advanced visualization fits best for each kind of attack [13,14].
Lastly, using both Machine Learning and specifically defined data visualizations, Threat Hunters will be able to generate hypotheses about what is going on in their systems and networks, being able to quickly detect any threat and even have enough context information to deal with it.
Systems capable of gathering all those huge amounts of data, processing them (including Machine Learning techniques) and providing insightful visualization techniques must be developed following a properly designed architecture in accordance to the challenges that such an ambitious approach must face. The most relevant contribution of this work is an architecture proposal and its implementation devoted to fulfill the stated needs. The proposed architecture must provide means for dynamic and adaptable addition of ML techniques at will and the selection of which to use from the existing ones at a given moment. In addition, big data must be taken into account for vast amounts of data that must be stored and analyzed. Moreover, due to the time-consuming nature of ML processing, the architecture must enforce parallelization of as many processes as possible; therefore, architecture components must be orchestrated to maximize this parallelism. Furthermore, asymmetric scalability must be enforced in order to be efficient; thus, means should be instantiated to guarantee that only necessary components are working at a certain time. The architecture must be implemented in a distributed approach; therefore, communications, synchronization and decoupling of components and processing must be carefully envisioned and designed. Lastly, but not least, the whole system must be secured regarding the type of data it will process.

2. Motivation and Previous Work

The use of Machine Learning techniques in the field of Threat Hunting is booming: The research An enhanced stacked LSTM method with no random initialization for malware threat hunting in safety and time-critical systems [15] is focused on Time-Critical systems, paying attention to the conditions of those fast-paced situations, benefiting from the automation and effectiveness of malware detection that ML can provide. Both Intelligent threat hunting in software-defined networking [16] and Advanced threat hunting over software-defined networks in smart cities [17] are focused on developing intelligent Threat Hunting approaches on Software-Defined Networks (SDNs). In contrast, other efforts such as A deep recurrent neural network based approach for internet of things malware threat hunting [18] and A survey on cross-architectural IoT malware threat hunting [19] are more oriented toward the Internet of Things (IoT), a relevant area in the Threat Hunting community where the ML approaches provide benefits for the IoT specificities, for instance, resource scarceness as computational capabilities, among others. Finally, there also are works existing in the literature which try to solve the problem in a general perspective of ML applied to Threat Hunting, such as Know abnormal, find evil: frequent pattern mining for ransomware threat hunting and intelligence [20] and Cyber threat hunting through automated hypothesis and multi-criteria decision making [21].
Studies trying to develop a Threat Hunting architecture using an ML approach have already been conducted. First of all, the article ETIP: An Enriched Threat Intelligence Platform for improving OSINT correlation, analysis, visualization and sharing capabilities [22] can be found in the literature. In that work, an architecture which includes all steps, from data collection to data shown, is proposed; despite that, it is focused on generating IoCs (Indicators of Compromise) and it suggests using ML in some steps of the process. Another interesting work is PURE: Generating Quality Threat Intelligence by Clustering and Correlating OSINT [23]. This work, similar to the previous one, tries to develop an architecture to generate and enrich IoCs using ML at some steps. It gives another perspective on how to do it, despite the fact that it does not take into account the visualization of the results. It is interesting to highlight that neither of them define how to generate hypotheses using the generated data. Finally, the approach SYNAPSE: A framework for the collection, classification, and aggregation of tweets for security purposes [24] offers a wide and well-designed architecture, from data collectors to contents in visualization, although it is developed for a very specific data source (Twitter). Notwithstanding all the efforts already done, there are no specific studies about Threat Hunting using a Machine Learning approach for Critical Infrastructures in which an architecture is due to cope with all the stated needs that are proposed and neither the definition of useful nor specific visualizations are provided.
Regarding useful and specific visualizations for Cyber Situational Awareness, there is a very relevant work done in Cyber Defense and Situational Awareness [25] which states that “Visual analytics focuses on analytical reasoning using interactive visualizations”. In order to support the previous statement, there is a comprehensive and complete survey on the cognitive foundations of visual analytics done in Cognitive foundations for visual analytics [26]. There is a wide variety of visualization techniques. Firstly, basic visualization charts, which include scatter plots [27,28,29], bar charts [30,31,32], pie charts [31] and line charts [32,33,34]. Another kind of simple visualization include word clouds [35,36] and decision trees [37,38]. On the other end of the spectrum, there are advanced visualizations. First are those oriented for pattern detection [39,40,41,42,43]. In addition, there are geo-referenced visualization charts for assets [41,43,44], risks [45,46,47] and threats [41,44]. Furthermore, there are also immersive visualization techniques using 3D models instead of 2D models which have been designed for optimum visualization with an ultra-wide high-definition screen, wrap-around screen or three-dimensional Virtual-Reality (VR) goggles, which allows the user to look around 360 degrees while moving [42,44,48,49,50].
All of them state the difficulties of the Threat Hunting process in terms of situation understanding in a broad threat-characterization landscape, with fast-changing conditions, sometimes unknown new threats, incomplete information and hidden features. Furthermore, several examples of enhancing the process by using ML techniques and useful visualizations can be found.
Besides academia, companies are also trying to develop specific Machine Learning techniques and algorithms for their Threat Hunting products to enrich current visualizations used to understand the cyber situational awareness of the monitored systems. Some offered products that implement ML algorithms are systems for Security Information and Event Management (SIEM), Firewalls, Antiviruses, Instrusion Detection System (IDS) and Intrusion Prevention System (IPS). A few examples are those like Splunk [51], Palo Alto next generation smart Firewalls [52], IBM immune system-based approach to cyber security (IBM X-Force Exchange [53,54]) or even Anomali ThreatStream [55].
After conducting deep research on the current state-of-the-art in the area, it can be concluded that, despite having made several outstanding efforts towards solving specific areas of the problem, there is no effort to define an architecture where implementation is rich enough to generate hypotheses about what is going on the system monitored. As a consequence, there is a lack (1) in the design of a particular unified architecture to help Threat Hunters with a Machine Learning approach with capabilities to define and generate (manually or automatically) hypotheses about what is going on and (2) in the provision of specific and useful visualizations, particularly in the issues detected for Critical Infrastructures (as might be the case of business continuity) and coping with all detected and envisioned scenarios. To fill this gap, an architecture with a specific component to define and generate hypotheses is proposed that must ensure security, scalability, modularity and upgradeability. It must also constitute a proper framework for developing platforms for Threat Hunting based on flexible and adaptable Machine Learning over the time. This work aims to solve this problem and fill the detected gap, mainly in terms of providing a unified framework that interrelates existing different components from data acquisition to knowledge generation (emphasizing the hypothesis generation) and visualization, which, despite being generic, is particularized for Critical Infrastructures Protection.

3. Outline of the System

In a brief and simplified view, a Threat Hunting tool can be seen as a closed-loop system. The system receives continuous and real-time feeds with, potentially, high-volume and diverse data inputs and, by means of some aiding subsystems (in this architecture machine-learning fuelled components), it provides and generates hypotheses on what is going on with confidence estimators or metrics. Those hypotheses and suggestions are provided to the end user, which closes the loop by providing feedback by selecting some selection branches more than others and even pruning complete branches, while seeking what is more likely to be going on with the given data.
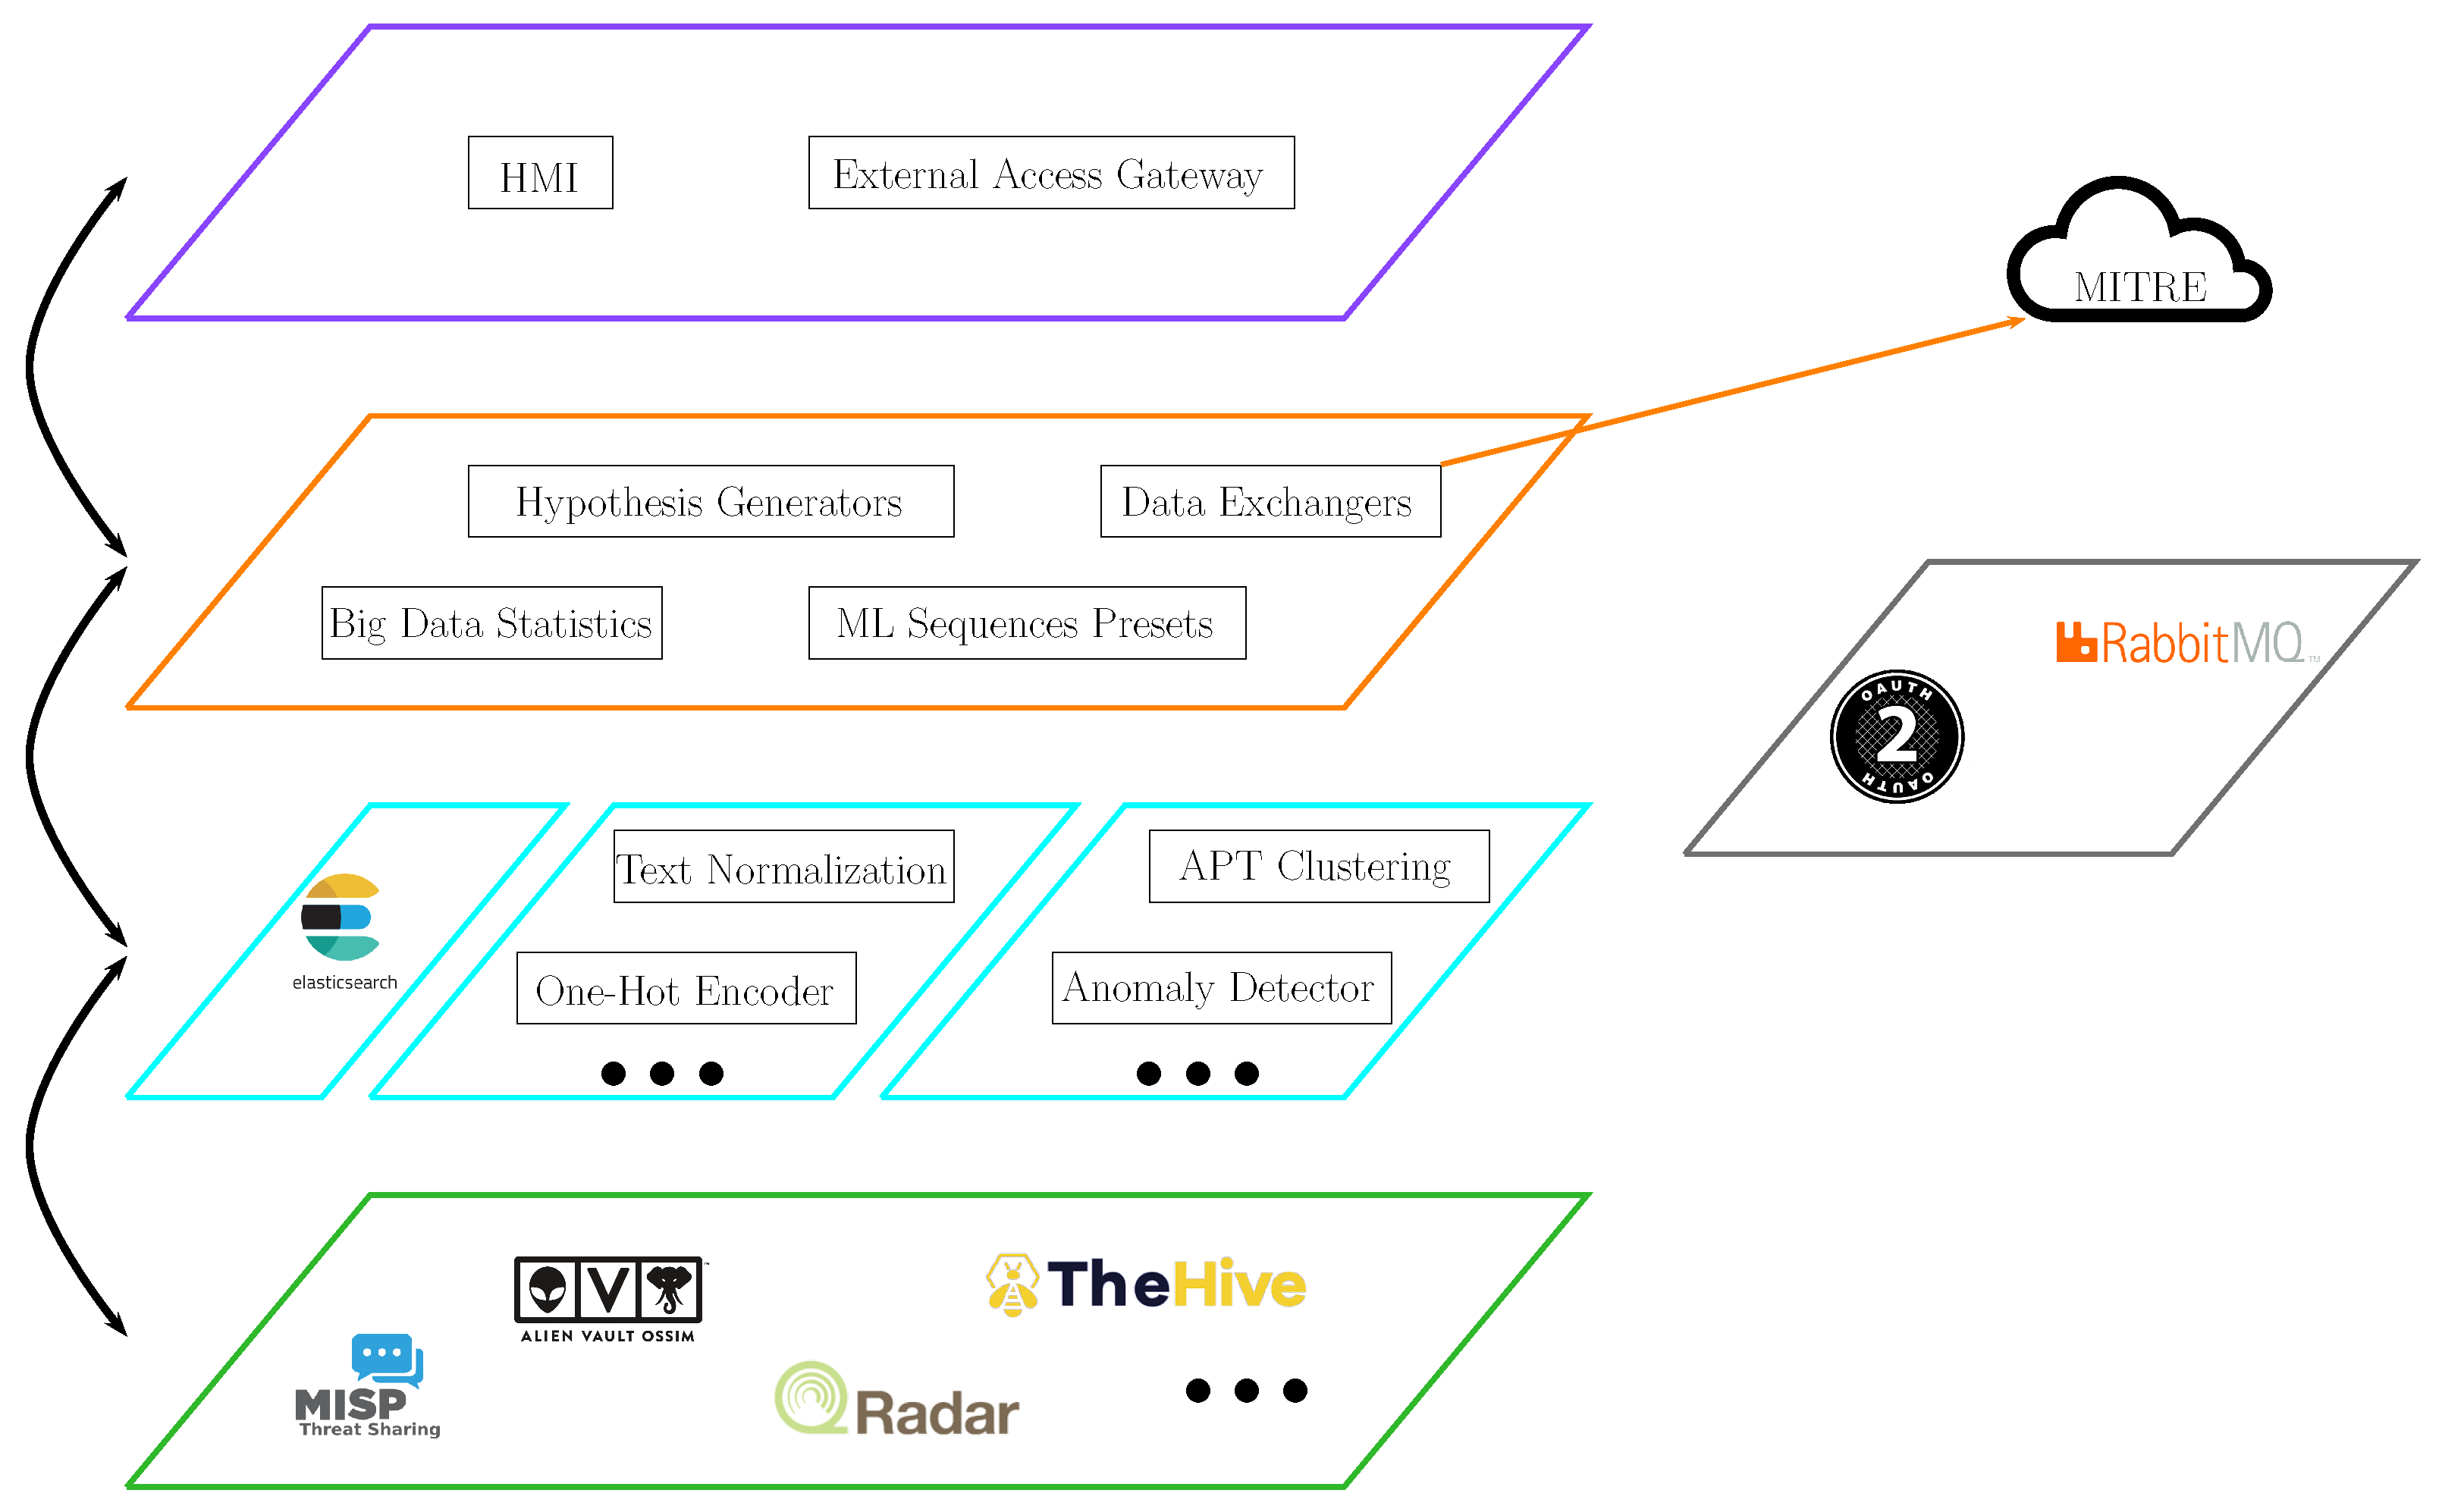
The architecture proposed to help Threat Hunters by using a Machine Learning approach for Critical Infrastructures Protection is described in the following section. It is composed of five main layers interconnected in a stacked manner, as shown in Figure 1. The components within a layer can only communicate one with each other or to other components in adjacent layers. Moreover, components will provide standardized interfaces to communicate among themselves, and reusability will be enforced for their design and implementation.
It is important to state that bias can be introduced in the Threat Hunting process due to the well-known phenomena in interactive hypothesis-confirmation processes such as the valley effect for local versus global searches [56], among others, shown in areas as optimization or genetic algorithm evolutionary fitting [57].
Secondly, this architecture aims to be modular, efficient, and scalable. It is generic enough that it is able to be used in any kind of Critical Infrastructure but never loses focus on the main problems that must be tackled. By defining architecture-wide Application Programming Interfaces (APIs) that must be implemented at any component, creating new ones (components) is straightforward; the only requirement needed is to implement the corresponding interface and to provide mechanisms to notify the rest of the components about its availability. In addition, another relevant requirement is that each component must be completely stateless to allow decoupling and parallelization of processes. Moreover, with the components being stateless, the order of actions to do a simple process is not relevant, and therefore it can be a pool of available elements that dequeue pending tasks and, properly orchestrated, proceed to its completion, receiving all the required metadata (the state) itself.
The proposed architecture is flexible and scalable in terms of resources for its deployment. If resources are scarce, for instance, in debugging or testing or for an SME setup, every involved component can reside in a docker container [58] or in virtual machines [59], and the overall architecture can reside in a single machine. At the other end of the spectrum, where we can find setups with huge amounts of resources, the setup can be clustered using Kubernetes [60] or via cloud using AWS [61] or Azure [61]. From the components perspective, the type of deployment is transparent and seamless.
To achieve that goal, components must be completely decoupled, only knowing the existence of others on a per-needs basis on an orchestrated schema and communicating on standardized and predefined interfaces and mechanisms. That way, inner features of the component are completely isolated to the rest, and flexibility and decoupling can be reached.
This is one outstanding feature of the architecture that can provide flexibility and scalability for easily adapting to different and dynamically changing scenarios, depending on needs and resources. In addition, being able to provide flexibility also makes the architecture optimum for all kinds of Critical Infrastructures, deploying only the modules required for each specific one.
Another essential feature that must enforce the proposed architecture is the capability of providing High Availability (HA) [62] to guarantee service continuity (one of the main concerns of Critical Infrastructures) even in degraded conditions. To achieve that goal, load-balancing schemas are proposed within the component orchestrator, and, for the key elements (tagged as crucial through the following exposition) whose service must be guaranteed at all stakes for the rest to be able to work, backup instances should be ready in the background to replace the running ones if any issue is detected, therefore avoiding overall system service interruption.
Security is a crucial concern for any cyber security tool. Therefore, the architecture will establish security mechanisms to provide Agreed Security Service Levels in terms of security guarantees. Initially, these Security Service Levels Agreements (SSLAs) will be oriented to the capability of exchanging messages among components, and each component will ensure the authenticity [63] of the transmission; in short, the source’s identity is confirmed and the requested action is allowed.
Another key part of the architecture is the interconnection within platforms implementing it or even with external sources. It does not matter how complex the developed architecture is; if the Section 4.6.2 is deployed, the implemented system will never lose the capability of being interconnected and sharing all kind of knowledge.
If several systems are deployed, creating a federation, the architecture will also provide the ability of sharing data regarding which items are the current active attacks, their input vectors, the IoC, etc. to warn other members of the federation if the system detects similar devices on the monitored network or even alert Threat Hunters which devices might be compromised. This feature is very important because a cyber-attack affecting a Critical Infrastructure can be propagated to another Critical Infrastructure [64].
In a brief summary, the proposed architecture aims to be distributed, self-adaptative, resilient and autopoietic [65], achieving that goal by being flexible, modular, and scalable but never losing the main objective of solving the detected problems in a fast and secure way.
The architecture will enforce the usage of standards at all levels to guarantee interoperability capabilities of the system, both in terms of data acquisition and, eventually, data export. Moreover, the usage of standards will provide sustainability of the life-cycle of developments, both at the hardware and the software faces, as well as flexibility and modularity in the selection and insertion of new elements and the replacement of existing ones. To do so, many different standards are proposed to be implemented and they will be specified in the corresponding sections. Among others, standard COTS (Commercial off-the-shelf) [66] mechanisms will be enforced at several layers of the architecture.
Several data sources will be implemented and feedback from Threat Hunters will be received in order to generate proactive security against threats. All this information, correctly processed, can be used to measure the security levels of the analyzed Critical Infrastructure.

4. System Architecture

The purpose of each layer is described hereunder from the bottom of Figure 1 to the top.

4.1. Layer 1: Data Collectors

The first layer contains the data collectors which are in charge of gathering data to feed the overall system. The collected data will be stored and it will be used by the other components within the system to process it. Both the raw and the processed data will be used to generate hypotheses about what is going on in the monitored infrastructure.
Any kind of data source is suitable to be implemented if it is interesting for Threat Hunters. Some examples of data sources could be:
  • SIEMs, such as AlienVault [67] or IBM QRadar [68].
  • Logs, such as Syslogs from the Operating System (OS), logs from network hardware devices, etc.
  • PCAPs (Packet Captures, files with information about network traffic) [69].
  • Threat Management Platforms (TMP), such as MISP [70].
  • Incident Response Systems, such as The Hive [71] or RT-IR [72].
  • Advanced Persistent Threat (APT) [73] management tools.
  • OSINT (Open Source Intelligence [74]) sources, with their specific need in terms of normalization due to the wide variety of data typologies.

4.2. Layer 2: Database

The data gathered by the collectors will be stored in the database. In addition, every required metadata, which must be persistent over time, will also be stored in the database. Furthermore, the database must provide means for the rest of the components to access the stored data in an efficient and seamless way. Due to the previous statements, the database is a critical element and mandatory to be up and running for all the rest of the components to be working. Therefore, it is considered and shown as a crucial one.
Owing to the high-volume and diverse data stored into the database, this component must provide load-balancing mechanisms to guarantee proper access and pay strong attention to security as well as provide per-user policies per data access.
As a design requirement, all data stored must follow a specific data model that must be used within the overall components of the architecture. This data model must be flexible enough to be ready to adapt easily to changes and integrate new elements in the future. In addition, it must be oriented to store and process data related to events and cyber security. Being sort of the de facto standards, the data model must be compatible with Sigma and YARA rules.
Sigma rules (Generic Signature Format for SIEM Systems) [75,76] is an open and generic signature format that allows specialists to describe log events. In addition, with Sigma, cyber security tools (such as SIEMs) are able to exchange information among them, with the evident benefits that this interoperability can provide. One of the best features of using Sigma rules is its Sigma Converter, which allows Threat Hunters to convert the rules in elements such as Elastic Search Queries, Splunk Searches, as well as their ability to be reused and integrated into many other systems.
The malware analysis technique YARA [77,78] is used to discover malware based on its static character strings (the ones allocated inside the program itself) and signatures. It helps, among other things, to identify and classify malware, find new samples based on family-specific patterns, and identify compromised devices.
When designing the data model and the database structure, it is compulsory to consider several elements among which aspects stand out, such as writing/reading priorities, data storing and indexing. This is a critical element as it is the cornerstone for fast and efficient future complex data searches [79], something mandatory from a big data perspective as the one stood for the proposed architecture.
All this work and effort is needed because of the wide variety of data sources and the diversity of nature and typologies of data (especially those collected from OSINT sources) to be gathered by a system which implements this architecture. Each data source will, potentially, have a different taxonomy and also heterogeneous data that must be processed and adapted to define the data model before storing it into the database. It is evident that having a common taxonomy will provide some sort of quantization noise and it could lead to some information loss; nevertheless, a trade-off will be taken with regards to this aspect.
Adding new data sources is as easy as implementing the matching interface and casting the received data attributes to their closest mapping in the data model.

Proposed Database and Data Model

After conducting the study of the existing data model solutions, it is proposed the usage of the Elastic Common Schema (ECS) [80] because it suits the previously stated necessities due to its wide and general definition of fields related to cyber-data and its extended usage, maturity, wide community of users and third-party tools ecosystem.
In Table 1, the most interesting ECS fields can be found in order to be used with the proposed architecture. Nevertheless, the data model is not limited to those fields, but it can be enlarged if any component of the architecture needs it.
Coupling Elastic Search (ES) as a data repository with ECS is a widely recommended approach due to several reasons. First and mainly, both products come from the same source, thus guaranteeing a long-standing alignment as ECS is defined and in continuous development by Elastic. In addition, Elastic Search is big data enabled by nature [81] and follows HA because it can be clustered.

4.3. Layer 2: Data Preprocessing Components

Raw data, despite being defined in a specific well-designed data model, is not usually suitable for being used, but, when required, it must be preprocessed. Provided that system defined preprocessing techniques are finite and they are not specific for one final element, they can be shared among them.
Regarding the previously set statements, it is considered interesting to have a pool of preprocessing components to perform the required preprocessing techniques. When an ML system is being defined, the ML expert will have the possibility of introducing one step between selecting data from the database and one step between executing the desired ML technique where the selected data will be preprocessed according to the chosen preprocessing techniques. Furthermore, there must be the possibility of adding, upgrading or removing those components according to the necessities of the system.
Some examples of preprocessing components are as follows:
  • Sigma Converters: Sigma Converters components allows to convert Sigma rules [75,76] to Elastic Search Queries, Splunk Searches or any other supported output.
  • Number Normalization: Number normalization components are in charge of modifying a dataset of numbers by generating a new dataset with standard deviation 1 and mean 0, by multiplying all values by a specific factor, setting all minimum values to a specific threshold, etc.
  • Text Normalization: Text normalization components are in charge of modifying texts by removing all forbidden characters, by adapting sentences to a predefined structure, etc.
  • One-Hot Encoders: One-Hot Encoders components convert a categorical classification to a numerical classification by assigning a number to each one of the possible values [82].

4.4. Layer 2: ML Components

Machine Learning has several techniques, algorithms, etc., and they are evolving day by day. Instead of having one big element which contains all the ML knowledge, it is proposed to split it into several small components, each one responsible for doing one specific task. In addition, the components can be added, upgraded or deleted according to the requirements.
It is important to highlight that some ML techniques such as neural networks [83,84,85,86] must have external data such as pre-trained models, etc. Those external files are also taken into account, providing an external repository of data that is ML specific and which can be accessed by every ML component.
Some of the proposed ML components are as follows:
  • APT Clustering: Cluster tactics and techniques with their associated APTs. Thanks to its hierarchical method to cluster and reduce data, the Birch algorithm is proposed [87,88].
  • Anomaly Detection: This detect anomalies at logs and network behavior. Several ML techniques such as DBSCAN [89,90], Isolation Forest [91,92] or One Class Vector Machine [93,94] can be used.
  • NLP: Natural Language Processing is mainly used for generating intelligence from analysts reports [95,96,97].
  • Decision trees: Decision trees is an ML technique based on a process to classify data through a series of rules. The final result is obtained after deriving some specific characteristics from a pre-defined structure of rules [2,98].
  • Neural networks: Several Neural Networks techniques can be used, such as Multi-Layer Perceptron (MLP), Convolutional Neural Network (CNN) and Recurrent Neural Network (RNN), among others [2,99].

4.5. Layer 3: Big Data, Exchangers, and Generators

4.5.1. Big Data Statistics

The overall system is collecting and generating huge amounts of data per second, which makes the work of Threat Hunters difficult because they are not able to process all the data at the proper pace; as a consequence, data is tagged by Threat Hunters manually depending on the level of criticality. In order to help Threat Hunters in tagging those vast amounts of data, this paper proposes the automatization of this process by means of ML.
After this previous stage of data tagging, one step further must be taken in terms of providing means to Threat Hunters to help them in constructing or elaborating Cyber Situational Awareness. To do so, the usage of visualization techniques must be taken to provide valuable insights not easily seen by the human eye [100].
This final step is where big data statistics components make the difference, generating on-demand and real-time specific datasets on what is considered relevant for Threat Hunters.
Some examples could be:
  • Which are the types of attacks that have greater occurrence?
  • Which are the types of attacks that have greater impact?
  • Which are the devices usually attacked?
  • Which are the devices not usually attacked but were attacked recently?

4.5.2. Data Exchangers

To speed up incident handling performance, it is mandatory to have proper and standardized interoperability mechanisms. Basically, the system must have the ability to request data from external sources and to send data to foreign sinks. This specific ability will be defined in the proposed architecture using data exchangers.
As defined previously, firstly, this component enables the system to request data from external sources of information using standardized protocols. Several specific components, per data originator system and per protocol, will be available in the architecture to request, on a periodic basis or at a one shot schema, remote data with the required authentication. This will be left open for customization by administrator users to set up the data to the approach that fits best on each data source.
Secondly, this component also allows the system to provide stored data, potentially filtered following given requests, to any authorized external requester using one of the standards that best fits its query.
Standard approaches such as JSON data format [101] or XML [101] will be used and are recommended due to their widespread nature. However, proprietary schemas and methods will be used when no other approaches are left open, as happens to be with several proprietary products and systems.
One step further, cyber security standards will also be used in the architecture for data exchanges. For instance, STIX (Structured Threat Information eXchange) [102] is going to be used as it is the de facto standard for cyber threat intelligence nowadays [103]. Moreover, widely used existing standards for cyber intelligence, such as CVE (Common Vulnerability enumeration) [104] or the SCAP (Security Content Automation Protocol) [105] suite, are going to be enforced and less extended usage ones would also be considered.
All the previously related standard mechanisms will be implemented in the architecture for both data gathering and delivery, and one of the goals of the proposed approach is to avoid proprietary data exchange mechanisms at all levels, if possible, and enforce standards usage. The usage of standards is mandatory for the scalability and extendability of the platform. One example that is considered is the capability of connecting the system on demand to external sources such as Virustotal [106], URLHaus [107], among others, which also do provide their own APIs to request/provide data, mostly based on well-known standards such as API REST to enrich the data processed by the platform. External data is beneficial for aspects such as IP/URLs/fqdn, hashes/files, etc., regarding detected IoCs with relevant intelligence from those well-known and reputed internet repositories.
Regarding the communication mechanisms, other standards such as API REST [108] for one-shot requests or AMQP [109] to publish/subscribe messaging are to be used to exchange data.

4.5.3. Hypothesis Generators

In order to help Threat Hunters discriminate which are the most current critical threats and their likeliness, and as contribution to the current state-of-the-art, we propose a specific component in charge of generating hypotheses.
Humans follow patterns in every action they do in their life, and even further when they interact with IT systems. Some of these patterns can cause cyber security events recognizable by pattern detection tools as a cyber security threat, for example, trying to gain access to some resource without enough rights, requesting Virtual Private Network (VPN) access out of business hours, etc. After conducting deep research with cyber security analysts, it was discovered that the detection of these specific harmless human patterns can be automated as they have common traits such as a specific user always coming from the same IP address. In order to automate the detection of harmless human patterns, a hypothesis generator component must be able to reduce the likelihood of a specific cyber threat being harmful, following some rules or even with specific ML algorithms. As a consequence, this component is considered relevant due to the benefits that it provides to cyber security analysts by freeing them from attending repetitive and harmless threats and allowing them to focus on those which are harmful.
In order to use this component, Threat Hunters must create rules which will be used to process the data. A rule consists of one or more filters executed in a specific order set by Threat Hunters. Each filter returns a numeric value that can be added, subtracted, multiplied or divided between steps to generate a likelihood of being benign or malign. The available hypothesis generators filters are classified as follows:
  • Simple filters: Basic filtering rules (e.g., if/else rules).
  • Complex filters: These rules find context by selecting more data related to the analyzed one (e.g., find how many times this pattern has been repeated).
  • ML filters: These apply ML techniques from ML components to generate hypotheses.
In addition, each rule has a frequency value used by the Hypothesis Generator component to automatically request data to the database, process it and generate a hypothesis.
Regarding the previously set statements, the hypothesis generator component will be able to reduce or increase the likeliness of a detected threat being harmful according to the established configuration.

4.5.4. ML Sequences Presets

As said in previous sections, Machine Learning systems are composed of several components and steps that can be ordered depending on given needs: firstly, collecting the data; next, preparing it to fit the requirements of each specific ML technique; third is to process it using Machine Learning techniques; and finally, storing the results that must be persistent at a data storage.
Therefore, the user will be given the possibility to choose which Machine Learning components they want to use, and in which order. To do so, the definition and the orchestration are proposed to be done by a specific component named ML sequences presets, which will also hold the responsibility of triggering them.
In Section 4.6.1, there will be a specific interface to create, update and delete definitions of ML systems.
When a specific system is launched, this component will request the required components to start at the required moment as well as to keep track of the status of the execution.

4.6. Layer 4: Interaction Components

4.6.1. HMI

Threat Hunters and Machine Learning experts should be able to interact with the overall system using a simple, well-designed and easy-to-use graphical interface where all the required tools and visualizations will be accessible. In the proposed architecture, this specific task is implemented at the Human–Machine Interface (HMI).
The HMI must be modular enough to allow the configuration of all fields required by the different components that compose the overall system. Furthermore, the HMI will represent the data considered as relevant by Threat Hunters in the most efficient way.
As well as with the other components of the system, the access to the HMI will also be restricted by a user/password combination. The Role-Based policy [110], where each user has assigned a specific role which defines the allowed permissions, will be enforced for use in the HMI.
A web-based approach is proposed for the HMI as it is OS-agnostic without losing usability in desktop environments [111].

4.6.2. External Access Gateway

As specified in Section 4.5.2, the system must be accessible by third-party elements to gather data in a standardized way. For security reasons, it is interesting to have a specific element to act as proxy or API Gateway [112,113]; in the proposed architecture, that specific element is the External Access Gateway.
The main functions of this element are as follows. First, providing the endpoint for external requests. Second, checking the authentication of the request to decide whether it must be processed or not. Third, verifying the format of the request to ensure it is valid. Fourth, checking the authorization of the request to ensure that the requester has the required permissions to obtain that specific set of data. Fifth, forwarding the request to Section 4.5.2. Sixth, forwarding the response from Section 4.5.2 to the requester.

4.7. Common Layer: Communications

Being a distributed system introduces several complexities and challenges in the overall architecture design. For instance, it is necessary to have a communications broker in charge of exchanging and forwarding messages between each component and guaranteeing their proper delivery. As a consequence, the communications broker is a crucial component.
As stated before, all components of the system must send their messages using the communications broker and, in order to avoid the possibility of any unauthorized agent sending or receiving messages, the access to the communications broker network will be restricted and can be considered the first authentication factor, enforcing messages integrity [63].
In addition, messages will be exchanged using the AMQP [109] protocol and using several communications patterns: namely, one-to-one, one-to-many, in a broadcast manner, etc. Not only that, components will be sending messages using a request-response or subscription-publishing mechanism.
The usage of a communications broker provides many benefits to any distributed architecture. First of all, there are several extended-usage platforms that are widely tested by huge communities ensuring minimal communication issues. Moreover, the new elements addition process is relayed in the broker procedures and usually consists in connecting the broker following its mechanisms. Not only that, but networking issues are reduced because each component only needs to obtain access to the communications broker endpoint, so network administrators do not need to take care of broadcasting issues or other related problems. In addition, most brokers, if not all of them, provide real-time broadcast queues and subscription-publishing mechanisms which allow for immediate data updates. As a side effect, one-to-many message exchange patterns, such as those provided by communication brokers, do yield significant bandwidth consumption reduction.

4.8. Common Layer: Authentication Management

In order to manage the authentication of the different components and also the users that could interact with the system, and the different roles defined in the overall system by the administrators, there must be a specific component in place, referred to in the proposed architecture as authentication management. As the first step to be taken by each component or user is to log into the system to verify the permissions of the assigned role to the user, this component is crucial.
There are several options, being most outstanding OTP (One-Time Passwords) and OAuth 2.0. Despite some efforts being done in order to authorize using OTP [114,115], the proposed protocol is OAuth 2.0 due to the reasons detailed hereunder.
Nowadays, OAuth 2.0 has become the standard authorization protocol for the industry [116]. It enables a third-party application to obtain limited access to a specific service [117]. In addition, it can be configured to send not only the username and assigned role but also metadata when needed. Moreover, there are many implementations which allow systems administrators to choose which one of them fits best the requirements of the deployment, and it could be deployed locally or remotely, allowing the use of the implemented application either in isolated or shared networks. To summarize, many OAuth 2.0 implementations offer High Availability, which is a positive reinforcement of other architecture’s requirements.

5. System Prototype

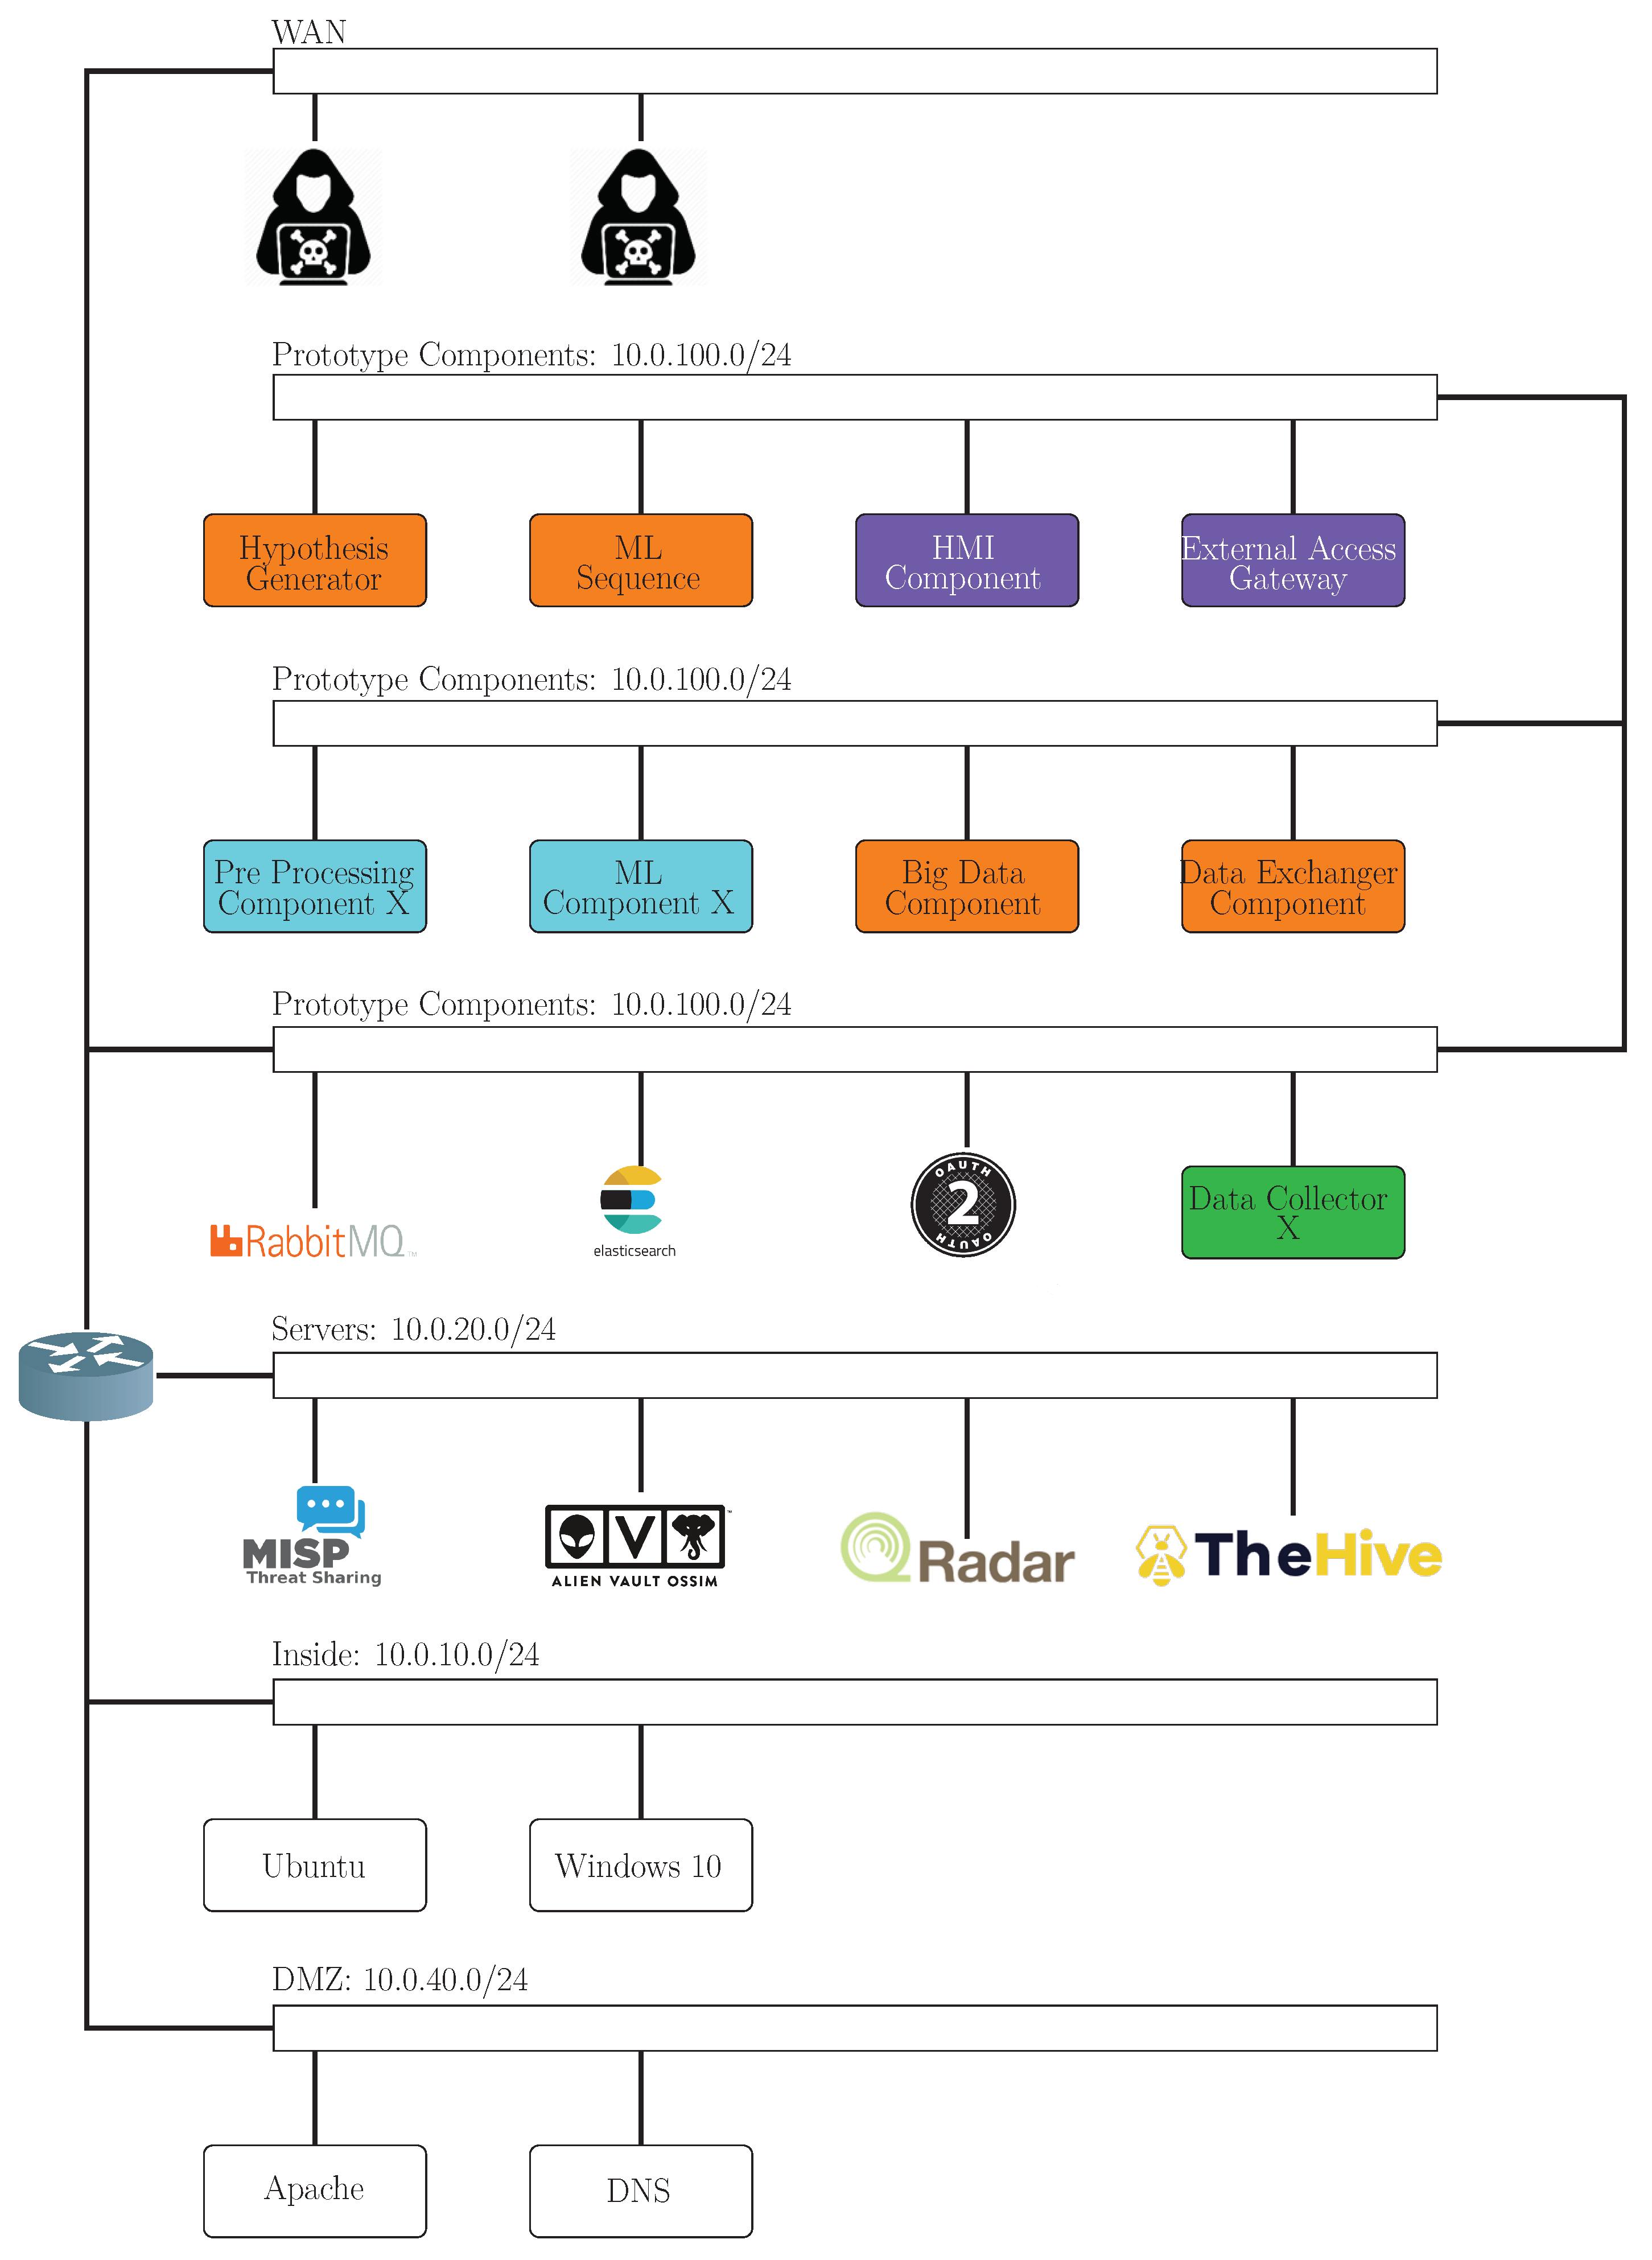
In order to validate the proposed system architecture a prototype, has been implemented. A brief view of the different components developed are shown in Figure 2, including each component in their corresponding layer in Figure 1, regarding the group of components.
The prototype has been evaluated using synthetic data simulating real networks and hosts by means of a digital twin. A digital twin can be defined as a clone of physical assets and their data in a virtualized environment simulating the cloned one. Digital twins also allow to test the physical one at all stages of the life cycle with the associated benefits of bugs and vulnerabilities detection [118].
In Figure 3 the implemented digital twin used to simulate a real Critical Infrastructure setup is detailed, including networks and assets (workstations, servers, network hardware, etc.) to verify the developed prototype that has been implemented using a virtualization platform. Three networks have been created. The first one contains all the monitored systems which will be attacked by an external actor in order to detect threats. The second one contains all the systems that the system prototype will collect data from. Lastly, the third network contains all the deployed components of the prototype.

5.1. Components

The components developed and deployed to verify the architecture will be described in this section. All of the developed components used Python [119,120,121] as the implementation language.
Following the same order as in previous sections, the data collectors were developed beforehand:
  • MISP [70].
  • OSSIM [67].
  • QRadar [68].
  • The Hive [71].
  • PCAPs [69].
  • Syslogs.
  • Raw logs.
Regarding the database, Elastic Search was chosen along with Elastic Common Schema as the data model.
In addition, the data preprocessing components (Section 4.3) that were developed are the following:
  • Sigma Converters.
  • Number Normalization.
  • Text Normalization.
  • One-Hot Encoders.
Furthermore, the developed machine learning components (Section 4.4) used for verifying the architecture were the following:
  • APT Clustering components.
  • Anomaly detectors.
  • NLP.
  • Decision trees.
  • Neural networks.
A model repository component was also used where pre-trained models were stored in order to feed the components which require them.
Big data statistics, the hypothesis generator, ML sequence presets and data exchangers components were also developed. It is considered interesting to highlight that data exchangers were able to query data from MITRE ATT&CK [122,123,124] as well as export data using STIX.
In order to interact with the system, an HMI and an External Access Gateway were also developed, acting as proxy to authenticate and authorize the requests before forwarding them to the available data exchangers.
Lastly, RabbitMQ [125,126,127] was used as a communications broker and a component which the OAuth 2.0 protocol implements was developed in order to manage the authentication.

5.2. Validation

The prototype has been validated layer by layer, following the same path that the data does, from the collection to the visualization.
The first step was to collect data from several sources. In order to do this, data collectors for MISP, OSSIM, QRadar and The Hive were deployed and properly configured, and, for each one of them, it was checked that the content was correctly collected and normalized following the proposed data model.
After that, the following step was to create Machine Learning systems using the ML Sequence Presets component. In the prototype, several ML Components along with Data Preprocessing Components were deployed in order to be used to generate sequences by concatenating all of those required in the order set by the ML expert. Those ML systems were executed either for one single shot or for recurrently generating valuable information about what is happening.
Having raw collected data and information generated by ML systems, the next step was to test the data exchangers in the two available ways: to export data to and import data from third parties. On one hand, using the External Access Gateway components, data was exported to an external system using STIX. On the other hand, data was imported from MITRE ATT&CK successfully.
As one key element of the proposed architecture, the Hypothesis Generator component was properly configured to process all the collected data and produce knowledge to generate valuable intelligence from those hypotheses previously checked and tuned by a Threat Hunter using the HMI.
The last step was to analyze and visualize all the gathered data, information and hypotheses to find threats in the monitored infrastructure. Some parts of the HMI regarding raw and chart data visualizations will be explained hereafter.

5.2.1. HMI: Raw Data Visualizations

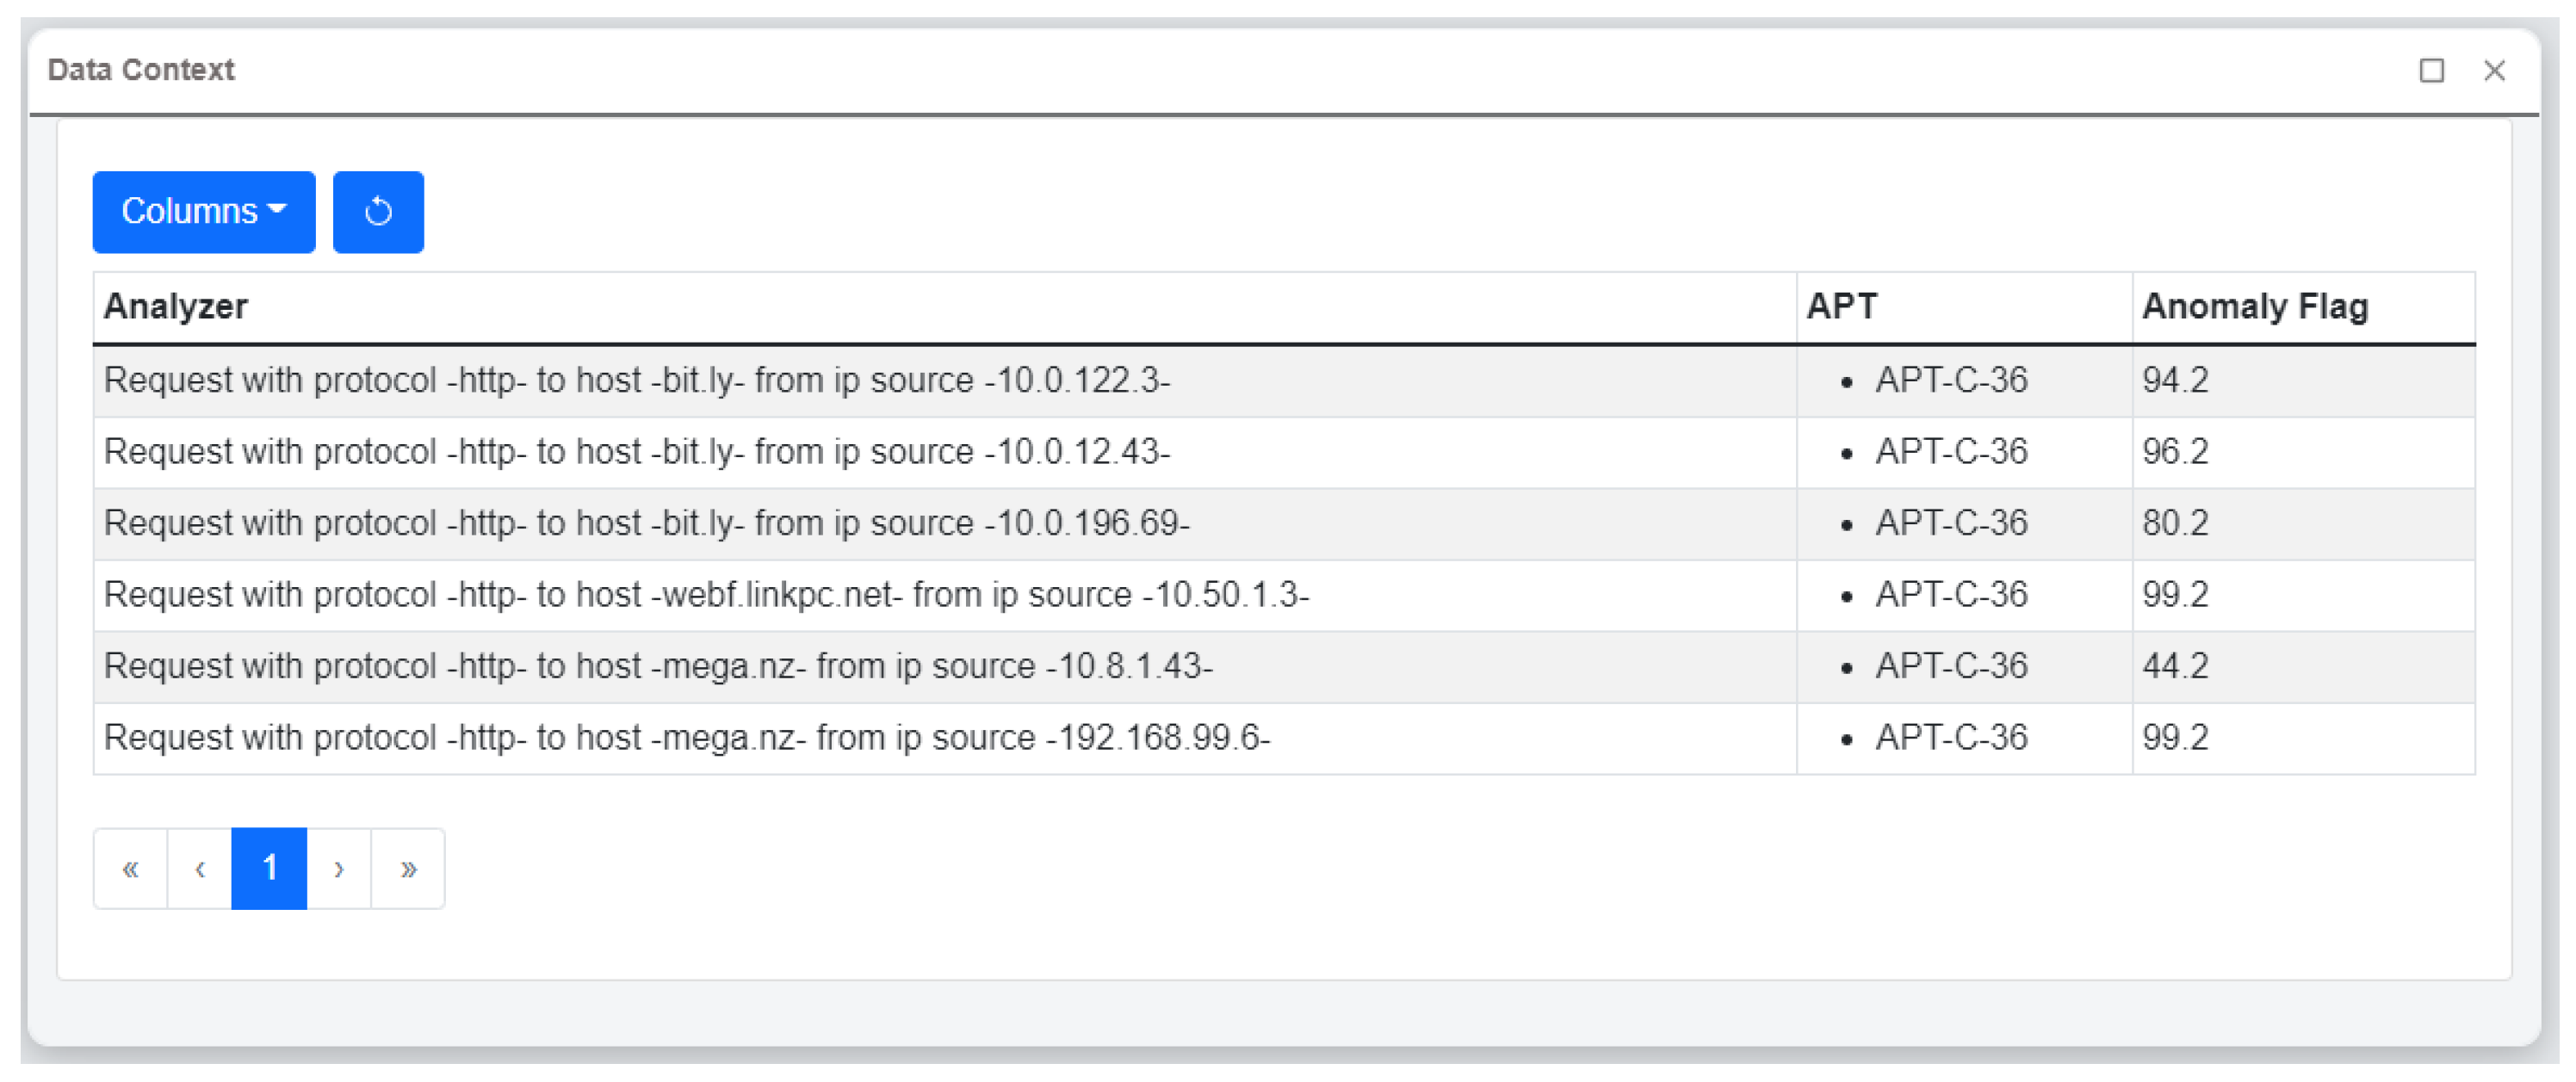
The first highlighted generated data is used by Threat Hunters in order to conduct deep research about which actor is more likely to be targeting the monitored system. The information displayed relates actions detected by data collectors with some actors evaluating the relation with an anomaly flag. The data shown is generated using ML clustering and with data collected from external sources such as MITRE ATT&CK. The result is shown in Figure 4.
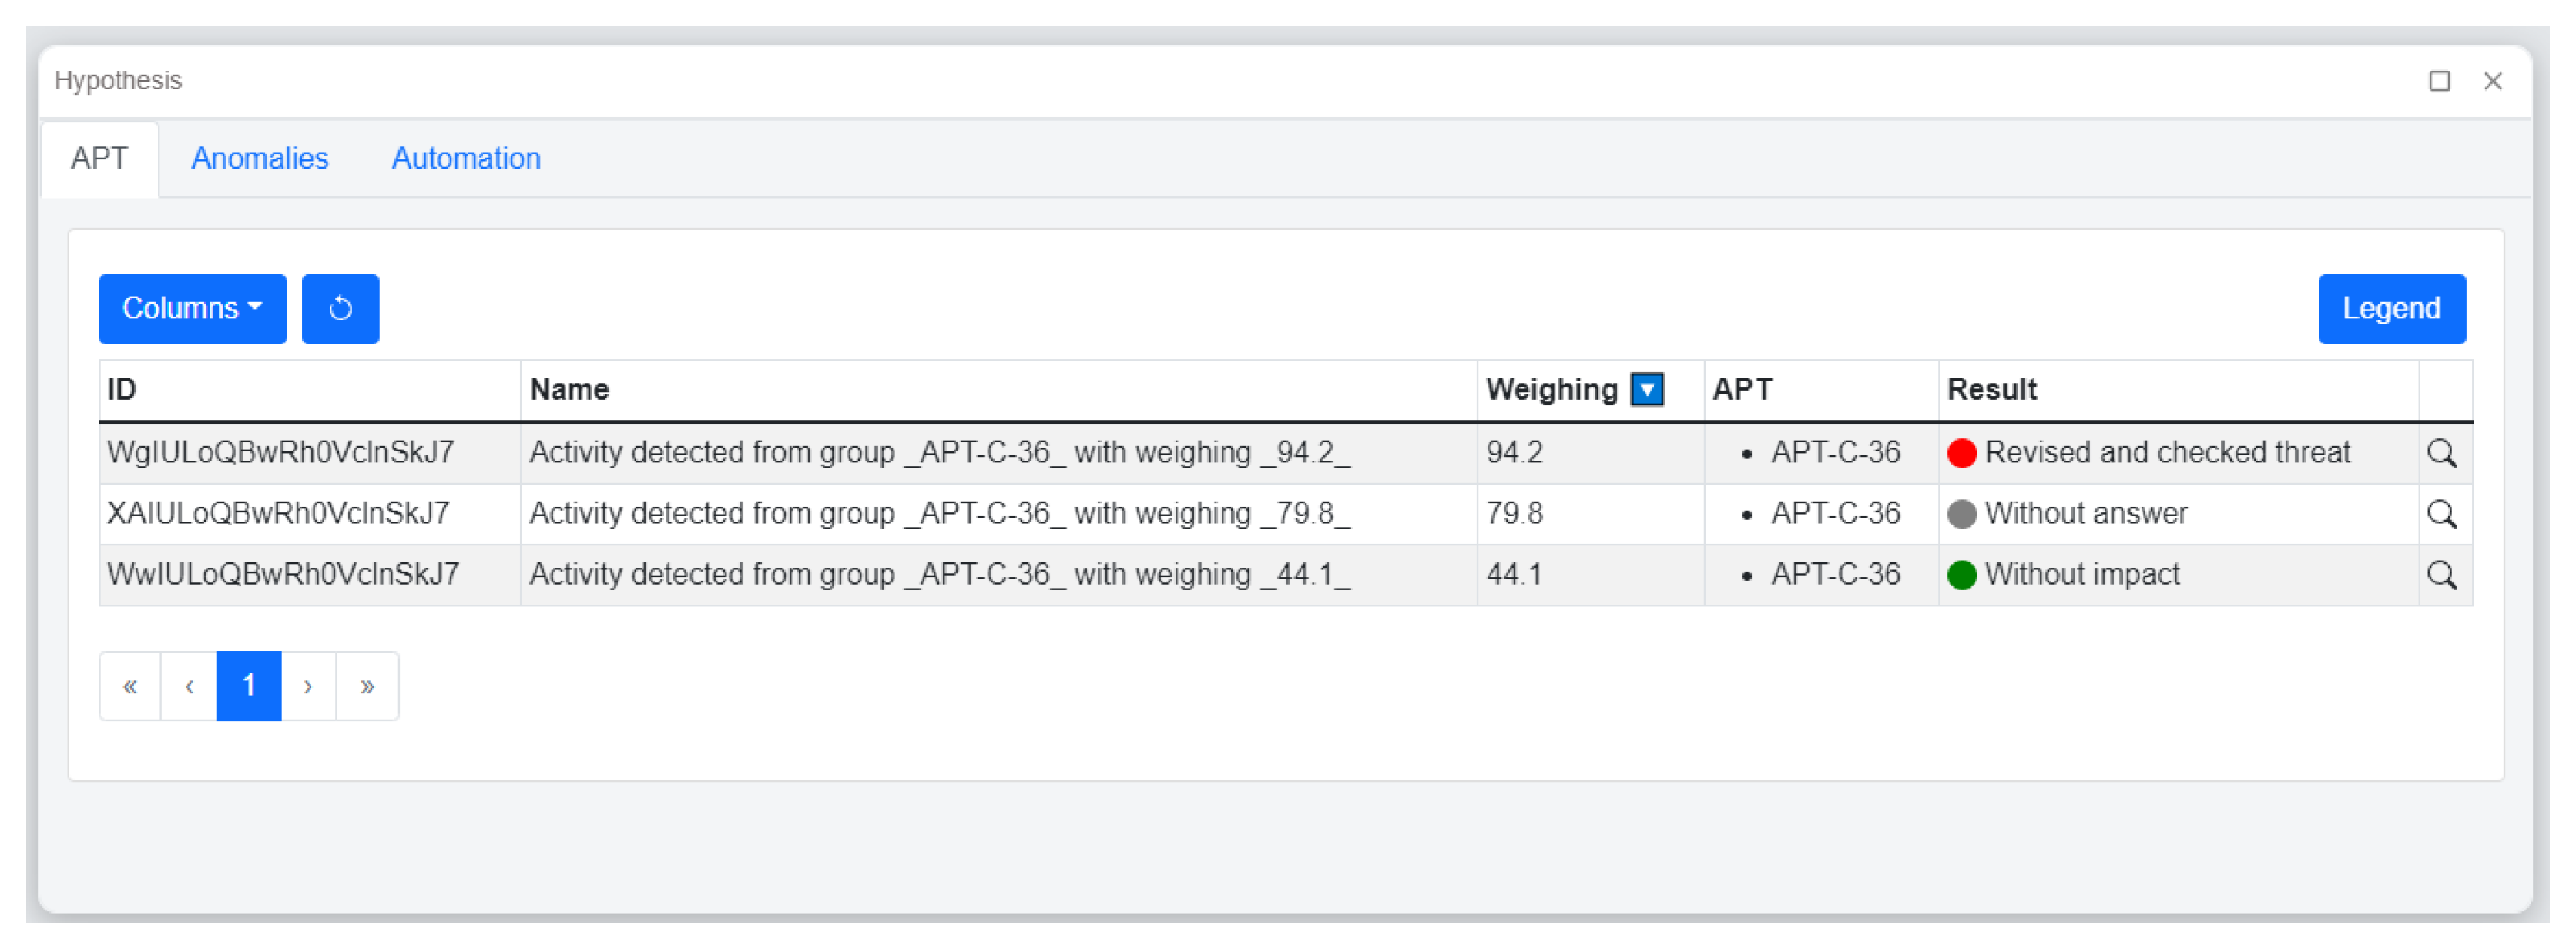
A key of the proposed architecture is the ability of hypothesis generation, and, in order to do this, there is a specific component called Hypothesis Generator which is in charge of doing that specific task. The output of that component is listed at a specific visualization at the HMI which also enables to validate generated hypotheses.
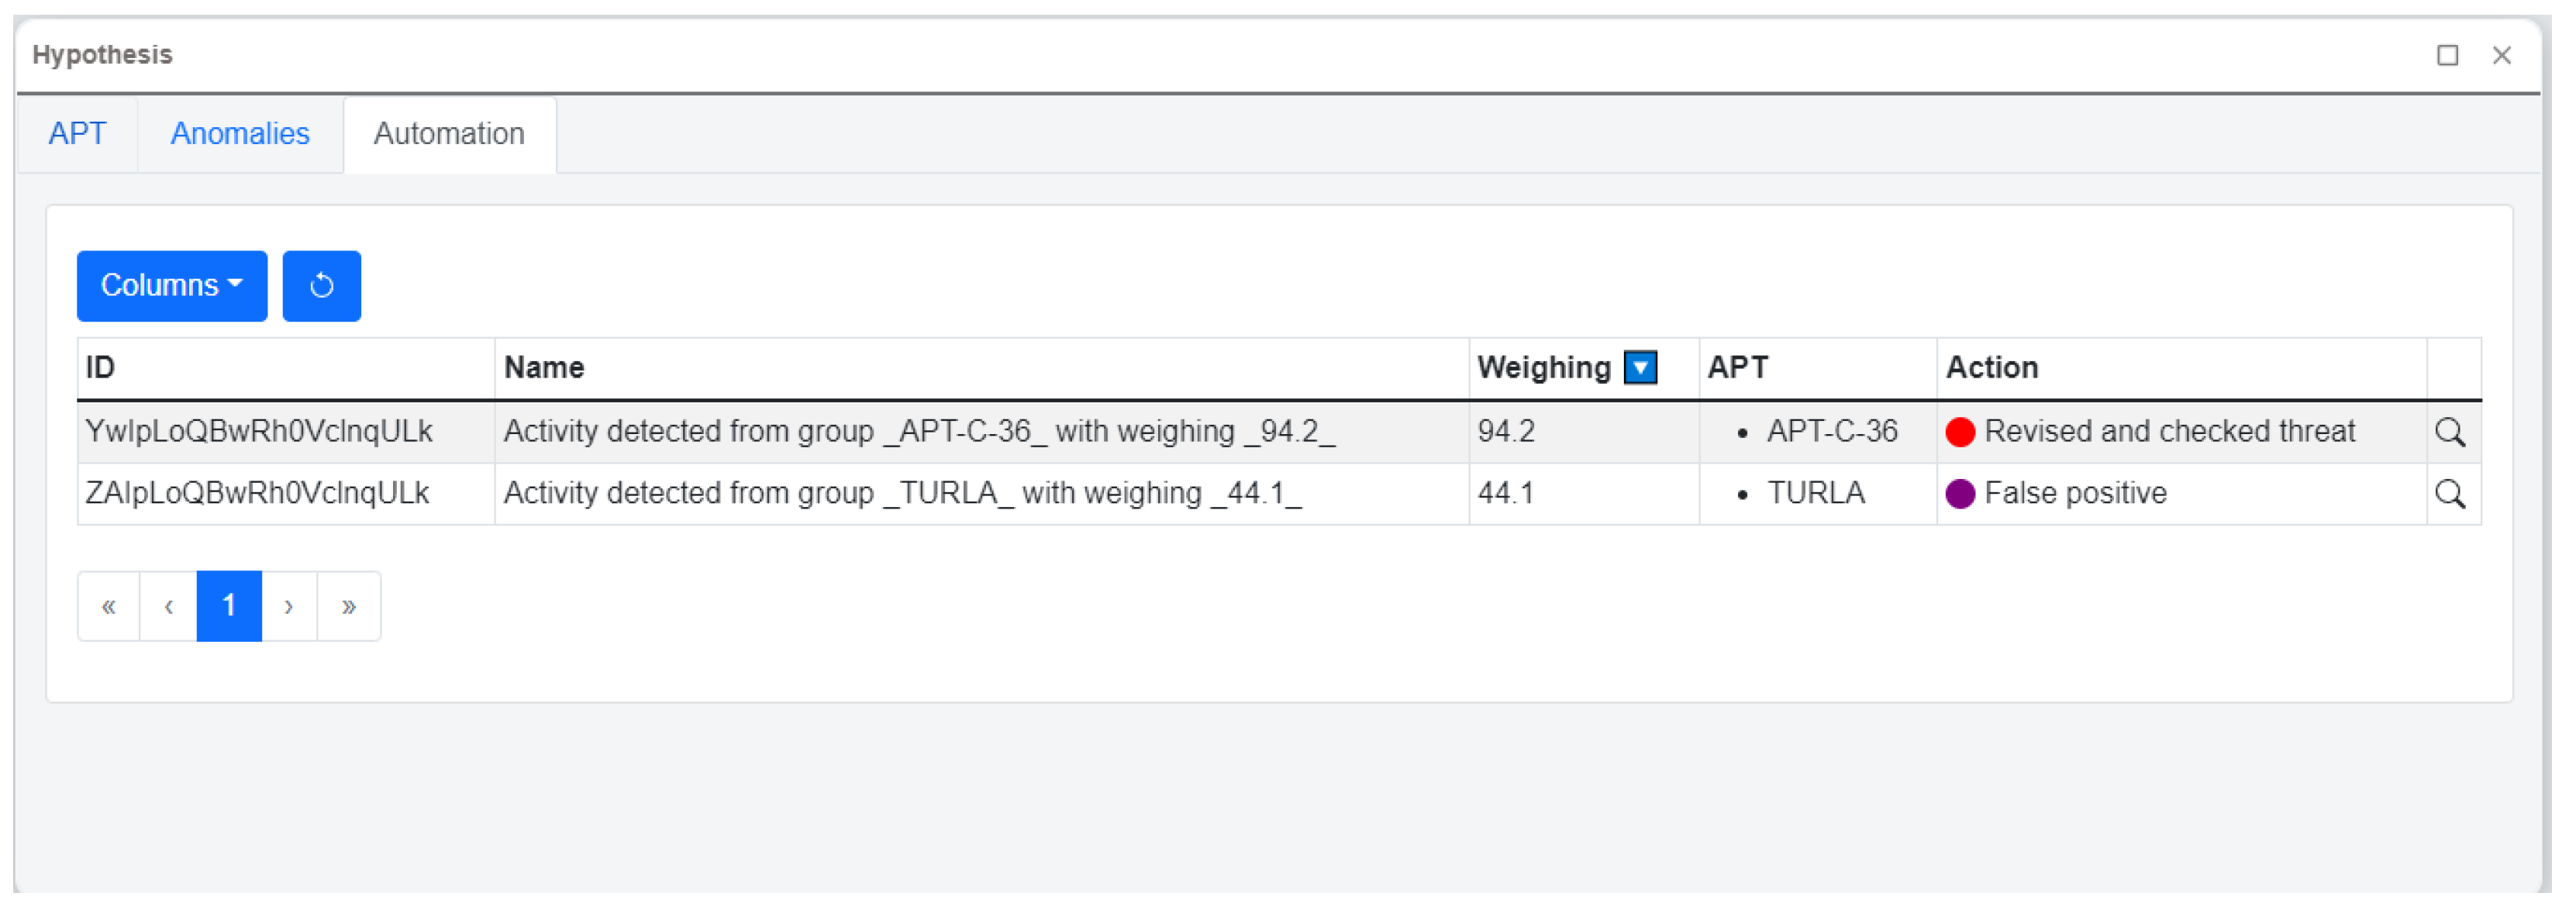
A hypothesis is a group of “Data Context” data which has been executed in a specific order and, optionally, can be associated to some APT. Once a hypothesis has been generated, it is shown to Threat Hunters with details containing the action chain to conduct a manual analysis in order to determine whether it is a threat or not. In Figure 5, there is an example of what would be seen by a Threat Hunter.
One outstanding feature of the proposed architecture is to provide ML capabilities to both Threat Hunting and hypothesis generation procedures. The Hypothesis Generators component is capable of continuously learning from Threat Hunters’ hypothesis resolutions to distinguish between threats and benign behaviors, and, using the acquired intelligence, it is able to suggest to Threat Hunters the result of new hypotheses. The results proposed are shown in a view like the one in Figure 6.
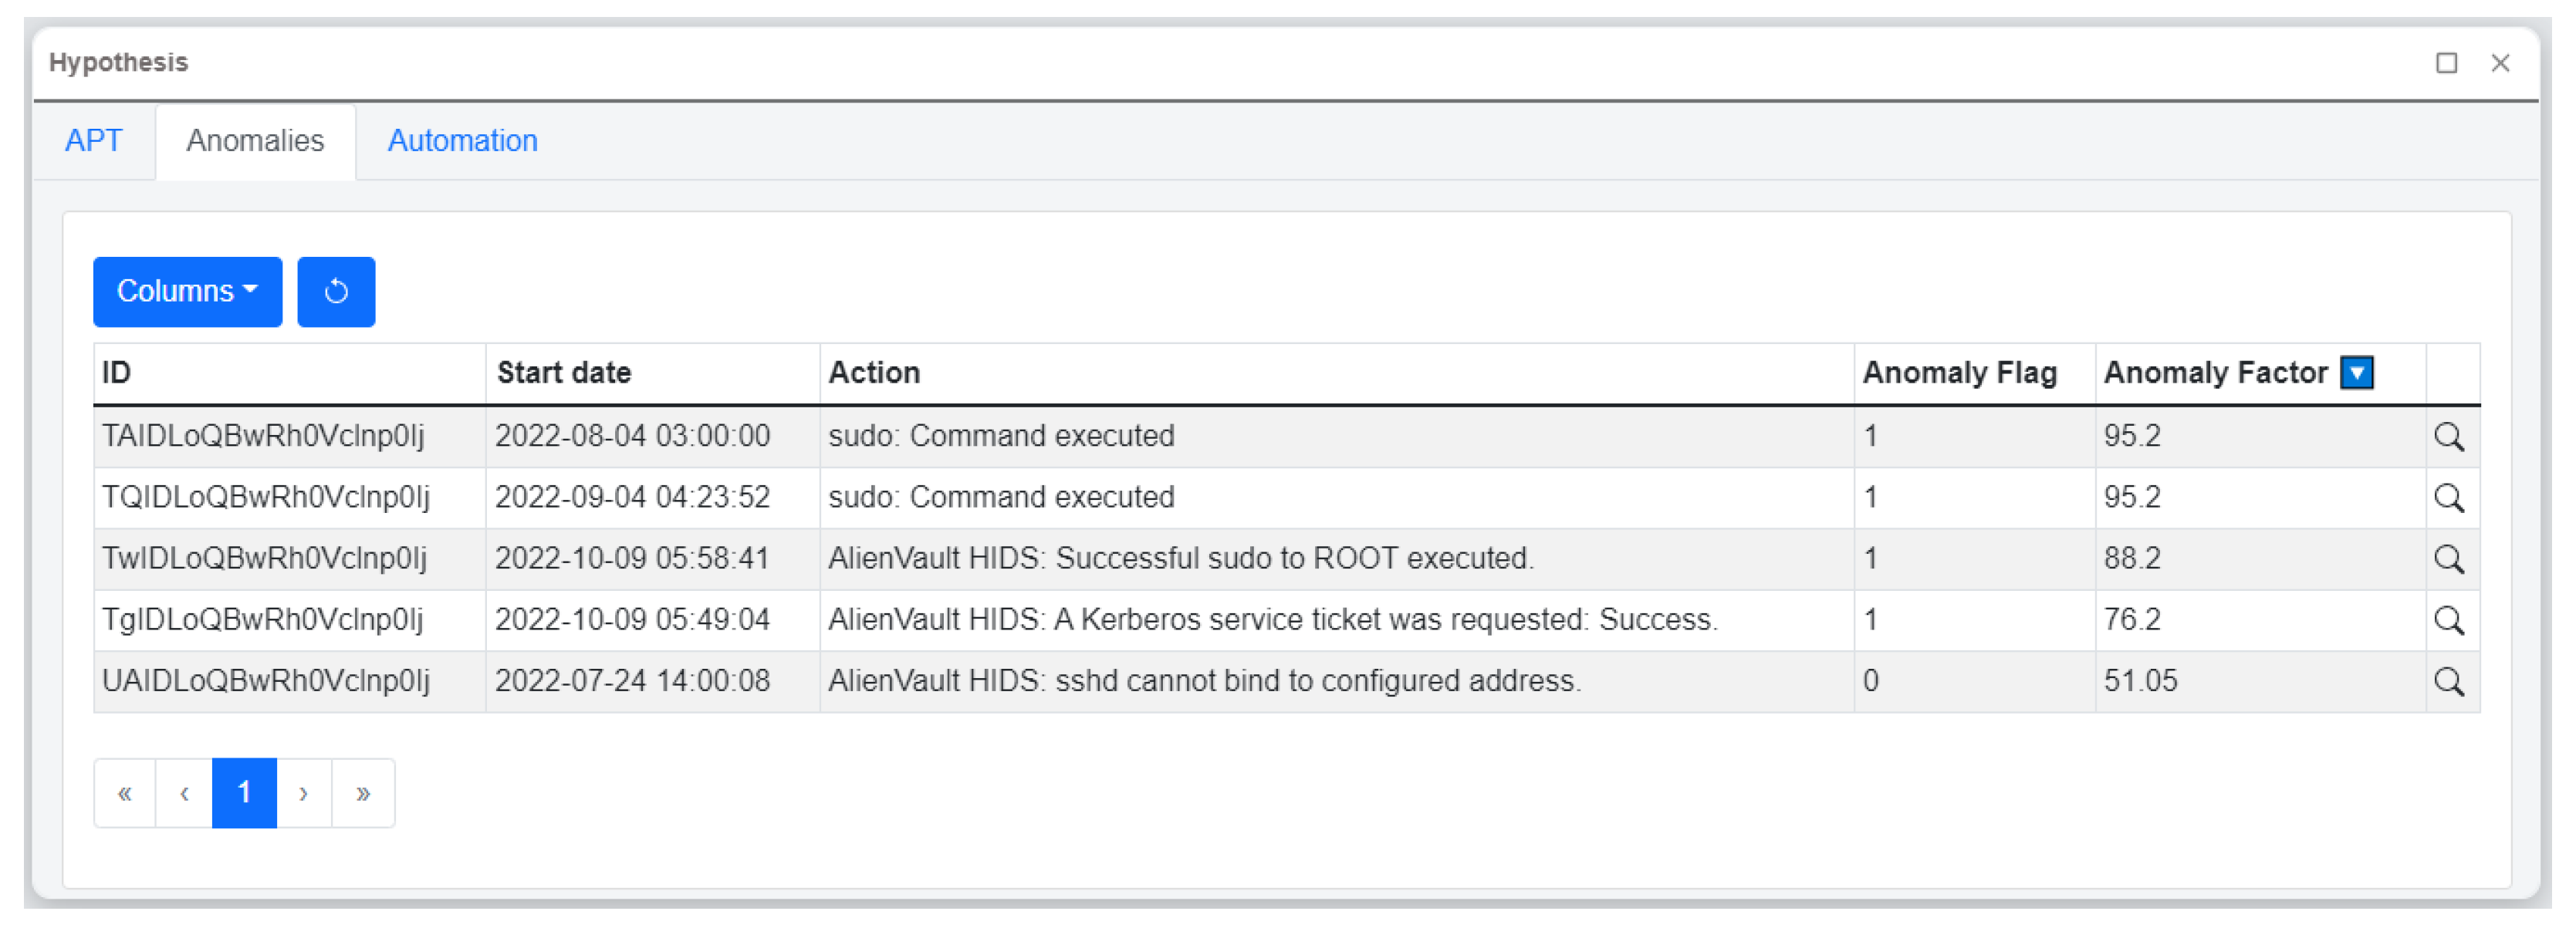
Another developed capability for the prototype is a hypothesis generator based on an anomaly detector, which creates results when some behavior deviates from the normal one of the system. It works by calculating an anomaly factor of the generated event and there is a configurable threshold which flags whether it is anomalous or not. One example can be shown in Figure 7.

5.2.2. HMI: Chart Data Visualizations

As explained in [13,14], visual analysis can help Threat Hunters to solve difficult problems faster and ensure good results.
Regarding the importance of offering as many useful tools as possible for Threat Hunters, several configurable visualizations have been developed. It is considered important to highlight that color codes are enforced at any kind of visualization to obtain fast recognition about what is being visualized. Visualized data can also be filtered by Threat Hunters if they need it. In addition, all visualizations are interactive, offering zoom in, zoom out and pan capabilities to examine in detail those complex aspects.
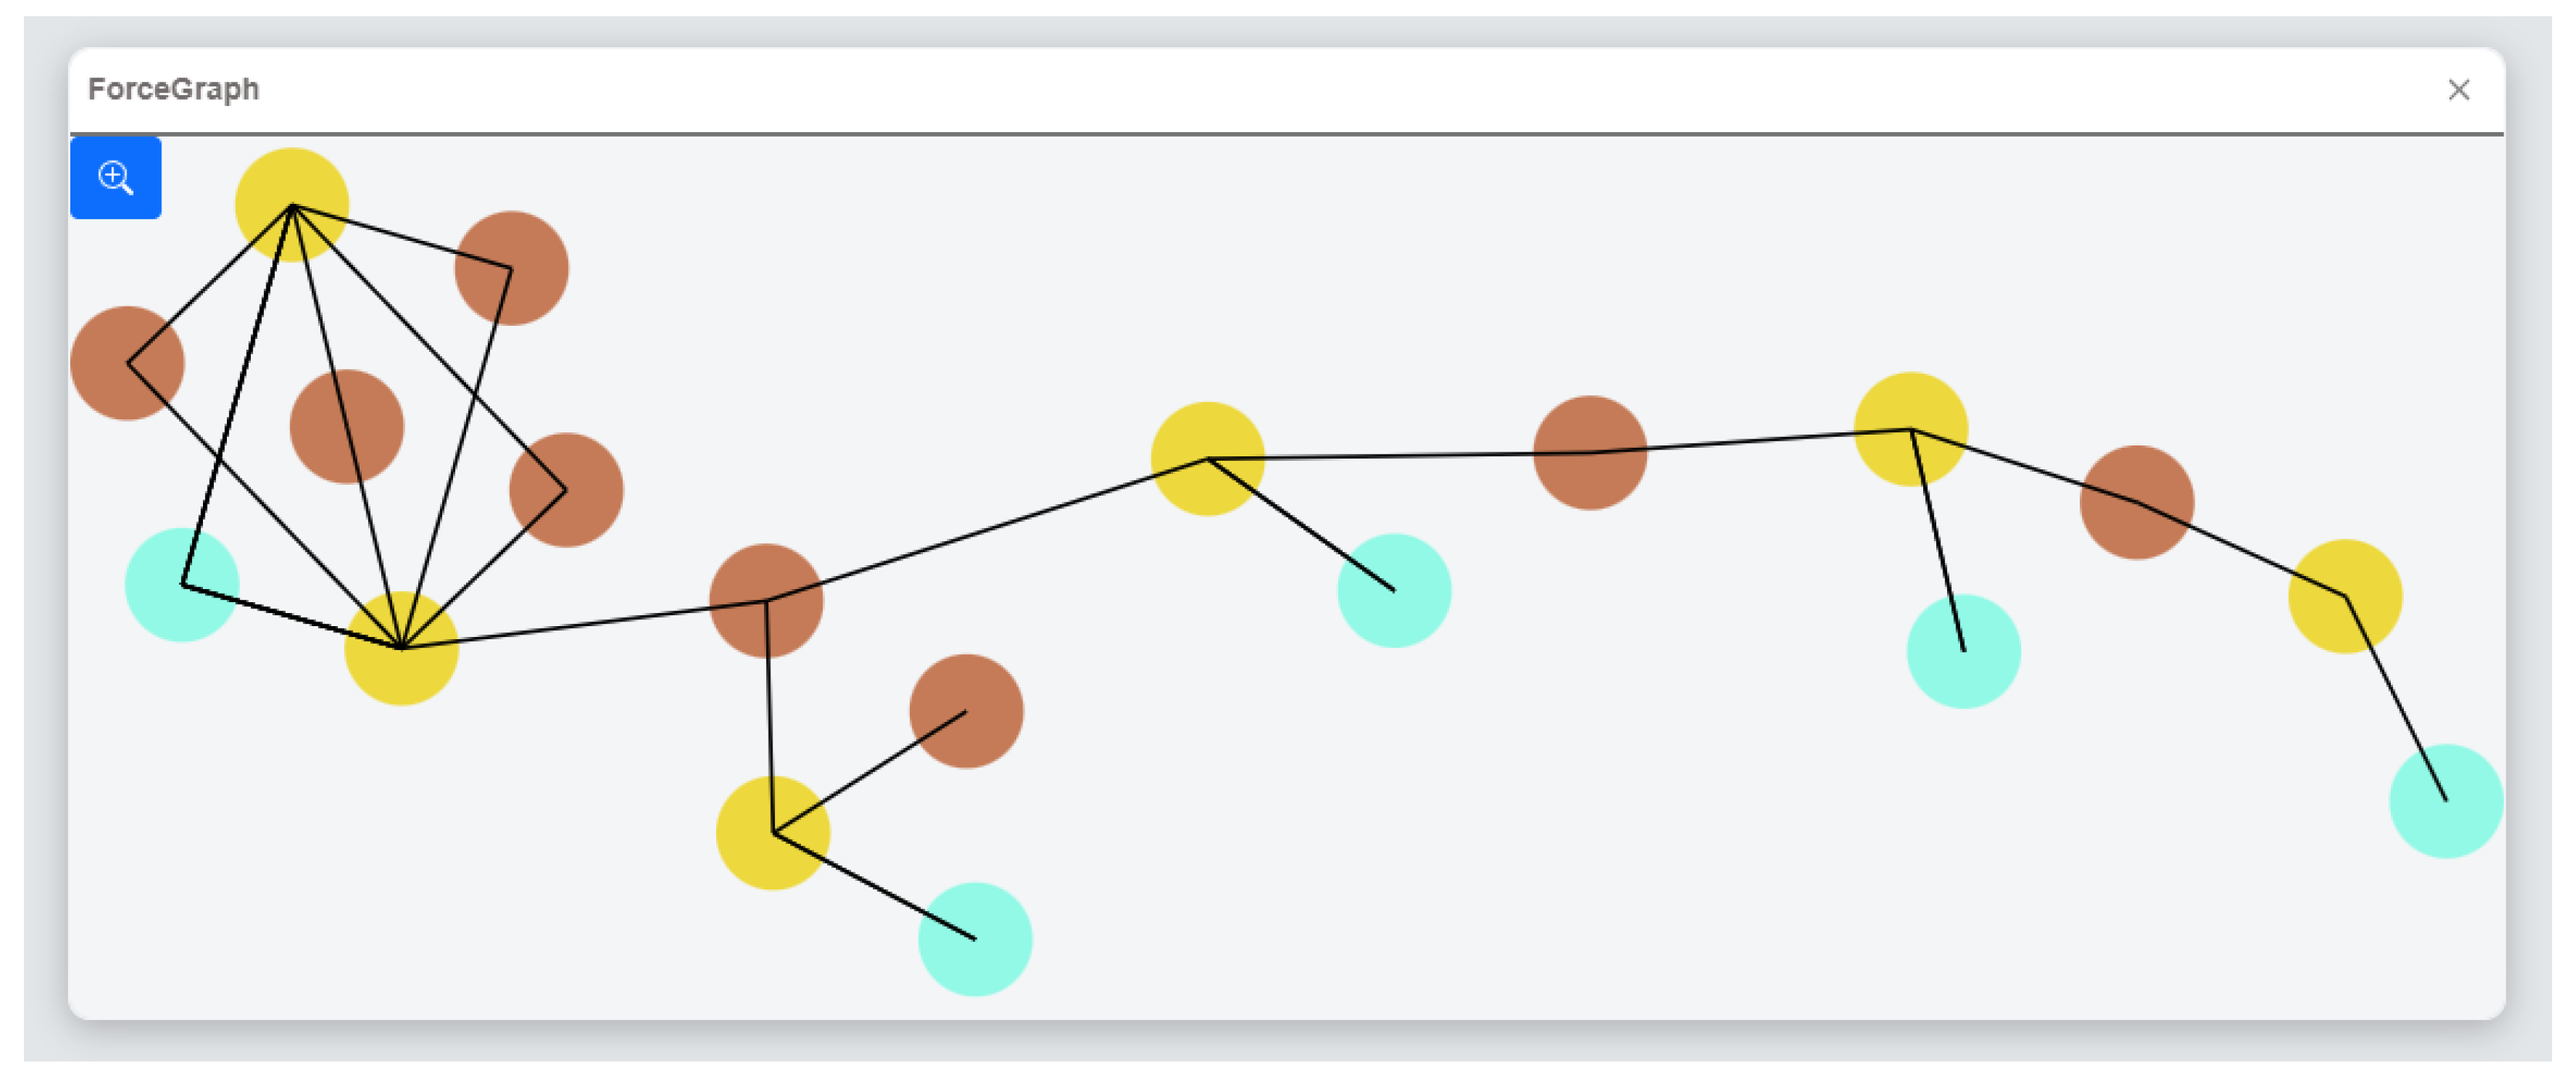
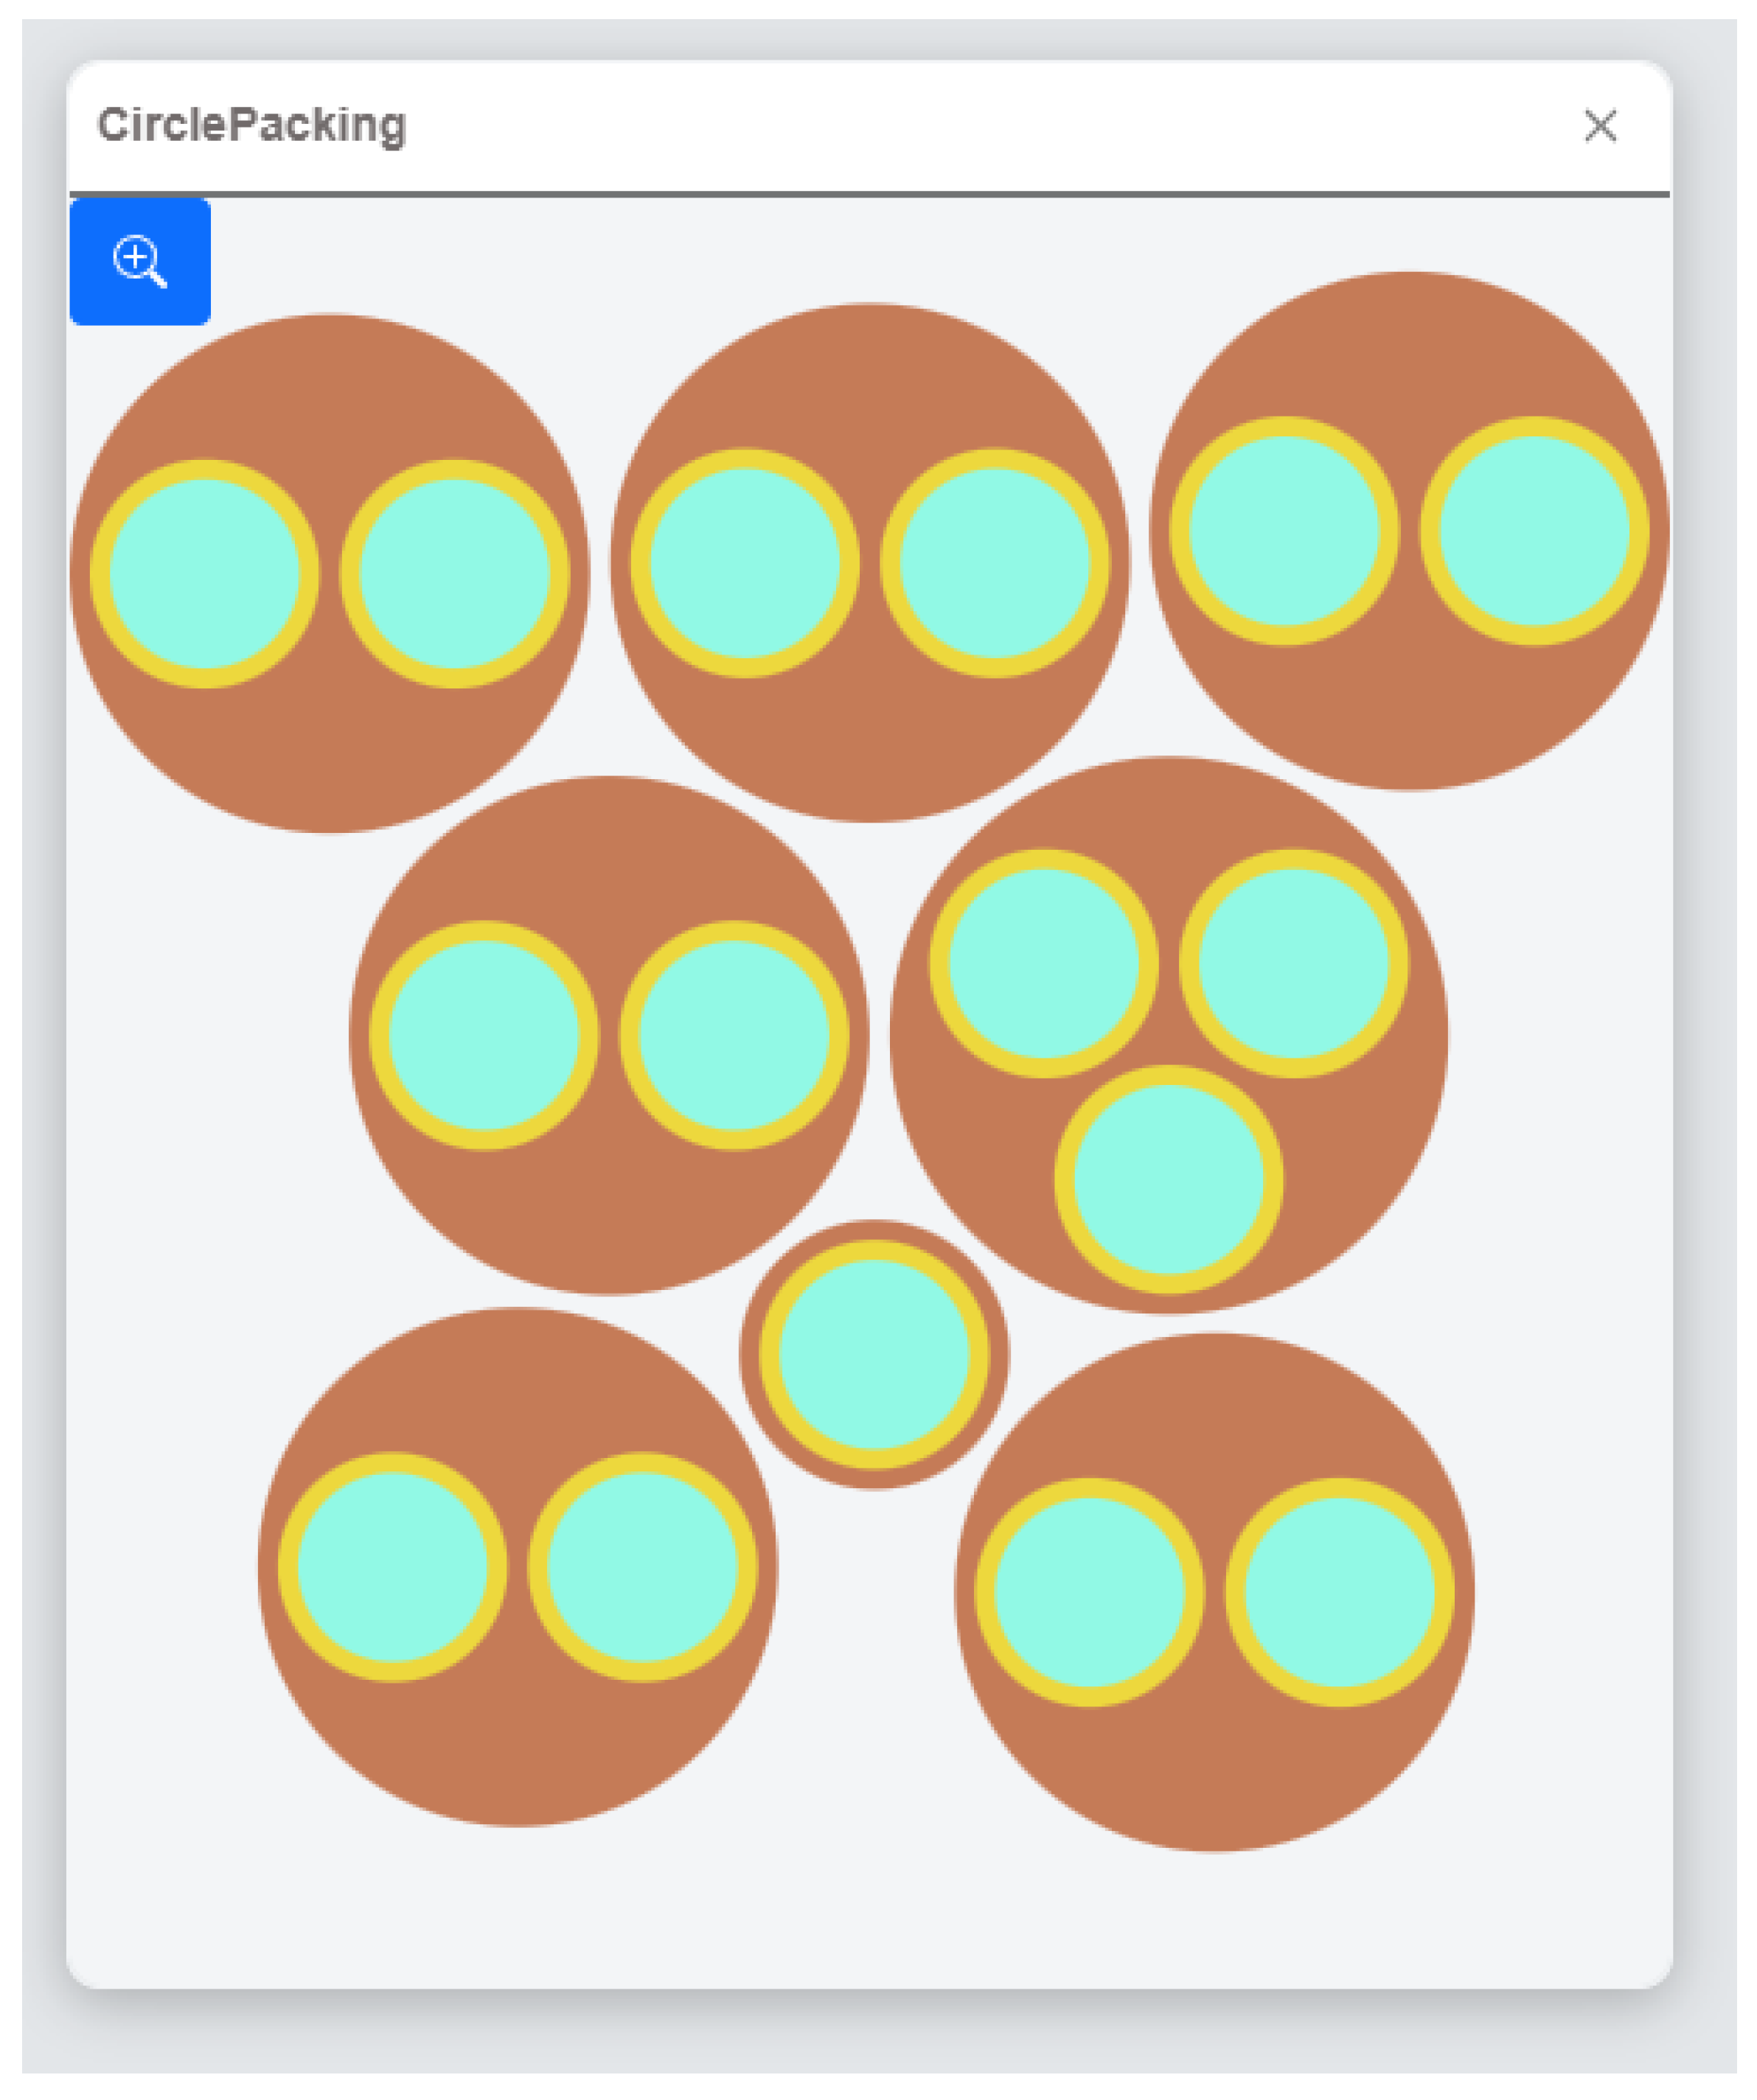
Hereunder are some examples of implemented visualizations (Figure 8, Figure 9, Figure 10 and Figure 11) in which all of them show the given assets with their existing services per asset and the vulnerabilities detected for that specific service but displayed using different visualization techniques.
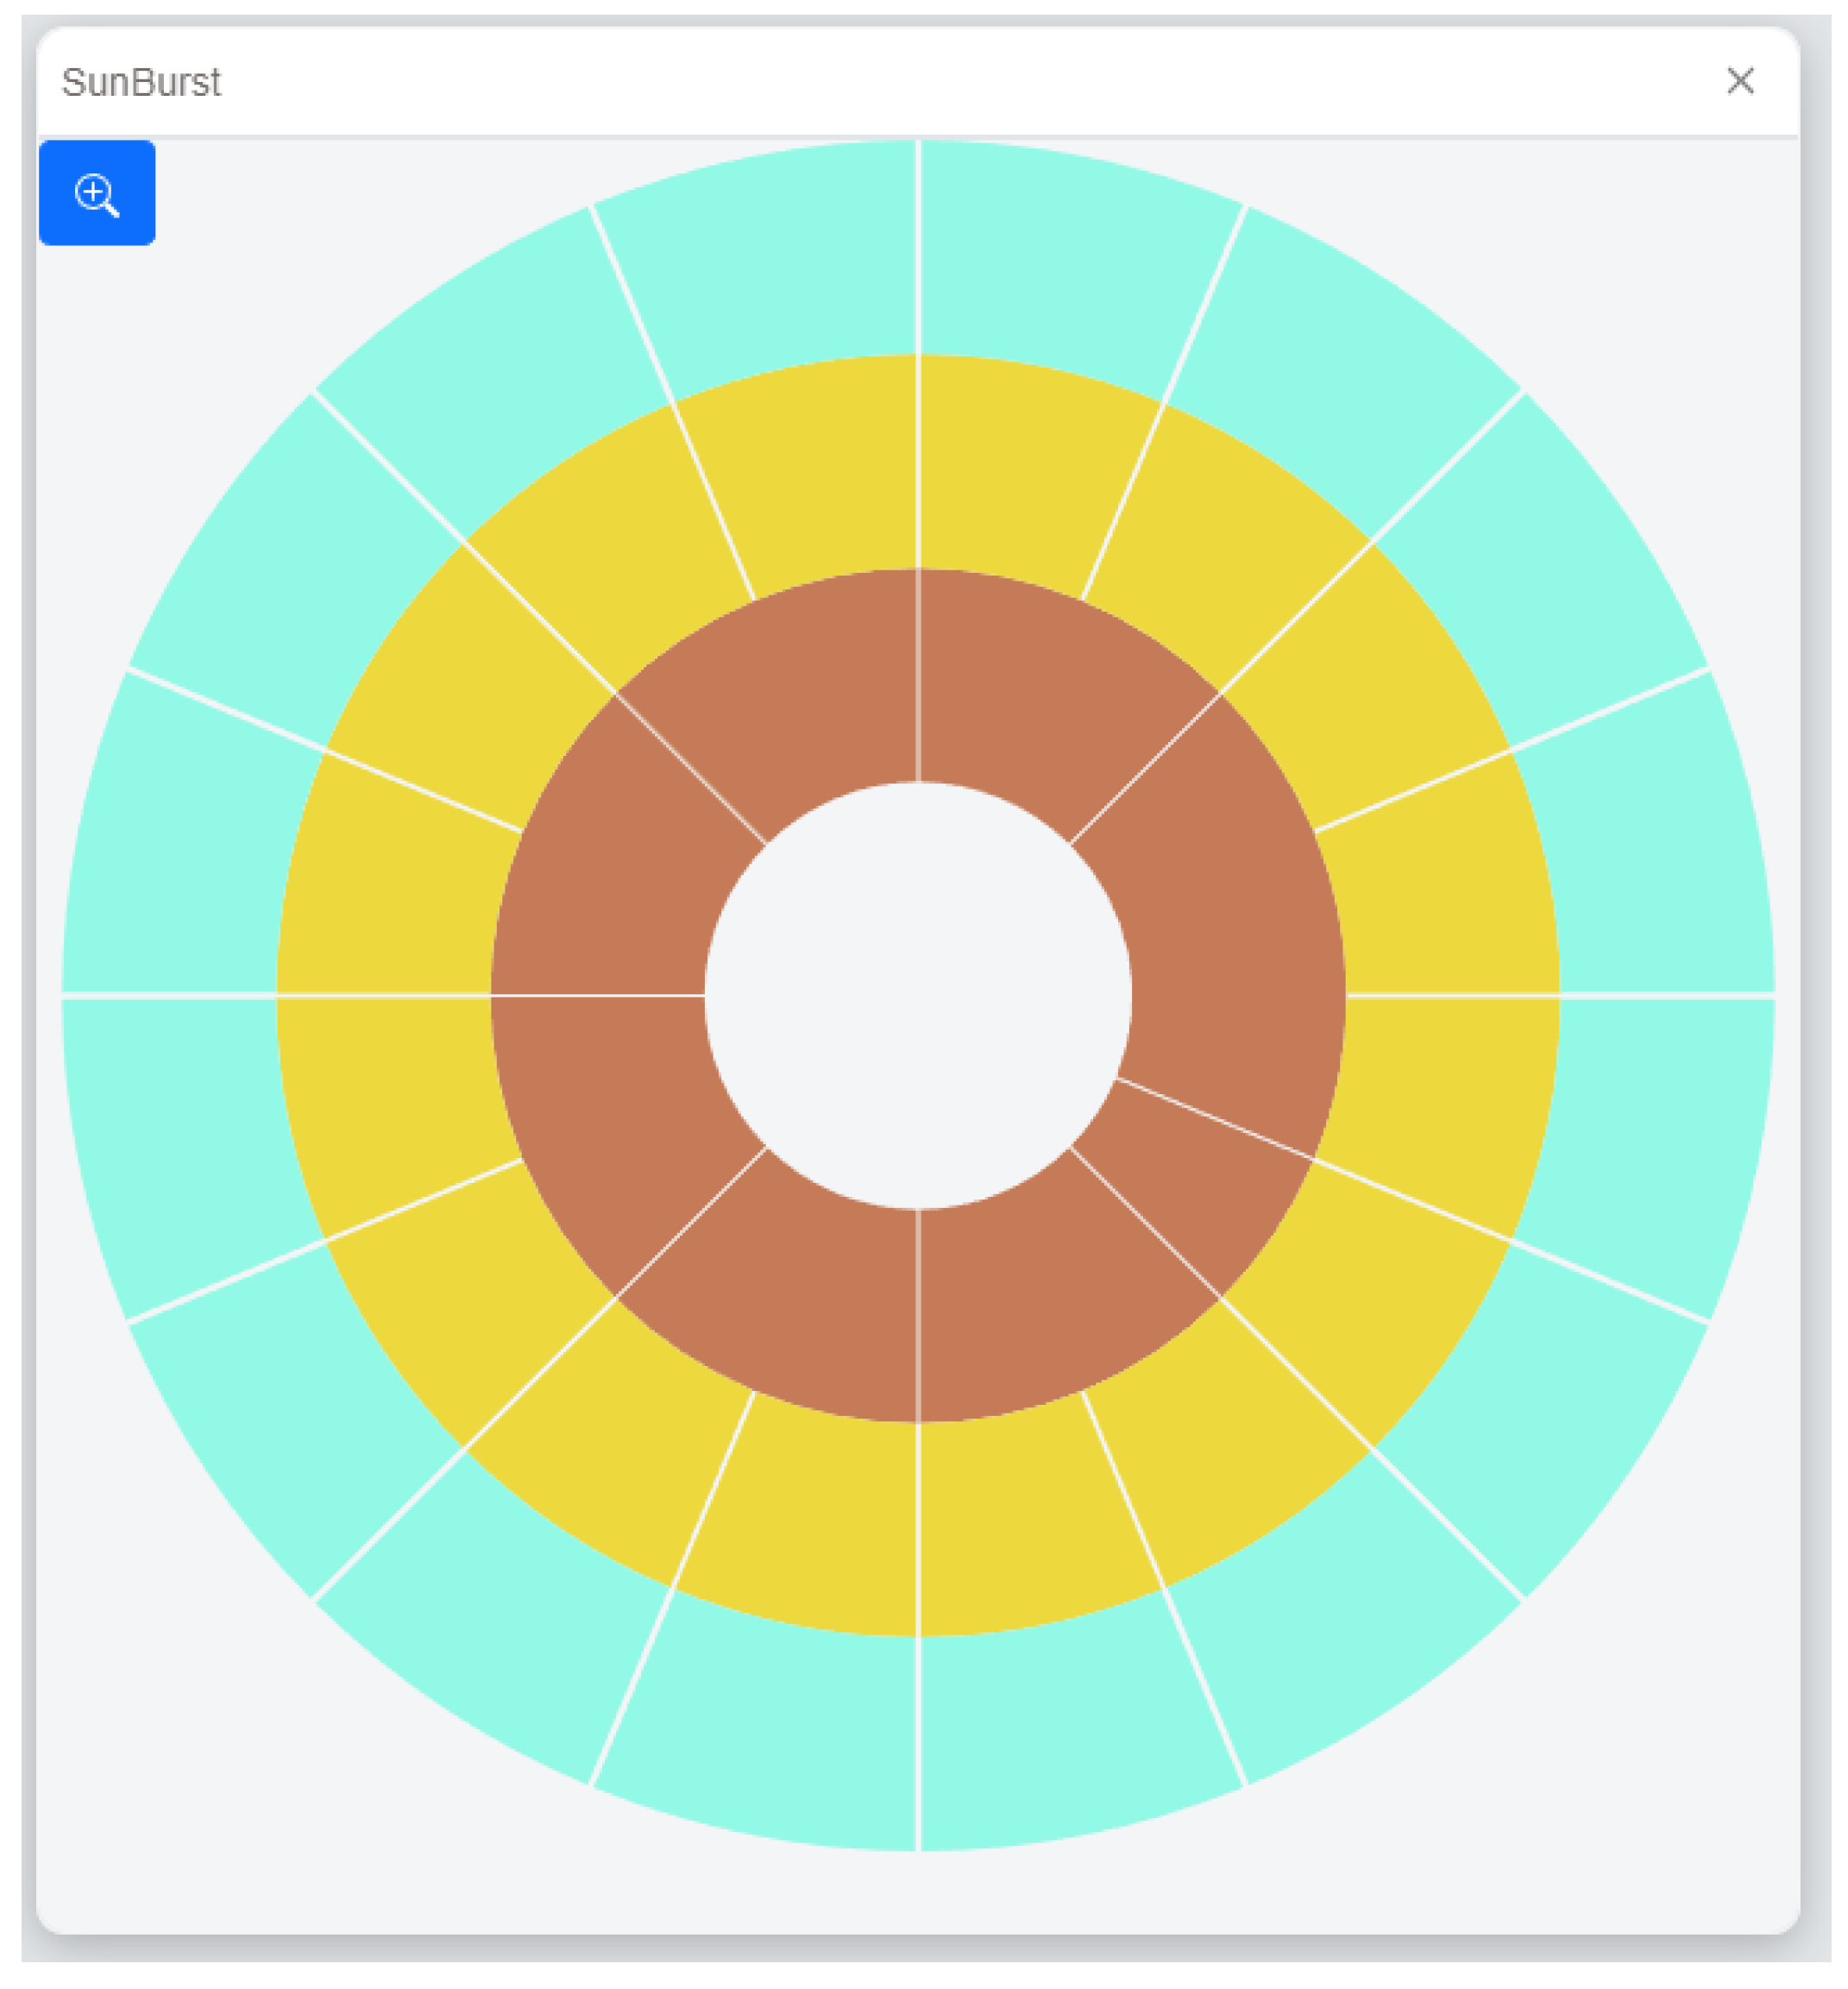
In the previous figure, we can find a graph showing the assets (brown color) connected to the services (yellow color) they have and the vulnerabilities (sky blue color) associated to them.
The same query to the data storage is shown in Figure 9 (i.e., assets per services per vulnerabilities) but with a different visualization technique, in this case, circle packing. The packing visualizations do lose the graph interconnection-display capability but provide means to see which element encircles another. Therefore, we can see here inside an asset (brown), its services (yellow circle), and inside each service its vulnerabilities (sky blue disc).
In the above snapshot, the same query is shown (assets per services per vulnerabilities) with the same color schema (assets displayed with brown color, services with yellow color, and vulnerabilities with sky blue color) but, in this case, elements are not encircled but laid on a concentric set of discs, each one representing a layer.
It is remarkable to state that, in all the views, the user can interact at any time with what is currently displayed; if the users clicks on any figure, a new window with all the detailed information about the element is shown.
The tree map view is quite similar to the circle packing, but in this case it is representing a Hilbert space decomposition. Again, assets, their services and their associated vulnerabilities are shown with the same color code and grouped in the shown boxes. It is important to state that the user can interact with the visualization as they can do in all the other visualizations.
Implemented visualizations are not limited to these examples but they are composed of an extended range of techniques, all of them enforcing the capability of helping in detecting patterns in complex and multi-dimensional datasets. As relevant features, we can point out that they are graph-based and provide means to show multi-dimensional interrelated data in a few dimensions’ graph.

5.3. Verification

After the validation process was successfully completed, a verification of the prototype was conducted with Threat Hunters (i) to ensure that the defined architecture copes with all the envisioned scenarios outlined in Section 2 and (ii) to validate the performance of the prototype against other solutions in the existing state-of-the-art.
Because there are no two identical people, it is difficult to ensure that a system is good enough for everyone, but with enough population, there can be a subjective approximation if it is fairly good or not. The subjective verification process was split into three stages: (i) Firstly, the implemented prototype was deployed in the networks monitored by the Threat Hunters in charge of evaluating it. (ii) After several months (time enough to have sufficient data in the prototype to obtain valid results through the ML components), the prototype was used by Threat Hunters in parallel with their own systems. (iii) Lastly, Threat Hunters were asked to answer specific surveys (some of whose questions are shown in Table 2) to determine how valid the system is.
The survey answers showed that, generally, the prototype was useful and the proposed architecture is strong enough to be used as a Threat Hunting tool for Critical Infrastructures.
Aside from the subjective evaluation of the prototype, some calculated metrics of the hypothesis generator component were also calculated, whose results are presented in Table 3.

6. Conclusions

In the previous sections, the architecture and all its features have been presented, followed by an exhaustive overall validation and verification. The results obtained can be used to compare given features to others from the tools and systems in the existing state-of-the-art. This comparison has drawn the following conclusions.
Firstly, it has been pointed out that there is a need to improve the tools used by Threat Hunters in Critical Infrastructures to improve their daily job. Among all the difficulties that Threat Hunters must face, a critical one is the vast amount of data that they must process with the consequent degradation in the process of situation understanding, decision making and the associated cognitive overwhelm.
This work, alongside others existing in the state-of-the-art, aims to solve that problem by proposing an architecture in order to help Threat Hunters by coping with the stated problem by means of a reduction of information presented to them using a Machine Learning approach that provides suggestions and hints about what is going on.
The current systems and tools stated in the state-of-the-art are mainly focused on the generation of IoCs, but none of them take into account tools to help Threat Hunters in the hypothesis generation process. As a consequence, there is gap in the generation of hypotheses using raw and/or ML processed data to know what is going on in the system monitored, which the proposed architecture tries to fill by enforcing hypothesis generation as a main aid to Threat Hunters. Consequently, one of the main contributions of the work described (and not fully found in similar solutions) is the provided capability to Threat Hunters to be helped by ML processes in generating complex and elaborated hypotheses about the current situation and what is more likely to happen in the near future. Furthermore, a key aspect of this kind of system, namely, visualization, is not fully exploited through the tools surveyed in the state-of-the-art, whereas in the proposed architecture, this element is enforced to help Threat Hunters in elaborating a proper understanding of the situation and the most likely evolution of events.
The proposed architecture takes into account several aspects. First of all, it is modular and upgradeable, as elements can be added or removed on demand dynamically, which gives it the capability of being ready for any kind of critical infrastructure. This is considered important from our point of view due to the fact that there are no two systems that are identical and this is not enforced in other papers and projects from the state-of-the-art. Secondly, it is asymmetrically scalable, so each resource assignment is orchestrated depending on the needs. Furthermore, it is big data-enabled, which means it can store and analyze vast amounts of data, and all the stored data is not only used for generating hypotheses, but Threat Hunters can also use it for conducting a deep study of potential malicious data or even for measuring the security levels of the Critical Infrastructure that is being monitored.
It is also able to exchange (request and response) data with external sources using standardized formats. This specific capability enables it to warn other Critical Infrastructures when there are common dependencies and when an attack with a similar entry vector is detected. In addition, as each component is stateless, the order of actions to perform a simple process is not relevant; therefore, processes can be parallelized to increase the performance of the overall system. Unlike the papers and projects in the current state-of-the-art, the proposed architecture follows High Availability enforcement schemas at all the essential components (database, communications broker and authentication management) to be confident about the uptime of the deployed system, which is crucial to be used in critical situations. Furthermore, this type of system is used in IT security departments to prevent and respond to cyber-attacks. Consequently, the data processed by the system are very sensitive, so being secure is a significant concern. To address this, the architecture allows several authentication methods to work safely with the data.
Lastly, the proposed architecture has been validated and verified implementing a prototype that was tested by Threat Hunters by answering specific surveys (Table 2) and by analyzing metrics of the hypothesis generator component (Table 3).

Author Contributions

Writing—original draft, M.A.L., I.P.L. and M.E.D. All authors have read and agreed to the published version of the manuscript.

Funding

This work was supported by the European Commission’s Project PRAETORIAN (Protection of Critical Infrastructures from advanced combined cyber and physical threats) under the Horizon 2020 Framework (Grant Agreement No. 101021274).

Data Availability Statement

The data analyzed in this study was synthetically generated. Data sharing is not applicable to this article.

Conflicts of Interest

The authors declare no conflict of interest.

Abbreviations

The following abbreviations are used in this manuscript:
APIApplication Programming Interface
APTAdvanced Persistent Threat
CICritical Infrastructures
CSACyber Situational Awareness
ECSElastic Common Schema
ESElastic Search
HAHigh Availability
HMIHuman-Machine Interface
IDSInstrusion Detection System
IoCIndicator of Compromise
IoTInternet of Things
IPInternet Protocol
IPSIntrusion Prevention System
ITInformation Technology
MLMachine Learning
OSOperating System
OSINTOpen Source Intelligence
OTPOne Time Passwords
SDNSoftware-Defined Networks
SIEMSecurity Information and Event Management
SMESmall and Medium Enterprise
SSLASecurity Service Levels Agreements
TMPThreat Management Platforms
VPNVirtual Private Network
VRVirtual-Reality

References

  1. PRAETORIAN. D3.1 Transitioning Risk Management, 2021. PRAETORIAN H2020 Project Deliverables, Not yet published.
  2. Li, J.H. Cyber security meets artificial intelligence: A survey. Front. Inf. Technol. Electron. Eng. 2018, 19, 1462–1474. [Google Scholar] [CrossRef]
  3. Falandays, J.B.; Nguyen, B.; Spivey, M.J. Is prediction nothing more than multi-scale pattern completion of the future? Brain Res. 2021, 1768, 147578. [Google Scholar] [CrossRef]
  4. Federmeier, K.D. Thinking ahead: The role and roots of prediction in language comprehension. Psychophysiology 2007, 44, 491–505. [Google Scholar] [CrossRef] [PubMed] [Green Version]
  5. Riegler, A. The role of anticipation in cognition. In Proceedings of the AIP Conference Proceedings. Am. Inst. Phys. 2001, 573, 534–541. [Google Scholar]
  6. Slattery, T.J.; Yates, M. Word skipping: Effects of word length, predictability, spelling and reading skill. Q. J. Exp. Psychol. 2018, 71, 250–259. [Google Scholar] [CrossRef] [PubMed]
  7. Lehner, P.; Seyed-Solorforough, M.M.; O’Connor, M.F.; Sak, S.; Mullin, T. Cognitive biases and time stress in team decision making. IEEE Trans. Syst. Man -Cybern.-Part Syst. Humans 1997, 27, 698–703. [Google Scholar] [CrossRef]
  8. Bilge, L.; Dumitraş, T. Before we knew it: An empirical study of zero-day attacks in the real world. In Proceedings of the 2012 ACM Conference on Computer and Communications Security, Raleigh North, CA, USA, 16–18 October 2012; pp. 833–844. [Google Scholar]
  9. Markowsky, G.; Markowsky, L. Visualizing cybersecurity events. In Proceedings of the International Conference on Security and Management (SAM), Las Vegas, NV, USA, 22–25 July 2013; p. 1. [Google Scholar]
  10. Young, C.S. Representing Cybersecurity Risk. In Cybercomplexity; Springer: Berlin/Heidelberg, Germany, 2022; pp. 19–24. [Google Scholar]
  11. Endsley, M.R. Measurement of situation awareness in dynamic systems. Hum. Factors 1995, 37, 65–84. [Google Scholar] [CrossRef]
  12. Franke, U.; Brynielsson, J. Cyber situational awareness–a systematic review of the literature. Comput. Secur. 2014, 46, 18–31. [Google Scholar] [CrossRef]
  13. Chen, S.; Guo, C.; Yuan, X.; Merkle, F.; Schaefer, H.; Ertl, T. Oceans: Online collaborative explorative analysis on network security. Proceedings of Eleventh Workshop on Visualization for Cyber Security, Paris, France, 10 November 2014; pp. 1–8. [Google Scholar]
  14. Choi, H.; Lee, H. PCAV: Internet attack visualization on parallel coordinates. In Proceedings of the International Conference on Information and Communications Security, Beijing, China, 10–13 December 2005; Springer: Berlin/Heidelberg, Germany, 2005; pp. 454–466. [Google Scholar]
  15. Jahromi, A.N.; Hashemi, S.; Dehghantanha, A.; Parizi, R.M.; Choo, K.K.R. An enhanced stacked LSTM method with no random initialization for malware threat hunting in safety and time-critical systems. IEEE Trans. Emerg. Top. Comput. Intell. 2020, 4, 630–640. [Google Scholar] [CrossRef]
  16. Schmitt, S.; Kandah, F.I.; Brownell, D. Intelligent threat hunting in software-defined networking. In Proceedings of the 2019 IEEE International Conference on Consumer Electronics (ICCE), Las Vegas, NV, USA, 11–13 January 2019; IEEE: Piscataway, NJ, USA, 2019; pp. 1–5. [Google Scholar]
  17. Schmitt, S. Advanced Threat Hunting over Software-Defined Networks in Smart Cities; University of Tennessee at Chattanooga: Chattanooga, Tennessee, USA, 2018. [Google Scholar]
  18. HaddadPajouh, H.; Dehghantanha, A.; Khayami, R.; Choo, K.K.R. A deep recurrent neural network based approach for internet of things malware threat hunting. Future Gener. Comput. Syst. 2018, 85, 88–96. [Google Scholar] [CrossRef]
  19. Raju, A.D.; Abualhaol, I.Y.; Giagone, R.S.; Zhou, Y.; Huang, S. A survey on cross-architectural IoT malware threat hunting. IEEE Access 2021, 9, 91686–91709. [Google Scholar] [CrossRef]
  20. Homayoun, S.; Dehghantanha, A.; Ahmadzadeh, M.; Hashemi, S.; Khayami, R. Know abnormal, find evil: Frequent pattern mining for ransomware threat hunting and intelligence. IEEE Trans. Emerg. Top. Comput. 2017, 8, 341–351. [Google Scholar] [CrossRef]
  21. Neto, A.J.H.; dos Santos, A.F.P. Cyber threat hunting through automated hypothesis and multi-criteria decision making. In Proceedings of the 2020 IEEE International Conference on Big Data (Big Data), Atlanta, GA, USA, 10–13 December 2020; IEEE: Piscataway, NJ, USA, 2020; pp. 1823–1830. [Google Scholar]
  22. Gonzalez-Granadillo, G.; Faiella, M.; Medeiros, I.; Azevedo, R.; Gonzalez-Zarzosa, S. ETIP: An Enriched Threat Intelligence Platform for improving OSINT correlation, analysis, visualization and sharing capabilities. J. Inf. Secur. Appl. 2021, 58, 102715. [Google Scholar] [CrossRef]
  23. Azevedo, R.; Medeiros, I.; Bessani, A. PURE: Generating quality threat intelligence by clustering and correlating OSINT. In Proceedings of the 2019 18th IEEE International Conference On Trust, Security And Privacy In Computing And Communications (TrustCom), Rotorua, New Zealand, 5–8 August 2019; IEEE: Piscataway, NJ, USA, 2019; pp. 483–490. [Google Scholar]
  24. Alves, F.; Ferreira, P.M.; Bessani, A. OSINT-based Data-driven Cybersecurity Discovery. In Proceedings of the 12th Eurosys Doctoral Conference, Porto, Portugal, 23 April 2018; pp. 1–5. [Google Scholar]
  25. Kott, A.; Wang, C.; Erbacher, R.F. Cyber Defense and Situational Awareness; Springer: Berlin/Heidelberg, Germany, 2015; Volume 62. [Google Scholar]
  26. Greitzer, F.L.; Noonan, C.F.; Franklin, L. Cognitive Foundations for Visual Analytics; Technical Report; Pacific Northwest National Lab.(PNNL): Richland, WA, USA, 2011. [Google Scholar]
  27. Eslami, M.; Zheng, G.; Eramian, H.; Levchuk, G. Deriving cyber use cases from graph projections of cyber data represented as bipartite graphs. In Proceedings of the 2017 IEEE International Conference on Big Data (Big Data), Boston, MA, USA, 11–14 December 2017; IEEE: Piscataway, NJ, USA, 2017; pp. 4658–4663. [Google Scholar]
  28. Kotenko, I.; Novikova, E. Visualization of security metrics for cyber situation awareness. In Proceedings of the 2014 Ninth International Conference on Availability, Reliability and Security, Fribourg, Switzerland, 8–12 September 2014; IEEE: Piscataway, NJ, USA, 2014; pp. 506–513. [Google Scholar]
  29. Beaver, J.M.; Steed, C.A.; Patton, R.M.; Cui, X.; Schultz, M. Visualization techniques for computer network defense. In Proceedings of the Sensors, and Command, Control, Communications, and Intelligence (C3I) Technologies for Homeland Security and Homeland Defense X. SPIE, Orlando, FL, USA,, 25–28 April 2011; Volume 8019, pp. 18–26. [Google Scholar]
  30. Goodall, J.R.; Ragan, E.D.; Steed, C.A.; Reed, J.W.; Richardson, G.D.; Huffer, K.M.; Bridges, R.A.; Laska, J.A. Situ: Identifying and explaining suspicious behavior in networks. IEEE Trans. Vis. Comput. Graph. 2018, 25, 204–214. [Google Scholar] [CrossRef] [PubMed]
  31. Zhuo, Y.; Zhang, Q.; Gong, Z. Cyberspace situation representation based on niche theory. In Proceedings of the 2008 International Conference on Information and Automation, Zhangjiajie, China, 20–23 June 2008; IEEE: Piscataway, NJ, USA, 2008; pp. 1400–1405. [Google Scholar]
  32. Pike, W.A.; Scherrer, C.; Zabriskie, S. Putting security in context: Visual correlation of network activity with real-world information. In VizSEC 2007; Springer: Berlin/Heidelberg, Germany, 2008; pp. 203–220. [Google Scholar]
  33. Abraham, S.; Nair, S. Comparative analysis and patch optimization using the cyber security analytics framework. J. Def. Model. Simul. 2018, 15, 161–180. [Google Scholar] [CrossRef]
  34. Graf, R.; Gordea, S.; Ryan, H.M.; Houzanme, T. An Expert System for Facilitating an Institutional Risk Profile Definition for Cyber Situational Awareness. In Proceedings of the ICISSP, Rome, Italy, 19–21 February 2016; pp. 347–354. [Google Scholar]
  35. Lohmann, S.; Heimerl, F.; Bopp, F.; Burch, M.; Ertl, T. Concentri cloud: Word cloud visualization for multiple text documents. In Proceedings of the 2015 19th International Conference on Information Visualisation, Barcelona, Spain, 22–24 July 2015; IEEE: Piscataway, NJ, USA, 2015; pp. 114–120. [Google Scholar]
  36. Xu, J.; Tao, Y.; Lin, H. Semantic word cloud generation based on word embeddings. In Proceedings of the 2016 IEEE Pacific Visualization Symposium (PacificVis), Taipei, Taiwan, 19–22 April 2016; IEEE: Piscataway, NJ, USA, 2016; pp. 239–243. [Google Scholar]
  37. De Ville, B. Decision trees. Wiley Interdiscip. Rev. Comput. Stat. 2013, 5, 448–455. [Google Scholar]
  38. Tak, S.; Cockburn, A. Enhanced spatial stability with hilbert and moore treemaps. IEEE Trans. Vis. Comput. Graph. 2012, 19, 141–148. [Google Scholar] [CrossRef] [Green Version]
  39. Angelini, M.; Bonomi, S.; Lenti, S.; Santucci, G.; Taggi, S. MAD: A visual analytics solution for Multi-step cyber Attacks Detection. J. Comput. Lang. 2019, 52, 10–24. [Google Scholar]
  40. Zhong, C.; Alnusair, A.; Sayger, B.; Troxell, A.; Yao, J. AOH-map: A mind mapping system for supporting collaborative cyber security analysis. In Proceedings of the 2019 IEEE Conference on Cognitive and Computational Aspects of Situation Management (CogSIMA), Las Vegas, NV, USA, 8–11 April 2019; IEEE: Piscataway, NJ, USA, 2019; pp. 74–80. [Google Scholar]
  41. Cho, S.; Han, I.; Jeong, H.; Kim, J.; Koo, S.; Oh, H.; Park, M. Cyber kill chain based threat taxonomy and its application on cyber common operational picture. In Proceedings of the 2018 International Conference On Cyber Situational Awareness, Data Analytics And Assessment (Cyber SA), Glasgow, Scotland, UK, 11–12 June 2018; IEEE: Piscataway, NJ, USA, 2018; pp. 1–8. [Google Scholar]
  42. Kabil, A.; Duval, T.; Cuppens, N.; Comte, G.L.; Halgand, Y.; Ponchel, C. From cyber security activities to collaborative virtual environments practices through the 3D cybercop platform. In Proceedings of the International Conference on Information Systems Security, Funchal, Madeira, Portugal, 22–24 January 2018; Springer: Berlin/Heidelberg, Germany, 2018; pp. 272–287. [Google Scholar]
  43. Kopylec, J.; D’Amico, A.; Goodall, J. Visualizing cascading failures in critical cyber infrastructures. In Proceedings of the International Conference on Critical Infrastructure Protection, Hanover, NH, USA, 18–21 March 2007; Springer: Berlin/Heidelberg, Germany, 2007; pp. 351–364. [Google Scholar]
  44. Llopis, S.; Hingant, J.; Pérez, I.; Esteve, M.; Carvajal, F.; Mees, W.; Debatty, T. A comparative analysis of visualisation techniques to achieve cyber situational awareness in the military. In Proceedings of the 2018 International Conference on Military Communications and Information Systems (ICMCIS), Varsoiva, Poland, 22–23 May 2018; IEEE: Piscataway, NJ, USA, 2018; pp. 1–7. [Google Scholar]
  45. Carvalho, V.S.; Polidoro, M.J.; Magalhaes, J.P. Owlsight: Platform for real-time detection and visualization of cyber threats. In Proceedings of the 2016 IEEE 2nd International Conference on Big Data Security on Cloud (BigDataSecurity), New York, NY, USA, 8–10 April 2016; IEEE: Piscataway, NJ, USA, 2016; pp. 61–66. [Google Scholar]
  46. Pietrowicz, S.; Falchuk, B.; Kolarov, A.; Naidu, A. Web-Based Smart Grid Network Analytics Framework. In Proceedings of the 2015 IEEE International Conference on Information Reuse and Integration, San Francisco, CA, USA, 13–15 August 2015; IEEE: Piscataway, NJ, USA, 2015; pp. 496–501. [Google Scholar]
  47. Matuszak, W.J.; DiPippo, L.; Sun, Y.L. Cybersave: Situational awareness visualization for cyber security of smart grid systems. In Proceedings of the Tenth Workshop on Visualization for Cyber Security, Atlanta, GA, USA, 14 October 2013; pp. 25–32. [Google Scholar]
  48. Kabil, A.; Duval, T.; Cuppens, N. Alert characterization by non-expert users in a cybersecurity virtual environment: A usability study. In Proceedings of the International Conference on Augmented Reality, Virtual Reality and Computer Graphics, Lecce, Italy, 7–10 September 2020; Springer: Berlin/Heidelberg, Germany, 2020; pp. 82–101. [Google Scholar]
  49. Kullman, K.; Cowley, J.; Ben-Asher, N. Enhancing cyber defense situational awareness using 3D visualizations. In Proceedings of the 13th International Conference on Cyber Warfare and Security ICCWS 2018, National Defense University, Washington, DC, USA, 8–9 March 2018; pp. 369–378. [Google Scholar]
  50. Kullman, K.; Asher, N.B.; Sample, C. Operator impressions of 3D visualizations for cybersecurity analysts. In Proceedings of the ECCWS 2019 18th European Conference on Cyber Warfare and Security, Coimbra, Portugal, 4–5 July 2019; Academic Conferences and publishing limited: Red Hook, NY, USA, 2019; p. 257. [Google Scholar]
  51. Reed, J. Threat Hunting with ML: Another Reason to SMLE. 17 February 2021. Available online: https://www.splunk.com/en_us/blog/platform/threat-research-at-splunk-using-smle.html (accessed on 28 March 2023).
  52. Liang, J.; Kim, Y. Evolution of Firewalls: Toward Securer Network Using Next Generation Firewall. In Proceedings of the 2022 IEEE 12th Annual Computing and Communication Workshop and Conference (CCWC), Virutal, 26–29 January 2022; IEEE: Piscataway, NJ, USA, 2022; pp. 752–759. [Google Scholar]
  53. IBM X-Force Exchange. Available online: https://exchange.xforce.ibmcloud.com/ (accessed on 3 March 2023).
  54. The Security Immune System: An Integrated Approach to Protecting Your Organization. Available online: https://www.midlandinfosys.com/pdf/qradar-siem-cybersecurity-ai-products.pdf (accessed on 3 March 2023).
  55. Anomali ThreatStream: Automated Threat Intelligence Management at Scale. Available online: https://www.anomali.com/products/threatstream (accessed on 3 March 2023).
  56. Wang, B.; Najjar, L.; Xiong, N.N.; Chen, R.C. Stochastic optimization: Theory and applications. J. Appl. Math. 2013, 2013, 949131. [Google Scholar] [CrossRef]
  57. McCall, J. Genetic algorithms for modelling and optimisation. J. Comput. Appl. Math. 2005, 184, 205–222. [Google Scholar] [CrossRef]
  58. Jangla, K. Docker Compose. In Accelerating Development Velocity Using Docker; Springer: Berlin/Heidelberg, Germany, 2018; pp. 77–98. [Google Scholar]
  59. Li, Y.; Li, W.; Jiang, C. A survey of virtual machine system: Current technology and future trends. In Proceedings of the 2010 Third International Symposium on Electronic Commerce and Security, Guangzhou, China, 29–31 July 2010; IEEE: Piscataway, NJ, USA, 2010; pp. 332–336. [Google Scholar]
  60. Medel, V.; Rana, O.; Bañares, J.Á.; Arronategui, U. Modelling performance & resource management in kubernetes. In Proceedings of the 9th International Conference on Utility and Cloud Computing, Shanghai, Chine, 6–9 December 2016; pp. 257–262. [Google Scholar]
  61. Kotas, C.; Naughton, T.; Imam, N. A comparison of Amazon Web Services and Microsoft Azure cloud platforms for high performance computing. In Proceedings of the 2018 IEEE International Conference on Consumer Electronics (ICCE), Las Vegas, NV, USA, 12–14 January 2018; IEEE: Piscataway, NJ, USA, 2018; pp. 1–4. [Google Scholar]
  62. Gray, J.; Siewiorek, D.P. High-availability computer systems. Computer 1991, 24, 39–48. [Google Scholar] [CrossRef] [Green Version]
  63. Wilson, K.S. Conflicts among the pillars of information assurance. IT Prof. 2012, 15, 44–49. [Google Scholar] [CrossRef]
  64. Rinaldi, S.M.; Peerenboom, J.P.; Kelly, T.K. Identifying, understanding, and analyzing critical infrastructure interdependencies. IEEE Control Syst. Mag. 2001, 21, 11–25. [Google Scholar]
  65. Fleissner, S.; Baniassad, E. A commensalistic software system. In Proceedings of the Companion to the 21st ACM SIGPLAN Symposium on Object-Oriented Programming Systems, Languages, and Applications, Portland, OR, USA, 22–26 October 2006; pp. 560–573. [Google Scholar]
  66. Torchiano, M.; Jaccheri, L.; Sørensen, C.F.; Wang, A.I. COTS products characterization. In Proceedings of the 14th International Conference on Software Engineering and Knowledge Engineering, Ischia, Italy, 15–19 July 2002; pp. 335–338. [Google Scholar]
  67. Coppolino, L.; D’Antonio, S.; Formicola, V.; Romano, L. Integration of a System for Critical Infrastructure Protection with the OSSIM SIEM Platform: A dam case study. In Proceedings of the International Conference on Computer Safety, Reliability, and Security, Naples, Italy, 19–22 September 2011; Springer: Berlin/Heidelberg, Germany, 2011; pp. 199–212. [Google Scholar]
  68. Cerullo, G.; Formicola, V.; Iamiglio, P.; Sgaglione, L. Critical Infrastructure Protection: Having SIEM technology cope with network heterogeneity. arXiv 2014, arXiv:1404.7563. [Google Scholar]
  69. Veselý, V. Extended Comparison Study on Merging PCAP Files. ElectroScope 2012, 2012, 1–6. [Google Scholar]
  70. Wagner, C.; Dulaunoy, A.; Wagener, G.; Iklody, A. Misp: The design and implementation of a collaborative threat intelligence sharing platform. In Proceedings of the 2016 ACM on Workshop on Information Sharing and Collaborative Security, Vienna, Austria, 24 October 2016; pp. 49–56. [Google Scholar]
  71. Groenewegen, A.; Janssen, J.S. TheHive Project: The Maturity of an Open-Source Security Incident Response Platform; SNE/OS3; University of Amsterdam: Amsterdam, The Netherlands, 2021. [Google Scholar]
  72. Gonashvili, M. Knowledge Management for Incident Response Teams; Masaryk University: Brno, Czech Republic, 2019. [Google Scholar]
  73. Cole, E. Advanced Persistent Threat: Understanding the Danger and How to Protect Your Organization; Syngress: Oxford, UK, 2012. [Google Scholar]
  74. Tabatabaei, F.; Wells, D. OSINT in the Context of Cyber-Security. Open Source Intell. Investig. 2016, 1, 213–231. [Google Scholar]
  75. Verhoef, R. Sigma Rules! The Generic Signature Format for SIEM Systems. 19 June 2020. Available online: https://isc.sans.edu/diary/rss/26258 (accessed on 7 February 2023).
  76. Ömer. What Is Sigma? Threat Hunting in Siem Products with Sigma Rules–Example Sigma Rules. 21 March 2021. Available online: https://www.systemconf.com/2021/03/21/what-is-sigma-threat-hunting-in-siem-products-with-sigma-rules-example-sigma-rules/ (accessed on 7 February 2023).
  77. Naik, N.; Jenkins, P.; Savage, N.; Yang, L.; Boongoen, T.; Iam-On, N.; Naik, K.; Song, J. Embedded YARA rules: Strengthening YARA rules utilising fuzzy hashing and fuzzy rules for malware analysis. Complex Intell. Syst. 2021, 7, 687–702. [Google Scholar] [CrossRef]
  78. Naik, N.; Jenkins, P.; Savage, N.; Yang, L. Cyberthreat Hunting-Part 1: Triaging ransomware using fuzzy hashing, import hashing and YARA rules. In Proceedings of the 2019 IEEE International Conference on Fuzzy Systems (FUZZ-IEEE), New Orleans, LA, USA, 23–26 June 2019; IEEE: Piscataway, NJ, USA, 2019; pp. 1–6. [Google Scholar]
  79. Knuth, D.E. The Art of Computer Programming, 2nd ed.; Sorting and Searching; Addison Wesley Longman Publishing Co., Inc.: Boston, MA, USA, 1998; Volume 3. [Google Scholar]
  80. Gianvecchio, S.; Burkhalter, C.; Lan, H.; Sillers, A.; Smith, K. Closing the Gap with APTs Through Semantic Clusters and Automated Cybergames. In Proceedings of the Security and Privacy in Communication Networks, Orlando, FL, USA, 23–25 October 2019; Chen, S., Choo, K.K.R., Fu, X., Lou, W., Mohaisen, A., Eds.; Springer International Publishing: Cham, Switzerland, 2019; pp. 235–254. [Google Scholar]
  81. Divya, M.S.; Goyal, S.K. ElasticSearch: An advanced and quick search technique to handle voluminous data. Compusoft 2013, 2, 171. [Google Scholar]
  82. Hancock, J.T.; Khoshgoftaar, T.M. Survey on categorical data for neural networks. J. Big Data 2020, 7, 28. [Google Scholar] [CrossRef] [Green Version]
  83. Schetinin, V.; Schult, J. A neural-network technique to learn concepts from electroencephalograms. Theory Biosci. 2005, 124, 41–53. [Google Scholar] [CrossRef] [Green Version]
  84. Gallant, S.I.; Gallant, S.I. Neural Network Learning and Expert Systems; MIT Press: Cambridge, MA, USA, 1993. [Google Scholar]
  85. Murthy, S.K.; Kasif, S.; Salzberg, S. A system for induction of oblique decision trees. J. Artif. Intell. Res. 1994, 2, 1–32. [Google Scholar] [CrossRef]
  86. Quinlan, J.R. Induction of decision trees. Mach. Learn. 1986, 1, 81–106. [Google Scholar] [CrossRef] [Green Version]
  87. Zhang, T.; Ramakrishnan, R.; Livny, M. BIRCH: A new data clustering algorithm and its applications. Data Min. Knowl. Discov. 1997, 1, 141–182. [Google Scholar] [CrossRef]
  88. Zhang, T.; Ramakrishnan, R.; Livny, M. BIRCH: An efficient data clustering method for very large databases. ACM Sigmod Rec. 1996, 25, 103–114. [Google Scholar] [CrossRef]
  89. Khan, K.; Rehman, S.U.; Aziz, K.; Fong, S.; Sarasvady, S. DBSCAN: Past, present and future. In Proceedings of the Fifth International Conference on the Applications of Digital Information and Web Technologies (ICADIWT 2014), Chennai, India, 17–19 February 2014; IEEE: Piscataway, NJ, USA, 2014; pp. 232–238. [Google Scholar]
  90. Çelik, M.; Dadaşer-Çelik, F.; Dokuz, A.Ş. Anomaly detection in temperature data using DBSCAN algorithm. In Proceedings of the 2011 International Symposium on Innovations in Intelligent Systems and Applications, Istanbul, Turkey, 15–18 June 2011; IEEE: Piscataway, NJ, USA, 2011; pp. 91–95. [Google Scholar]
  91. Liu, F.T.; Ting, K.M.; Zhou, Z.H. Isolation forest. In Proceedings of the 2008 Eighth IEEE International Conference on Data Mining, Pisa, Italy, 15–19 December 2008; IEEE: Piscataway, NJ, USA, 2008; pp. 413–422. [Google Scholar]
  92. Ding, Z.; Fei, M. An anomaly detection approach based on isolation forest algorithm for streaming data using sliding window. IFAC Proc. Vol. 2013, 46, 12–17. [Google Scholar] [CrossRef]
  93. Amer, M.; Goldstein, M.; Abdennadher, S. Enhancing one-class support vector machines for unsupervised anomaly detection. In Proceedings of the ACM SIGKDD Workshop on Outlier Detection and Description, Chicago, Illinois, 11 August 2013; pp. 8–15. [Google Scholar]
  94. Hejazi, M.; Singh, Y.P. One-class support vector machines approach to anomaly detection. Appl. Artif. Intell. 2013, 27, 351–366. [Google Scholar] [CrossRef]
  95. Ukwen, D.O.; Karabatak, M. Review of NLP-based Systems in Digital Forensics and Cybersecurity. In Proceedings of the 2021 9th International Symposium on Digital Forensics and Security (ISDFS), Elazig, Turkey, 28–29 June 2021; IEEE: Piscataway, NJ, USA, 2021; pp. 1–9. [Google Scholar]
  96. Georgescu, T.M. Natural language processing model for automatic analysis of cybersecurity-related documents. Symmetry 2020, 12, 354. [Google Scholar] [CrossRef]
  97. Mathews, S.M. Explainable artificial intelligence applications in NLP, biomedical, and malware classification: A literature review. In Proceedings of the Intelligent Computing-Proceedings of the Computing Conference, London, UK, 16–17 July 2019; Springer: Berlin/Heidelberg, Germany, 2019; pp. 1269–1292. [Google Scholar]
  98. Al-Omari, M.; Rawashdeh, M.; Qutaishat, F.; Alshira’H, M.; Ababneh, N. An intelligent tree-based intrusion detection model for cyber security. J. Netw. Syst. Manag. 2021, 29, 20. [Google Scholar] [CrossRef]
  99. Sarker, I.H. Deep cybersecurity: A comprehensive overview from neural network and deep learning perspective. SN Comput. Sci. 2021, 2, 154. [Google Scholar]
  100. Fang, H. Managing data lakes in big data era: What’s a data lake and why has it became popular in data management ecosystem. In Proceedings of the 2015 IEEE International Conference on Cyber Technology in Automation, Control, and Intelligent Systems (CYBER), Shenyang, China, 8–12 June 2015; IEEE: Piscataway, NJ, USA, 2015; pp. 820–824. [Google Scholar]
  101. Goyal, G.; Singh, K.; Ramkumar, K. A detailed analysis of data consistency concepts in data exchange formats (JSON & XML). In Proceedings of the 2017 International Conference on Computing, Communication and Automation (ICCCA), Greater Noida, India, 5–6 May 2017; IEEE: Piscataway, NJ, USA, 2017; pp. 72–77. [Google Scholar]
  102. Barnum, S. Standardizing cyber threat intelligence information with the structured threat information expression (stix). Mitre Corp. 2012, 11, 1–22. [Google Scholar]
  103. Riesco, R.; Villagrá, V.A. Leveraging cyber threat intelligence for a dynamic risk framework. Int. J. Inf. Secur. 2019, 18, 715–739. [Google Scholar] [CrossRef]
  104. Na, S.; Kim, T.; Kim, H. A study on the classification of common vulnerabilities and exposures using naïve bayes. In Proceedings of the International Conference on Broadband and Wireless Computing, Communication and Applications, Asan, Republic of Korea, 5–7 November 2016; Springer: Berlin/Heidelberg, Germany, 2016; pp. 657–662. [Google Scholar]
  105. Radack, S.; Kuhn, R. Managing security: The security content automation protocol. IT Prof. 2011, 13, 9–11. [Google Scholar] [CrossRef]
  106. VirusTotal: Analyse Suspicious Files, Domains, IPs and URLs to Detect Malware and Other Breaches, Automatically Share Them with the Security Community. Available online: https://www.virustotal.com (accessed on 3 March 2023).
  107. URLhaus: Malware URL Exchange. Available online: https://urlhaus.abuse.ch/ (accessed on 3 March 2023).
  108. Masse, M. REST API Design Rulebook: Designing Consistent RESTful Web Service Interfaces; O’Reilly Media, Inc.’: Sebastopol, CA, USA, 2011. [Google Scholar]
  109. Naik, N. Choice of effective messaging protocols for IoT systems: MQTT, CoAP, AMQP and HTTP. In Proceedings of the 2017 IEEE International Systems Engineering Symposium (ISSE), Vienna, Austria, 11–13 October 2017; IEEE: Piscataway, NJ, USA, 2017; pp. 1–7. [Google Scholar]
  110. Sandhu, R.S.; Coyne, E.J.; Feinstein, H.L.; Youman, C.E. Role-based access control models. Computer 1996, 29, 38–47. [Google Scholar] [CrossRef] [Green Version]
  111. Tomasek, M.; Cerny, T. On web services ui in user interface generation in standalone applications. In Proceedings of the 2015 Conference on Research in Adaptive and Convergent Systems, Prague, Czech Republic, 9–12 October 2015; pp. 363–368. [Google Scholar]
  112. Montesi, F.; Weber, J. Circuit breakers, discovery, and API gateways in microservices. arXiv 2016, arXiv:1609.05830. [Google Scholar]
  113. Xu, R.; Jin, W.; Kim, D. Microservice security agent based on API gateway in edge computing. Sensors 2019, 19, 4905. [Google Scholar] [CrossRef] [PubMed] [Green Version]
  114. Jeong, J.; Chung, M.Y.; Choo, H. Integrated OTP-based user authentication scheme using smart cards in home networks. In Proceedings of the 41st Annual Hawaii International Conference on System Sciences (HICSS 2008), Big Island, HI, USA, 7–10 January 2008; IEEE: Piscataway, NJ, USA, 2008; p. 294. [Google Scholar]
  115. Zhao, S.; Hu, W. Improvement on OTP authentication and a possession-based authentication framework. Int. J. Multimed. Intell. Secur. 2018, 3, 187–203. [Google Scholar] [CrossRef]
  116. Bihis, C. Mastering OAuth 2.0; Packt Publishing Ltd.: Birmingham, UK, 2015. [Google Scholar]
  117. Hardt, D. The OAuth 2.0 Authorization Framework. RFC 6749, RFC Editor, 2012. Available online: http://www.rfc-editor.org/rfc/rfc6749.txt (accessed on 28 March 2023).
  118. Haag, S.; Anderl, R. Digital twin–Proof of concept. Manuf. Lett. 2018, 15, 64–66. [Google Scholar] [CrossRef]
  119. Srinath, K. Python–the fastest growing programming language. Int. Res. J. Eng. Technol. 2017, 4, 354–357. [Google Scholar]
  120. Nelli, F. Python Data Analytics: Data Analysis and Science Using PANDAs, Matplotlib and the Python Programming Language; Apress: Sebastopol, CA, USA, 2015. [Google Scholar]
  121. Hao, J.; Ho, T.K. Machine learning made easy: A review of scikit-learn package in python programming language. J. Educ. Behav. Stat. 2019, 44, 348–361. [Google Scholar] [CrossRef]
  122. Al-Shaer, R.; Spring, J.M.; Christou, E. Learning the associations of mitre att & ck adversarial techniques. In Proceedings of the 2020 IEEE Conference on Communications and Network Security (CNS), Virtual, 28–30 June 2020; IEEE: Piscataway, NJ, USA, 2020; pp. 1–9. [Google Scholar]
  123. Alexander, O.; Belisle, M.; Steele, J. MITRE ATT&CK for Industrial Control Systems: Design and Philosophy; The MITRE Corporation: Bedford, MA, USA, 2020. [Google Scholar]
  124. Ahmed, M.; Panda, S.; Xenakis, C.; Panaousis, E. MITRE ATT&CK-driven cyber risk assessment. In Proceedings of the 17th International Conference on Availability, Reliability and Security, Vienna, Austria, 23–26 August 2022; pp. 1–10. [Google Scholar]
  125. Roy, G.M. RabbitMQ in Depth; Simon and Schuster: New York, NY, USA, 2017. [Google Scholar]
  126. Ionescu, V.M. The analysis of the performance of RabbitMQ and ActiveMQ. In Proceedings of the 2015 14th RoEduNet International Conference-Networking in Education and Research (RoEduNet NER), Craiova, Romania, 24–26 September 2015; IEEE: Piscataway, NJ, USA, 2015; pp. 132–137. [Google Scholar]
  127. Rostanski, M.; Grochla, K.; Seman, A. Evaluation of highly available and fault-tolerant middleware clustered architectures using RabbitMQ. In Proceedings of the 2014 Federated Conference on Computer Science and Information Systems, Warsaw, Poland, 7–10 September 2014; IEEE: Piscataway, NJ, USA, 2014; pp. 879–884. [Google Scholar]
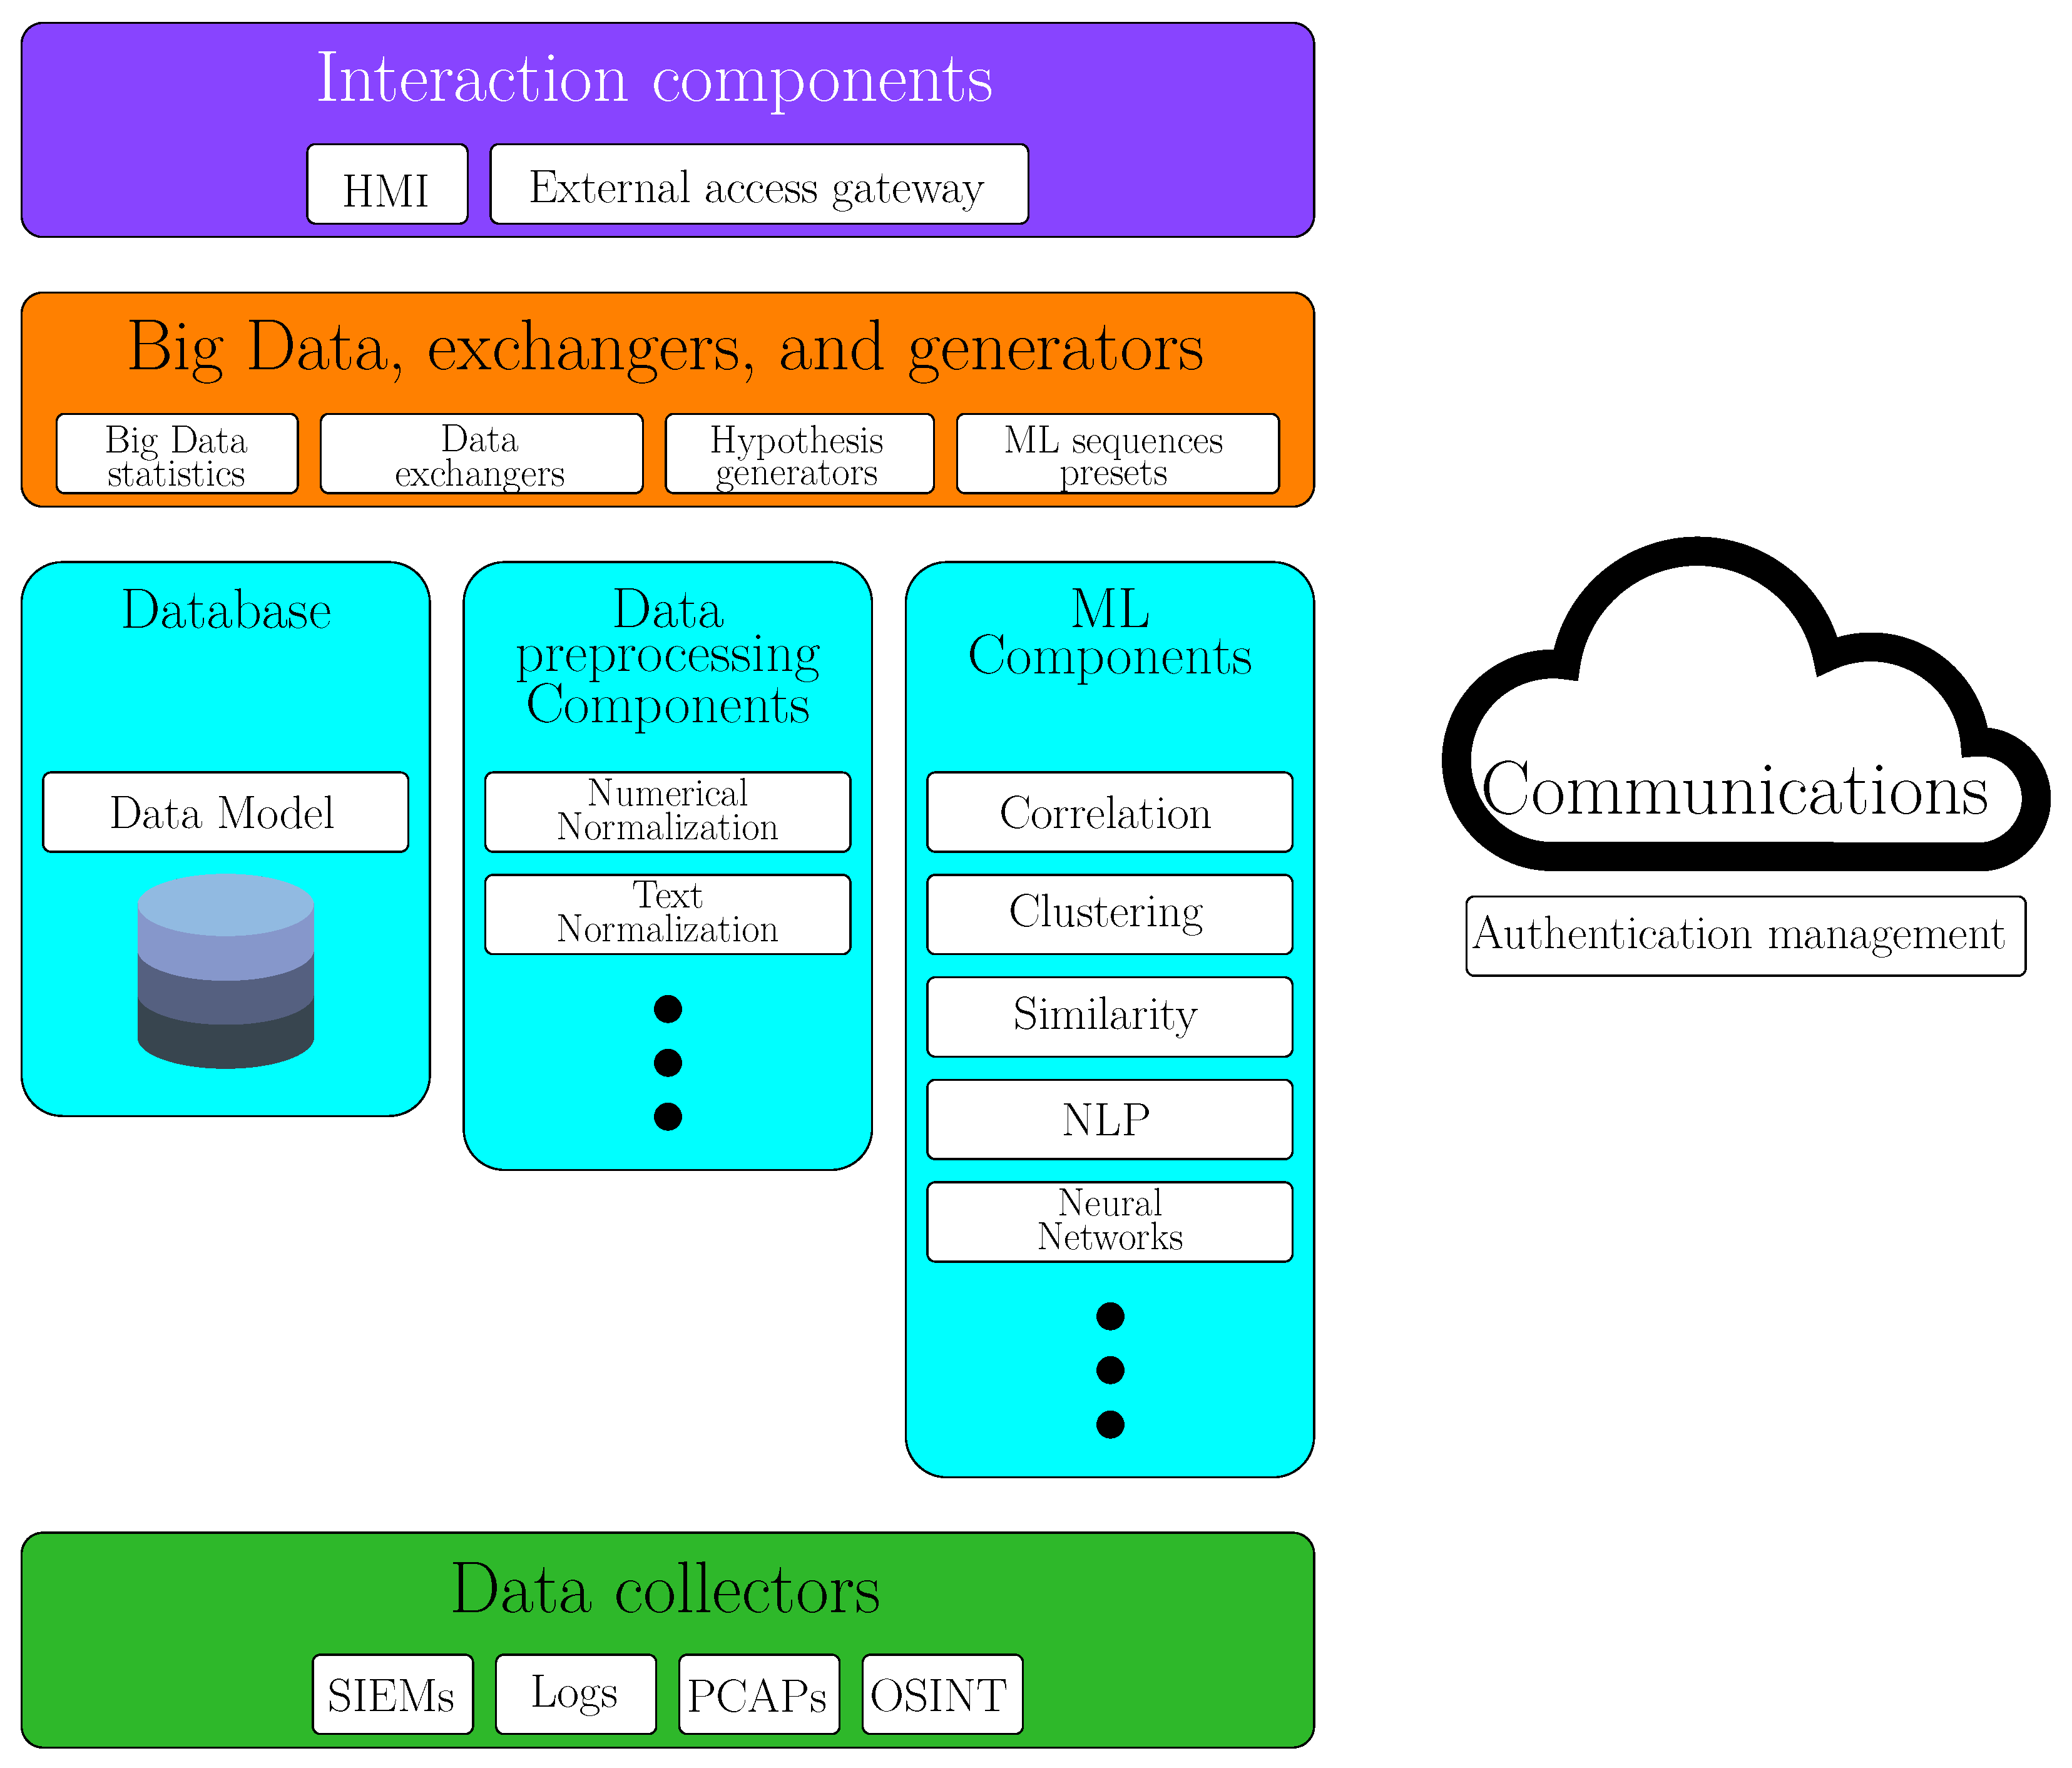
Figure 1. Proposed architecture. Groups of components from bottom to top and from left to right: Section 4.1, Section 4.2, Section 4.3, Section 4.4, Section 4.5, Section 4.6, Section 4.7 and Section 4.8.
Bdcc 07 00065 g001
Figure 2. Prototype architecture.
Bdcc 07 00065 g002
Figure 3. Digital twin.
Bdcc 07 00065 g003
Figure 4. HMI: Data Context data.
Bdcc 07 00065 g004
Figure 5. HMI: Hypothesis: APT.
Bdcc 07 00065 g005
Figure 6. HMI: Hypothesis: Automation.
Bdcc 07 00065 g006
Figure 7. HMI: Hypothesis: Anomalies.
Bdcc 07 00065 g007
Figure 8. HMI: Chart Force Graph.
Bdcc 07 00065 g008
Figure 9. HMI: Chart Circle Packing.
Bdcc 07 00065 g009
Figure 10. HMI: Chart Sun Burst.
Bdcc 07 00065 g010
Figure 11. HMI: Chart Tree Map.
Bdcc 07 00065 g011
Table 1. Data model highlighted ECS fields.
ECS FieldDescription
event.datasetName of the dataset
event.idUnique ID to describe the event
event.ingestedTimestamp when an event arrived to the central data store
event.createdThe date/time when the event was first read by an agent
event.startsThe date when the event started
event.endThe date when the event ended
event.actionThe action captured by the event
event.originalRaw text message of entire event
source.ipIP address of the source (IPv4 or IPv6)
source.macMAC address of the source
source.portPort of the source
source.hostnameHostname of the source.
destination.ipIP address of the destination (IPv4 or IPv6)
destination.macMAC address of the destination
destination.portPort of the destination
destination.hostnameHostname of the destination
Table 2. Sample of verification survey questions.
Question
Does the prototype give fast access to the information considered as relevant?
Does the prototype receive updated information from external sources?
Does the prototype send information to external sources?
Does the prototype provide tools to easily create/edit/delete preprocessing components?
Does the prototype provide tools to easily create/edit/delete ML components?
Does the prototype help at the decision making process?
Is the prototype easy to use?
Table 3. Metrics of the hypothesis generator component.
MetricAfter 1 MonthAfter 6 Months
Percentage of benign events marked correctly by the prototype31.56%83.49%
Percentage of malign events marked correctly by the platform23.16%73.08%
Ratio of likeliness of the hypothesis24.62%89.24%
Percentage of attacks detected by the platform26.74%86.31%
Disclaimer/Publisher’s Note: The statements, opinions and data contained in all publications are solely those of the individual author(s) and contributor(s) and not of MDPI and/or the editor(s). MDPI and/or the editor(s) disclaim responsibility for any injury to people or property resulting from any ideas, methods, instructions or products referred to in the content.