
Ensuring SDN Resilience under the Influence of Cyber Attacks: Combining Methods of Topological Transformation of Stochastic Networks, Markov Processes, and Neural Networks


Abstract
1. Introduction
- The flow paradigm is ideal for security because it offers an end-to-end, service-oriented approach that is not bound by traditional routing constraints;
- Logically centralized management allows one to effectively control performance and threats throughout the network;
- Granular policy control can be based on application, maintenance, organization and geographic criteria rather than physical configuration;
- Resource-based security policies allow the consolidated management of multiple devices with different security risks, from highly secure firewalls and security devices to device access;
- Dynamic and flexible configuration of the security policy is provided by software control;
- Flexible traffic control provides the fast deterrence and isolation of intrusions without affecting other network users [2].
- Control level (control plane);
- Data transfer level (data plane).
- A software solution entails thousands of lines of program code, which, in turn, entails the presence of unintentional errors;
- A significant part of the vulnerabilities was pumped into the technology from the TCP/IP protocol stack;
- The presence of a device that fully manages the network and owns all the information about the network requires additional protection means and mechanisms;
- A new technology implies an intensive emergence of new vulnerabilities specific to this technology.
- SDN network users receiving network services;
- Channel from user to network device;
- Network device Open Flow;
- Control and monitoring channel Open Flow;
- SDN controller.
2. Related Work
3. An Approach to Ensuring the SDN Resilience
3.1. Basic Expressions for Evaluating SDN Resilience
- Failure of the transport network controller or substitution of the controller in order to control the network intruder in their own interests;
- Failure of routers responsible for the transport component of the network;
- Topology substitution, in which an intruder posing as a transport network router creates black holes for transmitted traffic;
- Failure of the communication channels between network nodes.
- SDN aggregated resilient-state graph under CA conditions (see Figure 3).
- A set of SDN states under CA maintenance conditions:
- 3.
- A set of event flows, when the SDN states change in the CA conditions:
- 4.
- Characteristics of persistent SDN aggregated states when they are exposed to CAs (see Table 2).
- 5.
- Event flow intensities (see Table 3).
- 6.
- The probability vector of the initial states of the system: .
- 7.
- Normalization condition:
3.2. Examples of CA Reference Models
3.2.1. Verbal Model of CAs against SDN
3.2.2. Model of the “Substitution of Network Topology” Attack against SDN
3.2.3. Model of the “Hacking/Crashing Controller” Attack against SDN
4. Experimental Results
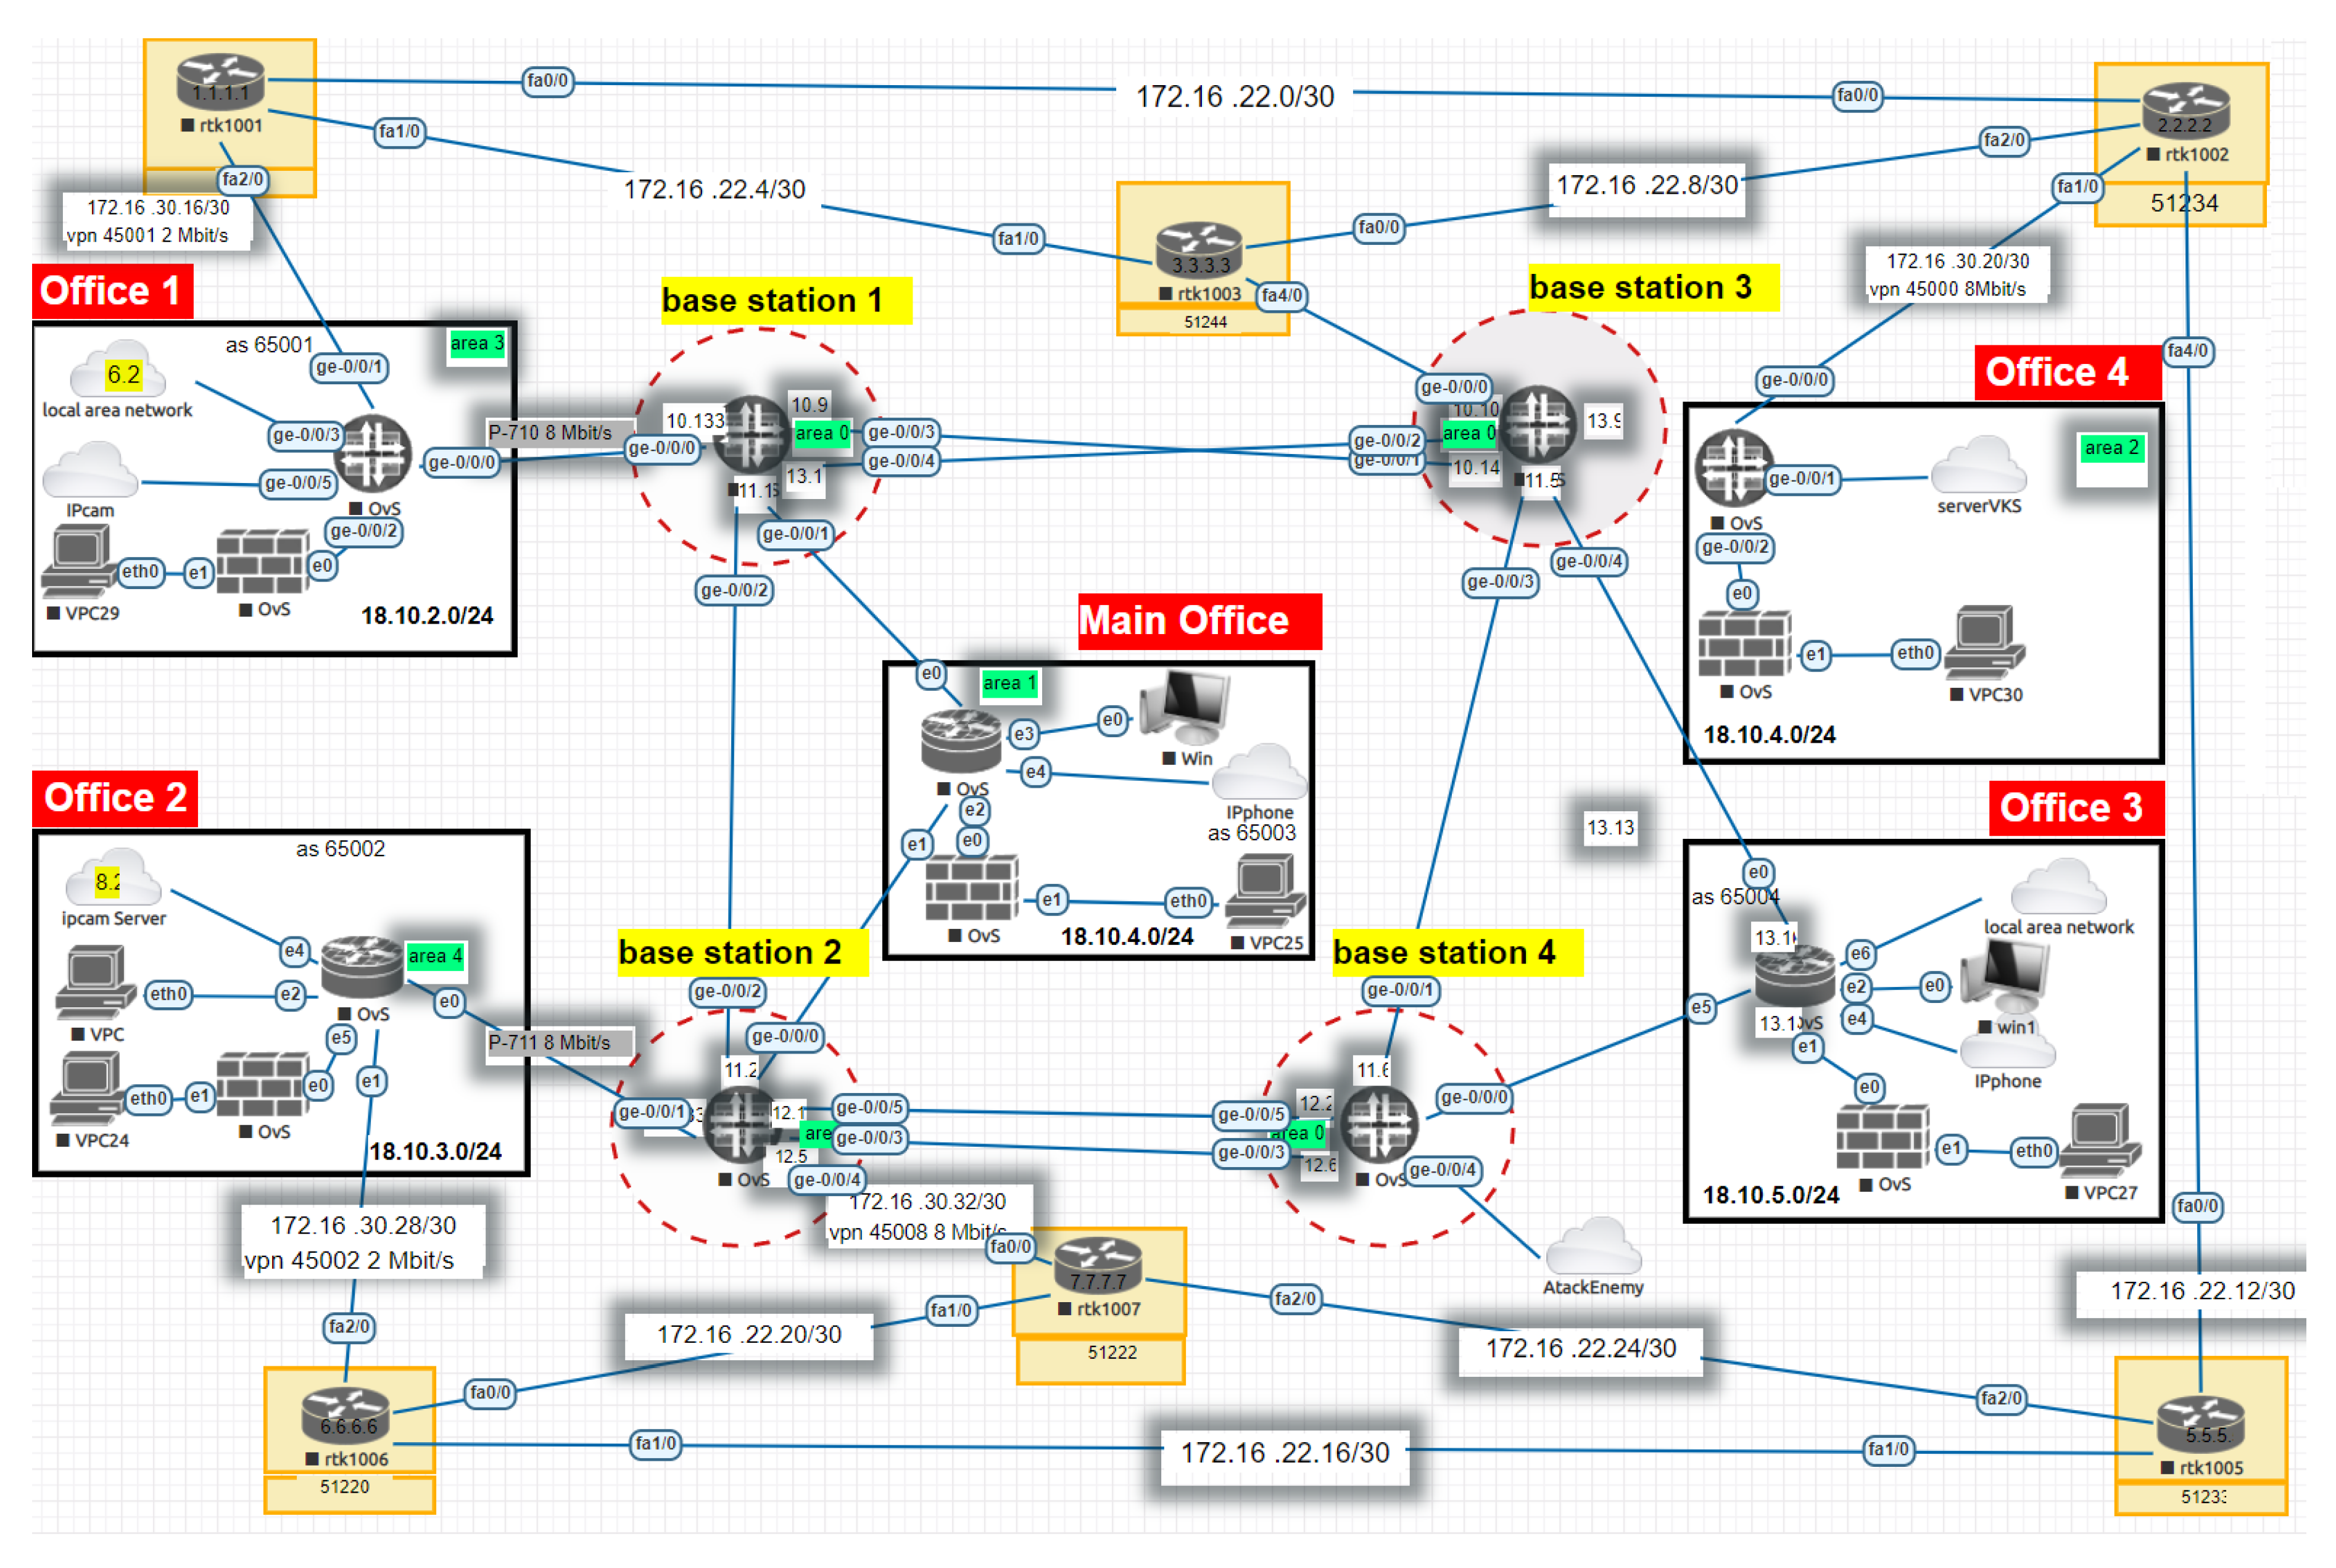
4.1. Description of the Simulation Stand
4.2. An Example of an Attack Simulation Model against SDN
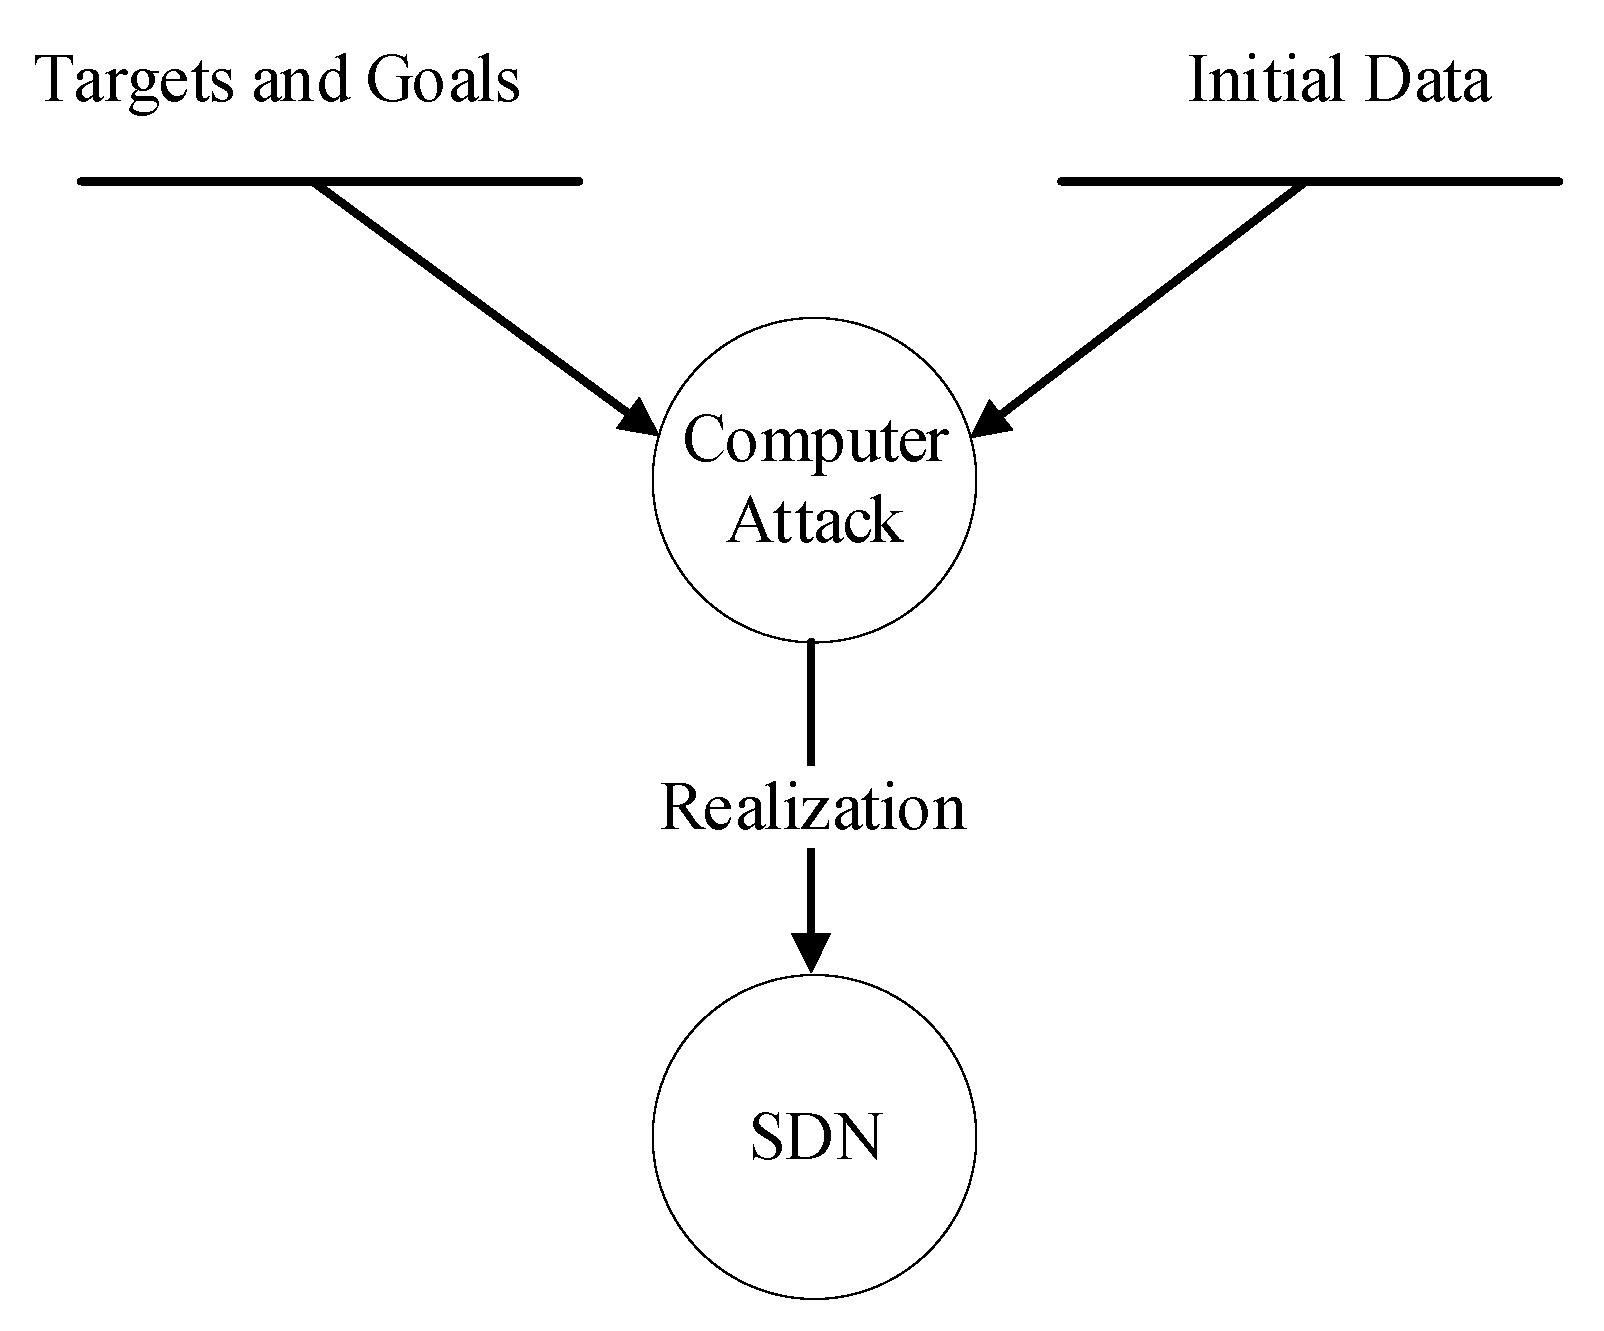
- The goals and objectives of the upcoming CA;
- Information about the data transmission network, on which CA implementation is based on.
4.3. Probabilistic and Temporal Characteristics of Attacks against SDN
4.4. Assessing the SDN Resilience under CAs Conditions
- Structure 1—SDN structure consisting of three elements with one controller (see Figure 2);
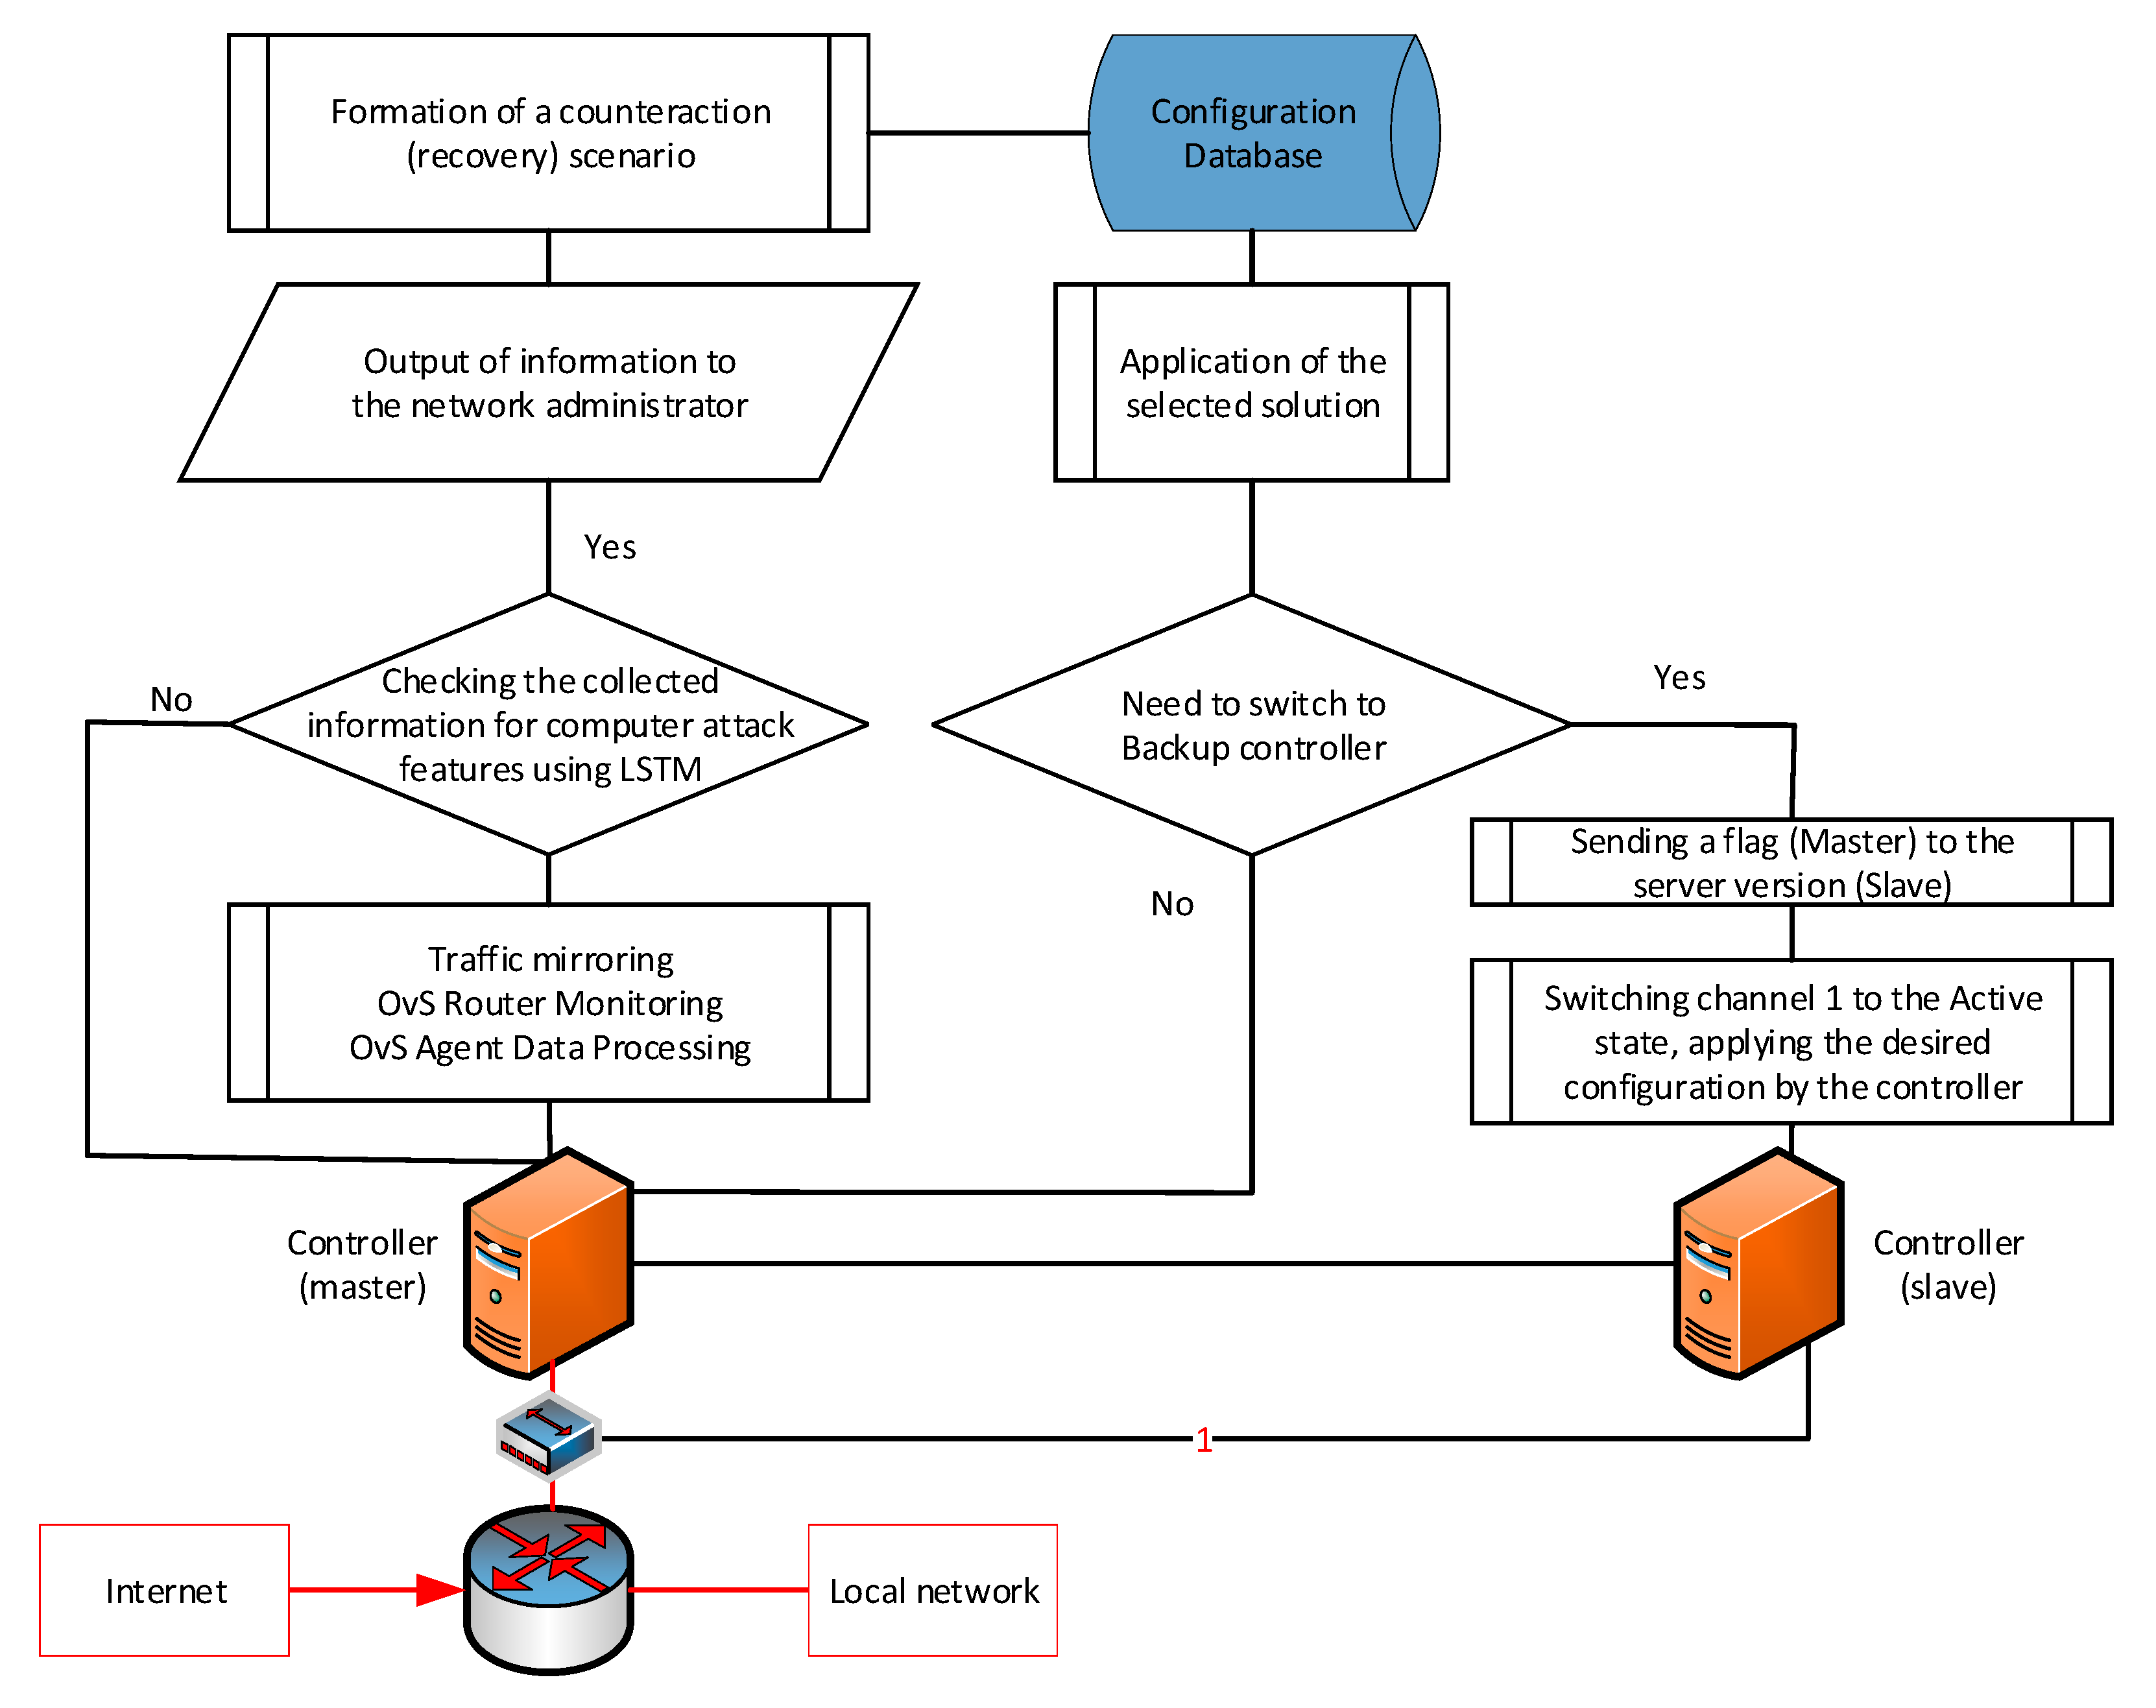
- Structure 2—SDN structure with two controllers with separation of the control function and interception of each other’s control functions according to a given algorithm (Figure 20);
- Structure 3—SDN structure with two controllers, where one controller is the main controller and performs control functions, and the second controller is in hot standby mode (Figure 21).
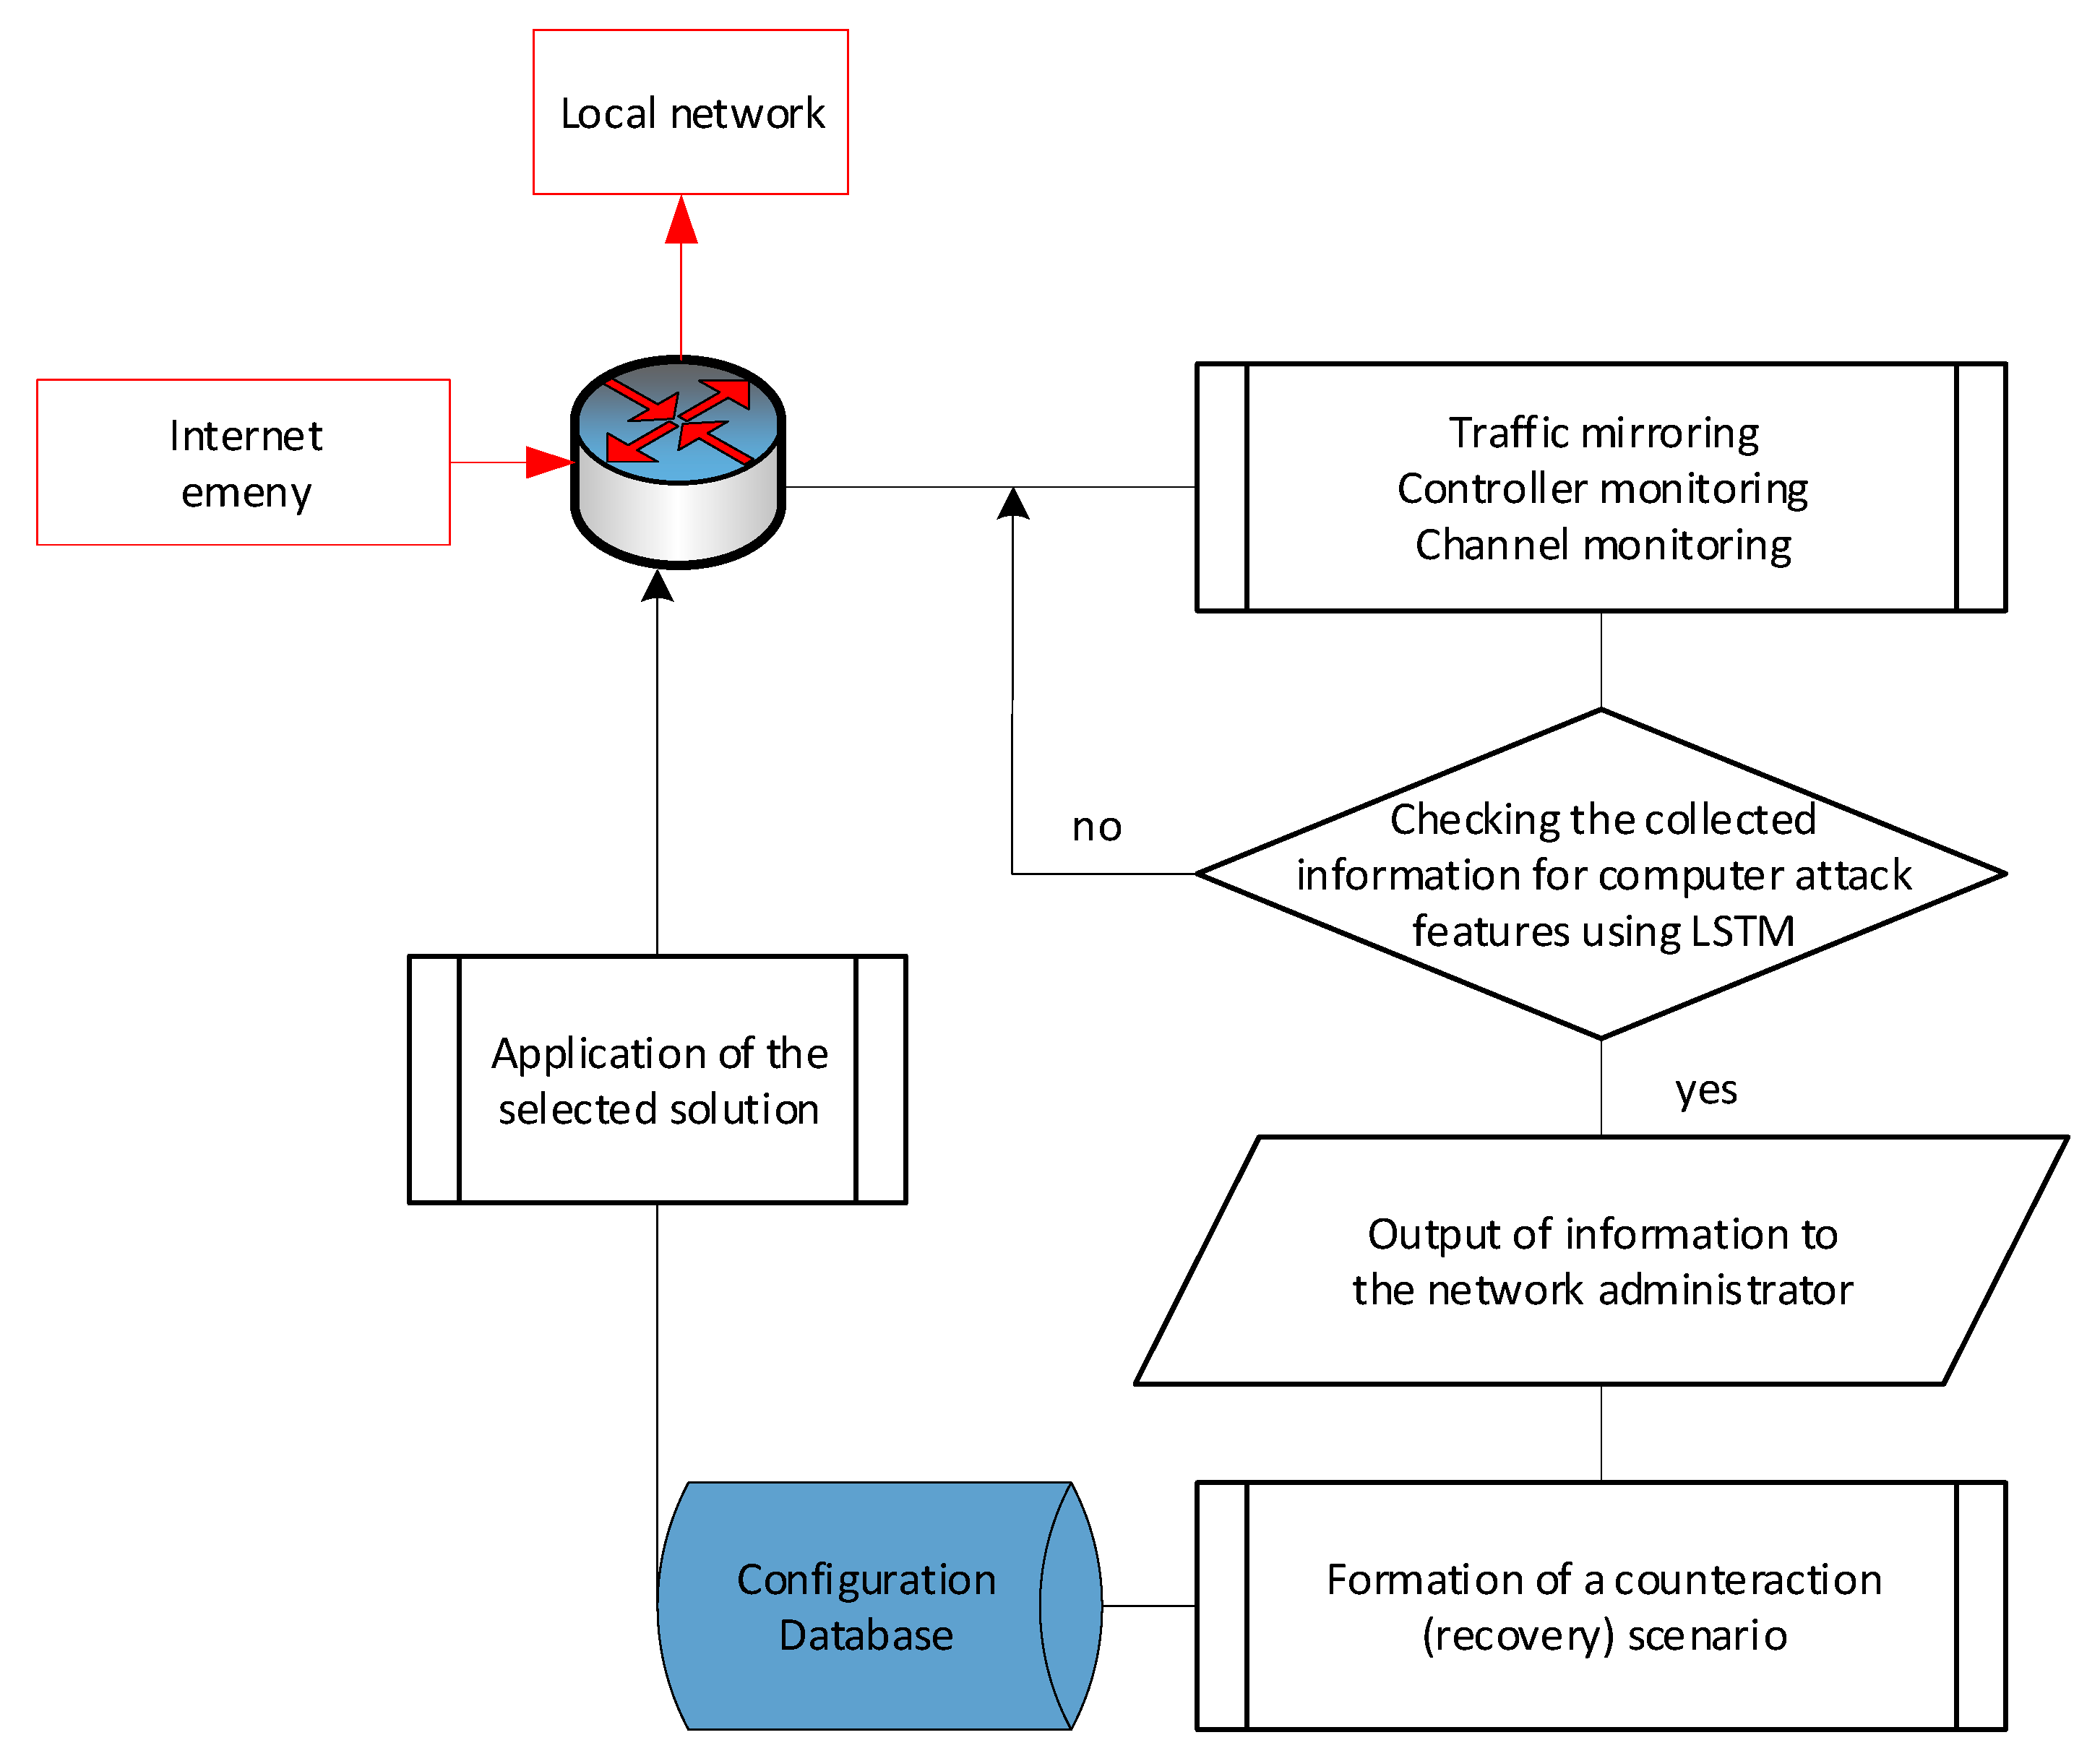
4.5. Creating the Fault-Tolerant SDN in CAs Environment
- The transmission level control loop;
- Infrastructure for monitoring and managing OpenFlow;
- Inter controller communication infrastructure.
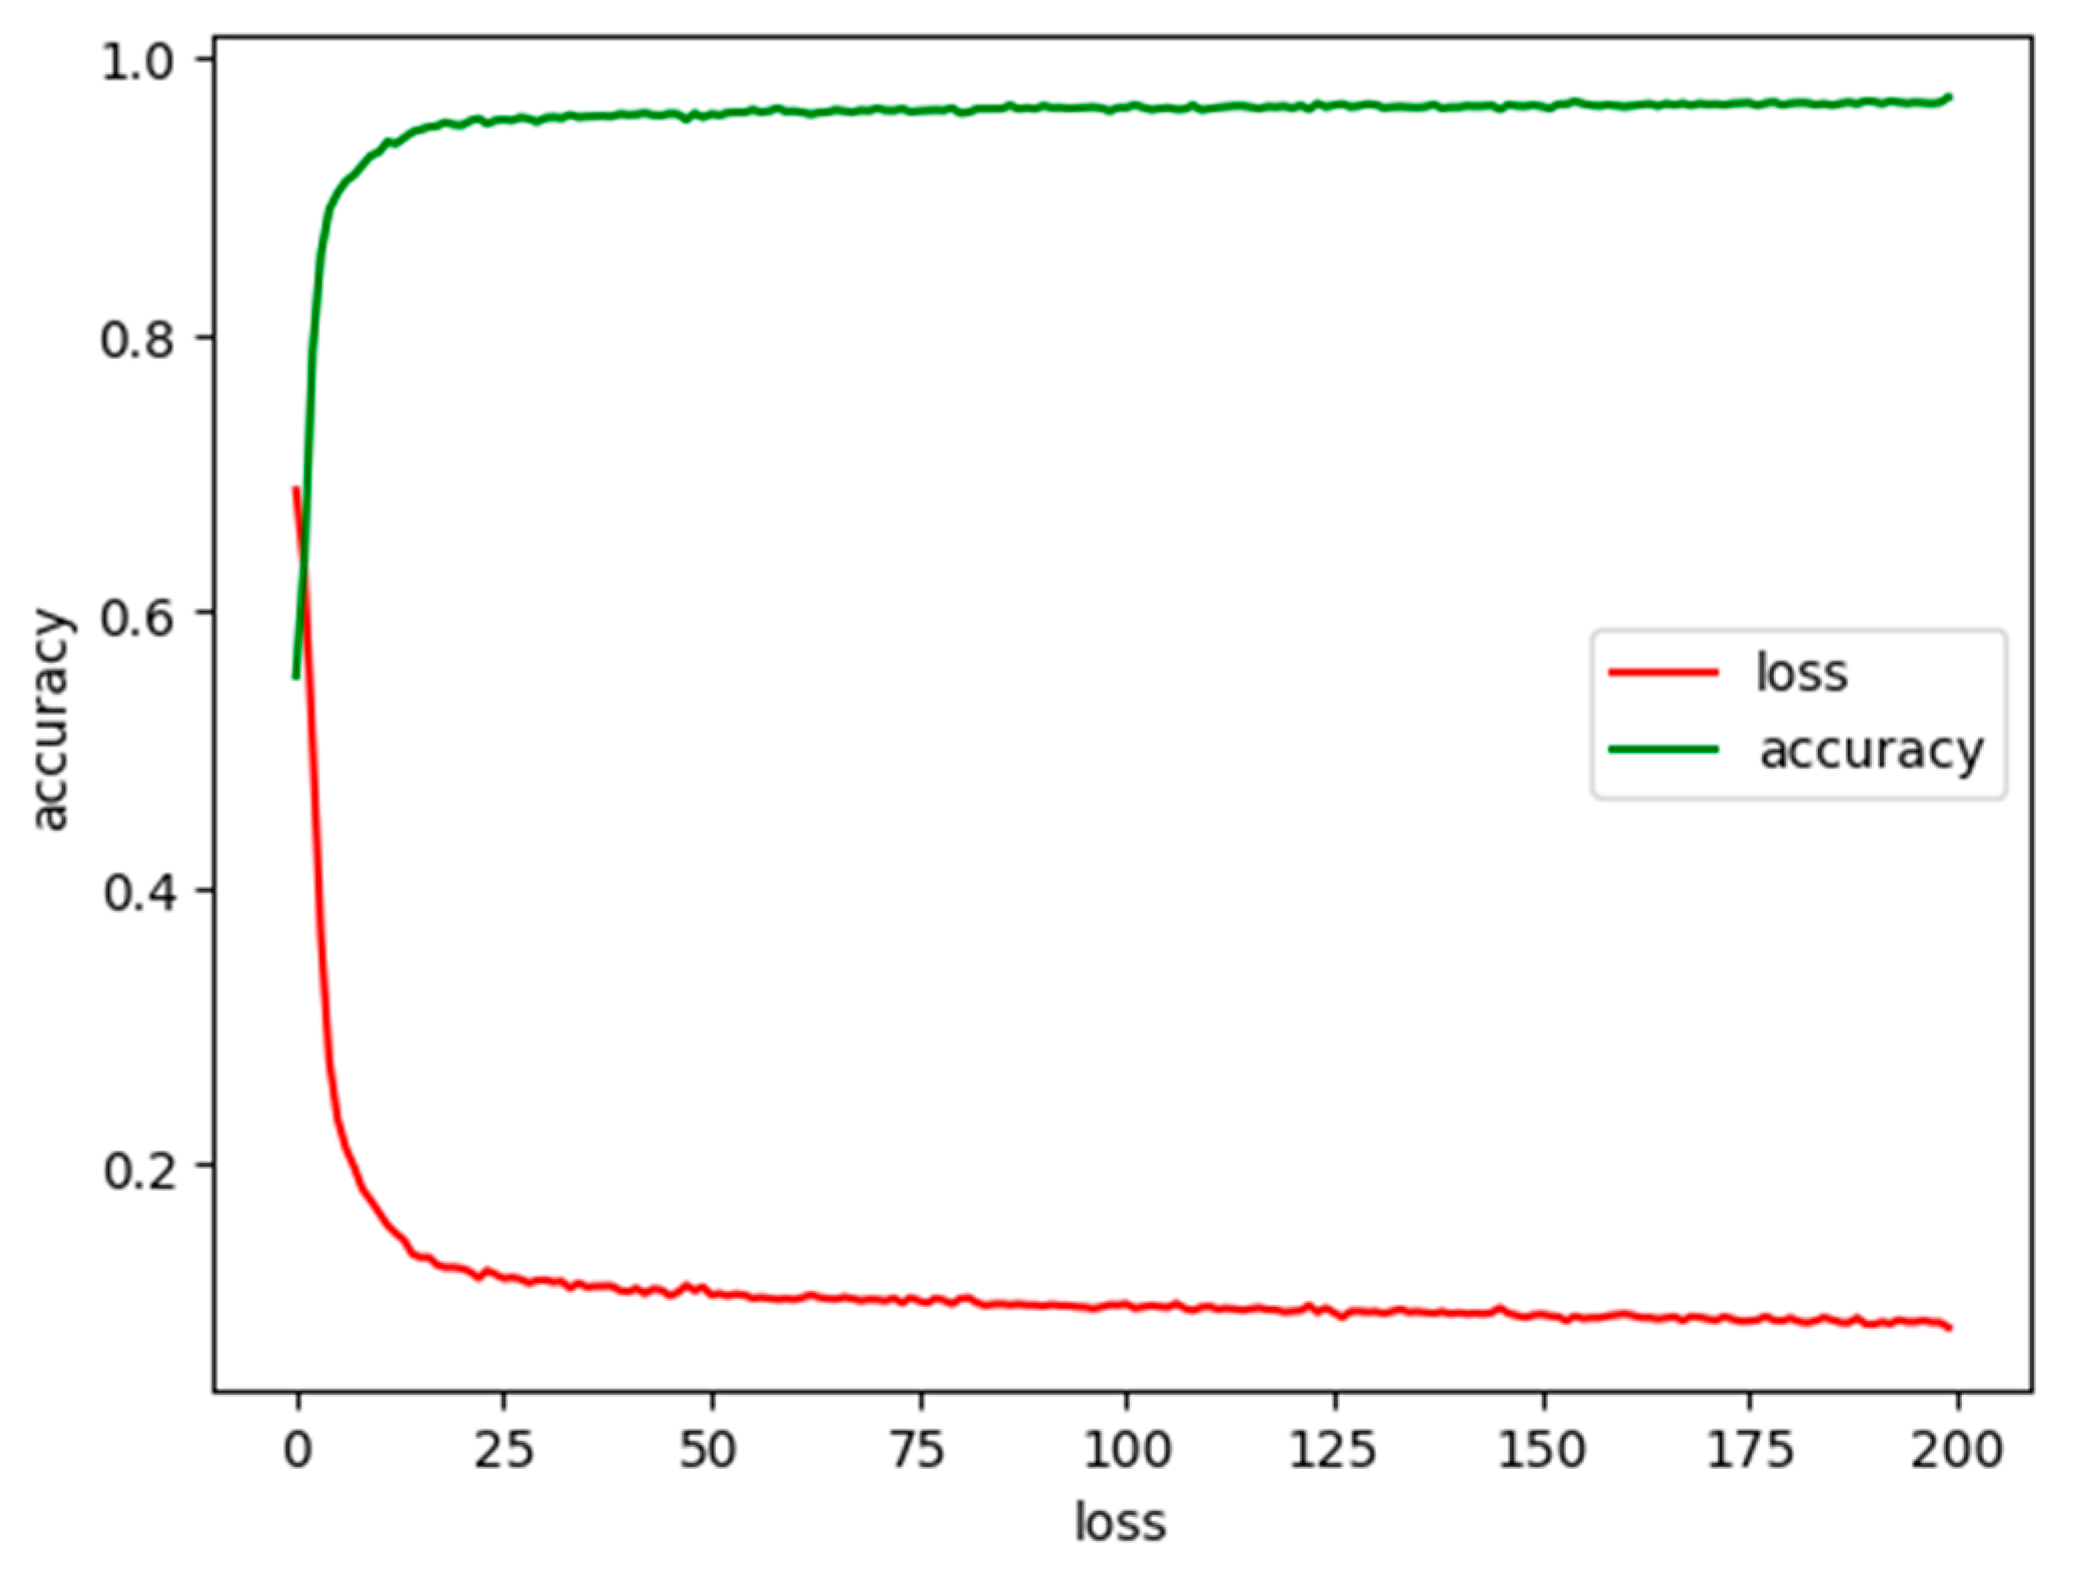
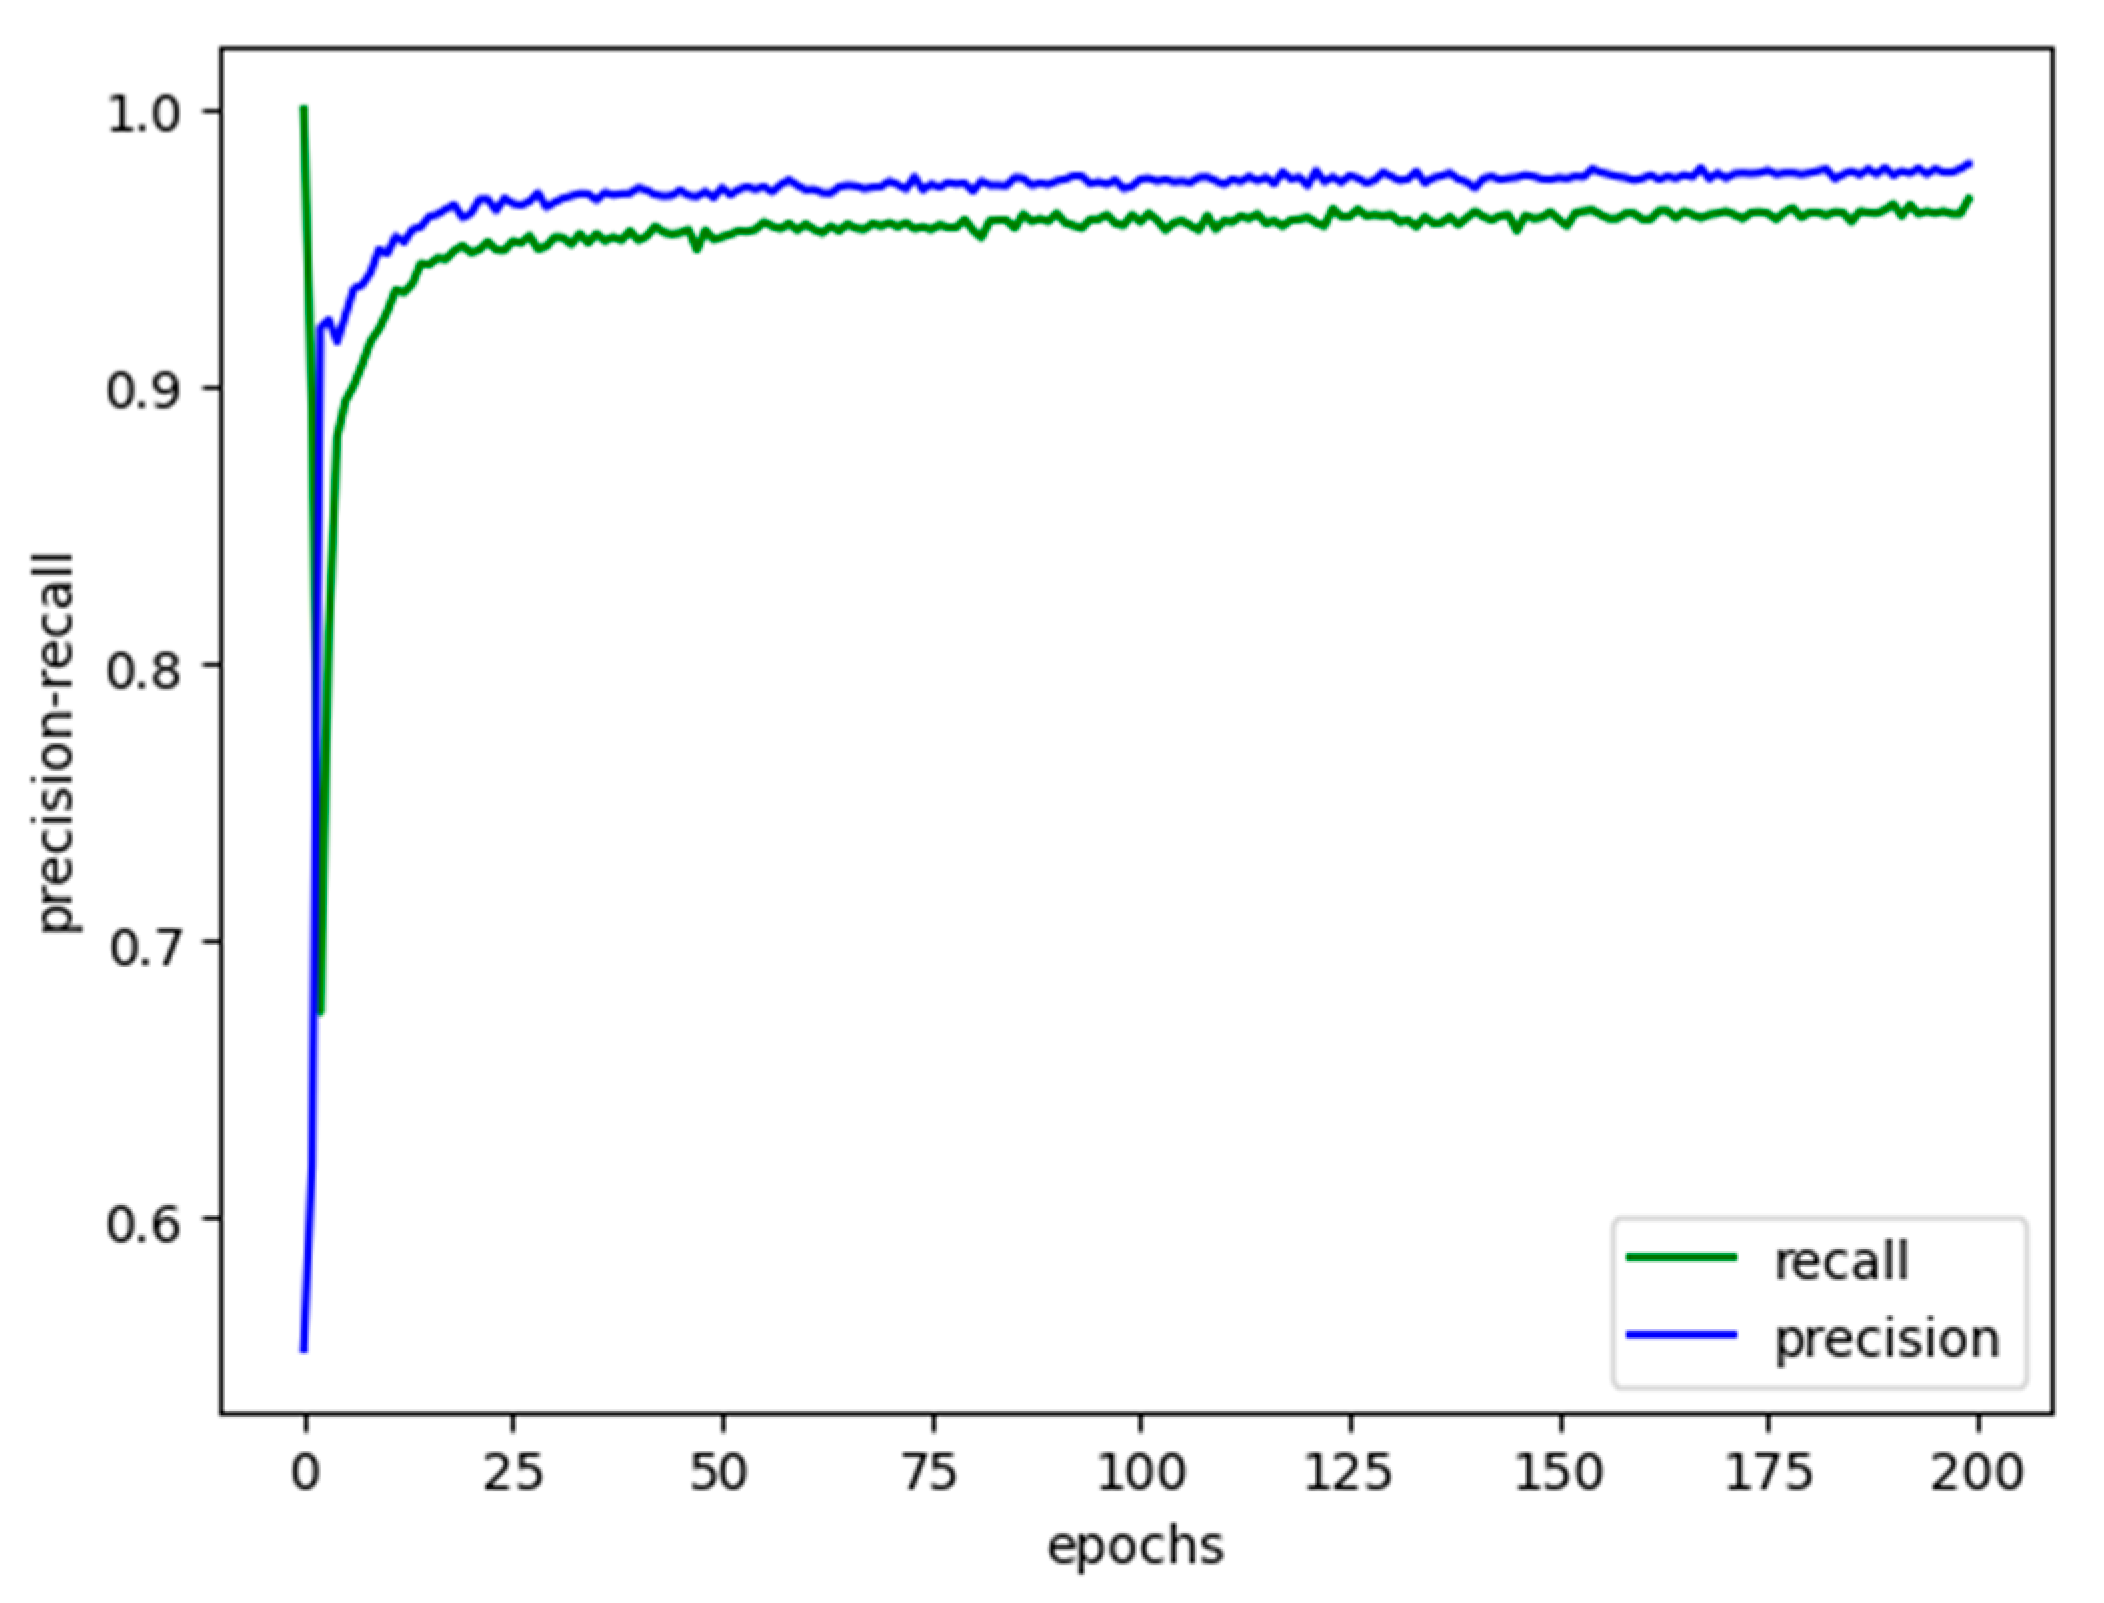
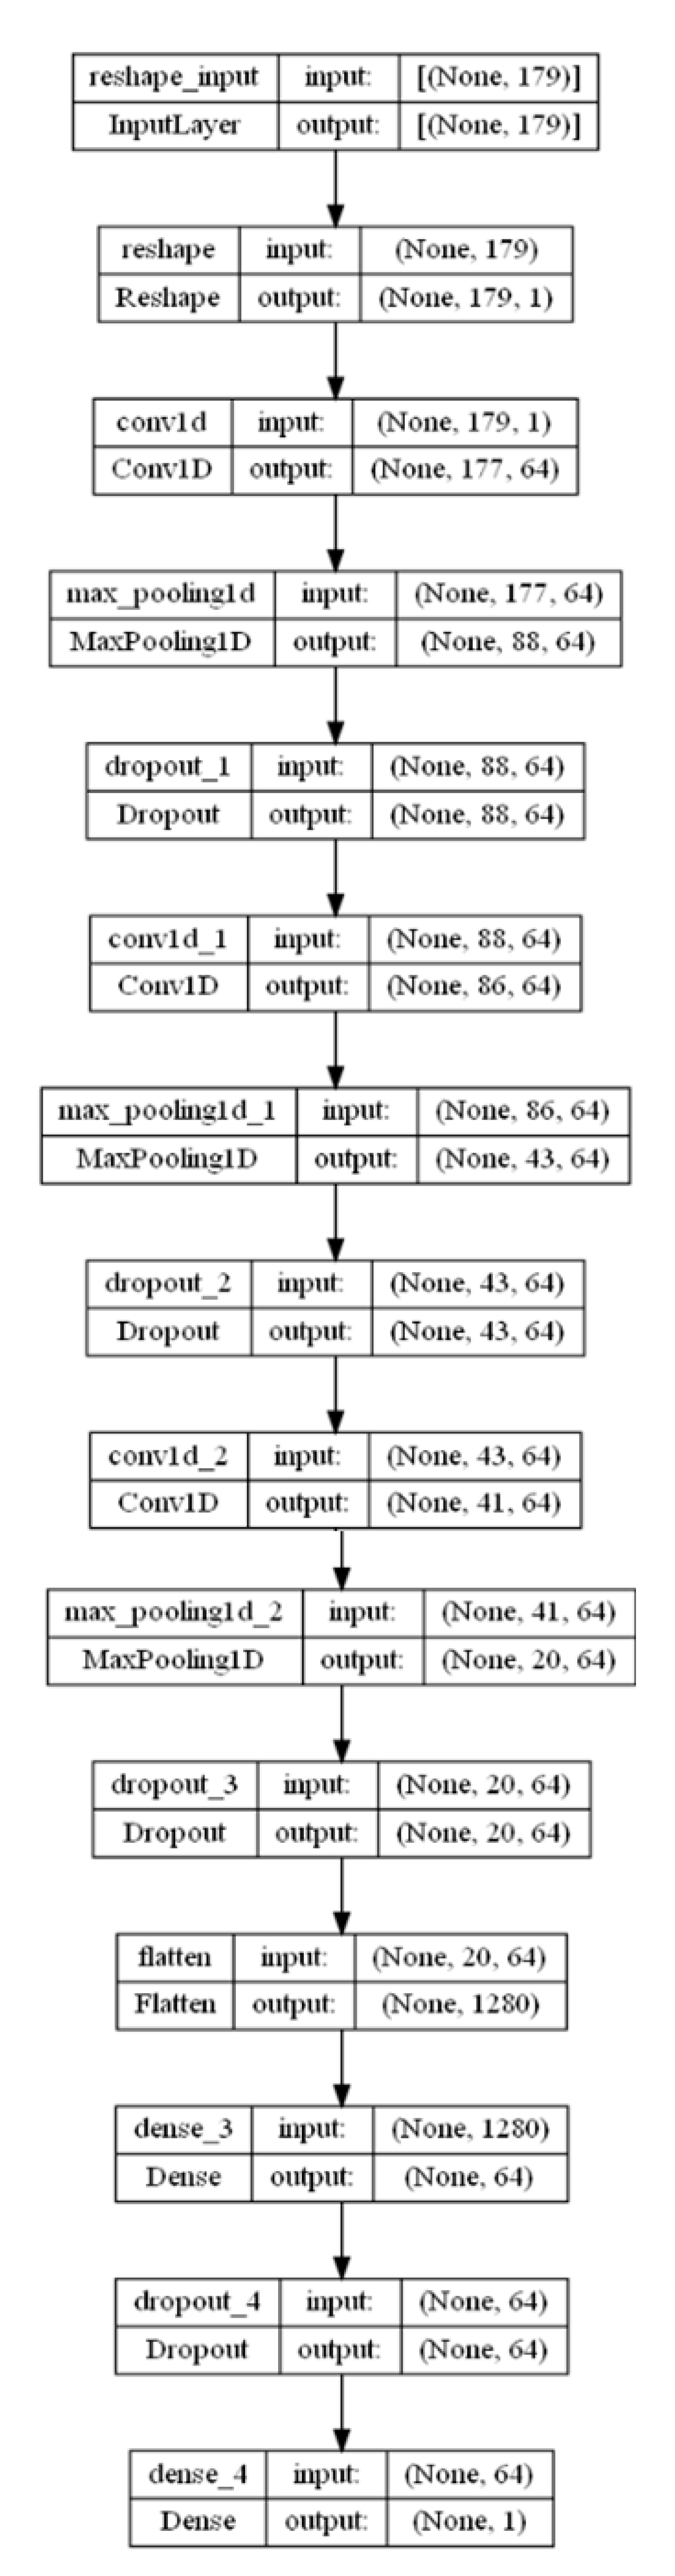
4.6. Implementation of a Neural Network for CA Detection
5. Discussion
- What are the advantages and disadvantages of the proposed method?
- How can one use this approach in practice in terms of intrusion detection?
5.1. Advantages and Disadvantages of the Approach
5.2. Using the Approach in Practice
5.3. Evaluation of the Effectiveness and Validity of the Proposed Approach
6. Conclusions
Author Contributions
Funding
Institutional Review Board Statement
Informed Consent Statement
Data Availability Statement
Conflicts of Interest
References
- Vicentini, C.; Santin, A.; Viegas, E.; Abreu, V. SDN-based and multitenant-aware resource provisioning mechanism for cloud-based big data streaming. J. Netw. Comput. Appl. 2018, 126, 133–149. [Google Scholar] [CrossRef]
- Chuluundorj, Z.; Taylor, C.; Walls, R.; Shue, C. Can the User Help? Leveraging User Actions for Network Profiling. In Proceedings of the 2021 Eighth International Conference on Software Defined Systems (SDS), Gandia, Spain, 6–9 December 2021; pp. 1–8. [Google Scholar] [CrossRef]
- Lei, Y.; Lanson, J.; Kaldawy, R.; Estrada, J.; Shue, C. Can Host-Based SDNs Rival the Traffic Engineering Abilities of Switch-Based SDNs? In Proceedings of the 2020 11th International Conference on Network of the Future (NoF), Bordeaux, France, 12–14 October 2020; pp. 91–99. [Google Scholar] [CrossRef]
- Devlic, A.; John, W.; Sköldström, P. A Use-Case Based Analysis of Network Management Functions in the ONF SDN Model. In Proceedings of the 2012 European Workshop on Software Defined Networking, Darmstadt, Germany, 25–26 October 2012; pp. 85–90. [Google Scholar] [CrossRef]
- Zhang, Z.; Ma, L.; Leung, K.K.; Le, F. More Is Not Always Better: An Analytical Study of Controller Synchronizations in Distributed SDN. IEEE/ACM Trans. Netw. 2021, 29, 1580–1590. [Google Scholar] [CrossRef]
- Cox, J.H.; Chung, J.; Donovan, S.; Ivey, J.; Clark, R.J.; Riley, G.; Owen, H.L. III. Advancing Software-Defined Networks: A Survey. IEEE Access 2017, 5, 25487–25526. [Google Scholar] [CrossRef]
- Kotenko, I.; Saenko, I.; Lauta, O.; Karpov, M. Methodology for Management of the Protection System of Smart Power Supply Networks in the Context of Cyberattacks. Energies 2021, 14, 5963. [Google Scholar] [CrossRef]
- Privalov, A.; Lukicheva, V.; Kotenko, I.; Saenko, I. Method of early detection of cyber-attacks on telecommunication networks based on traffic analysis by extreme filtering. Energies 2019, 12, 4768. [Google Scholar] [CrossRef]
- Privalov, A.; Lukicheva, V.; Kotenko, I.; Saenko, I. Increasing the sensitivity of the method of early detection of cyber-attacks in telecommunication networks based on traffic analysis by extreme filtering. Energies 2020, 13, 2774. [Google Scholar] [CrossRef]
- Kotenko, I.; Saenko, I.; Lauta, O. Analytical modeling and assessment of cyber resilience on the base of stochastic networks conversion. In Proceedings of the 2018 10th International Workshop on Resilient Networks Design and Modeling (RNDM), Longyearbyen, Norway, 27–29 August 2018; pp. 1–8. [Google Scholar] [CrossRef]
- Kotenko, I.; Saenko, I.; Lauta, O.; Kocinyak, M. Assessment of computer network resilience under impact of cyber attacks on the basis of stochastic networks conversion. In Mobile Internet Security. MobiSec 2016. Communications in Computer and Information Science; You, I., Leu, F.Y., Chen, H.C., Kotenko, I., Eds.; Springer: Singapore, 2018; Volume 797, pp. 107–117. [Google Scholar] [CrossRef]
- Kotenko, I.V.; Saenko, I.B.; Kotsynyak, M.A.; Lauta, O.S. Assessment of Cyber-Resilience of Computer Networks Based on Simulation of Cyber Attacks by the Stochastic Networks Conversion Method. SPIIRAS Proc. 2017, 6, 160–184. [Google Scholar] [CrossRef]
- Kotenko, I.; Saenko, I.; Lauta, O. Modeling the Impact of Cyber Attacks. In Cyber Resilience of Systems and Networks, Risk, Systems and Decisions; Kott, A., Linkov, I., Eds.; Springer: Cham, Switzerland, 2019; pp. 154–196. [Google Scholar] [CrossRef]
- Privalov, A.; Titov, D.; Kotenko, I.; Saenko, I.; Evglevskaya, N. Evaluating the functioning quality of data transmission networks in the context of cyberattacks. Energies 2021, 14, 4755. [Google Scholar] [CrossRef]
- Kotenko, I.; Lauta, O.; Kribel, K.; Saenko, I. LSTM Neural Networks for Detecting Anomalies Caused by Web Application Cyber Attacks. In Frontiers in Artificial Intelligence and Applications, Vol. 337, New Trends in Intelligent Software Methodologies, Tools and Techniques Proceedings of the 20th International Conference on New Trends in Intelligent Software Methodologies, Tools and Techniques (SoMeT_21), Cancun, Mexico, 21–23 September 2021; Fujita, H., Perez-Meana, H., Eds.; IOS Press: Cancun, Mexico, 2021; pp. 127–140. [Google Scholar] [CrossRef]
- Ahmadi, V.; Ahmadi, V.; Jalili, A.; Khor, S.M.; Keshtgari, M. A hybrid NSGA-II for solving multiobjective controller placement in SDN. In Proceedings of the 2015 2nd International Conference on Knowledge-Based Engineering and Innovation (KBEI), Tehran, Iran, 5–6 November 2015; pp. 663–669. [Google Scholar] [CrossRef]
- Shu, Z.; Wan, J.; Lin, J.; Wang, S.H.; Li, D.; Rho, S.; Yang, C.H. Traffic engineering in software-defined networking: Measurement and management. IEEE Access 2016, 4, 3246–3256. [Google Scholar] [CrossRef]
- Egilmez, H.E.; Dane, S.T.; Bagci, K.T.; Tekalp, A.M. OpenQoS: An OpenFlow controller design for multimedia delivery with end-to-end Quality of Service over Software-Defined Networks. In Proceedings of the 2012 Asia Pacific Signal and Information Processing Association Annual Summit and Conference, Hollywood, CA, USA, 3–6 December 2012; pp. 1–8. [Google Scholar]
- Cabarkapa, D.; Rancic, D. Software-Defined Networking: The Impact of Scalability on Controller Performance. In Proceedings of the 2022 IEEE Zooming Innovation in Consumer Technologies Conference (ZINC), Novi Sad, Serbia, 25–26 May 2022; pp. 17–21. [Google Scholar] [CrossRef]
- Bannour, F.; Souihi, S.; Mellouk, A. Scalability and Reliability Aware SDN Controller Placement Strategies. In Proceedings of the 2017 13th International Conference on Network and Service Management (CNSM), Tokyo, Japan, 26–30 November 2017; pp. 1–4. [Google Scholar] [CrossRef]
- Hu, Y.; Wang, W.; Gong, X.; Que, X.; Cheng, S. BalanceFlow: Controller load balancing for OpenFlow networks. In Proceedings of the 2012 IEEE 2nd International Conference on Cloud Computing and Intelligence Systems, Hangzhou, China, 30 October–1 November 2012; pp. 780–785. [Google Scholar] [CrossRef]
- Aglan, M.A.; Sobh, M.A.; Bahaa-Eldin, A.M. Reliability and Scalability in SDN Networks. In Proceedings of the 2018 13th International Conference on Computer Engineering and Systems (ICCES), Cairo, Egypt, 18–19 December 2018; pp. 549–554. [Google Scholar] [CrossRef]
- Shalimov, A.; Zuikov, D.; Zimarina, D.; Pashkov, V.; Smeliansky, R. Advanced study of SDN/OpenFlow controllers. In Proceedings of the 9th Central & Eastern European Software Engineering Conference in Russia (CEE-SECR ’13), Moscow, Russia, 24–25 October 2013; pp. 1–6. [Google Scholar] [CrossRef]
- Ros, F.J.; Ruiz, P.M. On reliable controller placements in Software-Defined Networks. Comput. Commun. 2016, 77, 41–51. [Google Scholar] [CrossRef]
- Yao, G.; Bi, J.; Li, Y.; Guo, L. On the Capacitated Controller Placement Problem in Software Defined Networks. IEEE Commun. Lett. 2014, 18, 1339–1342. [Google Scholar] [CrossRef]
- Park, S.M.; Ju, S.; Jaiyong, L. Efficient Routing for Traffic Offloading in Software-defined Network. Procedia Comput. Sci. 2014, 34, 674–679. [Google Scholar] [CrossRef]
- Singh, S.; Jha, R.K. A survey on Software Defined Networking: Architecture for next generation network. J. Netw. Syst. Manag. 2017, 25, 321–374. [Google Scholar] [CrossRef]
- Lange, S.; Gebert, S.; Spoerhase, J.; Rygielski, P.; Zinner, T.; Kounev, S.; Tran-Gia, P. Specialized Heuristics for the Controller Placement Problem in Large Scale SDN Networks. In Proceedings of the 2015 27th International Teletraffic Congress, Ghent, Belgium, 8–10 September 2015; pp. 210–218. [Google Scholar] [CrossRef]
- Song, S.; Lee, J.; Son, K.; Jung, H.; Lee, J. A congestion avoidance algorithm in SDN environment. In Proceedings of the 2016 International Conference on Information Networking (ICOIN), Kota Kinabalu, Malaysia, 13–15 January 2016; pp. 498–511. [Google Scholar] [CrossRef]
- Kamisiski, A.; Doma, J.; Wjcik, R.; Jajszczyk. Two Rerouting-Based Congestion Control Algorithms for Centrally Managed Flow-Oriented Networks. IEEE Commun. Lett. 2016, 20, 1963–1966. [Google Scholar] [CrossRef]
- Wu, Y.W.; Zhang, W. OpenFlow-Based Global Load Balancing in Fat-Tree Networks. Adv. Mater. Res. 2014, 989–994, 4794–4798. [Google Scholar] [CrossRef]
- Li, J.; Chang, X.; Ren, Y.; Zhang, Z.; Wang, G. An Effective Path Load Balancing Mechanism Based on SDN. In Proceedings of the 2014 IEEE 13th International Conference on Trust, Security and Privacy in Computing and Communications, Beijing, China, 24–26 September 2014; pp. 527–533. [Google Scholar] [CrossRef]
- Celenlioglu, M.R.; Alsadi, M.; Mantar, H.A. Design, implementation and evaluation of SDN-based resource management model. In Proceedings of the 2015 7th International Conference on New Technologies, Mobility and Security (NTMS), Paris, France, 27–29 July 2015; pp. 1–5. [Google Scholar] [CrossRef]
- Li, W.; Meng, M.; Kwok, L.M. A survey on OpenFlow-based Software Defined Networks: Security challenges and countermeasures. J. Netw. Comput. Appl. 2016, 68, 126–139. [Google Scholar] [CrossRef]
- Goranson, P.; Black, C.; Culver, T. Software Defined Networks: A Comprehensive Approach; Elsevier: Cambridge, UK, 2017. [Google Scholar]
- Prodanov, N.S.; Nikolova, K.S.; Atamian, D.K. Load Balancing Implementation in Software Defined Networks. In Proceedings of the 2022 57th International Scientific Conference on Information, Communication and Energy Systems and Technologies (ICEST), Ohrid, North Macedonia, 16–18 June 2022; pp. 1–4. [Google Scholar] [CrossRef]
- Netes, V. End-to-End Availability of Cloud Services. In Proceedings of the 2018 22nd Conference of Open Innovations Association (FRUCT), Jyvaskyla, Finland, 15–18 May 2018; pp. 198–203. [Google Scholar] [CrossRef]
- Haas, Z.J.; Culver, T.L.; Sarac, K. Vulnerability Challenges of Software Defined Networking. IEEE Commun. Mag. 2021, 59, 88–93. [Google Scholar] [CrossRef]
- Feng, M.; Mao, S.; Jiang, T. Enhancing the performance of future wireless networks with software-defined networking. Front. Inf. Technol. Electron. Eng. 2016, 17, 606–619. [Google Scholar] [CrossRef]
- Long, H.; Shen, Y.; Guo, M.; Tang, F. LABERIO: Dynamic load-balanced Routing in OpenFlow-enabled Net-works. In Proceedings of the 2013 IEEE 27th International Conference on Advanced Information Networking and Applications (AINA), Barcelona, Spain, 25–28 March 2013; pp. 290–297. [Google Scholar] [CrossRef]
- He, J.; Zong, C.-H.; Zhu, H.-Y.; Xu, F.-Y. Research on stability of cooperation in SDN. In Proceedings of the 2005 International Conference on Machine Learning and Cybernetics, Guangzhou, China, 18–21 August 2005; Volume 5, pp. 2971–2976. [Google Scholar] [CrossRef]
- Wang, R.; Butnariu, D.; Rexford, J. OpenFlow-based server load balancing gone wild. In Proceedings of the 11th USENIX Conference on Hot Topics in Management of Internet, Cloud, and Enterprise Networks and Services, Boston, MA, USA, 29 March 2011; Available online: http://www.usenix.org/events/hotice11/tech/full_papers/Wang_Richard.pdf (accessed on 15 January 2023).
- Govindarajan, K.; Meng, K.C.; Ong, H.; Tat, W.M.; Sivanand, S.; Leong, L.S. Realizing the Quality of Service (QoS) in Software-Defined Networking (SDN) based Cloud infrastructure. In Proceedings of the 2020 2nd International Conference on Information and Communication Technology (ICoICT), Bandung, Indonesia, 28–30 May 2014; pp. 505–510. [Google Scholar] [CrossRef]
- Shukla, P.K.; Maheshwary, P.; Subramanian, E.K.; Shilpa, V.J.; Varma, P.R.K. Traffic flow monitoring in software-defined network using modified recursive learning. Phys. Commun. 2023, 57, 101997. [Google Scholar] [CrossRef]
- Linkov, I.; Eisenberg, D.A.; Bates, M.E.; Chang, D.; Convertino, M.; Allen, J.H.; Flynn, S.E.; Seager, T.P. Measurable resilience for actionable policy. Environ. Sci. Technol. 2013, 47, 10108–10110. [Google Scholar] [CrossRef]
- Linkov, I.; Eisenberg, D.A.; Plourde, K.; Seager, T.P.; Allen, J.; Kott, A. Resilience metrics for cyber systems. Environ. Syst. Decis. 2013, 33, 471–476. [Google Scholar] [CrossRef]
- Ganin, A.; Massaro, E.; Gutfraind, A.; Steen, N.; Keisler, J.M.; Kott, A.; Mangoubi, R.; Linkov, I. Operational resilience: Concepts, design and analysis. Sci. Rep. 2016, 6, 19540. [Google Scholar] [CrossRef] [PubMed]
- Bocchini, P.; Frangopol, D.M.; Ummenhofer, T.; Zinke, T. Resilience and Sustainability of Civil Infrastructure: Toward a Unified Approach. J. Infrastruct. Syst. 2014, 20, 04014004. [Google Scholar] [CrossRef]
- OPNET Technologies. Available online: http://www.opnet.com.tw (accessed on 15 January 2023).
- Ahuja, S.P. COMNET III: A network simulation laboratory environment for a course in communications networks. In Proceedings of the 28th Annual Frontiers in Education Conference (FIE ’98), Tempe, AZ, USA, 4–7 November 1998; Volume 3, pp. 1085–1088. [Google Scholar] [CrossRef]
- Kotenko, I.; Chechulin, A. A Cyber Attack Modeling and Impact Assessment Framework. In Proceedings of the 5th IEEE International Conference on Cyber Conflict (CyCon), Tallinn, Estonia, 4–7 June 2013; pp. 1–24. Available online: https://ieeexplore.ieee.org/document/6568374 (accessed on 15 January 2023).
- Pritsker, A.A.B. GERT: Graphical Evaluation and Review Technique. 1966. Available online: https://www.rand.org/content/dam/rand/pubs/research_memoranda/2006/RM4973.pdf (accessed on 15 January 2023).
- Yi-song, Z.; Dong, L.; Feng, Z. Study on a GERT based method for hi-tech product development project planning. In Proceedings of the 2009 16th International Conference on Industrial Engineering and Engineering Management, Beijing, China, 21–23 October 2009; pp. 1022–1026. [Google Scholar] [CrossRef]
- Clayton, E.R.; Cooley, J.W. Use of Q-GERT Network Simulation in Reliability Analysis. IEEE Trans. Reliab. 1981, R-30, 321–324. [Google Scholar] [CrossRef]
- Shibanov, A.; Saprykin, A. Calculation of the output value distribution of the GERT network with exponentially and evenly distributed random values. In Proceedings of the 2018 ELEKTRO, Mikulov, Czech Republic, 21–23 May 2018; pp. 1–6. [Google Scholar] [CrossRef]
- Gavareshki, M.H.K. New fuzzy GERT method for research projects scheduling. In Proceedings of the 2004 IEEE International Engineering Management Conference (IEEE Cat. No.04CH37574), Singapore, 18–21 October 2004; Volume 2, pp. 820–824. [Google Scholar] [CrossRef]
- Kannan, R. Graphical Evaluation and Review Technique (GERT): The Panorama in the Computation and Visualization of Network-Based Project Management. In Advances in Secure Computing, Internet Services, and Applications; Tripathy, B., Acharjya, D., Eds.; IGI Global: Hershey, PA, USA, 2014; pp. 165–179. [Google Scholar] [CrossRef]
- Li, C.; Tang, Y.; Li, C. A GERT-based analytical method for remanufacturing process routing. In Proceedings of the 2011 IEEE International Conference on Automation Science and Engineering, Trieste, Italy, 24–27 August 2011; pp. 462–467. [Google Scholar] [CrossRef]
- Freitas, A.T.; Oliveira, A.L. Implicit resolution of the Chapman-Kolmogorov equations for sequential circuits: An application in power estimation. In Proceedings of the 2003 Design, Automation and Test in Europe Conference and Exhibition, Munich, Germany, 7 March 2003; pp. 764–769. [Google Scholar] [CrossRef]
- Agarwal, M.; Sen, K.; Mohan, P. GERT Analysis of m-Consecutive-k-Out-of-n Systems. IEEE Trans. Reliab. 2007, 56, 26–34. [Google Scholar] [CrossRef]
- Masuda, H.; Kanda, Y.; Okamoto, Y.; Hirono, K.; Hoshino, R.; Wakao, S.; Tsuburaya, T. Topology optimization of IH-equipment using Heaviside function in 2-D axisymmetric electromagnetic field. In Proceedings of the 2017 18th International Symposium on Electromagnetic Fields in Mechatronics, Electrical and Electronic Engineering (ISEF) Book of Abstracts, Lodz, Poland, 14–16 September 2017; pp. 1–2. [Google Scholar] [CrossRef]
- Nahin, P.J. Behind the Laplace transform. IEEE Spectrum 1991, 28, 60. [Google Scholar] [CrossRef]
- Yan, L.; McKeown, N. Learning Networking by Reproducing Research Results. ACM SIGCOMM Comput. Commun. Rev. 2017, 47, 19–26. [Google Scholar] [CrossRef]
- NfSen—Netflow Sensor. Available online: https://nfsen.sourceforge.net (accessed on 15 January 2023).
- Wireshark. Available online: https://www.wireshark.org (accessed on 15 January 2023).
- Zabbix 6.2. Improve Your Monitoring Performance. Available online: https://www.zabbix.com (accessed on 15 January 2023).
- Proteus Enterprise. Business Intelligence from Your Communications Data. Available online: https://info.enghouseinteractive.com/rs/547-FBA-390/images/proteus-enterprise-enghouse.pdf (accessed on 15 January 2023).
- Kotenko, I.; Chechulin, A. Computer attack modeling and security evaluation based on attack graphs. In Proceedings of the 2013 IEEE 7th International Conference on Intelligent Data Acquisition and Advanced Computing Systems (IDAACS), Berlin, Germany, 12–14 September 2013; pp. 614–619. [Google Scholar] [CrossRef]
- Kotenko, I.; Doynikova, E. Dynamical Calculation of Security Metrics for Countermeasure Selection in Computer Networks. In Proceedings of the 24th Euromicro International Conference on Parallel, Distributed, and Network-Based Processing (PDP), Heraklion, Greece, 17–19 February 2016; pp. 558–565. [Google Scholar] [CrossRef]
- Mission Control for Creatives. Available online: https://www.hyperflow.io (accessed on 15 January 2023).
- Koponen, T.; Casado, M.; Gude, N.; Stribling, J.; Poutievski, L.; Zhu, M.; Ramanathan, R.; Iwata, Y.; Inoue, H.; Hama, T.; et al. Onix: A Distributed Control Platform for Large-scale Production Networks. 2010, 10, p. 6. Available online: https://www.usenix.org/legacy/event/osdi10/tech/full_papers/Koponen.pdf (accessed on 15 January 2023).
- Yeganeh, S.H.; Ganjali, Y. Kandoo: A framework for efficient and scalable offloading of control applications. In Proceedings of the First Workshop on Hot Topics in Software Defined Networks (HotSDN ’12), Helsinki, Finland, 13 August 2012; pp. 19–24. [Google Scholar] [CrossRef]
- OpenFlow Protocol. Available online: https://www.sciencedirect.com/topics/computer-science/openflow-protocol (accessed on 15 January 2023).
- ElasticON: Illuminate the Possibilities. Available online: https://www.elasticon.com/event/e473ab1b-88b4-4326-aa8d-e6054a566e48/summary (accessed on 15 January 2023).
- Open Network Operating System (ONOS). Available online: https://opennetworking.org/onos (accessed on 15 January 2023).
- Pashkov, V.; Shalimov, A.; Smeliansky, R. Controller failover for SDN enterprise networks. In Proceedings of the 2014 International Science and Technology Conference (Modern Networking Technologies) (MoNeTeC), Moscow, Russia, 28–29 October 2014; pp. 1–6. [Google Scholar] [CrossRef]


| Processing Level | Where Does It Start | Performance Indicators | Types of Processes and Tasks |
|---|---|---|---|
| Control Plane | CPU of the controller | Thousands of packets per second | Routing protocols (e.g., OSPF, IS-IS and BGP), Spanning Tree, SYSLOG, AAA (Authentication Authorization Accounting), NDE (NetFlow Data Ex-port), CLI (command Line interface) and SNMP |
| Data Plane | Dedicated hardware ASIC | Millions or billions of packets per second | L2 and L3 switching (IPv4/IPv6), MPLS forwarding, VRF Forwarding, QoS (Quality of Service) marking, Policing, Netflow collection and ACL (Access Control Lists) |
| State Symbol | Description of the Conditional Discrete State |
|---|---|
| S1 | Stable resilient operation without failures |
| S2 | Functioning under the conditions of technical computer intelligence (implementation by the malefactor of collecting information on the CA object) |
| S3 | Functioning under the conditions of CAs against SDN |
| S4 | Functioning in case of a successful attack (successful connection to the attacked network and gaining access to the attacked controller) |
| S5 | Anomaly detection in the network, CA detection and elimination of the consequences of a successful attack |
| Designation | Description |
|---|---|
| λ12 | The presence of conditions for connecting an external intruder (for example, using a public network) |
| λ23 | Obtaining sufficient necessary information to carry out a CA |
| λ32 | Failed CA without detection of the attacker’s actions by the network security administrator |
| λ34 | Successful completion of the attack |
| λ43 | Denial of access obtained in a successful CA and caused by preventive actions without detection |
| λ31 | Unsuccessful CA with detection of the intruder’s actions by the network security administrator |
| λ45 | Detection of anomalies in the behavior of network devices, in network traffic and on the base of other parameters that indicate a CA |
| λ51 | Rebooting network devices using new unknown malefactor’s parameters |
| Stages of Impact Implementation | Basic Execution Methods |
|---|---|
| Collection of information | The first stage of the attack implementation is the collection of information about the attacked system or node. It includes such actions as determining the network topology, the type and version of the operating system of the attacked node, as well as available network and other services, and so on. These actions are implemented in various ways. |
| Exploring the environment | At this stage, the attacker explores the network environment around the intended target of the attack. Such areas, for example, include the hosts of the “victim’s” Internet provider or the hosts of the remote office of the attacked company. At this stage, the attacker may be trying to determine the addresses of “trusted” systems (for example, the partner’s network) and nodes that are directly connected to the target of attack (for example, the ISP router), etc. Such actions are quite difficult to detect, since they are performed over a sufficiently long period of time and outside the area controlled by security measures (firewalls, intrusion detection systems, etc.) |
| Network topology identification | There are two main methods for determining the network topology used by attackers: (1) TTL modulation; (2) recording the route. |
| Node identification | Host identification is usually achieved by sending the ICMP ECHO_REQUEST command using the ping utility. The ECHO_REPLY response message indicates that the node is available. There are free programs that automate and speed up the process of identifying a large number of nodes in parallel, such as fping or nmap. The danger of this method is that ECHO_REQUEST requests are not fixed by the standard means of the node. To do this, one need to use traffic analysis tools, firewalls or Intrusion Detection Systems (IDS). |
| Service identification or port scanning | Identification of services, as a rule, is carried out by detecting open ports (port scanning). These ports are very often associated with services based on the TCP or UDP protocols. For example, open port 80 implies a web server; 25th port—SMTP mail server; 31,337th—server part of the Trojan horse Back Orifice; 12,345th or 12,346th—the server part of the NetBus Trojan horse. |
| Operating system identification | The main mechanism for remote OS determination is the analysis of responses to requests, taking into account different implementations of the TCP/IP stack in various operating systems. Each OS implements the TCP/IP protocol stack in its own way, which makes it possible to determine which OS is installed on a remote host using special requests and responses.Another, less effective and extremely limited, way to identify OS nodes is to analyze the network services found in the previous step. For example, open port 139 allows one to conclude that the remote host is most likely running an OS of the Windows family. Various programs can be used to determine the OS. For example, nmap or queso. |
| Determining the role of a host | The penultimate step at the stage of collecting information about the attacked host is to determine its role, for example, performing the functions of a firewall or a Web server. This step is performed on the basis of already collected information about active services, host names, network topology and so on. For example, an open port 80 may indicate the presence of a Web server, blocking an ICMP packet indicates a potential presence of a firewall, and the DNS host name proxy.domain.ru or fw.domain.ru is self-explanatory. |
| Identify host vulnerabilities | The last step is to look for vulnerabilities. At this step, the attacker either manually determines the vulnerabilities that can be used to implement an attack or uses various automated tools. Shadow Security Scanner, nmap, Retina and others can be used as automated tools. |
| Implementation of the attack | From this moment, an attempt to access the attacked node begins. In this case, access can be either direct, i.e., penetration into the host, or indirectly, for example, when implementing a denial-of-service (DoS) attack. The implementation of attacks in the case of direct access can also be divided into two stages: penetration and establishing control. |
| Targets of attacks | It should be noted that the attacker at the second stage can pursue two goals. First, obtaining unauthorized access to the site itself and the information contained on it. Secondly, gaining unauthorized access to a node in order to carry out further attacks on other nodes. The first goal, as a rule, can be achieved only after the achievement of the second one. That is, first the attacker creates a base for themself for further attacks, and only after that can they penetrates to other nodes. This is necessary in order to hide or significantly complicate finding the source of the attack. |
| Completion of the attack | The stage of completion of the attack is “covering up the tracks” on the part of the attacker. This is usually achieved by deleting relevant entries from the node’s logs and other actions that return the attacked system to its original, “pre-attacked” state. |
| SDN Plane | Threat/Attack | Description |
|---|---|---|
| 1. Data | 1.1. Flooding attacks | Switch flow tables contain only a limited number of flow rules |
| 1.2. “Man-in-the-middle” attacks | Active listening, in which the attacker establishes independent ties, because TLS is an add-on option, and it is not a standard | |
| 1.3. Hacking/crashing of the controller | Since hacking the controller increases the risk to the data plane | |
| 2. Management | 2.1. Service chain intervention | This attack can lead to two consequences: (1) A malicious application can participate in the chain and delete the control message before other applications receive the necessary information; (2) A malicious application can become trapped in an endless loop to stop the chain execution of applications. |
| 2.2. Internal Storage Abuse | Using the internal memory of the controller | |
| 2.3. Control Message Manipulation | Manipulation of control messages | |
| 2.4. Northbound API Abuse | An SDN application can manipulate the behavior of other applications using a poorly designed Northbound API | |
| 2.5. System Variable Manipulation | Manipulation of system variables | |
| 2.6. Network Topology Poisoning | Changing the network topology | |
| 2.7. DoS attacks | No significant authentication | |
| 2.8. Unauthorized access to the controller | There are no valid user access rights | |
| 2.9. Scalability and availability | Increasing the size and shear of the network creates problems | |
| 3. Applications | 3.1. Lack of authentication/authorization | Applications do not use any means of authentication |
| 3.2. Inserting fraudulent flow rules | Connected malicious applications can insert false rules into flow tables | |
| 3.3. Lack of access control | Difficult to implement access control |
| Region | Objects | Problems | Existing Solutions | Disadvantages |
|---|---|---|---|---|
| External level | Services. Switches. | Thread table memory limit. Vulnerability to synchronous attacks. | Intermediate safety devices | Fails to integrate into a virtualized environment |
| Software-defined security | Cost | |||
| Machine learning classification methods | Poor performance against massive attacks | |||
| Inner level | Controller. NBI/SBI. SDN applications. | One point of failure (controller compromise). Network manipulation (controller interception). Lack of authorization and authentication. Lack of encryption. Performance degradation. Susceptible to spoofing attacks. | Encrypted channel | Does not support all SDN controllers and switches. Does not encrypt all transmission data. |
| Access Control List (ACL) | Hard to manage and use |
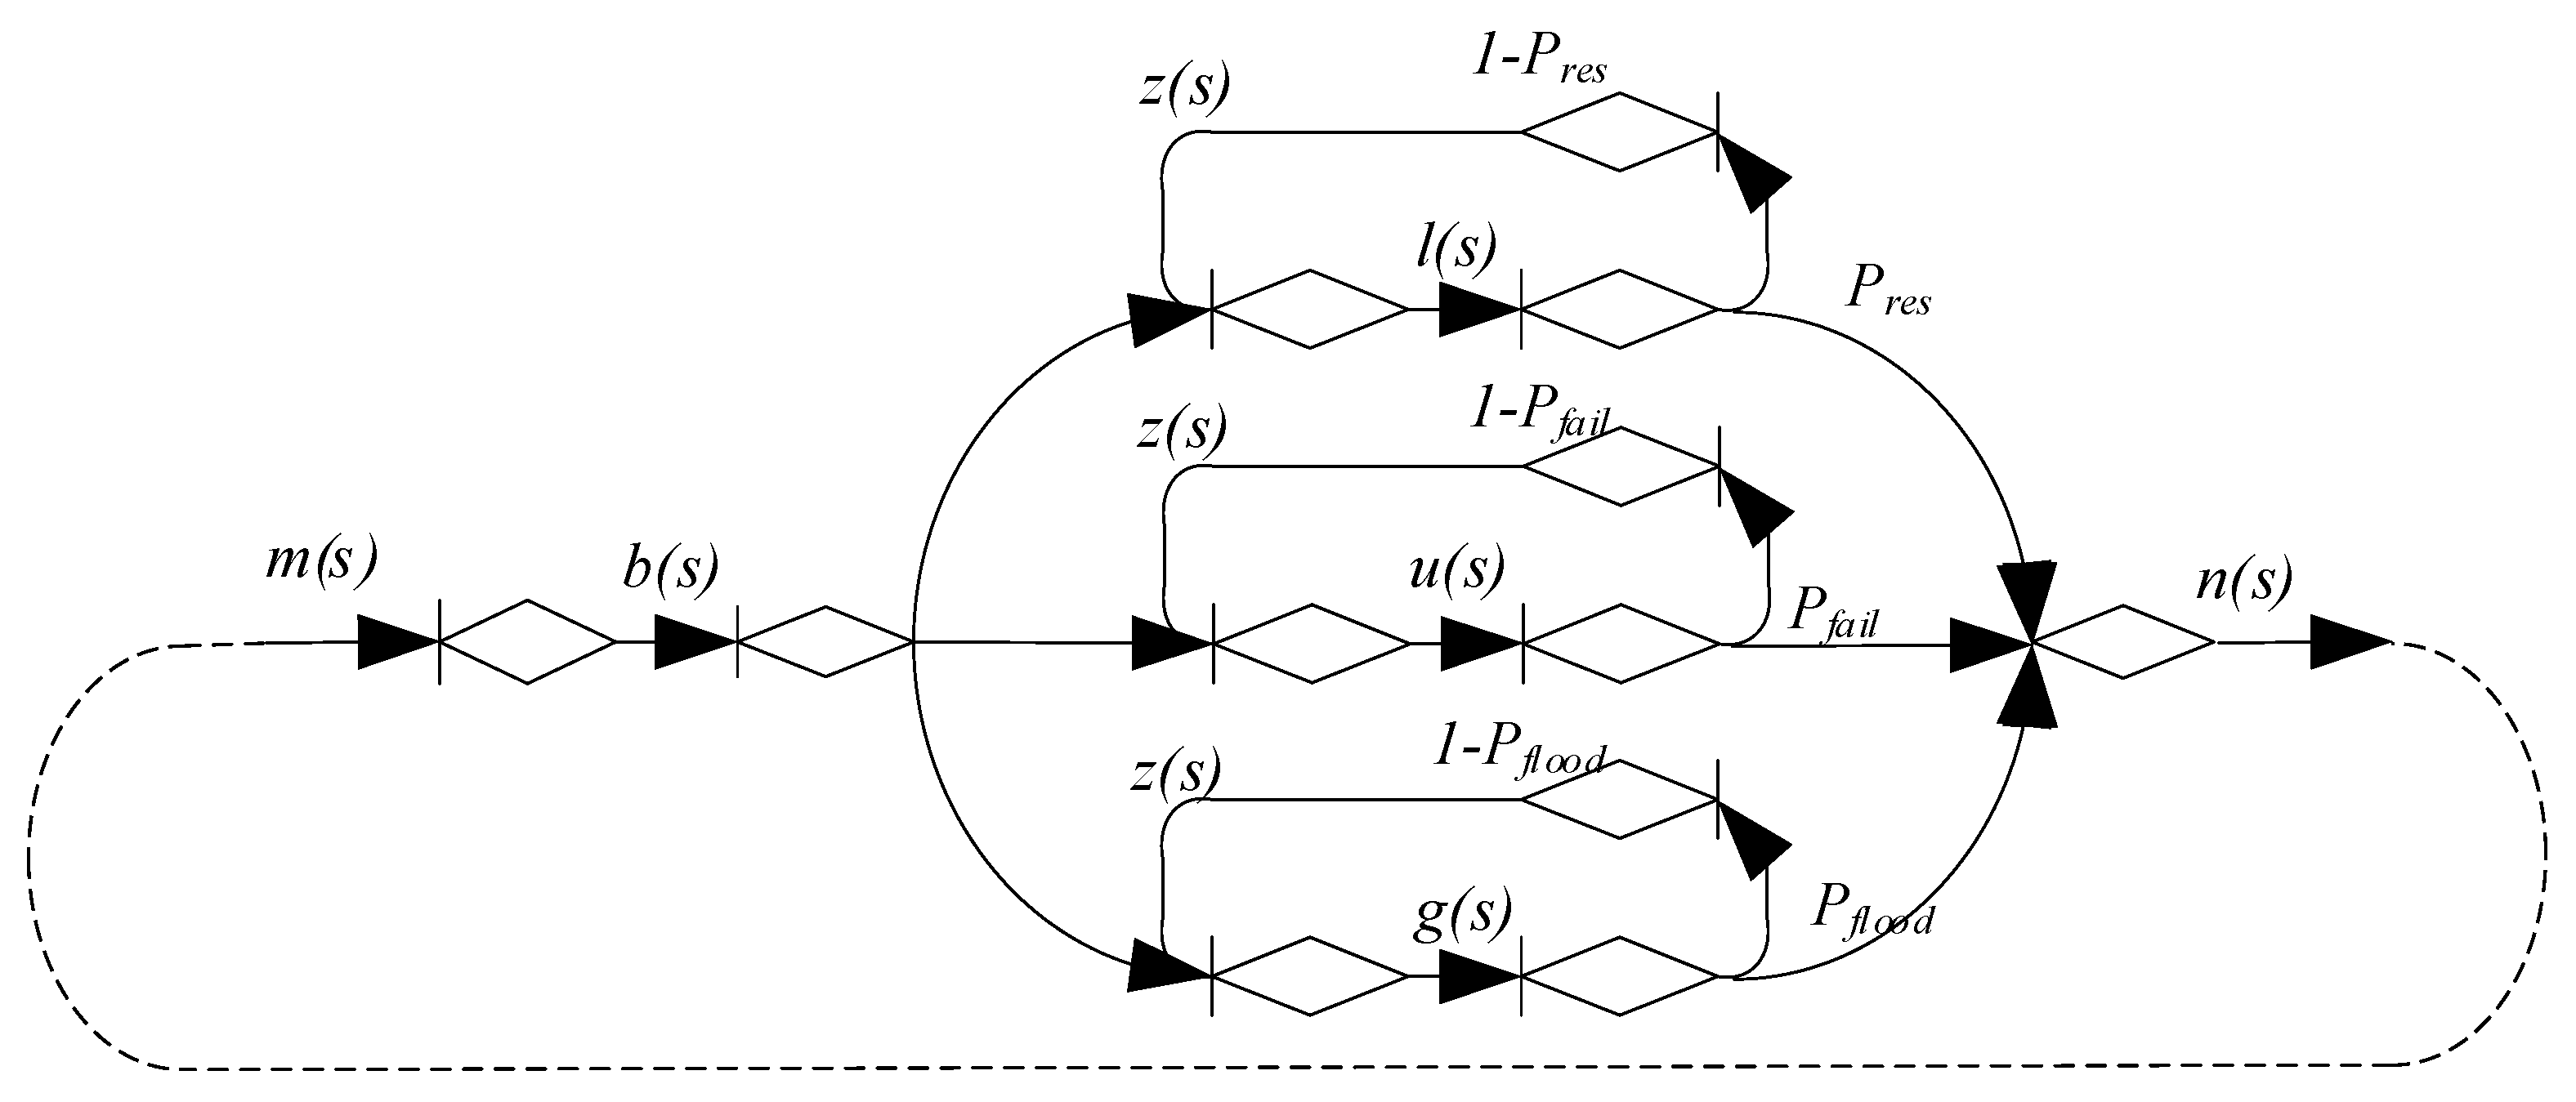
| No. | Description of the CA stage | Stage Symbol |
|---|---|---|
| 1 | Checking the connection channel to the attacked network | w(s) |
| 2 | Exchange with the network controller via the Open Flow control protocol; passing off your device as a legitimate network device | m(s) |
| 3 | Sending network statistics data to the controller via the control protocol; checking the response of the controller | l(s) |
| 4 | Creating a network topology by sending false network statistics | z(s) |
| 5 | Network management by tricking the network controller with false messages from the Open Flow protocol | d(s) |
| No. | Device (Software Product) Name | Note |
|---|---|---|
| Switches and routers | ||
| 1 | JuniperSRX-240 (QEMU) | Network device acting as a border router |
| 2 | Dionis-NX (QEMU) | Network device acting as a firewall |
| 3 | Cisco3845 (QEMU) | Simulating the public communication system operation |
| 4 | OpenvSwitch (Linux Ubuntu) | Software SDN Router |
| Tools for simulating information exchange | ||
| 5 | Linux Ubuntu | Operating system |
| 6 | Lifesize | Video conferencing |
| 7 | Proteus-SP | IP telephone exchange |
| 8 | SIP-T22R | IP telephone |
| 9 | Runos 2.0 | SDN controller |
| Modeling environment and auxiliary tools | ||
| 10 | EVE-NG | Data network simulation environment |
| 11 | NFsen | A tool for collecting information from network devices about information flows |
| 12 | Zabbix 3.4 | Monitoring tool |
| 13 | Wireshark | Means of intercepting traffic in the data transmission network |
| 14 | VMware | Virtualization environment for running guest operating systems |
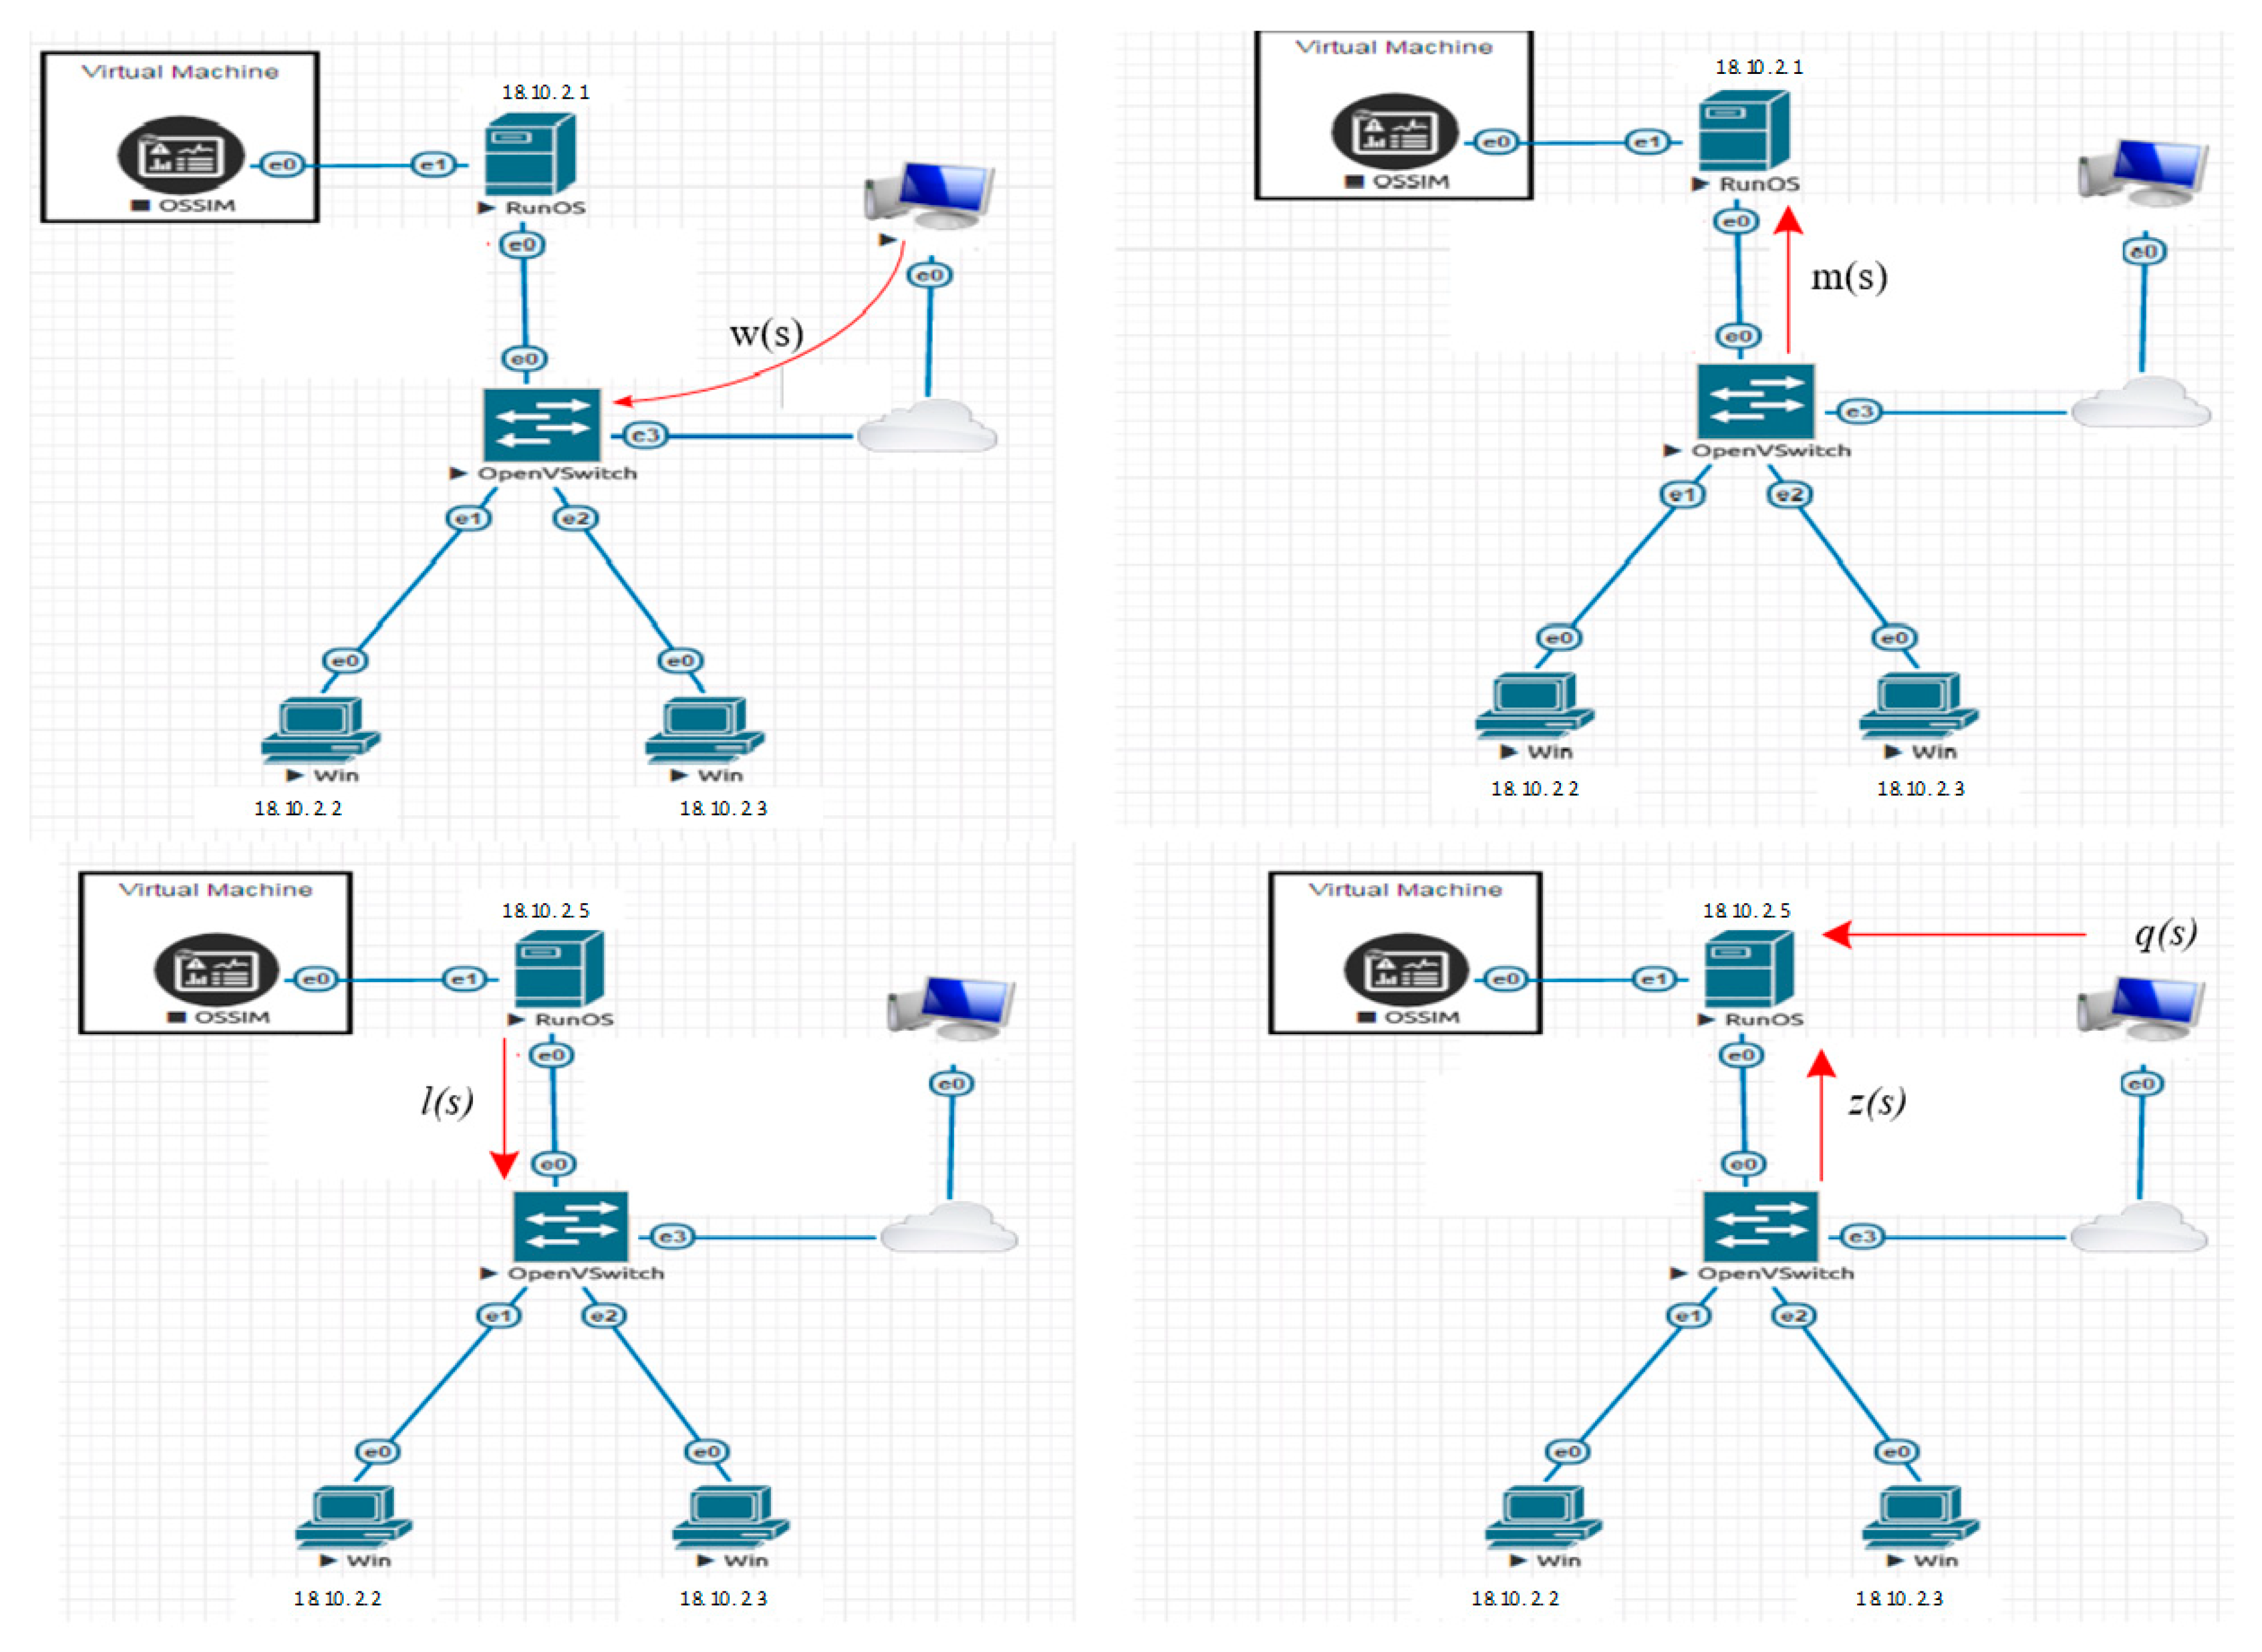
| No. | Description of the CA Stage | Stage Symbol |
|---|---|---|
| 1 | Checking the connection channel to the attacked network | w(s) |
| 2 | Exchange with the network controller via the Open Flow control protocol; passing off your device as a legitimate network device | m(s) |
| 3 | Sending network statistics data to the controller via the control protocol; checking the response of the controller | l(s) |
| 4 | Creating a network topology by sending false network statistics | z(s) |
| 5 | Network management by tricking the network controller with false messages from the Open Flow protocol | q(s) |
Disclaimer/Publisher’s Note: The statements, opinions and data contained in all publications are solely those of the individual author(s) and contributor(s) and not of MDPI and/or the editor(s). MDPI and/or the editor(s) disclaim responsibility for any injury to people or property resulting from any ideas, methods, instructions or products referred to in the content. |
© 2023 by the authors. Licensee MDPI, Basel, Switzerland. This article is an open access article distributed under the terms and conditions of the Creative Commons Attribution (CC BY) license (https://creativecommons.org/licenses/by/4.0/).
Share and Cite
Kotenko, I.; Saenko, I.; Privalov, A.; Lauta, O. Ensuring SDN Resilience under the Influence of Cyber Attacks: Combining Methods of Topological Transformation of Stochastic Networks, Markov Processes, and Neural Networks. Big Data Cogn. Comput. 2023, 7, 66. https://doi.org/10.3390/bdcc7020066
Kotenko I, Saenko I, Privalov A, Lauta O. Ensuring SDN Resilience under the Influence of Cyber Attacks: Combining Methods of Topological Transformation of Stochastic Networks, Markov Processes, and Neural Networks. Big Data and Cognitive Computing. 2023; 7(2):66. https://doi.org/10.3390/bdcc7020066
Chicago/Turabian StyleKotenko, Igor, Igor Saenko, Andrey Privalov, and Oleg Lauta. 2023. "Ensuring SDN Resilience under the Influence of Cyber Attacks: Combining Methods of Topological Transformation of Stochastic Networks, Markov Processes, and Neural Networks" Big Data and Cognitive Computing 7, no. 2: 66. https://doi.org/10.3390/bdcc7020066
APA StyleKotenko, I., Saenko, I., Privalov, A., & Lauta, O. (2023). Ensuring SDN Resilience under the Influence of Cyber Attacks: Combining Methods of Topological Transformation of Stochastic Networks, Markov Processes, and Neural Networks. Big Data and Cognitive Computing, 7(2), 66. https://doi.org/10.3390/bdcc7020066