
Optimizing Operation Room Utilization—A Prediction Model

 ,
, 
Abstract
:1. Introduction
2. Methods
2.1. Data Source
2.2. Outcome Measures and Predictors
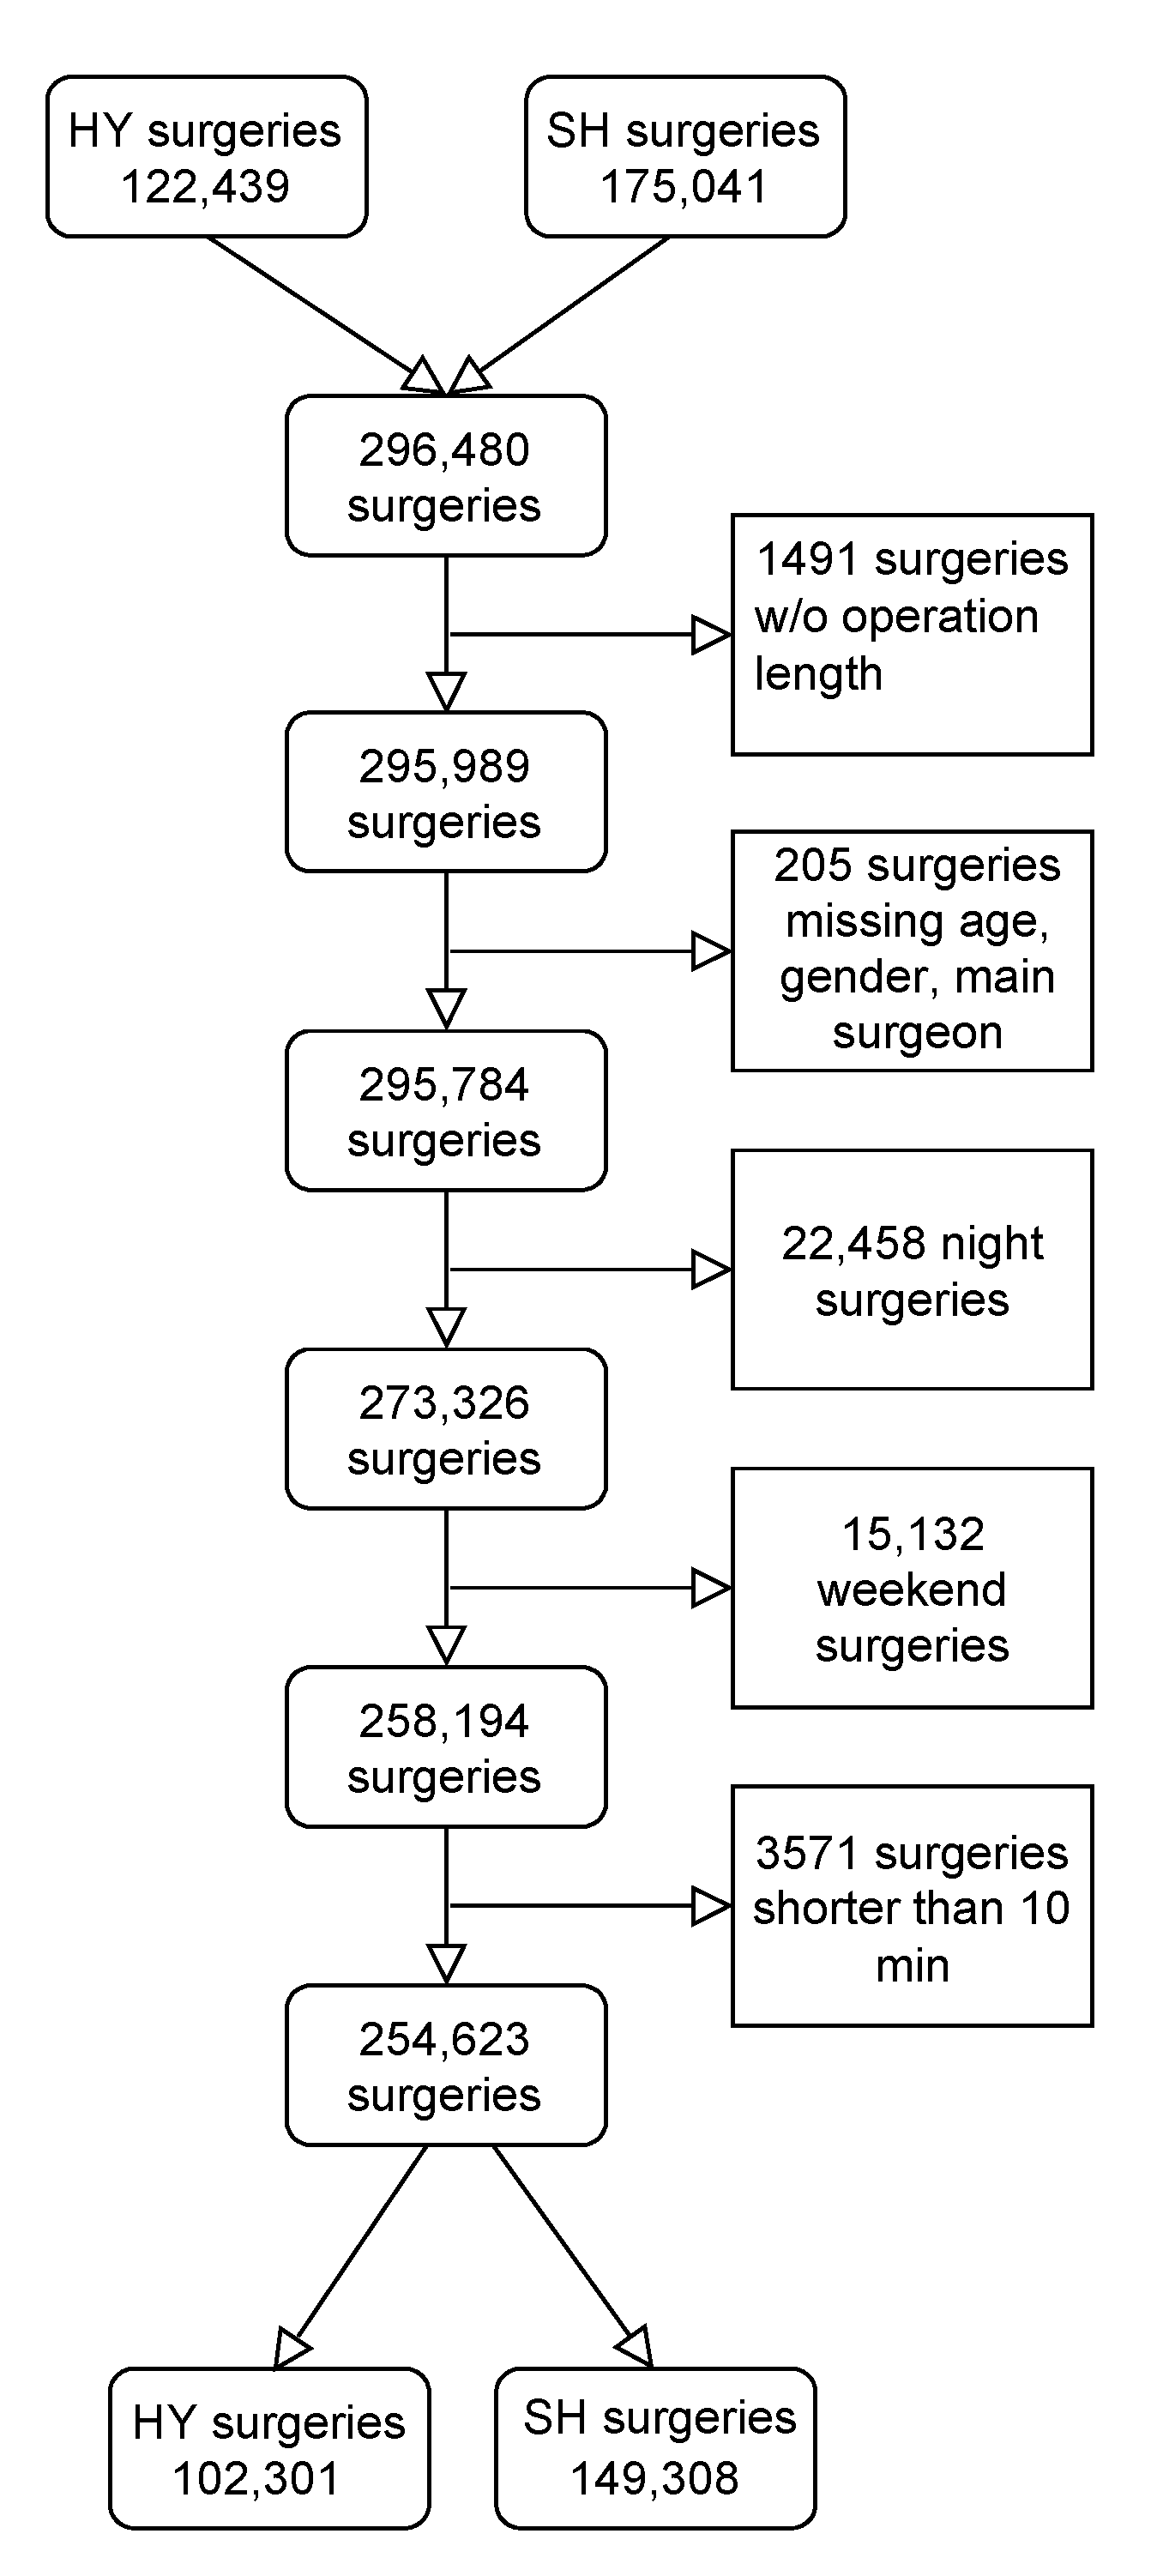
2.3. Data Cleaning and Preprocessing
2.4. Models’ Training
2.5. Evaluation Metrics
3. Results
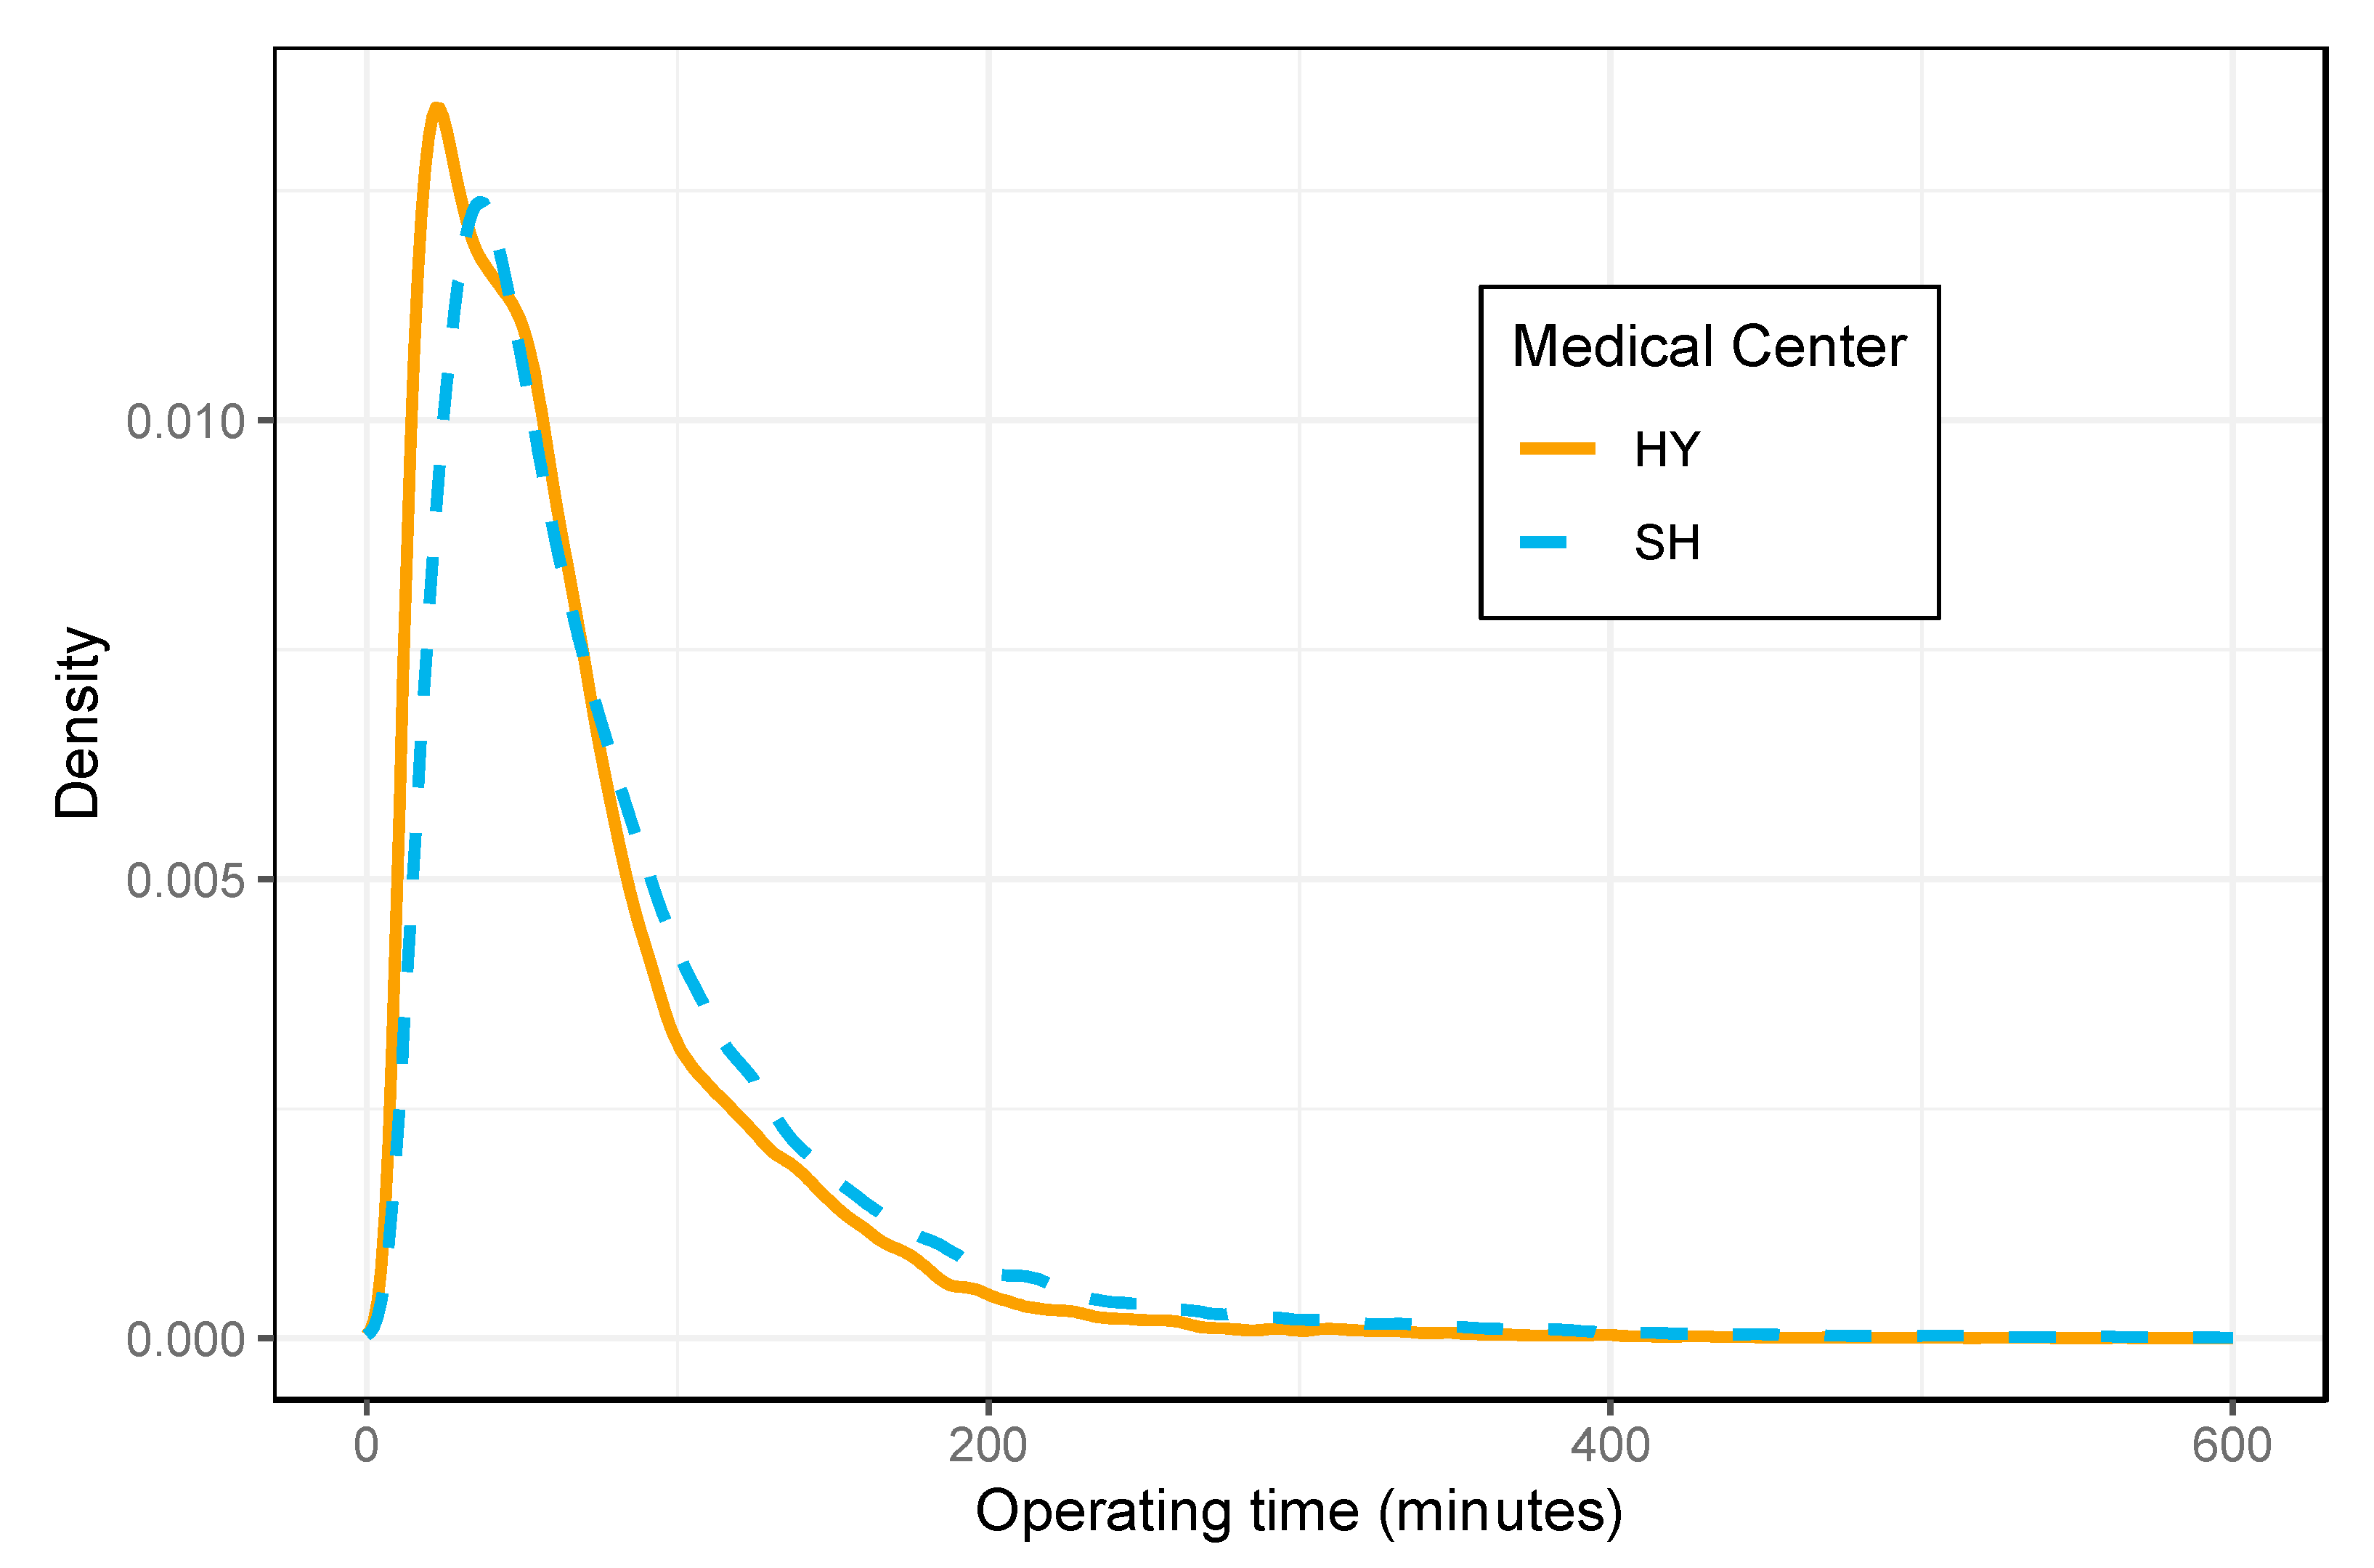
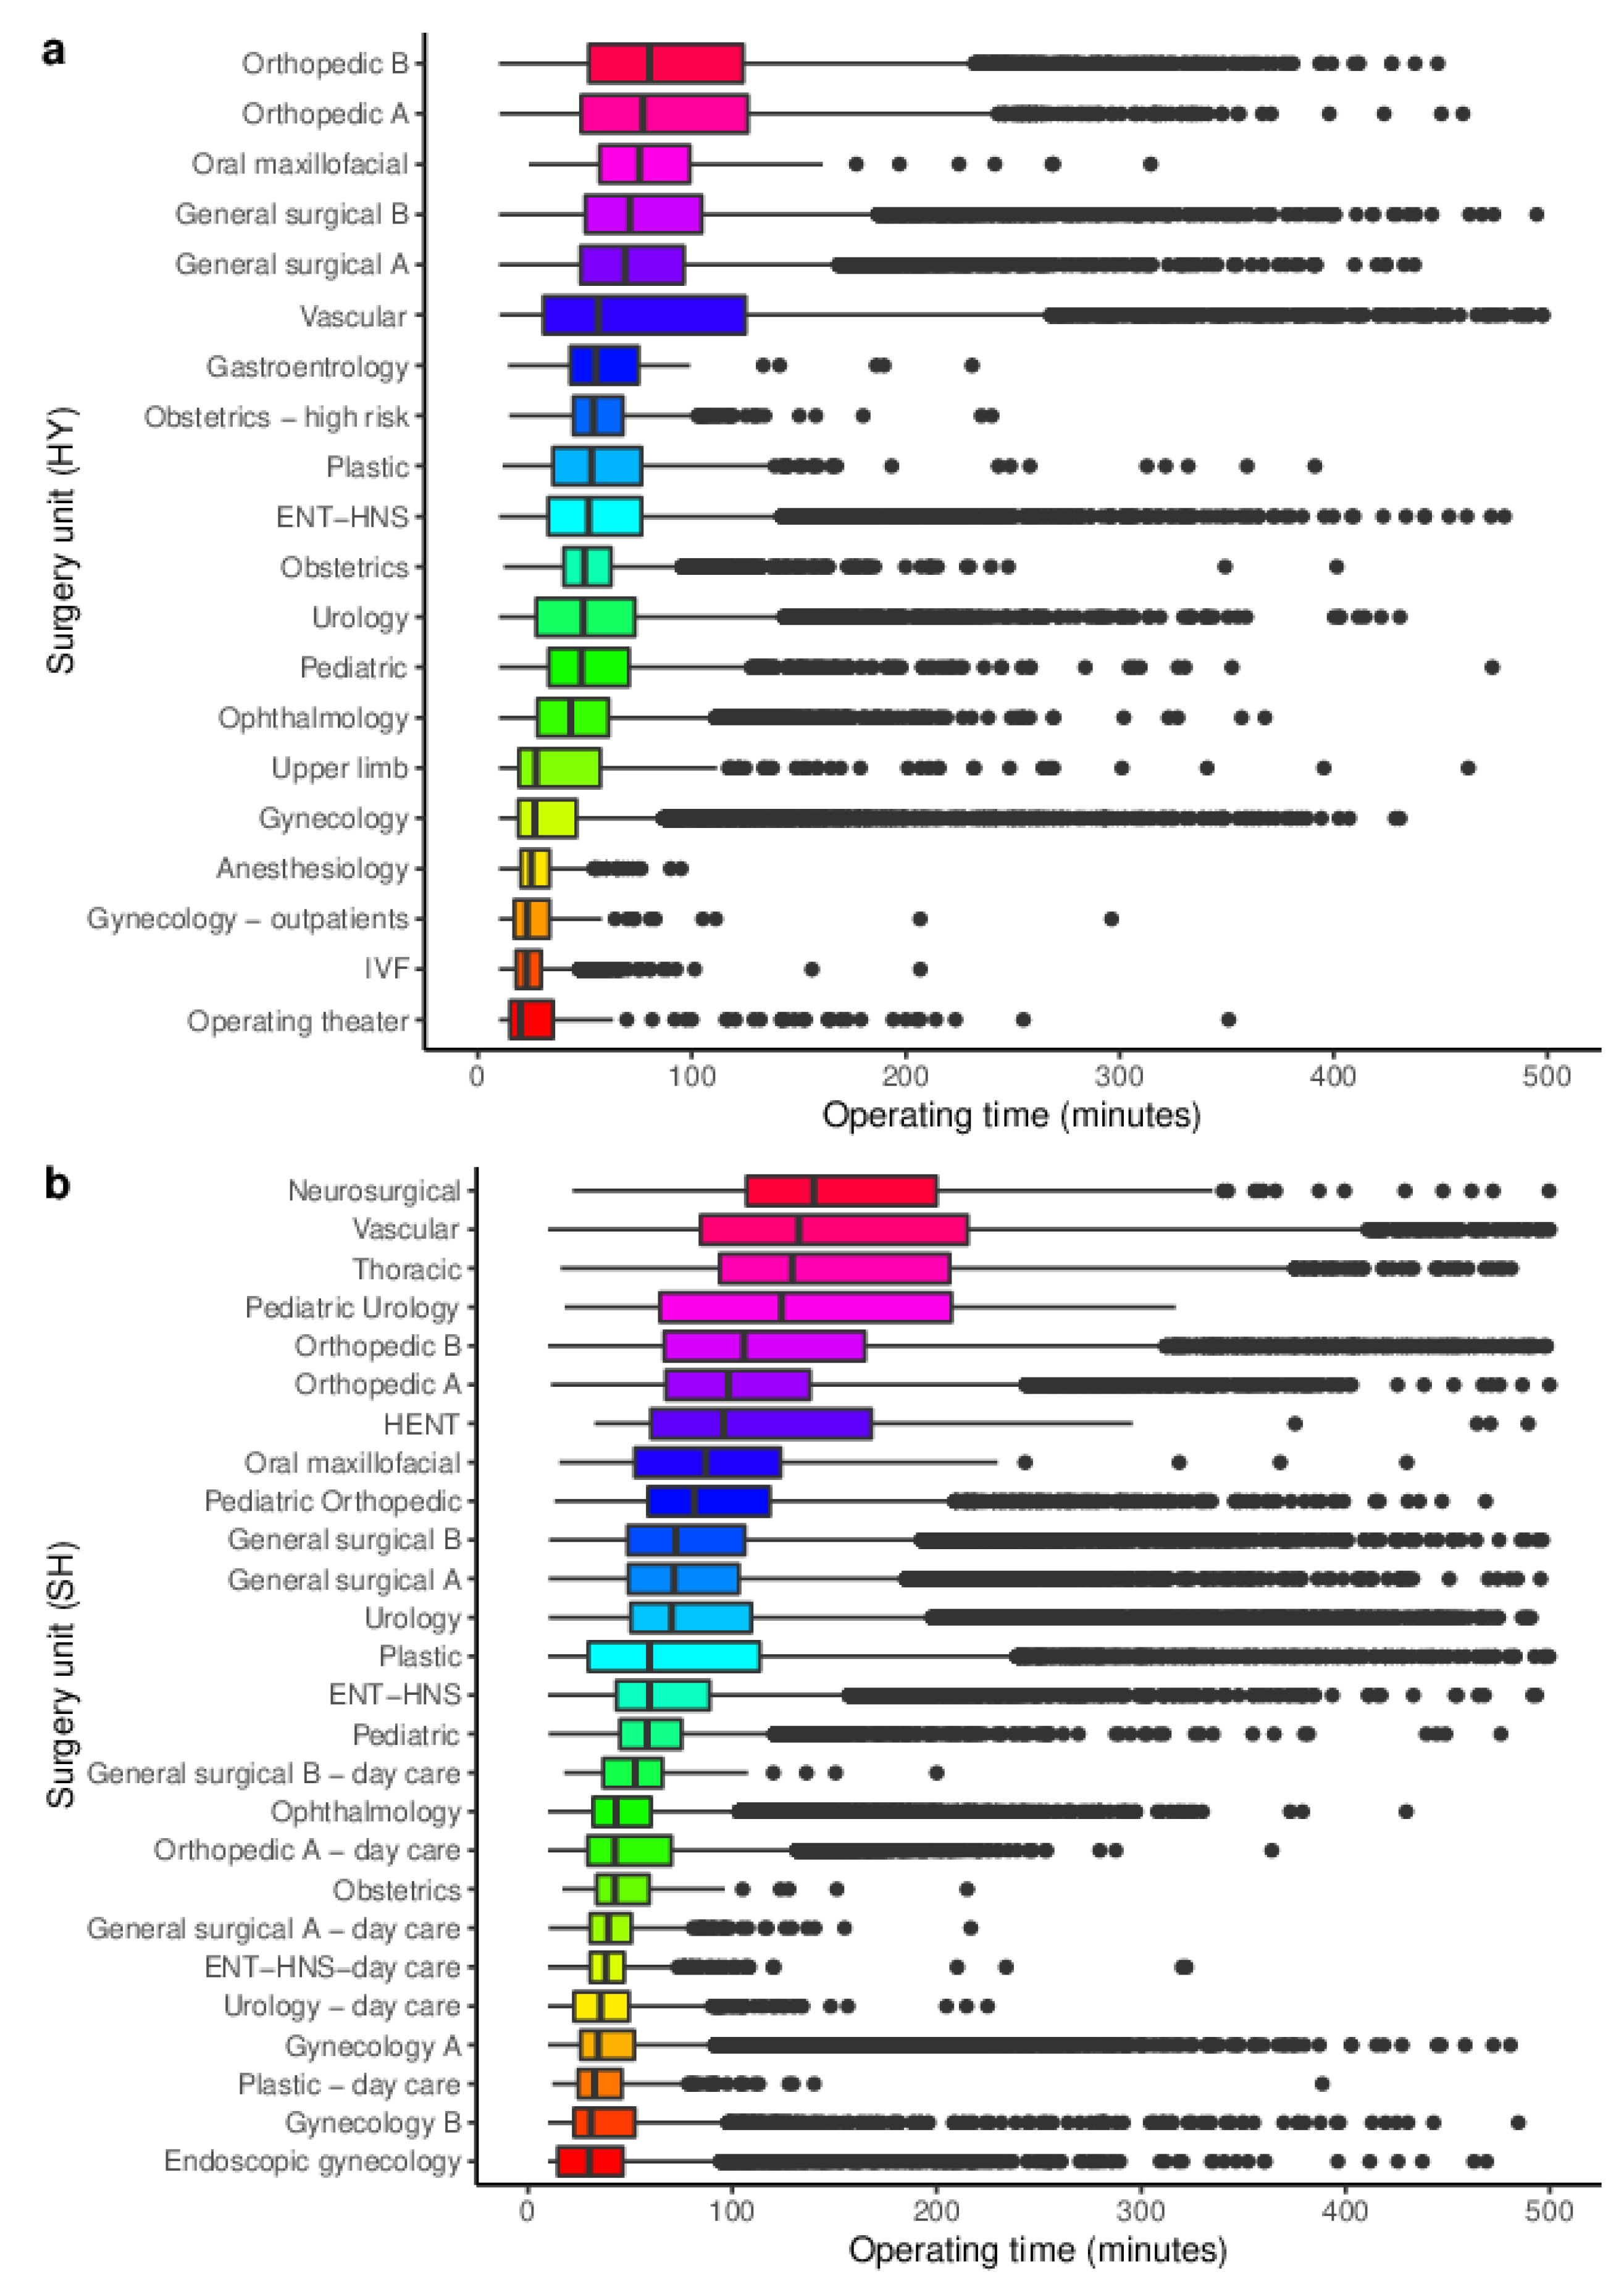
3.1. Data Sets
3.2. Model Development
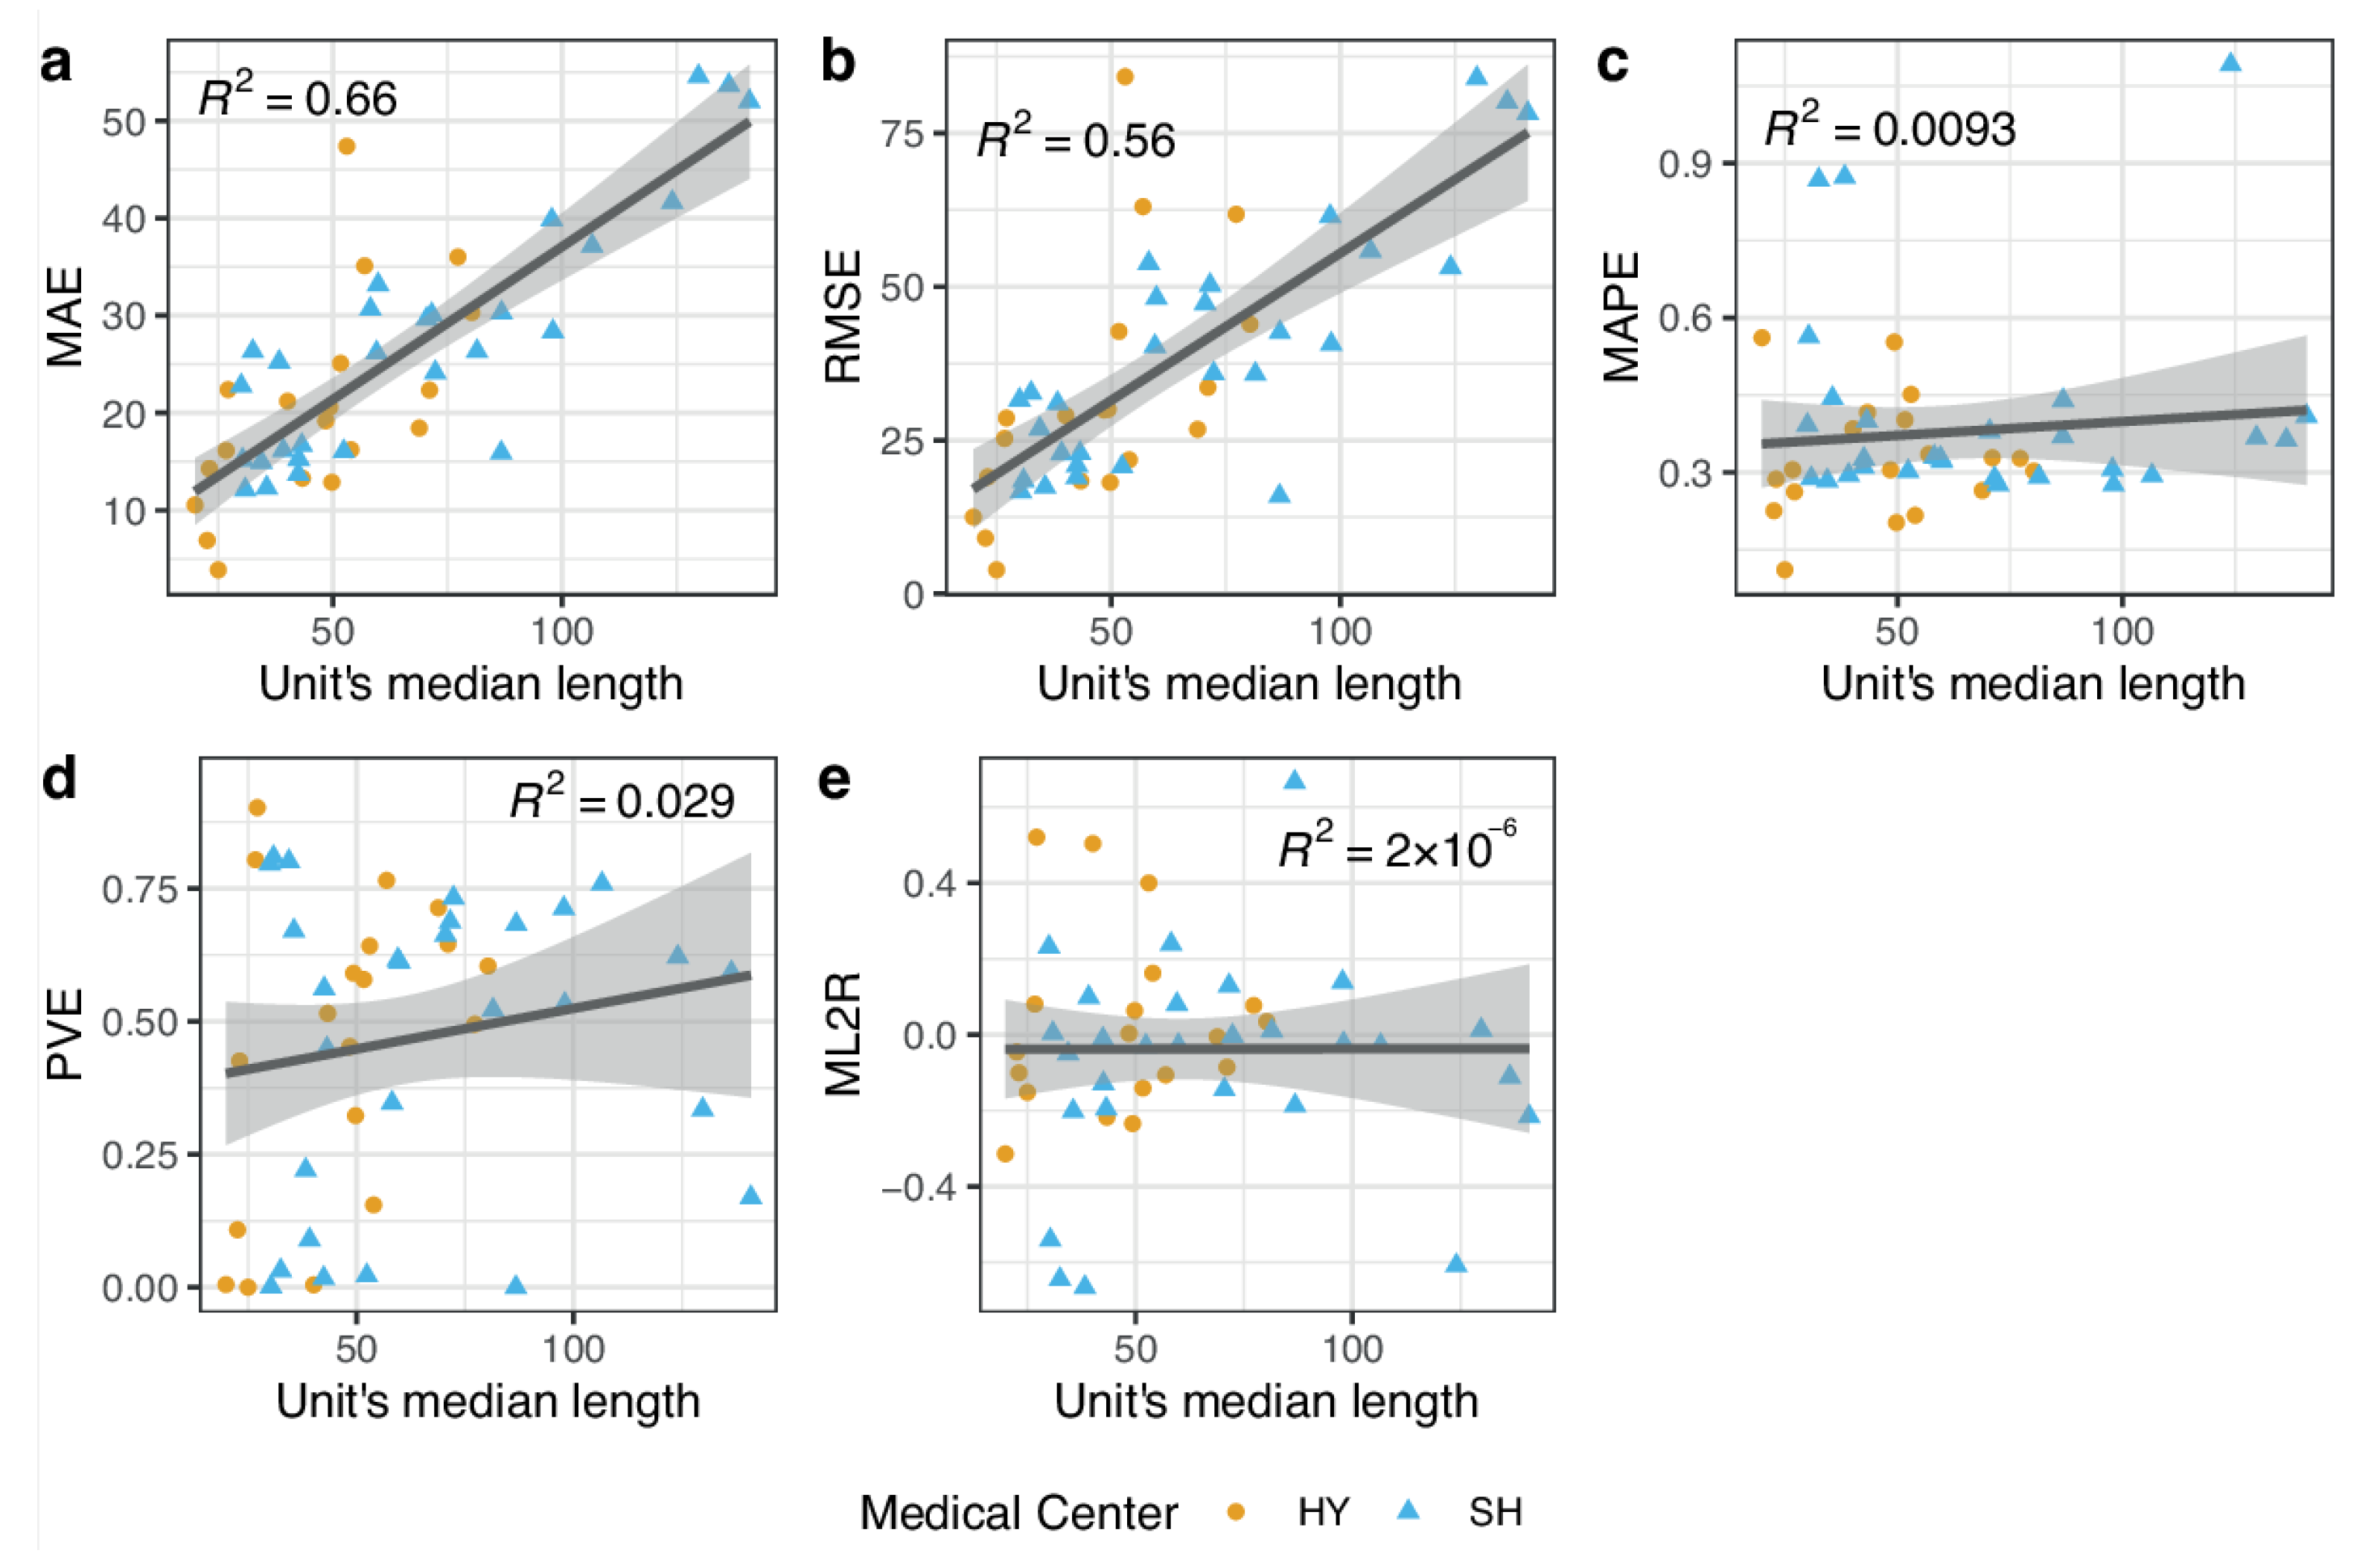
3.3. Model Performance
4. Discussion
5. Conclusions
Supplementary Materials
Author Contributions
Funding
Institutional Review Board Statement
Informed Consent Statement
Data Availability Statement
Acknowledgments
Conflicts of Interest
References
- Gür, Ş.; Eren, T. Application of operatonal research techniques in operating room scheduling problems: Literature overview. J. Healthcare Eng. 2018, 2018, 5341394. [Google Scholar] [CrossRef] [PubMed] [Green Version]
- Lin, Q.-L.; Liu, L.; Liu, H.-C.; Wang, D.-J. Integrating hierarchical balanced scorecard with fuzzy linguistic for evaluating operating room performance in hospitals. Expert Syst. Appl. 2013, 40, 1917–1924. [Google Scholar] [CrossRef]
- Kougias, P.; Tiwari, V.; Barshes, N.R.; Bechara, C.F.; Lowery, B.; Pisimisis, G.; Berger, D.H. Modeling anesthetic times. Predictors and implications for short-term outcomes. J. Surg. Res. 2013, 180, 1–7. [Google Scholar] [CrossRef] [PubMed]
- Kayis, E.; Wang, H.; Patel, M.; Gonzalez, T.; Jain, S.; Ramamurthi, R.; Santos, C.; Singhal, S.; Suermondt, J.; Sylvester, K. Improving prediction of surgery duration using operational and temporal factors. In AMIA Annual Symposium Proceedings; American Medical Informatics Association: Rockville, MD, USA; Volume 2012, pp. 456–462.
- Stepaniak, P.S.; Heij, C.; Mannaerts, G.H.; de Quelerij, M.; de Vries, G. Modeling procedure and surgical times for current procedural terminology-anesthesia-surgeon combinations and evaluation in terms of case-duration prediction and operating room efficiency: A multicenter study. Anesth. Analg. 2009, 109, 1232–1245. [Google Scholar] [CrossRef] [PubMed]
- Saltzman, J.; Abelson, J. Overlapping surgeries to face US Senate inquiry. Boston Globe, 13 March 2016. [Google Scholar]
- Boodman, S. Is your surgeon double-booked. The Washington Post, 10 July 2017. [Google Scholar]
- Brandon, C.; Ghenbot, Y.; Buch, V.; Contreras-Hernandez, E.; Tooker, J.; Dimentberg, R.; Richardson, A.G.; Lucas, T.H. Policies Restricting Overlapping Surgeries Negatively Impact Access to Care, Clinical Efficiency and Hospital Revenue: A Forecasting Model for Surgical Scheduling. Ann. Surg. 2020, 275, 1085–1093. [Google Scholar] [CrossRef] [PubMed]
- Laskin, D.M.; Abubaker, A.O.; Strauss, R.A. Accuracy of predicting the duration of a surgical operation. J. Oral Maxillofac. Surg. 2013, 71, 446–447. [Google Scholar] [CrossRef] [PubMed]
- Di Martinelly, C.; Baptiste, P.; Maknoon, M. An assessment of the integration of nurse timetable changes with operating room planning and scheduling. Int. J. Prod. Res. 2014, 52, 7239–7250. [Google Scholar] [CrossRef]
- Hanset, A.; Meskens, N.; Duvivier, D. Using constraint programming to schedule an operating theatre. In Proceedings of the 2010 IEEE Workshop on Health Care Management (WHCM), Venice, Italy, 18–20 February 2010; pp. 1–6. [Google Scholar]
- Pham, D.-N.; Klinkert, A. Surgical case scheduling as a generalized job shop scheduling problem. Eur. J. Oper. Res. 2008, 185, 1011–1025. [Google Scholar] [CrossRef]
- Lin, Y.-K.; Li, M.-Y. Solving operating room scheduling problem using artificial bee colony algorithm. Healthcare 2021, 9, 152. [Google Scholar] [CrossRef]
- Martinez-Millana, A.; Lizondo, A.; Gatta, R.; Vera, S.; Salcedo, V.T.; Fernandez-Llatas, C. Process mining dashboard in operating rooms: Analysis of staff expectations with analytic hierarchy process. Int. J. Environ. Res. Public Health 2019, 16, 199. [Google Scholar] [CrossRef] [Green Version]
- Antognini, J.M.B.; Antognini, J.F.; Khatri, V. How many operating rooms are needed to manage non-elective surgical cases? A Monte Carlo simulation study. BMC Health Serv. Res. 2015, 15, 1–9. [Google Scholar] [CrossRef] [Green Version]
- Bartek, M.A.; Saxena, R.C.; Solomon, S.; Fong, C.T.; Behara, L.D.; Venigandla, R.; Velagapudi, K.; Lang, J.D.; Nair, B.G. Improving operating room efficiency: Machine learning approach to predict case-time duration. J. Am. Coll. Surg. 2019, 229, 346–354. [Google Scholar] [CrossRef]
- Jordan, M.I.; Mitchell, T.M. Machine learning: Trends, perspectives, and prospects. Science 2015, 349, 255–260. [Google Scholar] [CrossRef] [PubMed]
- Alpaydin, E. Introduction to Machine Learning; MIT Press: Cambridge, MA, USA, 2020. [Google Scholar]
- O’Neill, T.J.; Xi, Y.; Stehel, E.; Browning, T.; Ng, Y.S.; Baker, C.; Peshock, R.M. Active reprioritization of the reading worklist using artificial intelligence has a beneficial effect on the turnaround time for interpretation of head CT with intracranial hemorrhage. Radiol. Artif. Intell. 2020, 3, e200024. [Google Scholar] [CrossRef]
- Zhang, F.; Cui, X.; Gong, R.; Zhang, C.; Liao, Z. Key Experimental Factors of Machine Learning-Based Identification of Surgery Cancellations. J. Healthc. Eng. 2021, 2021, 6247652. [Google Scholar] [CrossRef]
- Zhao, B.; Waterman, R.S.; Urman, R.D.; Gabriel, R.A. A machine learning approach to predicting case duration for robot-assisted surgery. J. Med. Syst. 2019, 43, 32. [Google Scholar] [CrossRef]
- Tubaro, P.; Casilli, A.A.; Coville, M. The trainer, the verifier, the imitator: Three ways in which human platform workers support artificial intelligence. Big Data Soc. 2020, 7, 2053951720919776. [Google Scholar] [CrossRef]
- Mirchi, N.; Bissonnette, V.; Yilmaz, R.; Ledwos, N.; Winkler-Schwartz, A.; Del Maestro, R.F. The Virtual Operative Assistant: An explainable artificial intelligence tool for simulation-based training in surgery and medicine. PLoS ONE 2020, 15, e0229596. [Google Scholar]
- Cowen, M.E.; Dusseau, D.J.; Toth, B.G.; Guisinger, C.; Zodet, M.W.; Shyr, Y. Casemix adjustment of managed care claims data using the clinical classification for health policy research method. Med. Care 1998, 36, 1108–1113. [Google Scholar] [CrossRef]
- Chen, T.; Guestrin, C. XGBoost: A scalable tree boosting system. In Proceedings of the 22nd ACM SIGKDD International Conference on Knowledge Discovery and Data Mining, San Francisco, CA, USA, 13–17 August 2016; pp. 785–794. [Google Scholar]
- Chen, T.; He, T. Higgs boson discovery with boosted trees. In Proceedings of the NIPS 2014 Workshop on High-Energy Physics and Machine Learning, Montreal, QC, Canada, 8–13 December 2014; pp. 69–80. [Google Scholar]
- Nogueira, F. Bayesian Optimization: Open source constrained global optimization tool for Python. 2014. Available online: https://github.com/fmfn/BayesianOptimization (accessed on 15 June 2021).
- Feurer, M.; Hutter, F. Hyperparameter optimization. In Automated Machine Learning; Springer: Cham, Switzerland, 2019; pp. 3–33. [Google Scholar]
- Hastie, T.; Tibshirani, R.; Friedman, J.H. The Elements of Statistical Learning: Data Mining, Inference, and Prediction, 2nd ed.; Springer: New York, NY, USA, 2009. [Google Scholar]
- Lai, J.; Huang, C.-C.; Liu, S.-C.; Huang, J.-Y.; Cho, D.-Y.; Yu, J. Improving and Interpreting Surgical Case Duration Prediction with Machine Learning Methodology. Available online: https://www.medrxiv.org/content/10.1101/2020.06.10.20127910v2.full-text (accessed on 4 February 2022).
- Master, N.; Zhou, Z.; Miller, D.; Scheinker, D.; Bambos, N.; Glynn, P. Improving predictions of pediatric surgical durations with supervised learning. Int. J. Data Sci. Anal. 2017, 4, 35–52. [Google Scholar] [CrossRef] [Green Version]
- Strum, D.P.; Sampson, A.R.; May, J.H.; Vargas, L.G. Surgeon and type of anesthesia predict variability in surgical procedure times. J. Am. Soc. Anesthesiol. 2000, 92, 1454–1466. [Google Scholar] [CrossRef] [PubMed]

| Parameter Type | Parameter Name in XGBoost Package | Range of Search | Optimal Value in SH | Optimal Value in HY |
|---|---|---|---|---|
| Subsample ratio of columns when constructing each tree | colsample_bytree | 0.6–1 | 0.713555 | 0.991201 |
| Minimum loss reduction required to make a further partition on a leaf node of the tree | gamma | 0–5 | 2.206600 | 1.073363 |
| Step size weight shrinkage | learning_rate | 0.01–1 | 0.247214 | 0.271243 |
| Maximum depth of a tree | max_depth | 3–6 | 5 | 5 |
| Minimum sum of instance weight needed in a child | min_child_weight | 1–10 | 5.427004 | 1.240320 |
| Number of trees | n_estimators | 100–1000 | 762 | 486 |
| Subsample ratio of instances | subsample | 0.6–1 | 0.767184 | 0.818254 |
| HY | SH | |
|---|---|---|
| N | 121,539 | 174,450 |
| Demographic | ||
| Age (median, IQR) | 44 (30–64) | 51 (29–68) |
| Females (%) | 59.4 | 50.0 |
| Preoperative | ||
| Number of drugs (median, IQR) | 9 (4–17) | 9 (4–18) |
| Number of diagnoses (median, IQR) | 6 (3–11) | 6 (3–11) |
| Surgeon’s experience | ||
| Number of previous surgeries (median, IQR) | 432 (158–863) | 361 (133–775) |
| Total hours in operating room (median, IQR) | 435.55 (154–892) | 428 (155–963) |
| Surgery | ||
| Number of procedures (median, IQR) | 1 (1–1) | 1 (1–1) |
| Operating time in minutes (median, IQR) | 52.45 (31–85) | 60.95 (38–102) |
| Hospital | HY | SH | ||
|---|---|---|---|---|
| N | 27,752 | 39,468 | ||
| Median length | 54.06 | 67.35 | ||
| Model | Naïve | XGB | Naïve | XGB |
| MAE | 25.44 | 21.52 | 28.69 | 25.23 |
| RMSE | 49.03 | 36.64 | 55.03 | 40.26 |
| MAPE | 35.36 | 35.16 | 32.48 | 35.11 |
| PVE | 44.02 | 66.71 | 46.75 | 69.97 |
| ML2R | 0.14 | −0.05 | 0.14 | −0.06 |
| AbsErr ≤ 10 min | 40.48 | 40.95 | 36.79 | 32.89 |
| AbsErr ≤ 20 min | 63.18 | 65.56 | 59.76 | 57.25 |
| AbsErr ≤ 10% | 21.03 | 22.49 | 21.93 | 21.69 |
| AbsErr ≤ 20% | 39.63 | 42.65 | 42.41 | 41.21 |
Publisher’s Note: MDPI stays neutral with regard to jurisdictional claims in published maps and institutional affiliations. |
© 2022 by the authors. Licensee MDPI, Basel, Switzerland. This article is an open access article distributed under the terms and conditions of the Creative Commons Attribution (CC BY) license (https://creativecommons.org/licenses/by/4.0/).
Share and Cite
Abbou, B.; Tal, O.; Frenkel, G.; Rubin, R.; Rappoport, N. Optimizing Operation Room Utilization—A Prediction Model. Big Data Cogn. Comput. 2022, 6, 76. https://doi.org/10.3390/bdcc6030076
Abbou B, Tal O, Frenkel G, Rubin R, Rappoport N. Optimizing Operation Room Utilization—A Prediction Model. Big Data and Cognitive Computing. 2022; 6(3):76. https://doi.org/10.3390/bdcc6030076
Chicago/Turabian StyleAbbou, Benyamine, Orna Tal, Gil Frenkel, Robyn Rubin, and Nadav Rappoport. 2022. "Optimizing Operation Room Utilization—A Prediction Model" Big Data and Cognitive Computing 6, no. 3: 76. https://doi.org/10.3390/bdcc6030076
APA StyleAbbou, B., Tal, O., Frenkel, G., Rubin, R., & Rappoport, N. (2022). Optimizing Operation Room Utilization—A Prediction Model. Big Data and Cognitive Computing, 6(3), 76. https://doi.org/10.3390/bdcc6030076