
Lightweight AI Framework for Industry 4.0 Case Study: Water Meter Recognition


Abstract
:1. Introduction
- An AI-and OCR-based model is advanced to detect and extract water meter numbers.
- This model is implementable on smart phones.
- The model enables detecting, extracting, and calculating pertinent data, such as consumption and date and storing them in a database.
- The accuracy obtained from the object detection model is about 98%.
- -
- The state of the art that talks about the application of AI in the context of smart cities, and particularly in the management of consumption.
- -
- The proposed approach that facilitates data collection, storage, and approximation of consumption
- -
- The different results of the implementation of the proposed approach
- -
- A conclusion and perspectives of the proposed work.
2. Related Works
2.1. Industry 4.0
2.2. Water Monitoring
- -
- Error in collecting information from the counter.
- -
- Error in recording data on the register.
- -
- Error in saving the data in the database.
- -
- Lack of clarity in the data obtained manually.
- -
- Loss of the paper register on which the data is collected.
- -
- For the Tunisian water management company: to continuously obtain updated consumption values of the different customers.
- -
- For the customers: to get access in real time to the consumption value as well as the invoices that have been saved.
- -
- For the collaborators: to avoid errors in the manual seizure of the values.
- (1)
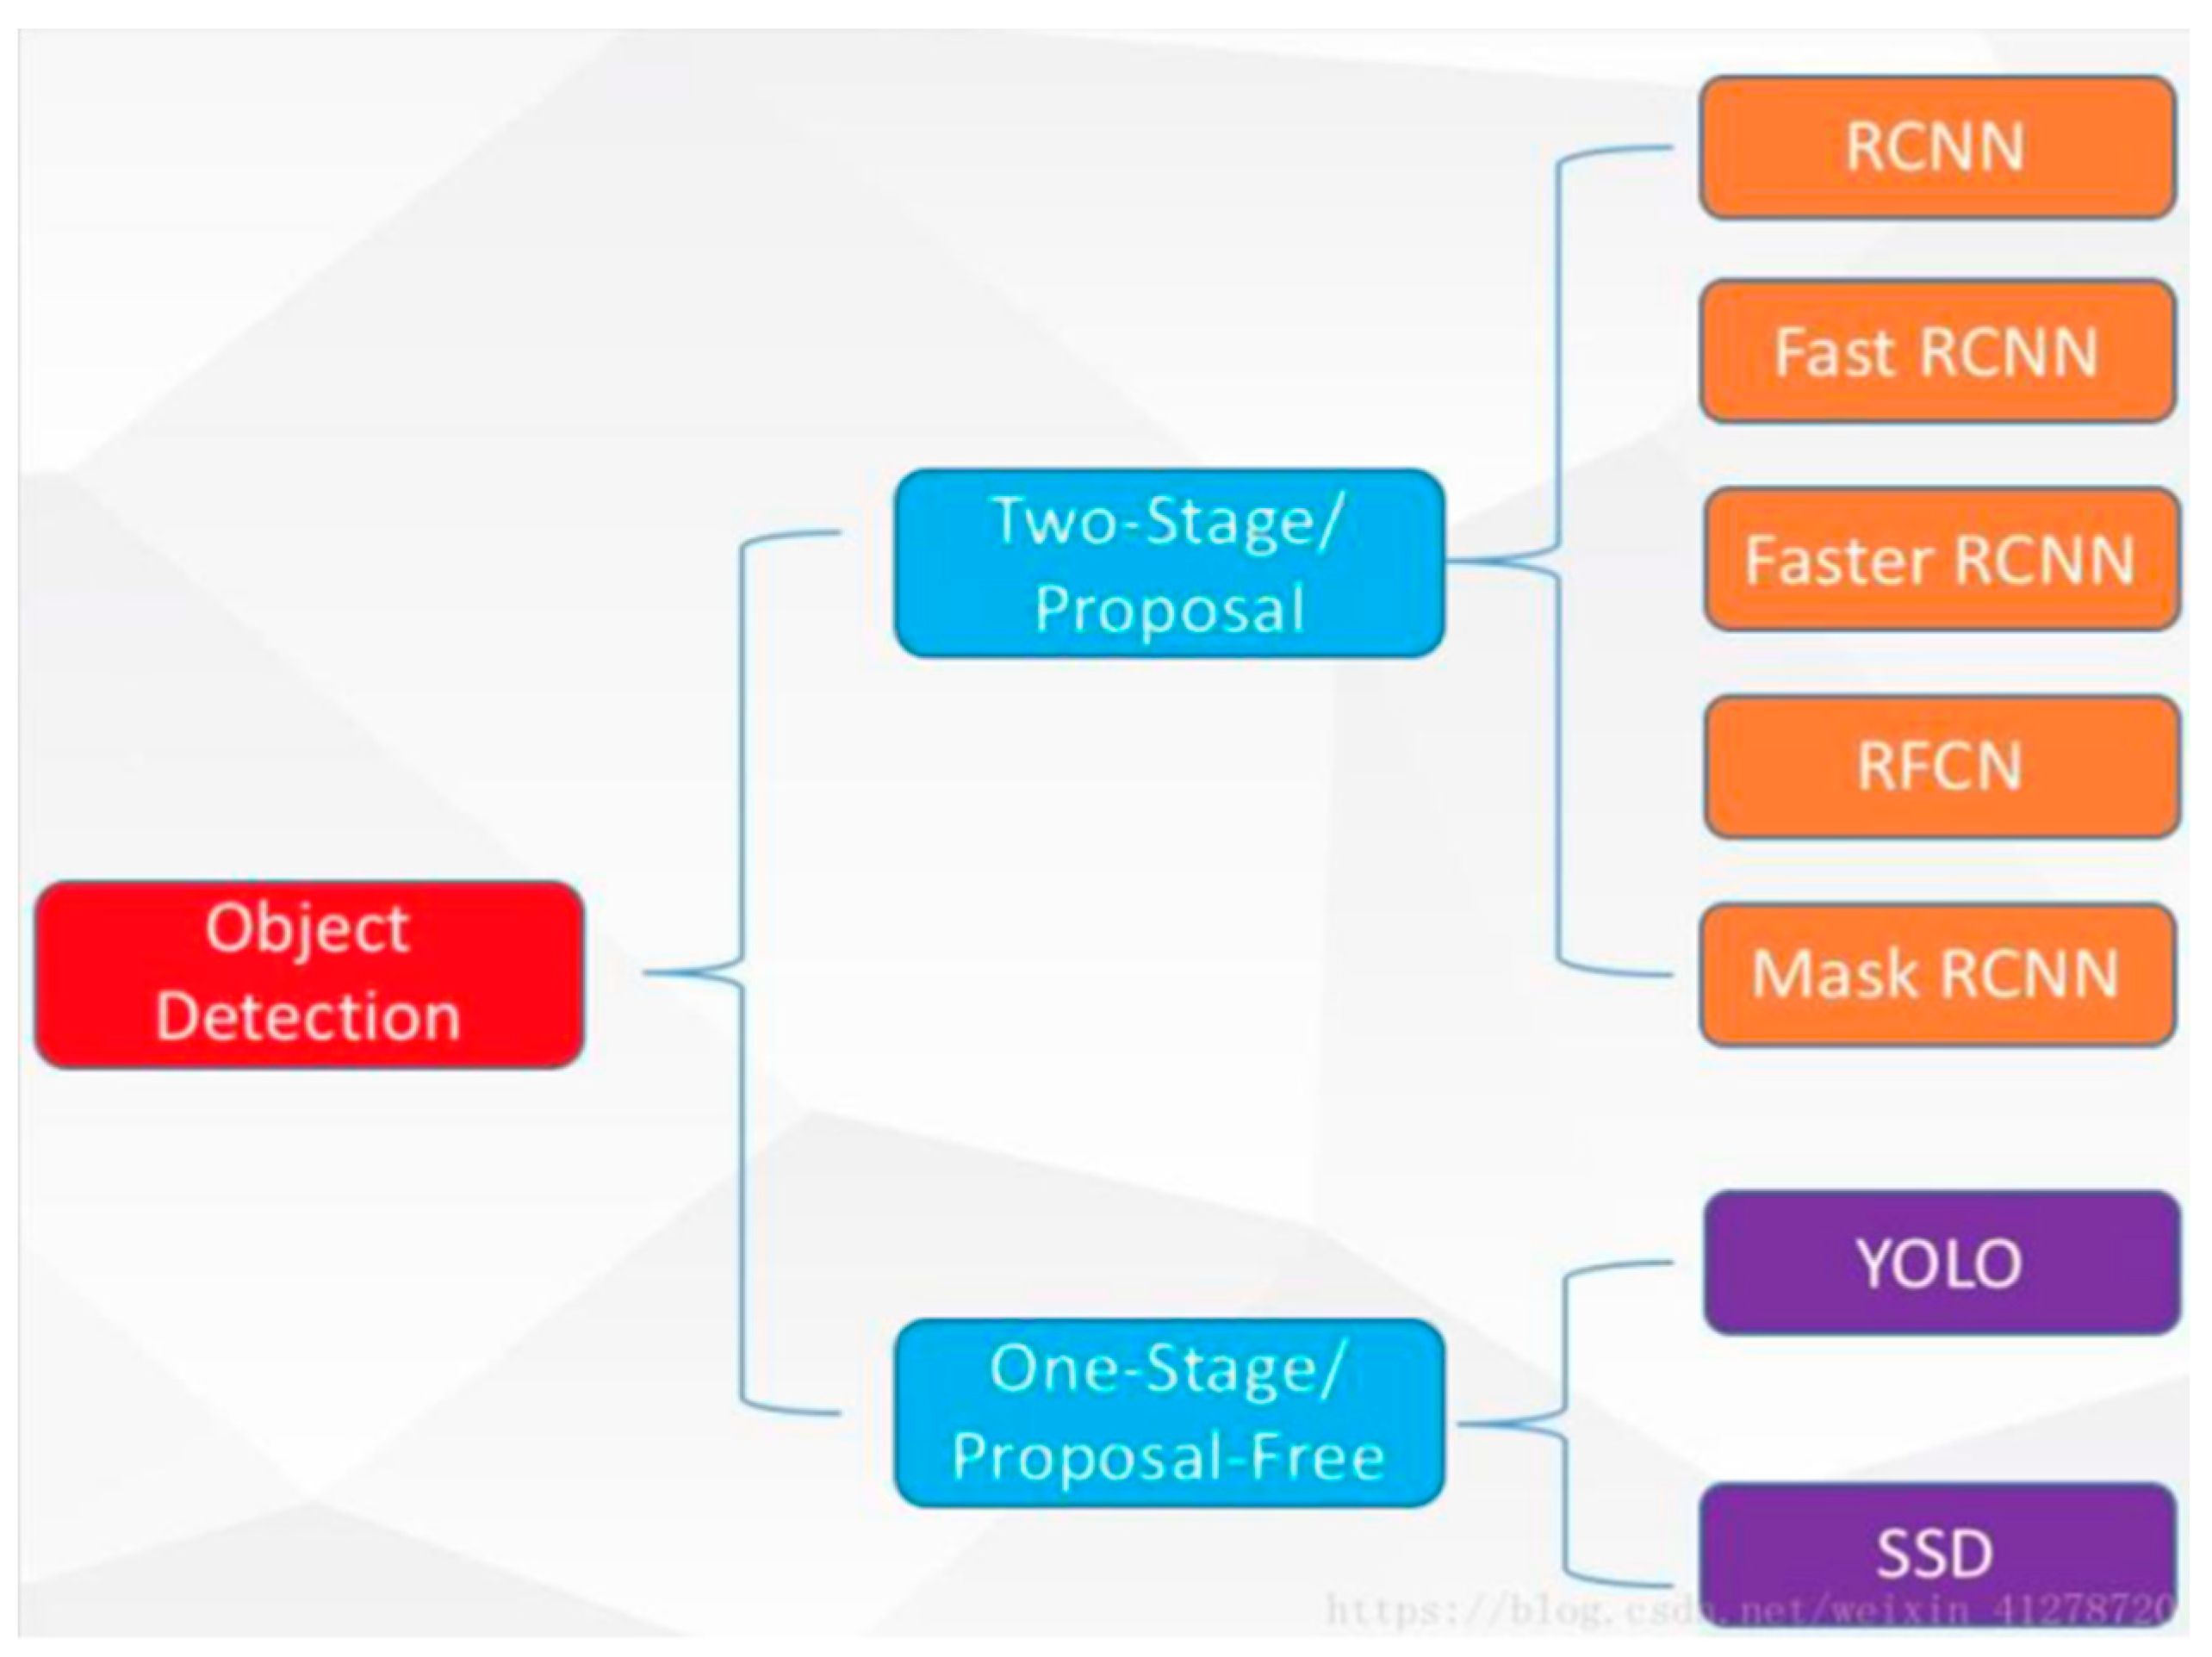
- The detection of the meters;
- (2)
- Digit segmentation;
- (3)
- Digit recognition.
3. Proposed Approach
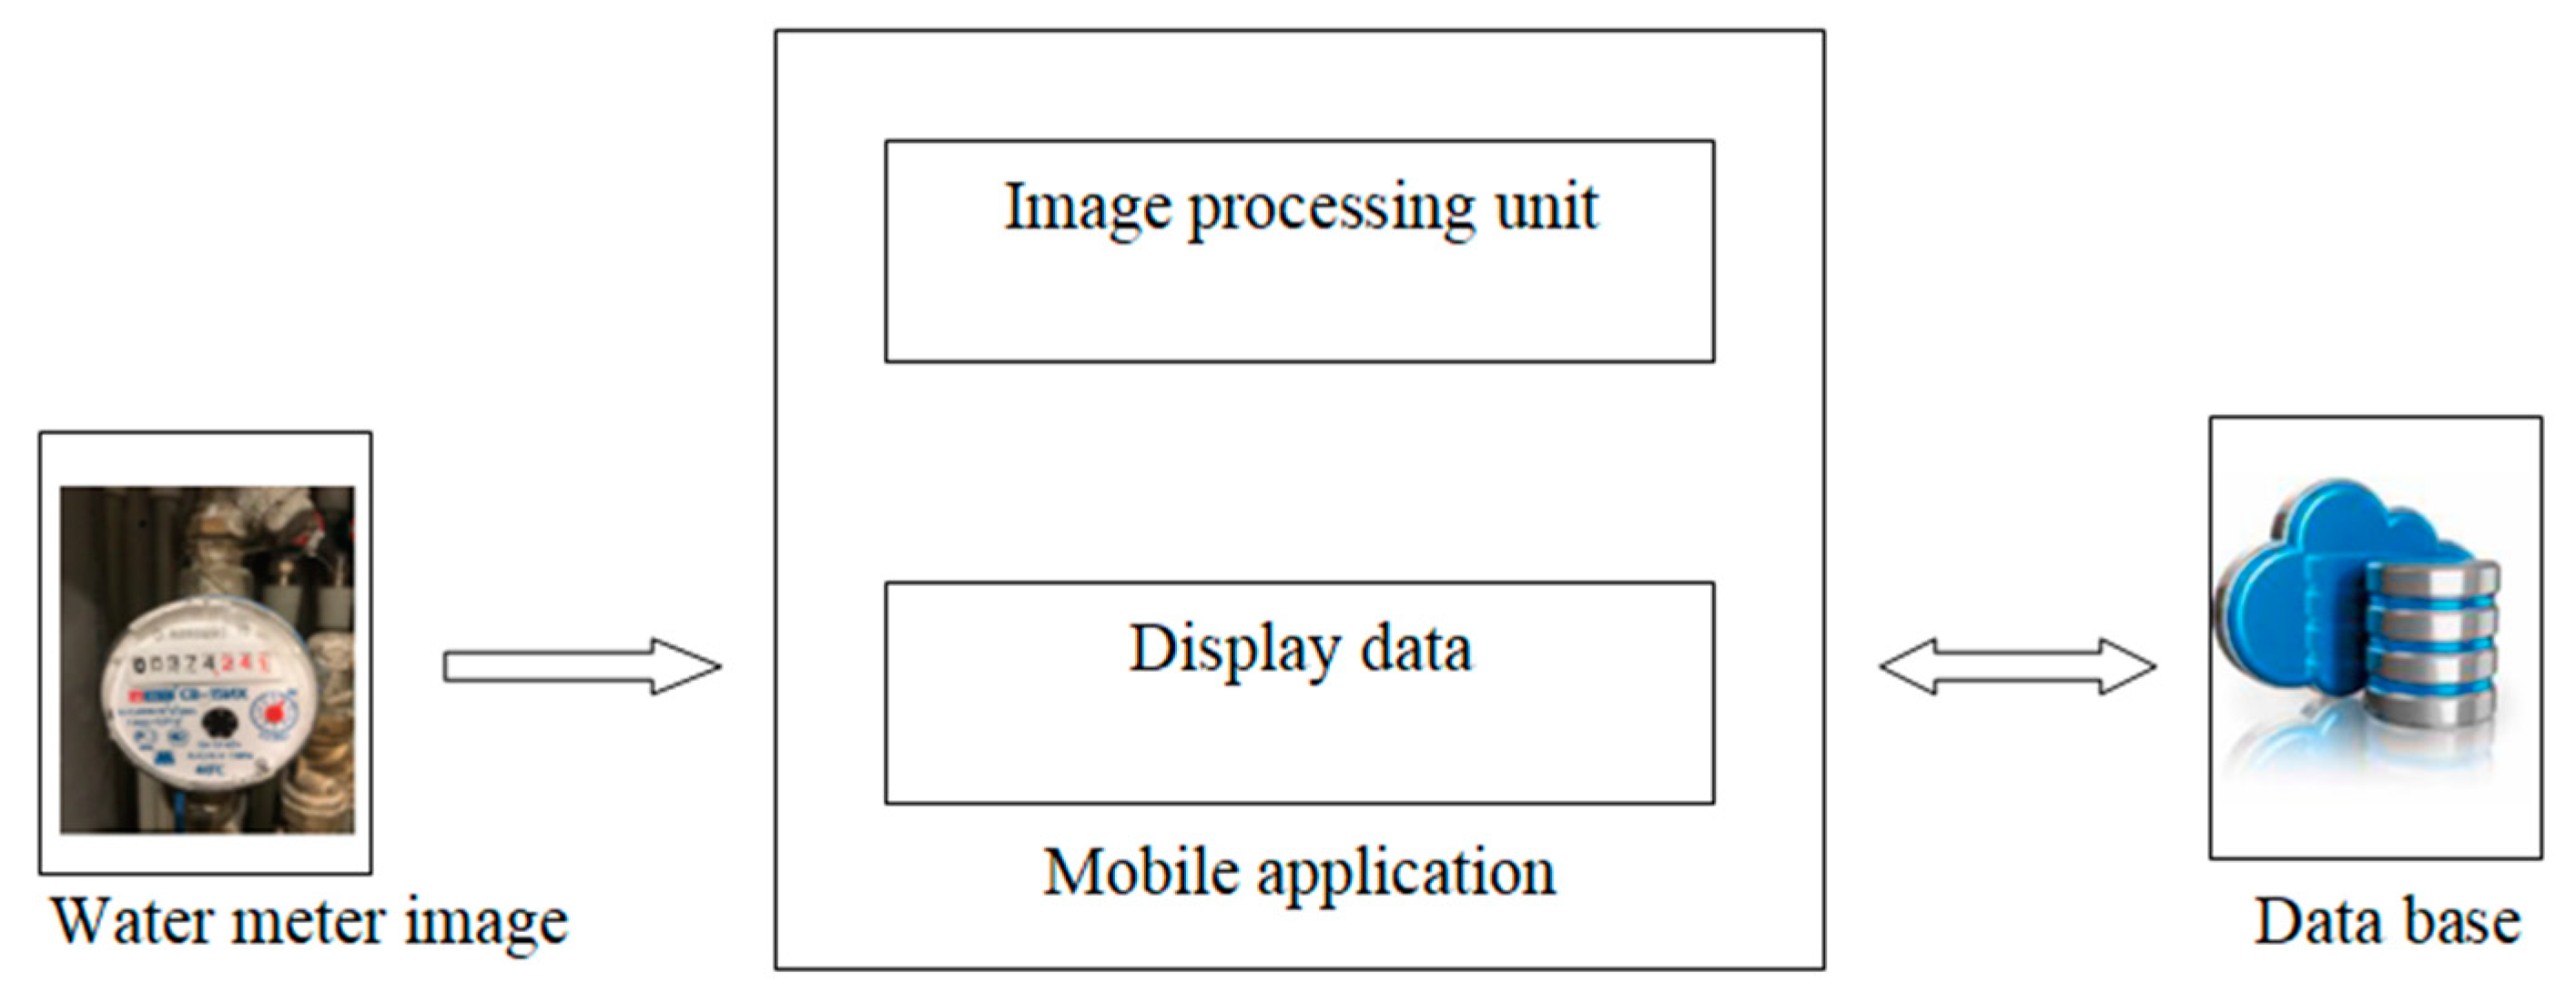
- -
- Display unit: mobile application;
- -
- Image processing unit: model AI, which will be integrated within the mobile application;
- -
- Water providers data storage unit: database.
3.1. Specification
3.2. Image Processing
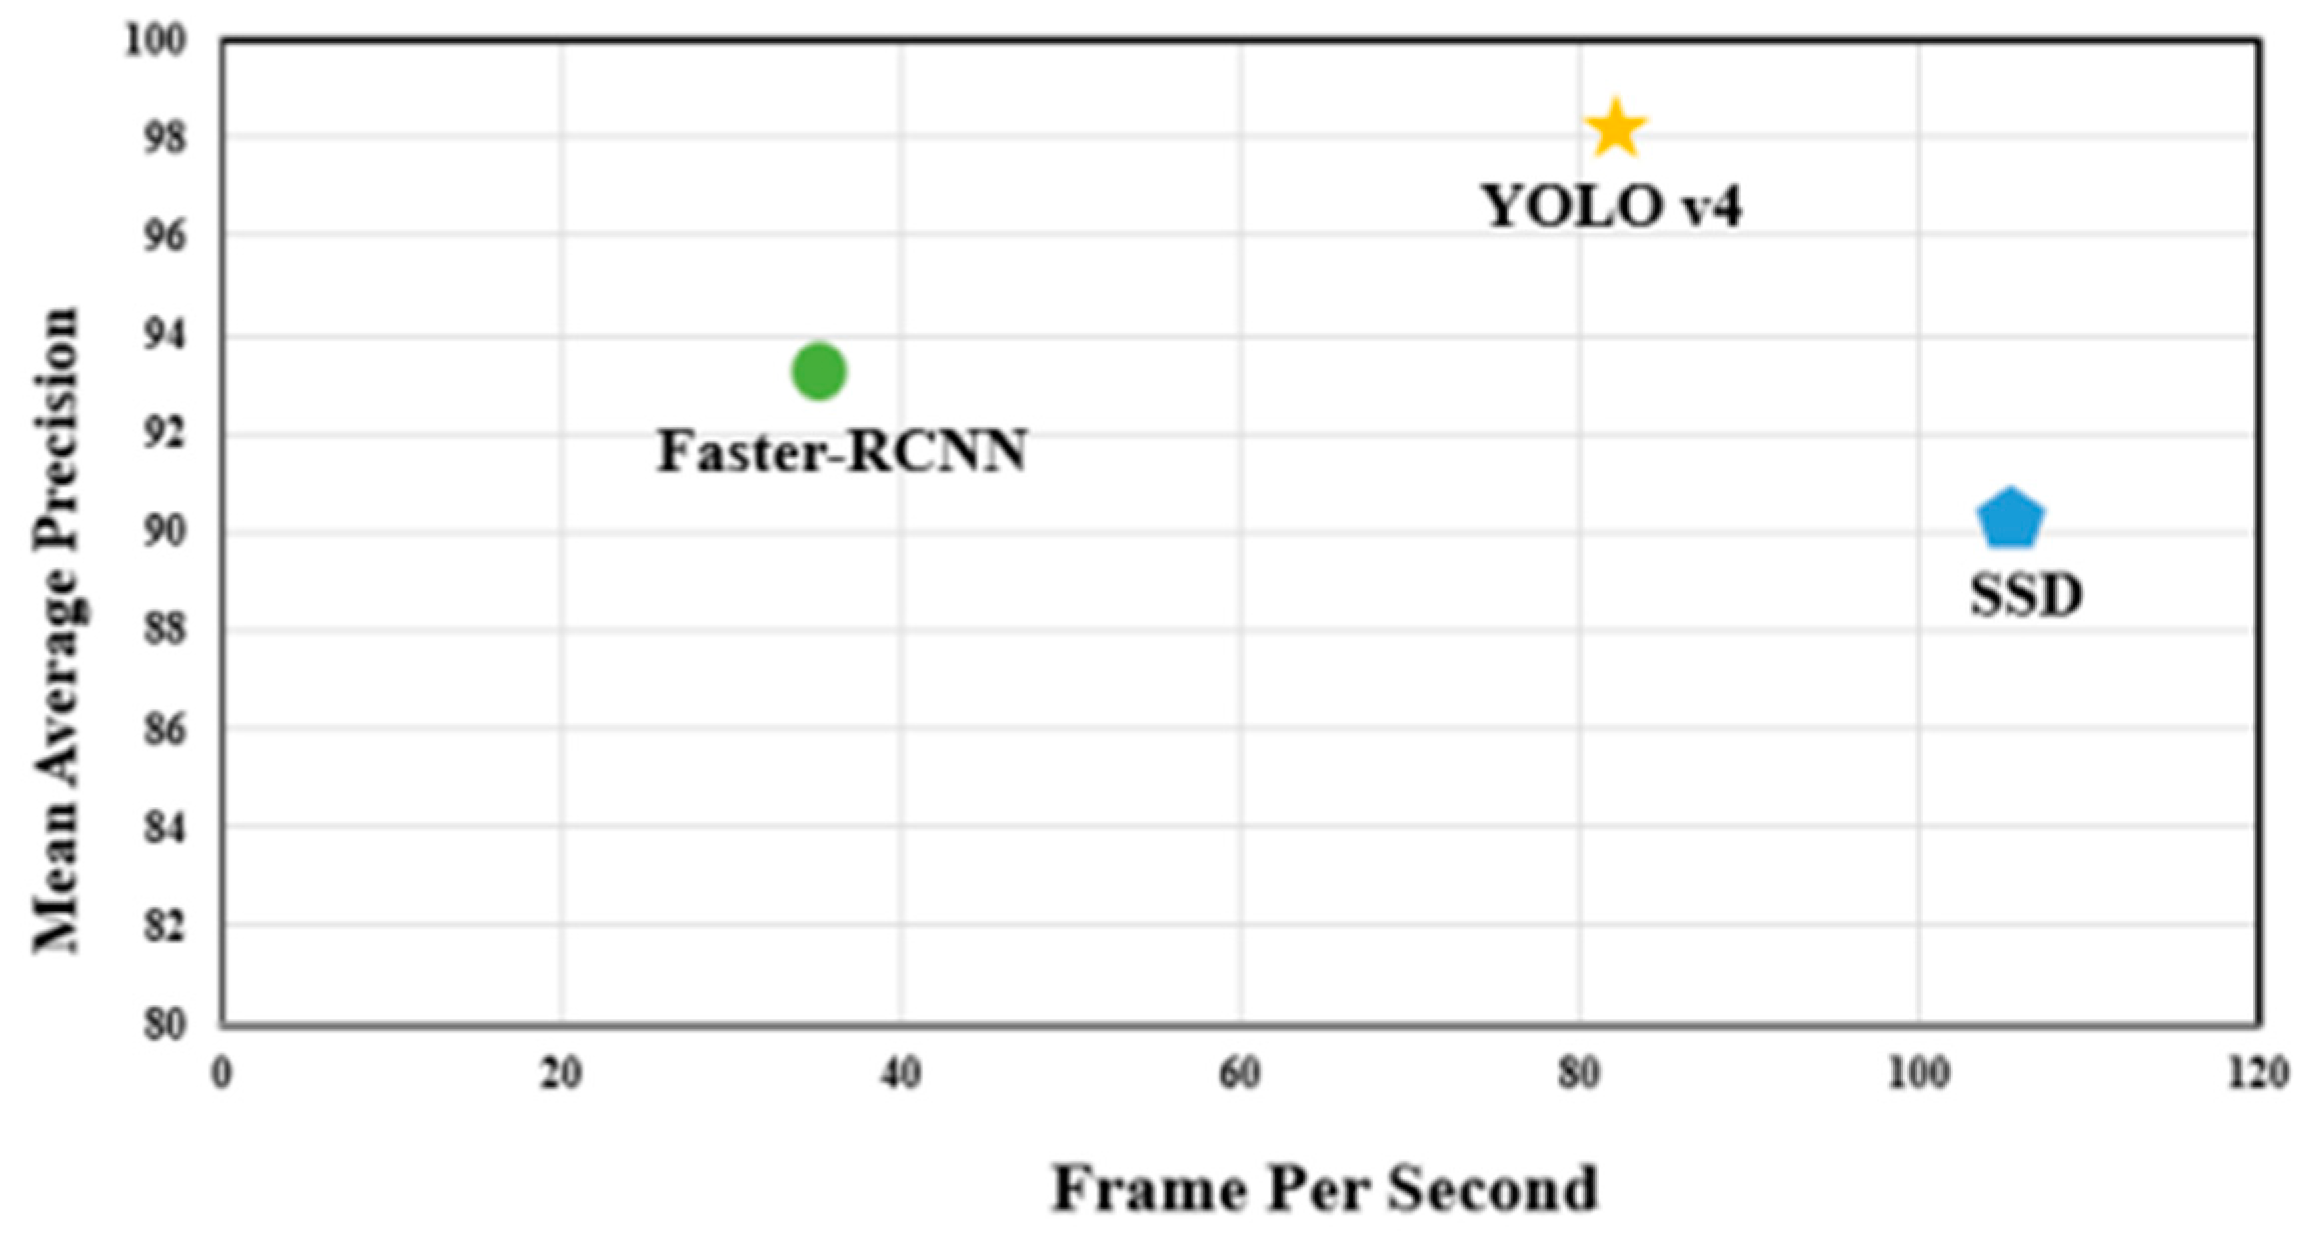
3.2.1. Yolo Meter Detection
3.2.2. Yolo Implementation
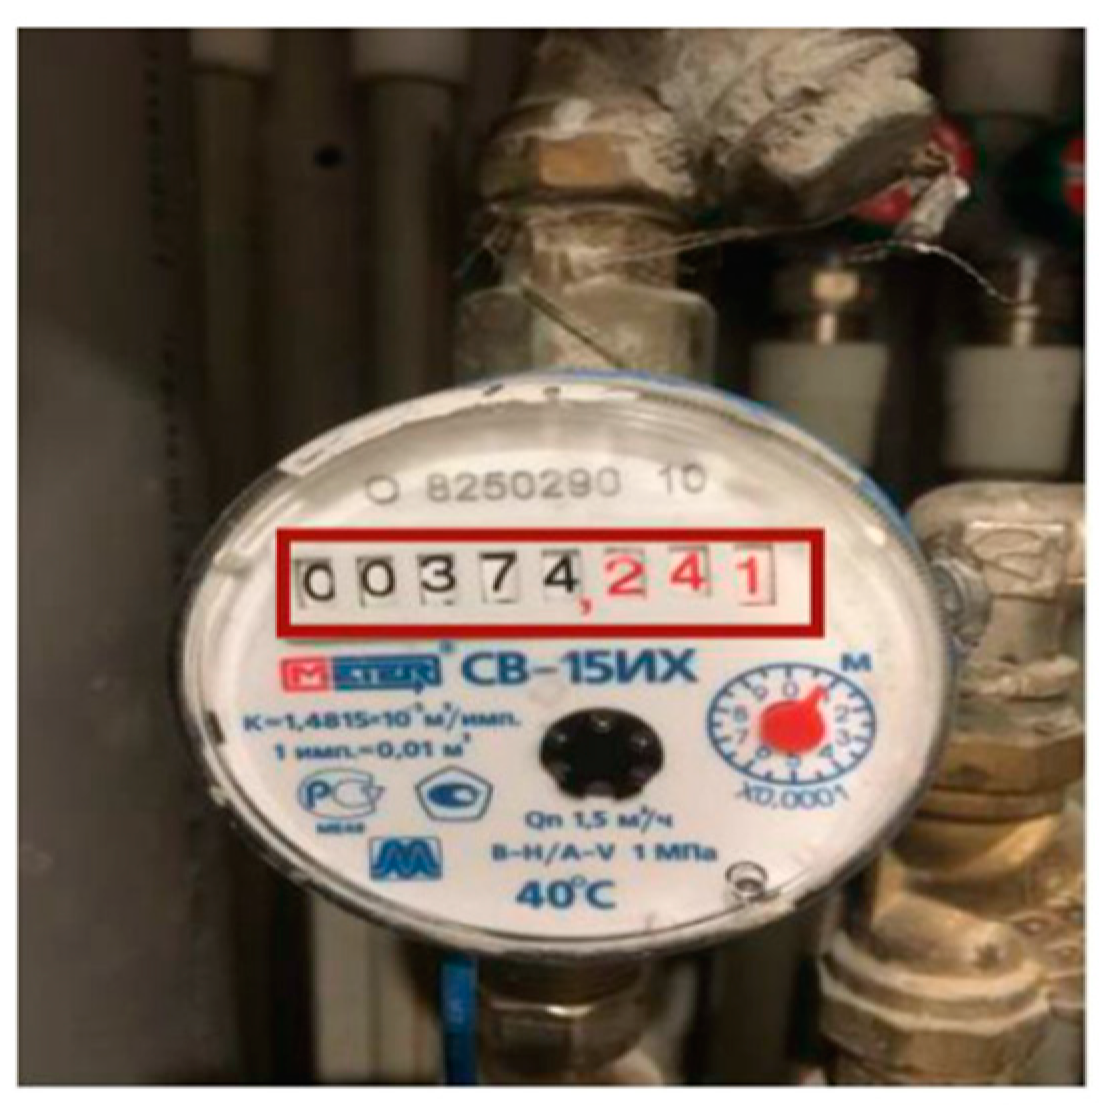
3.3. Number Meter Extraction
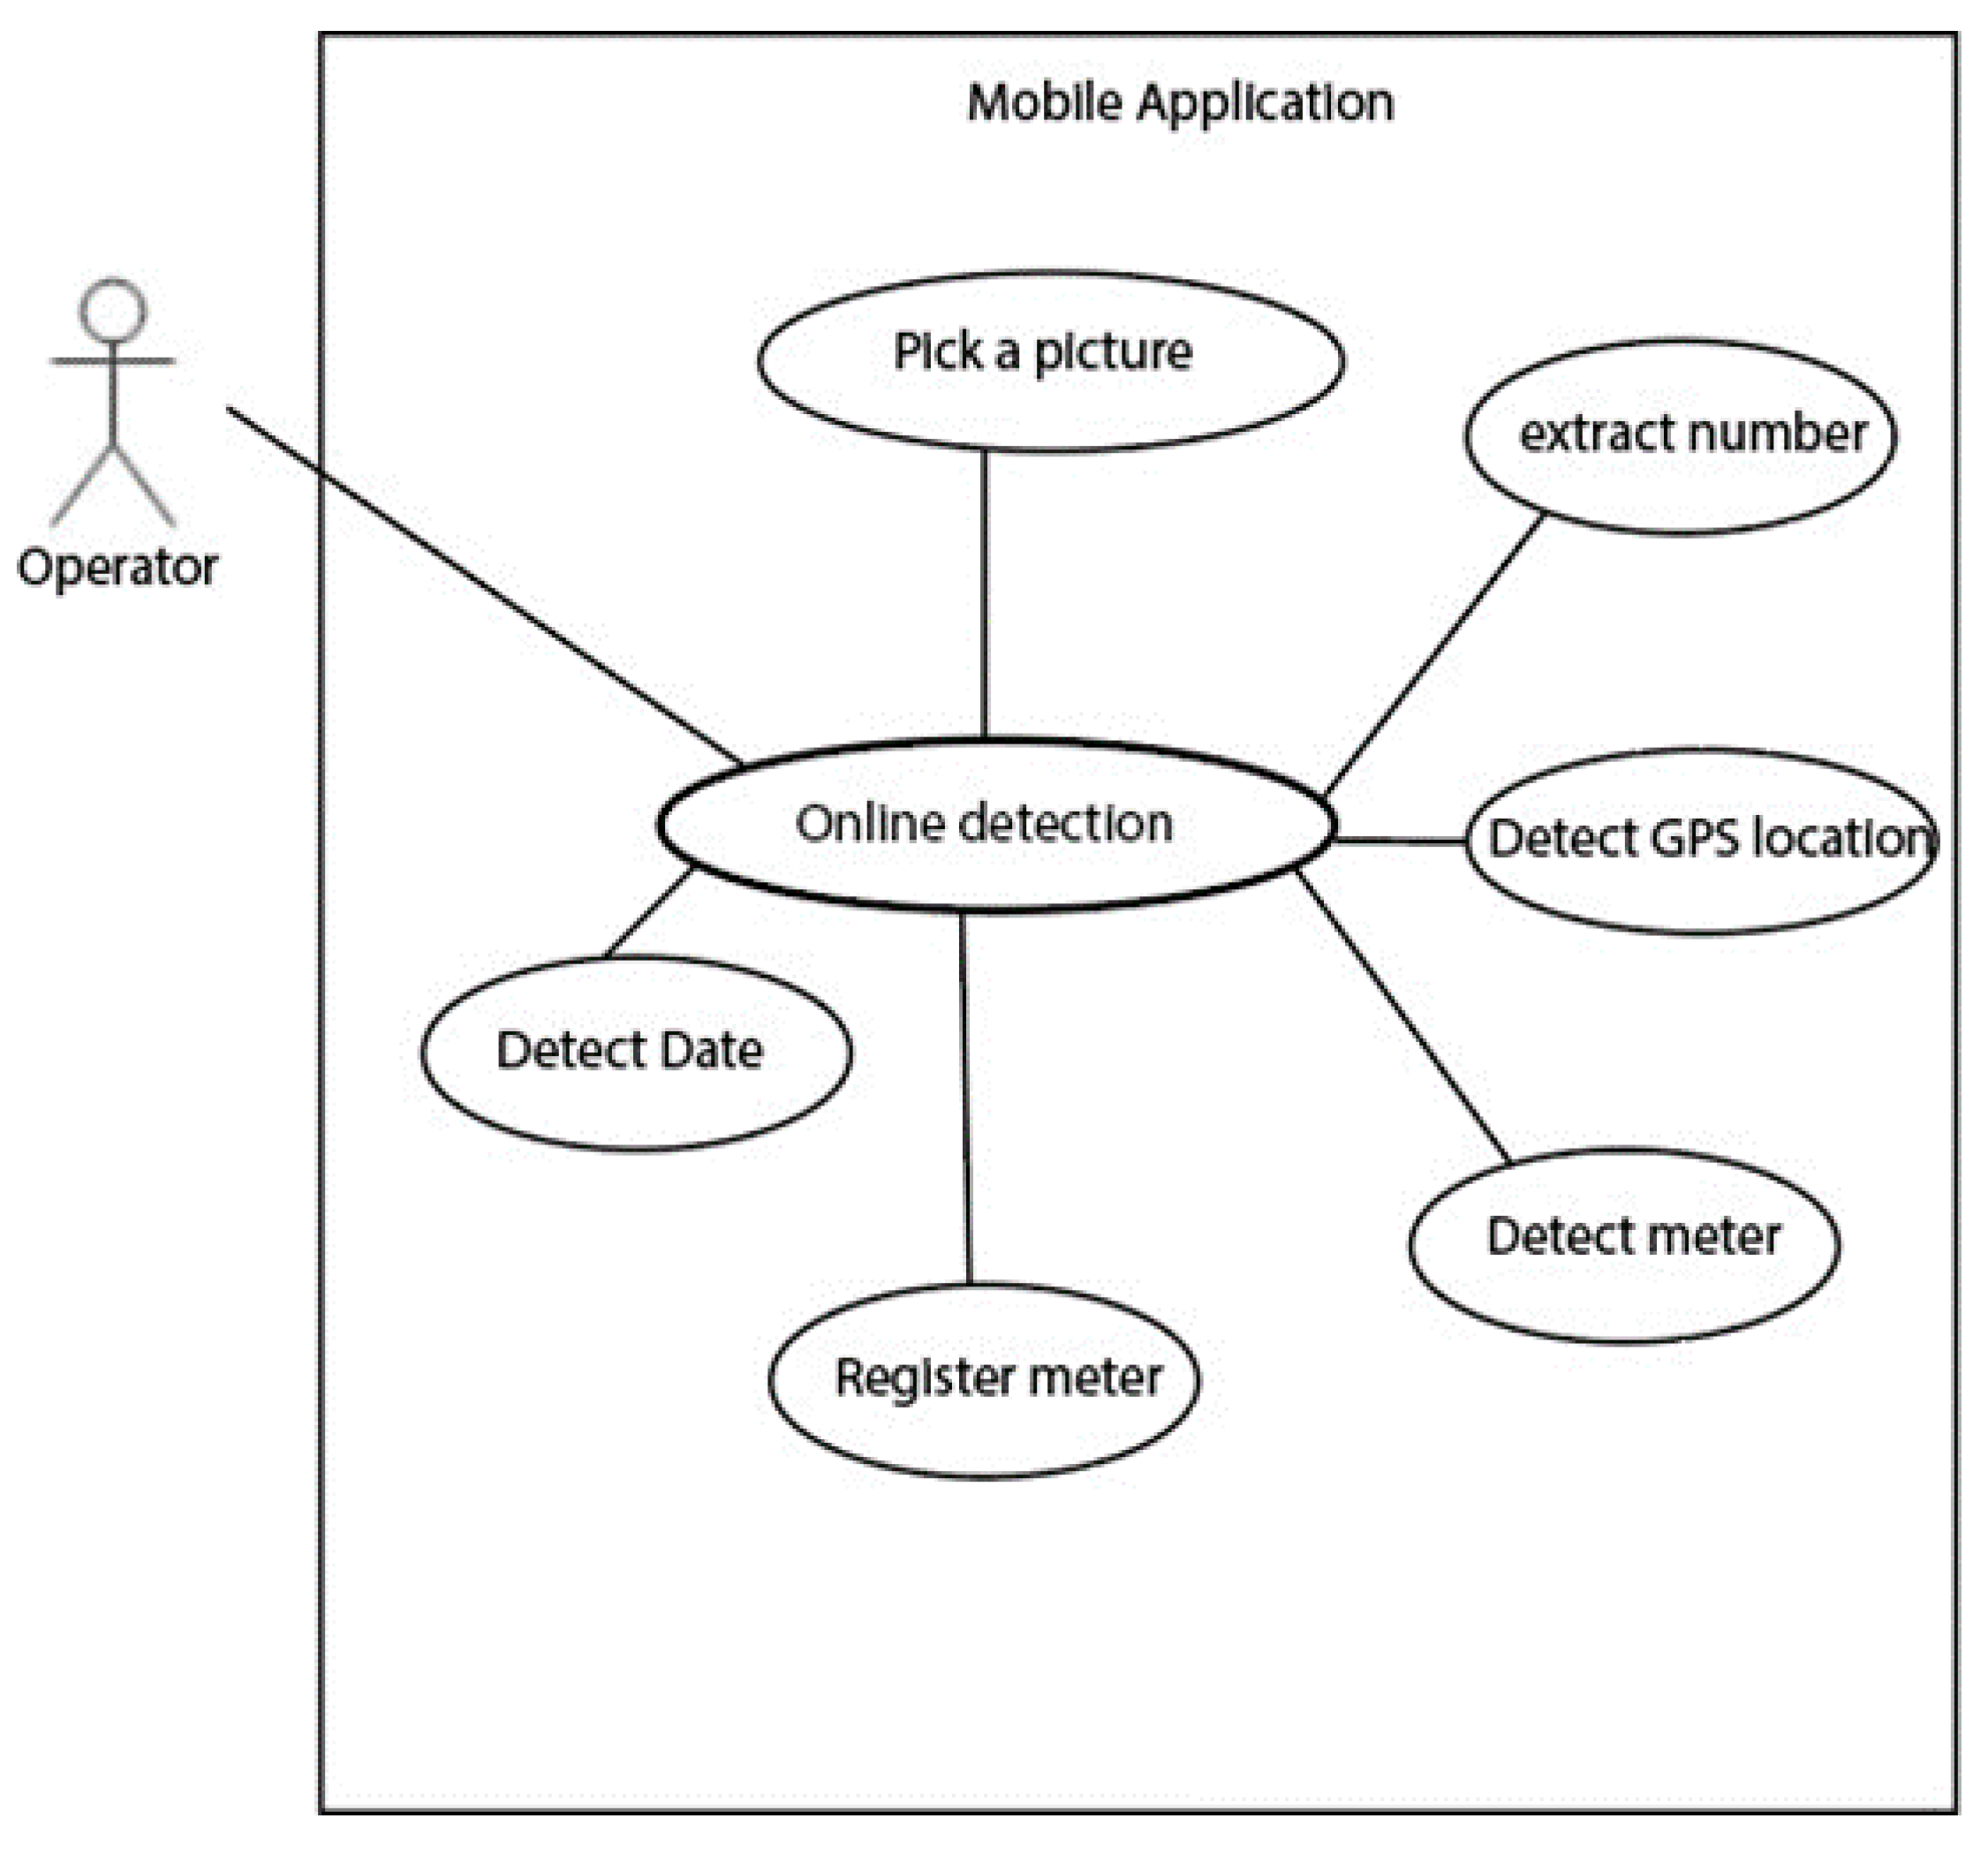
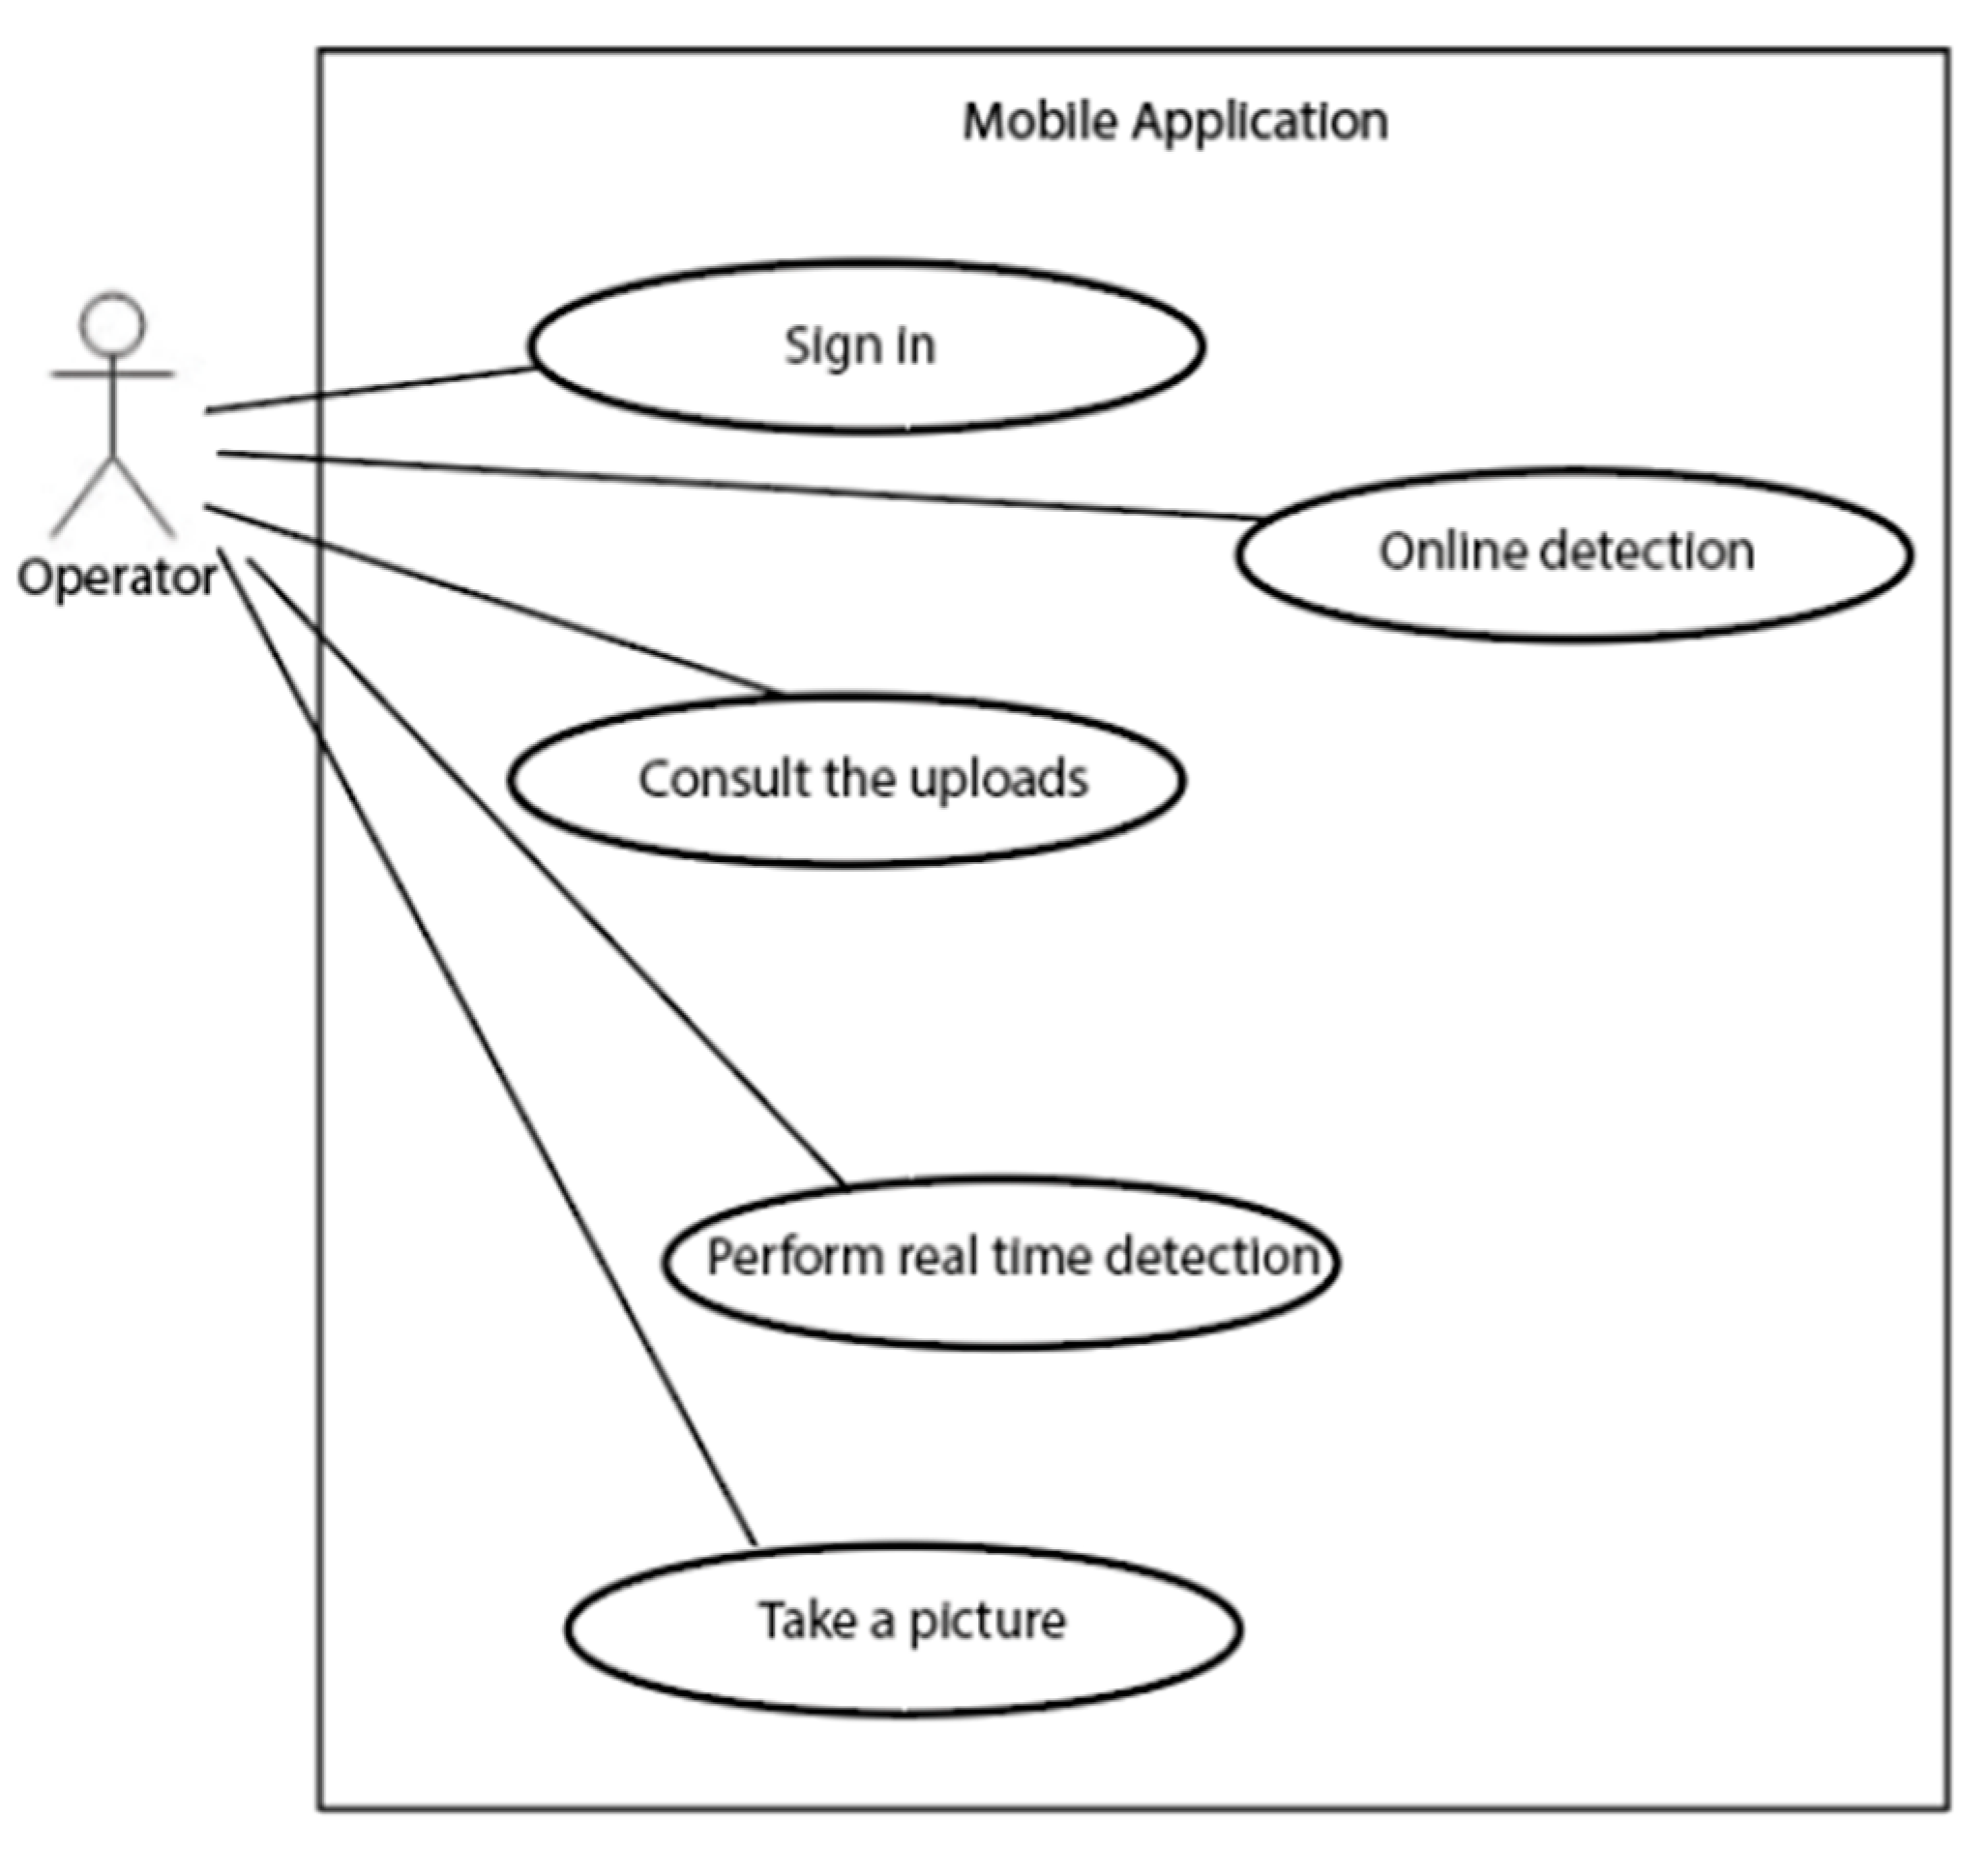
3.4. Mobile Application
4. Obtained Results
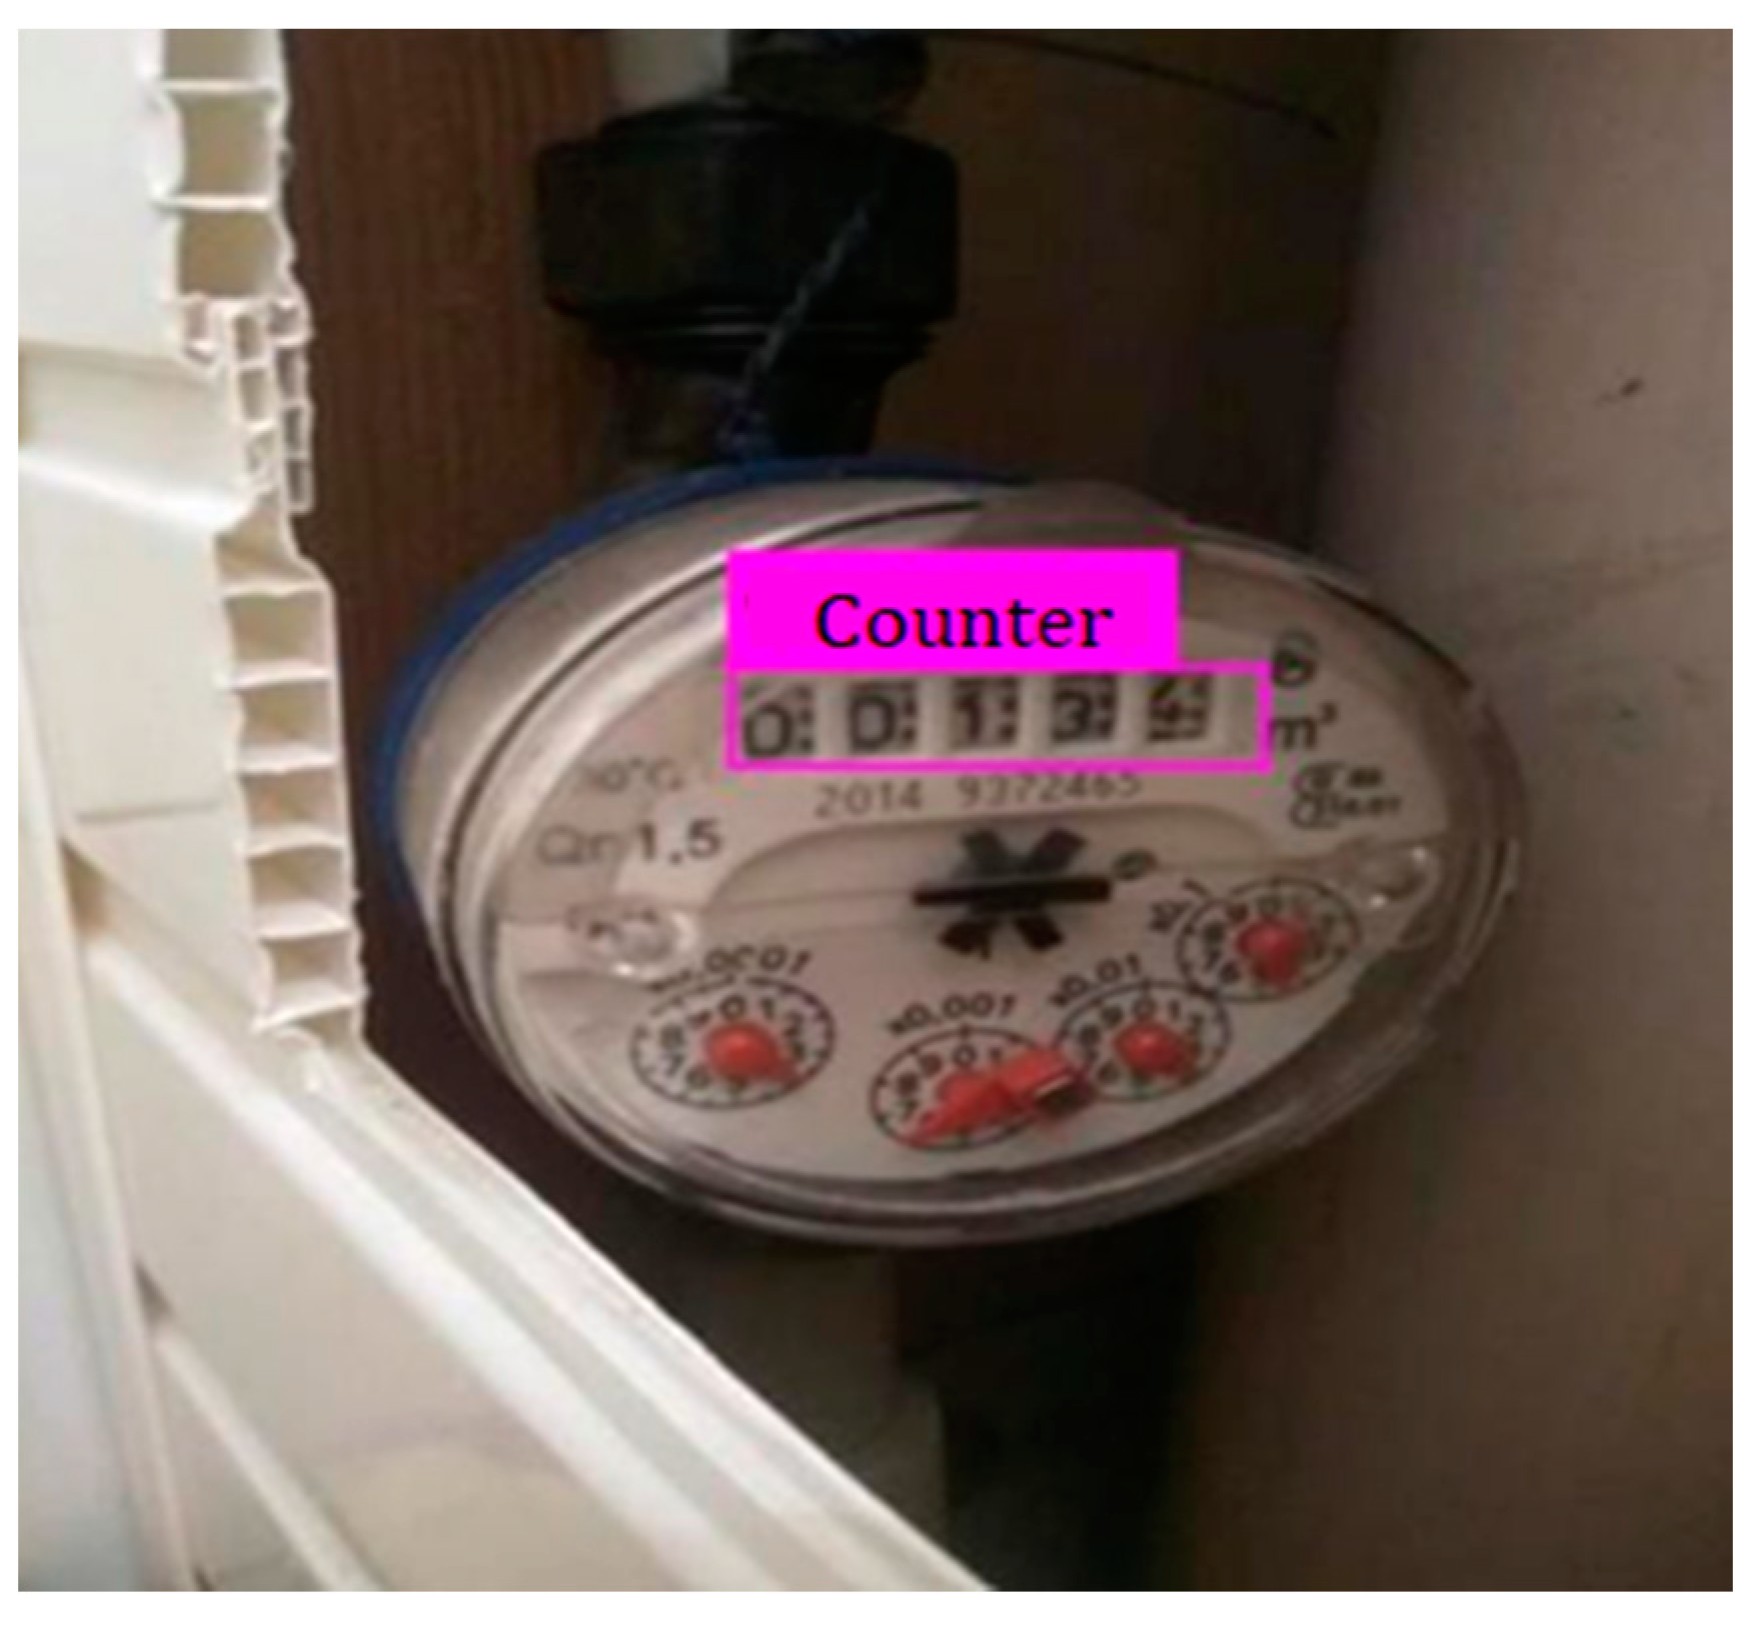
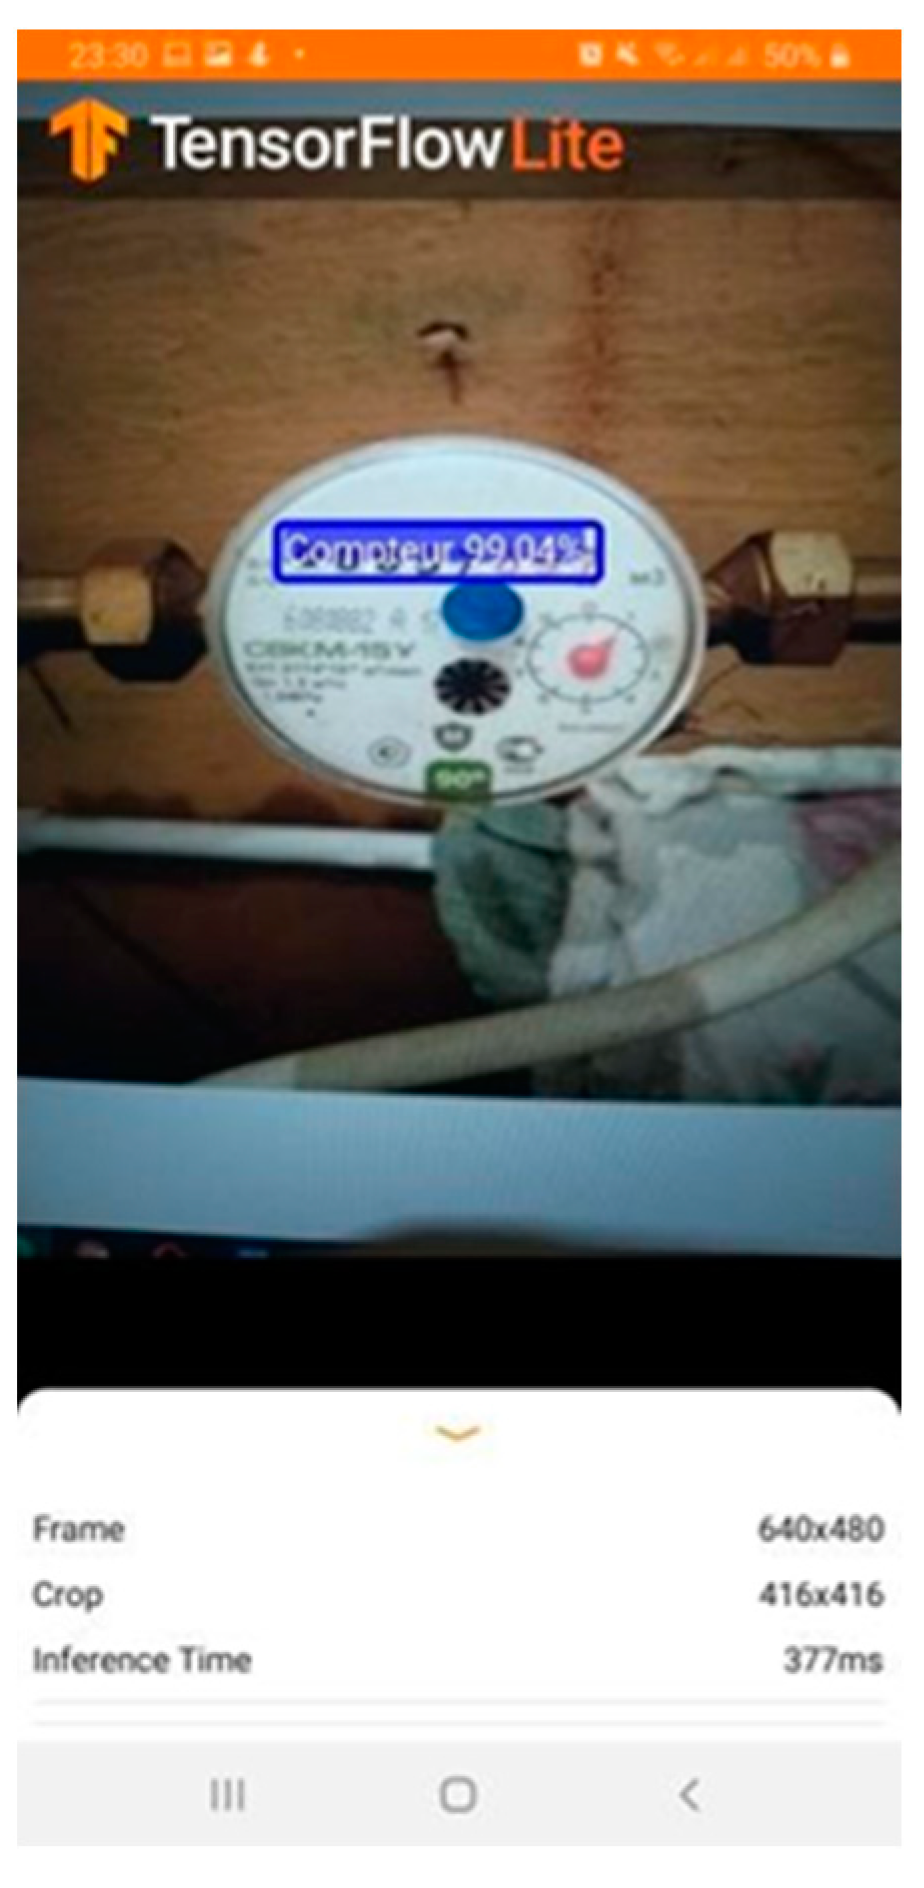
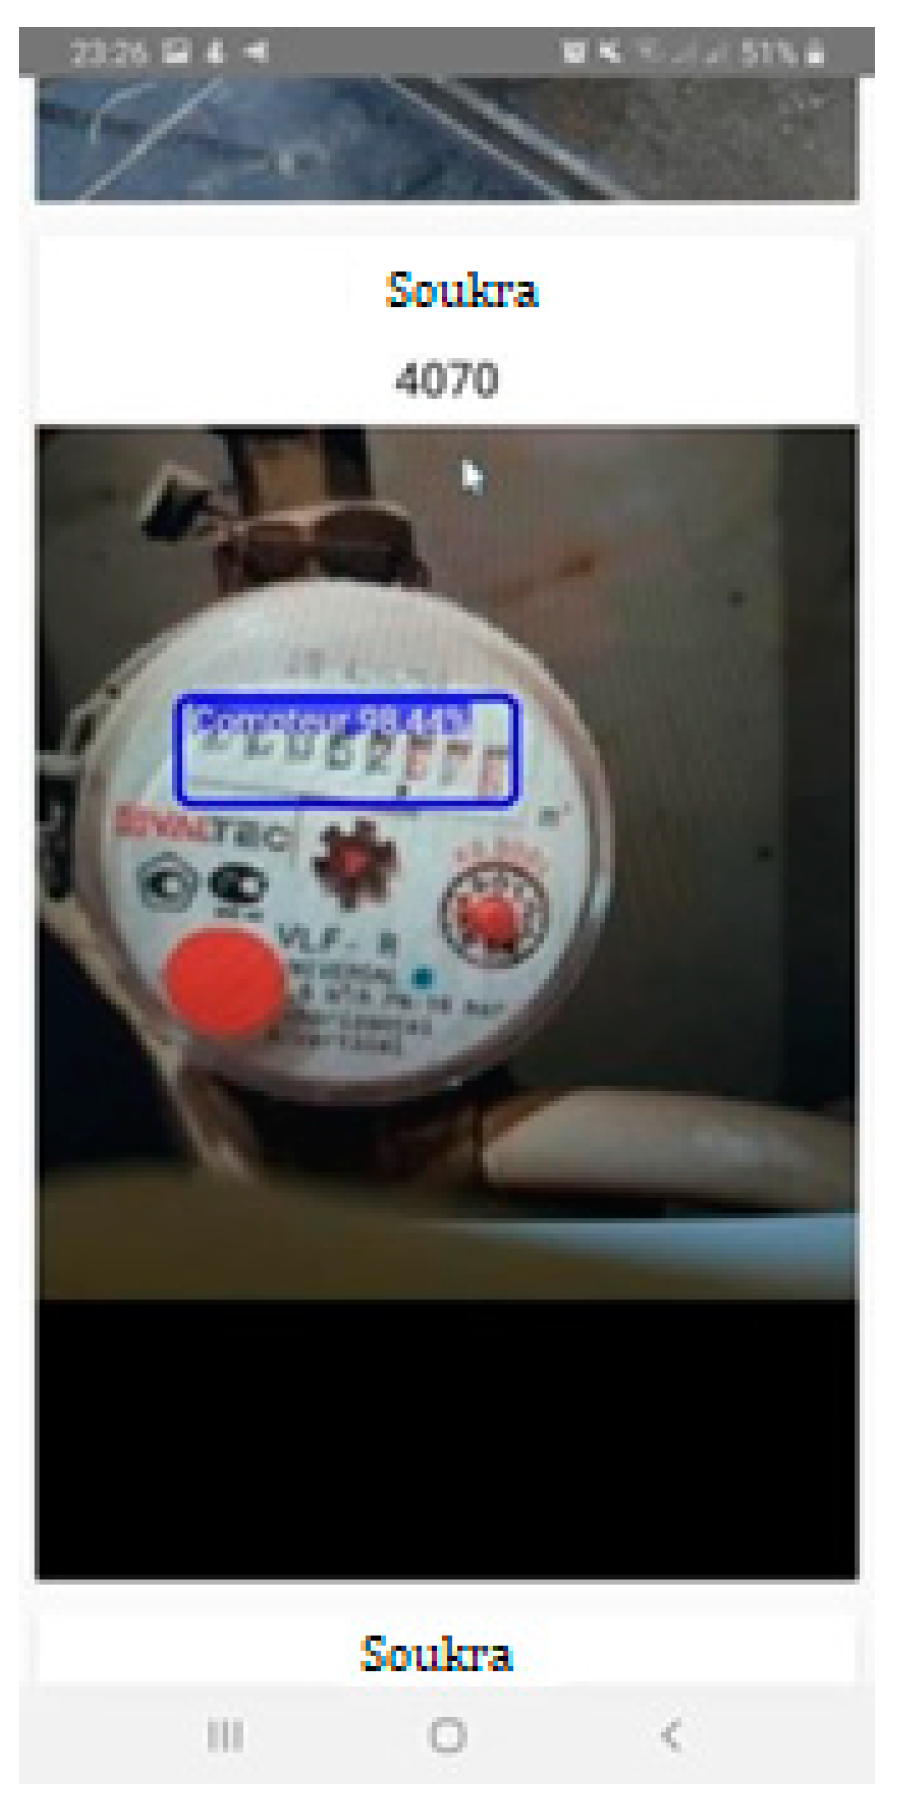
4.1. Counter Detection
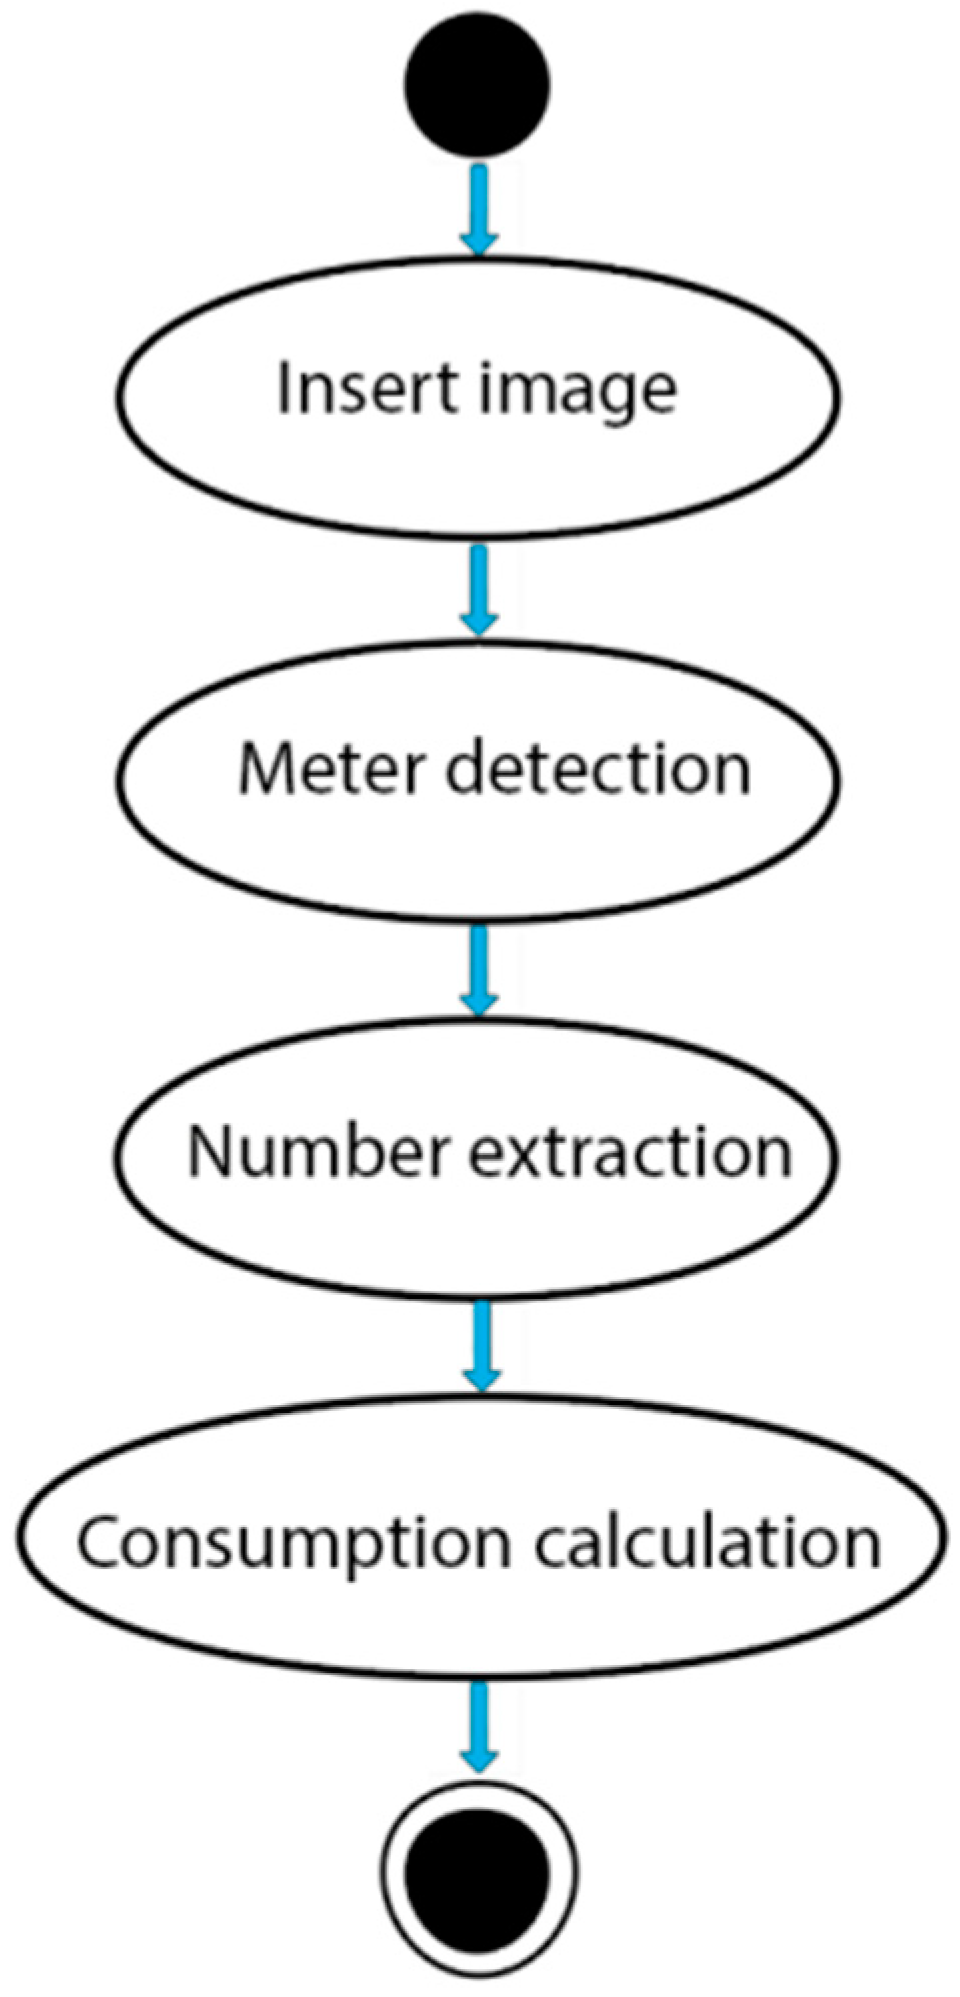
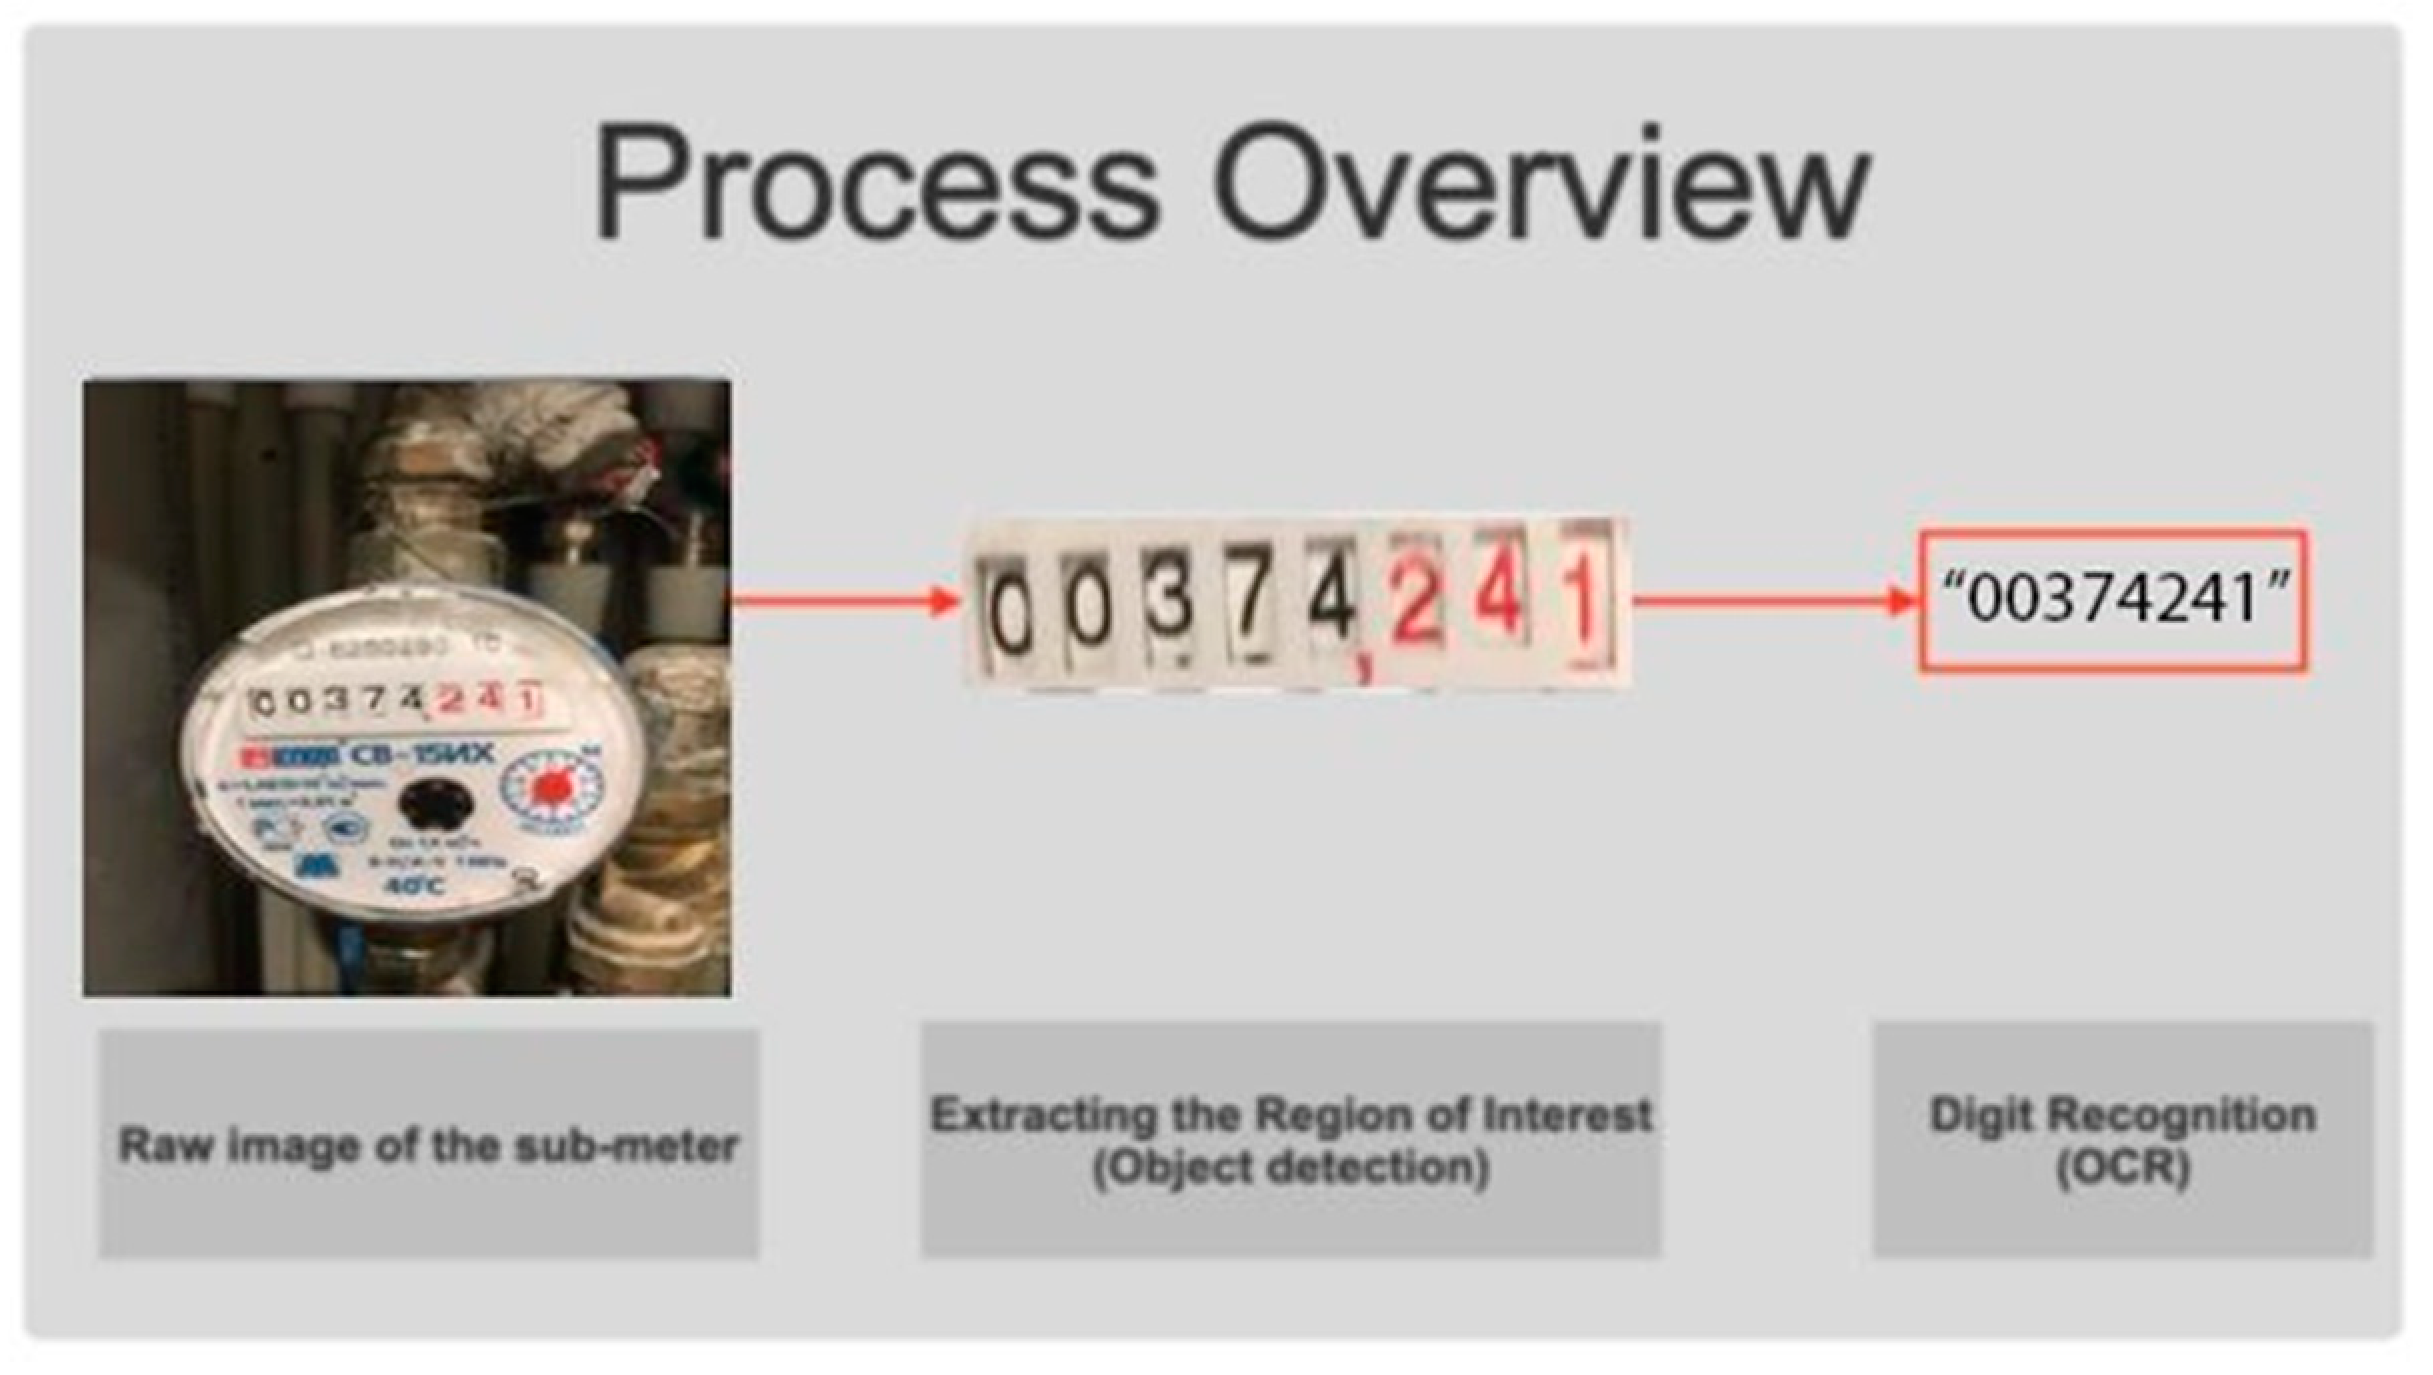
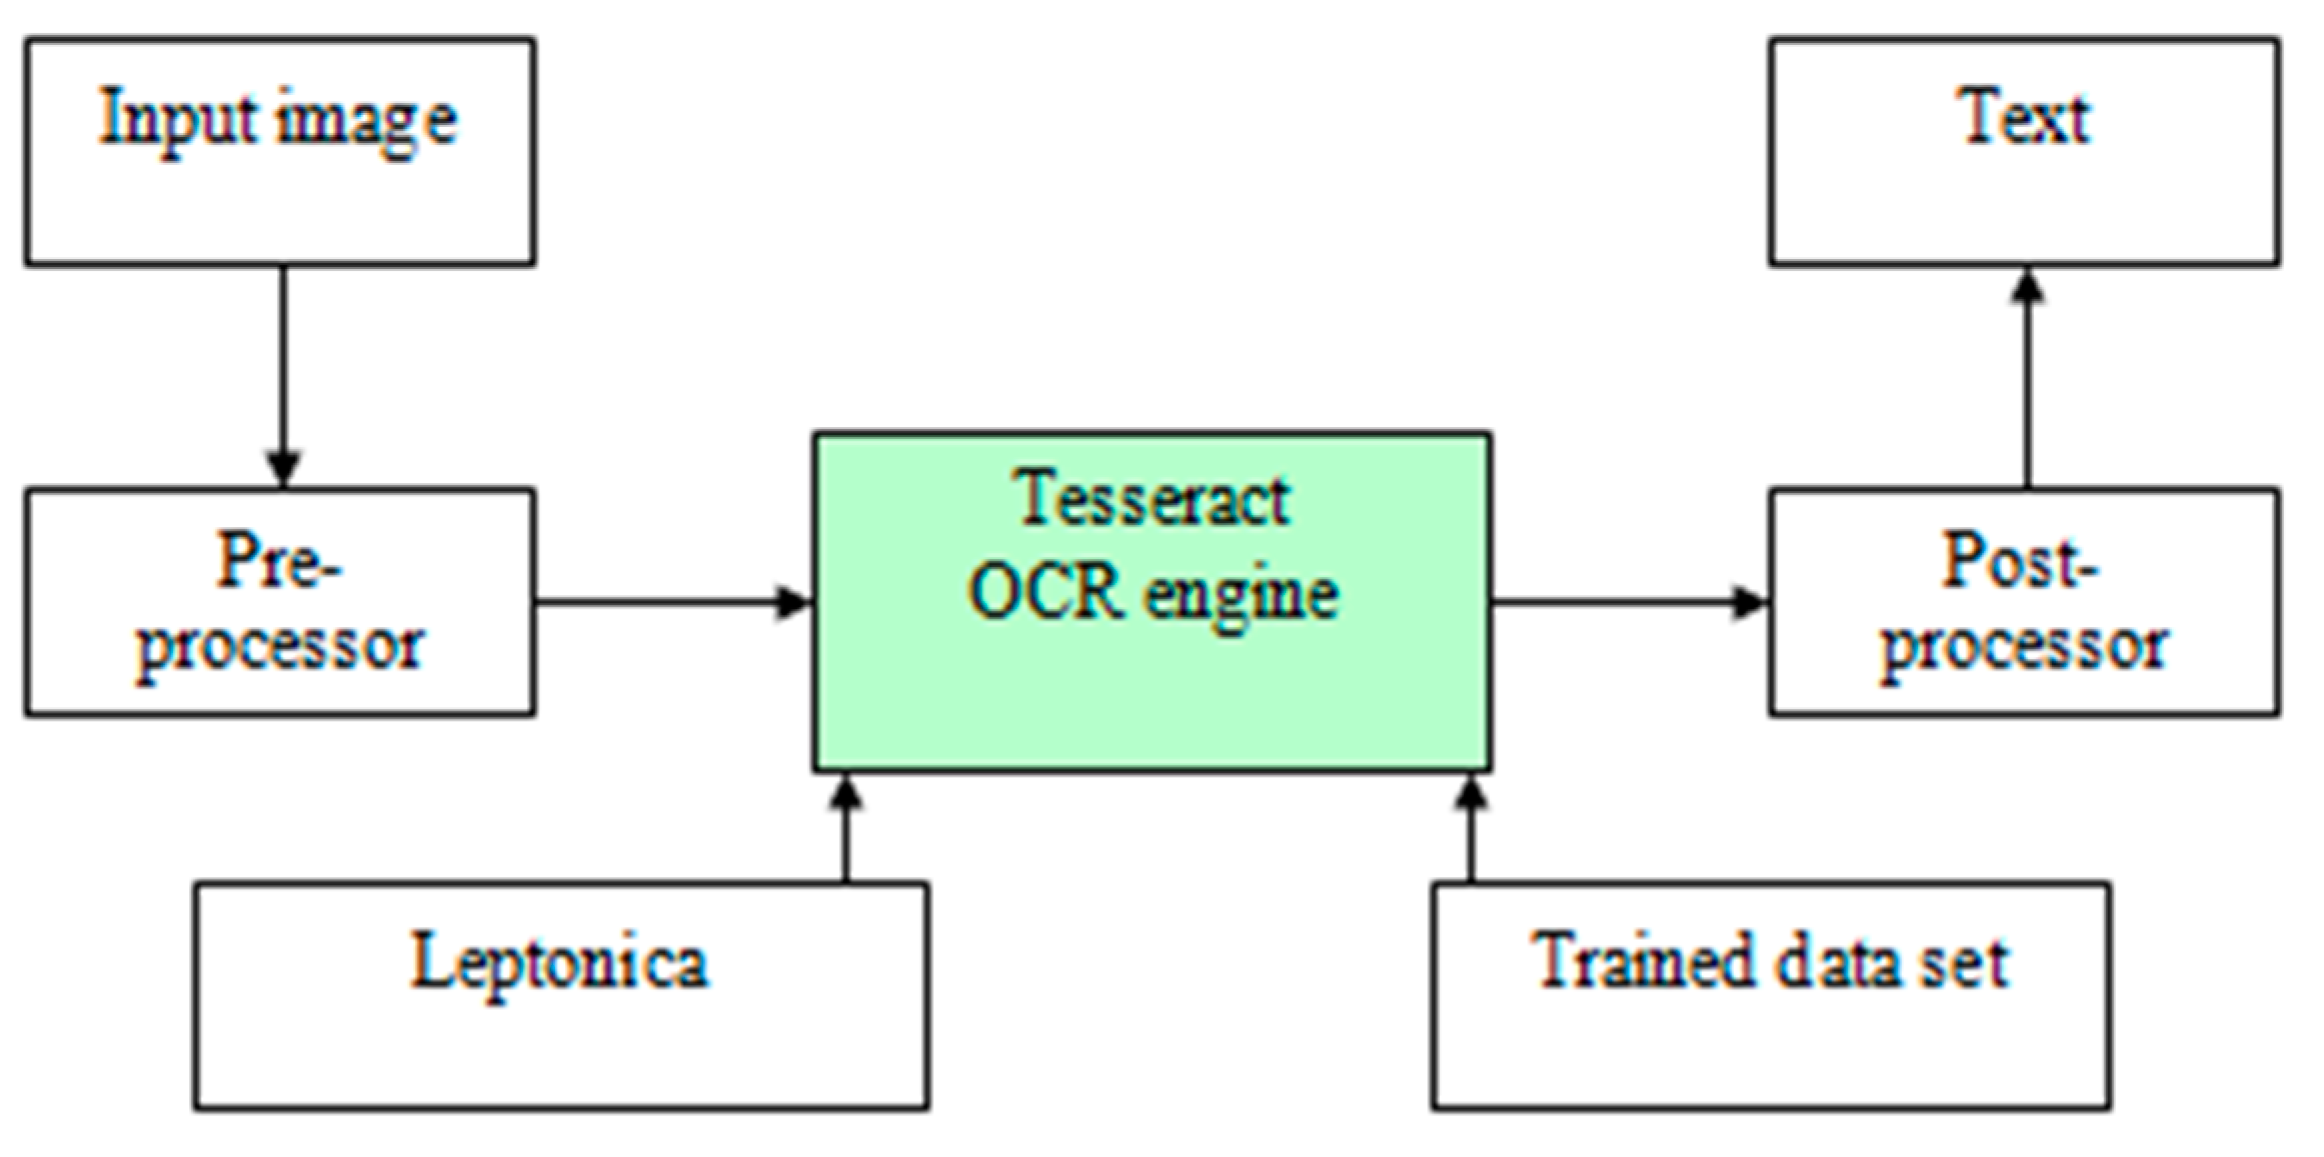
4.2. Overview Process
- Detect the requested area from the image: water meter counter;
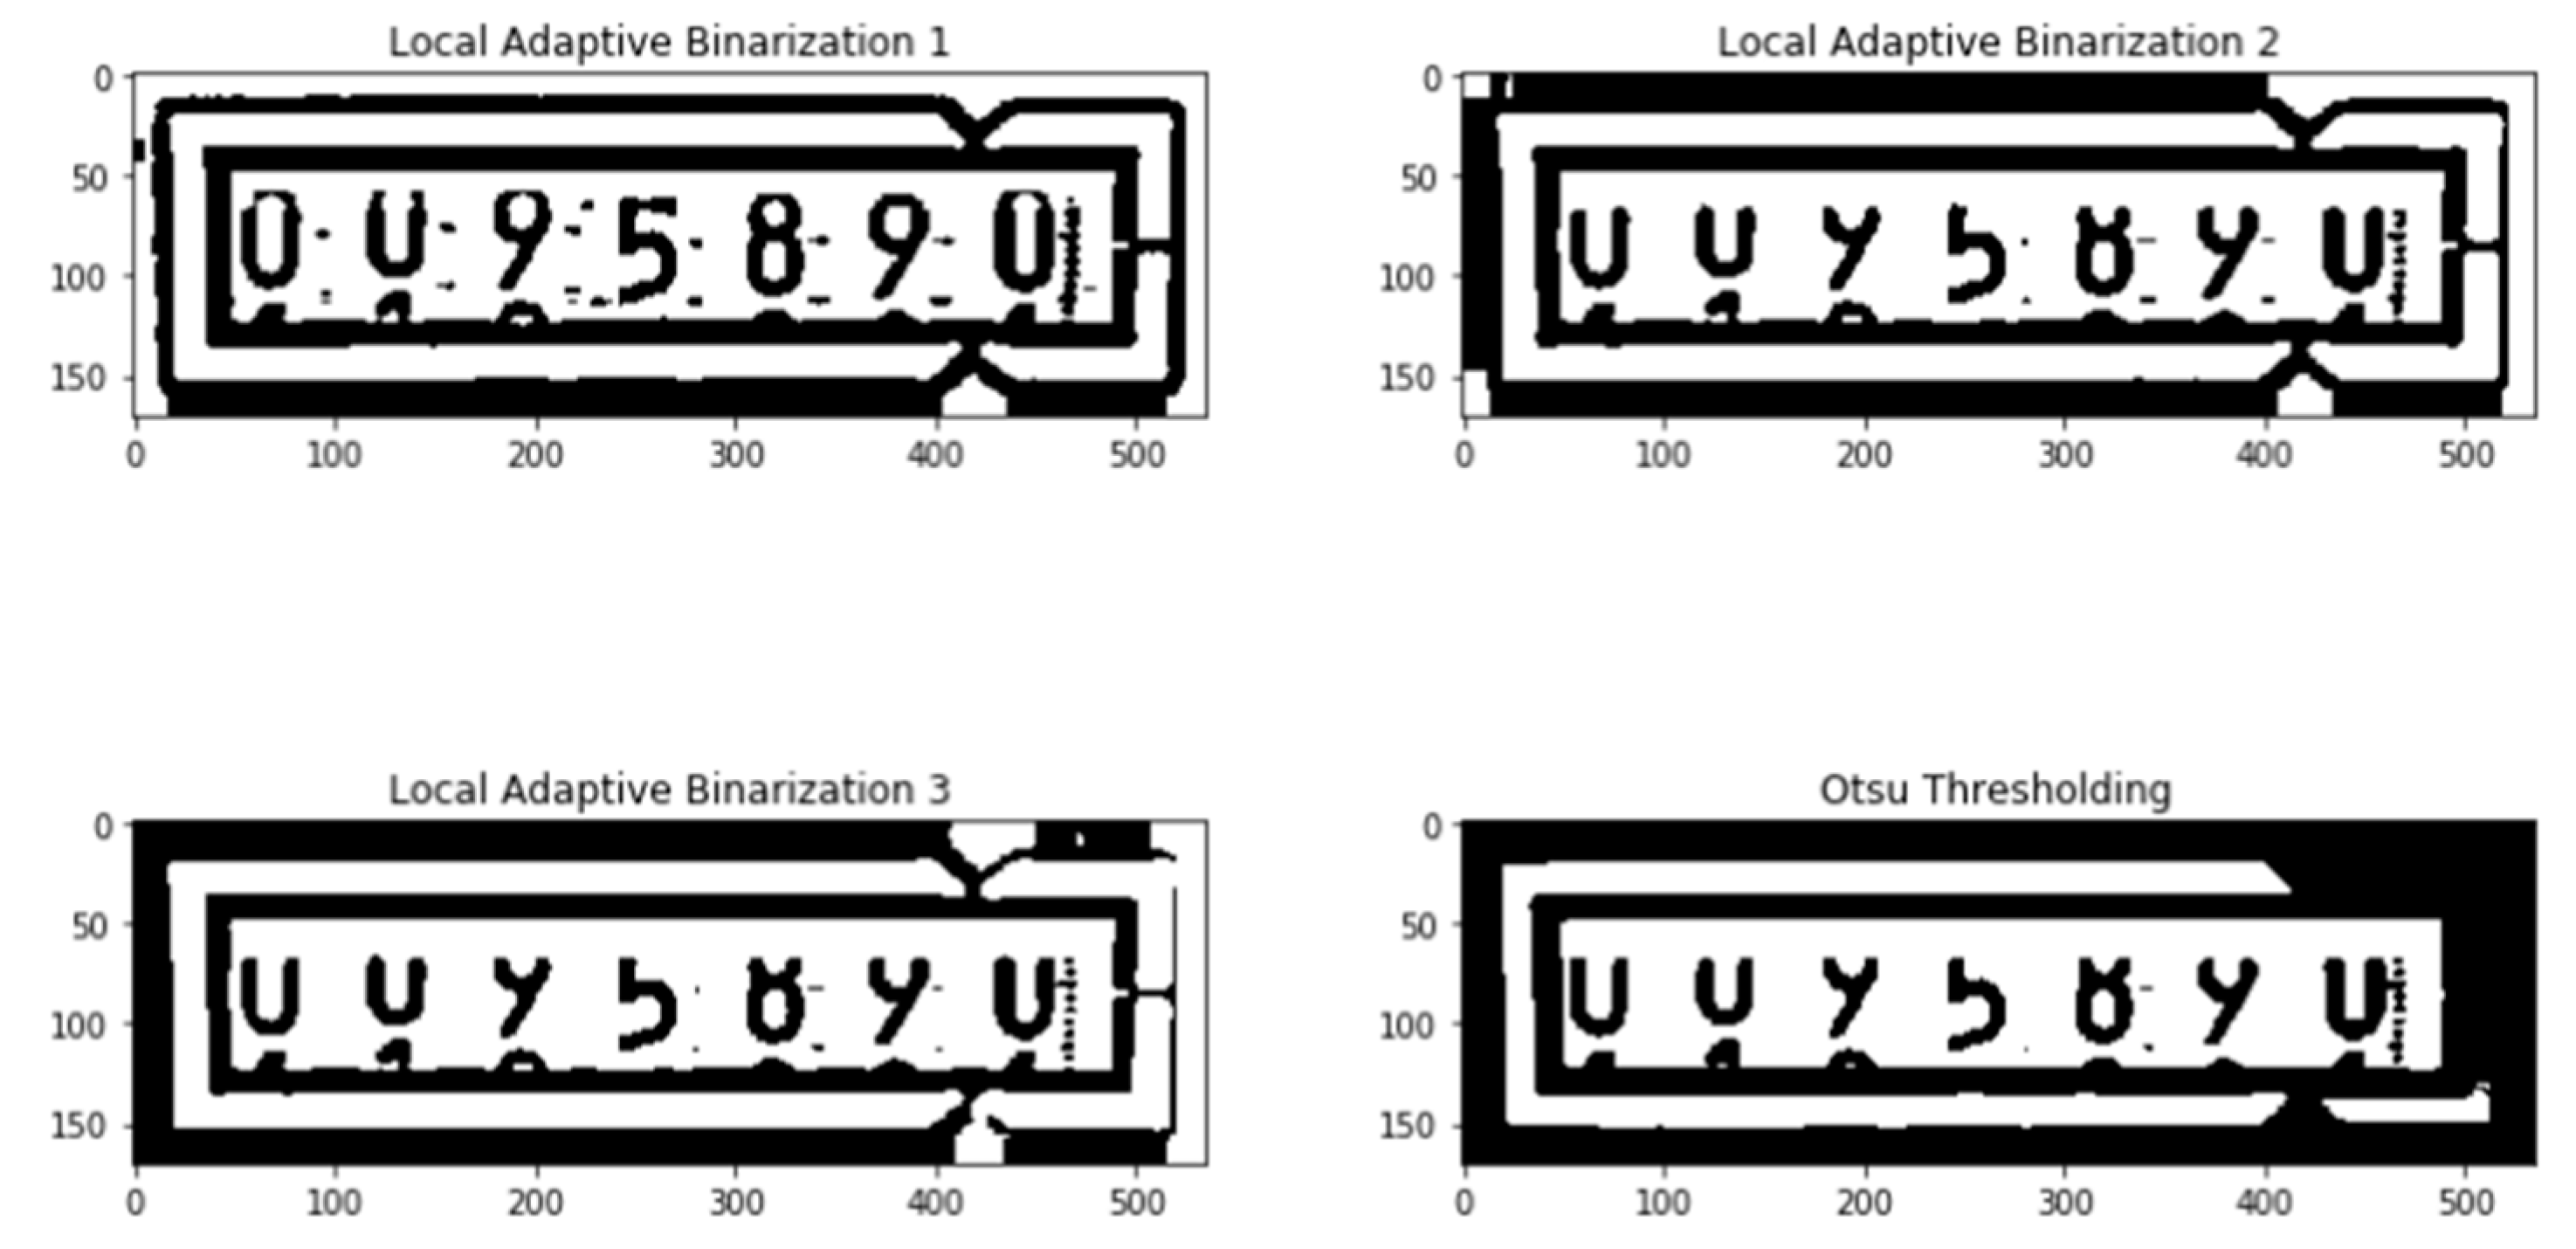
- Perform an image processing on the images;
- Pass the images to Tesseract;
- Store the results of Tesseract in the desired format.
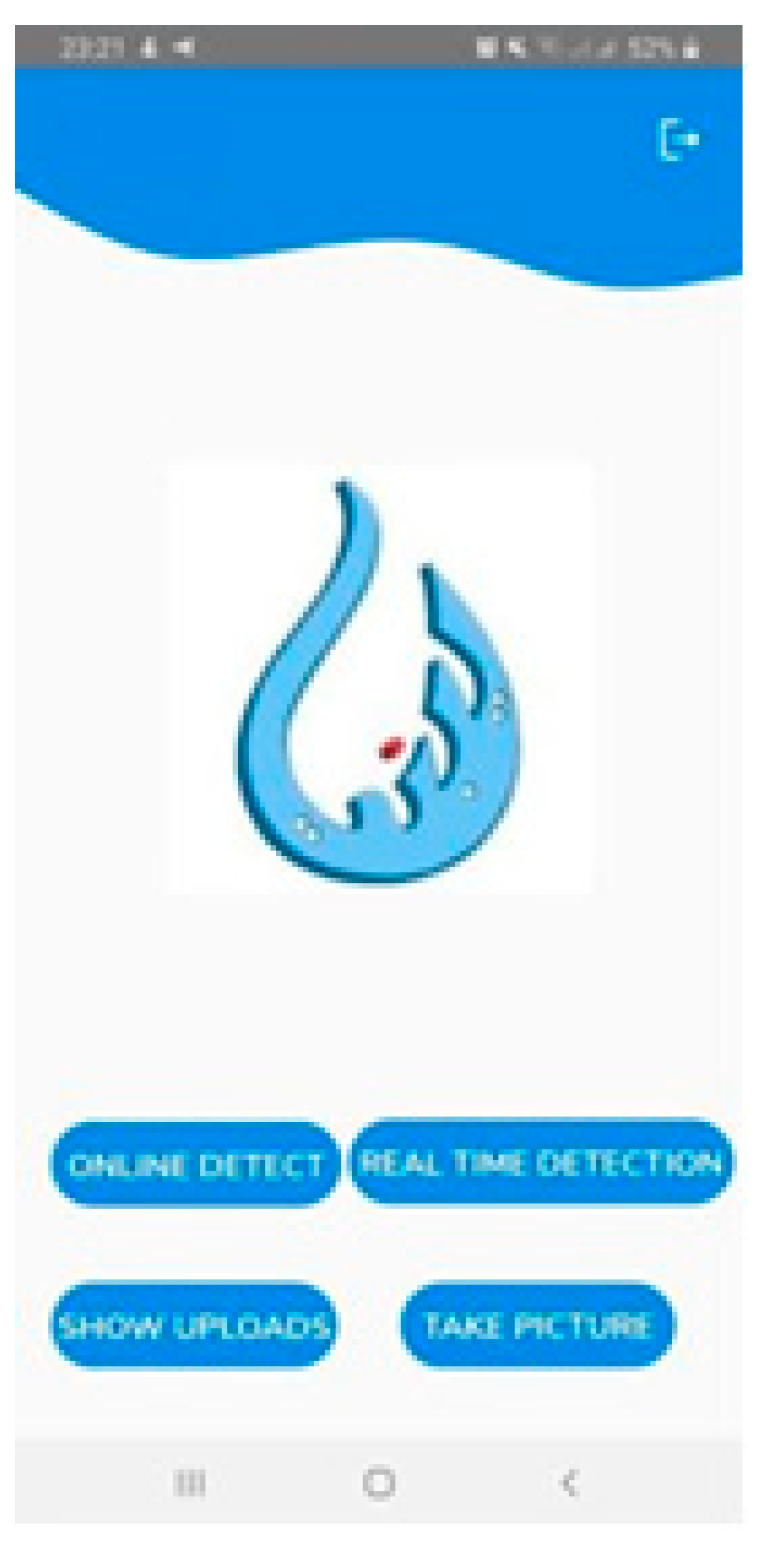
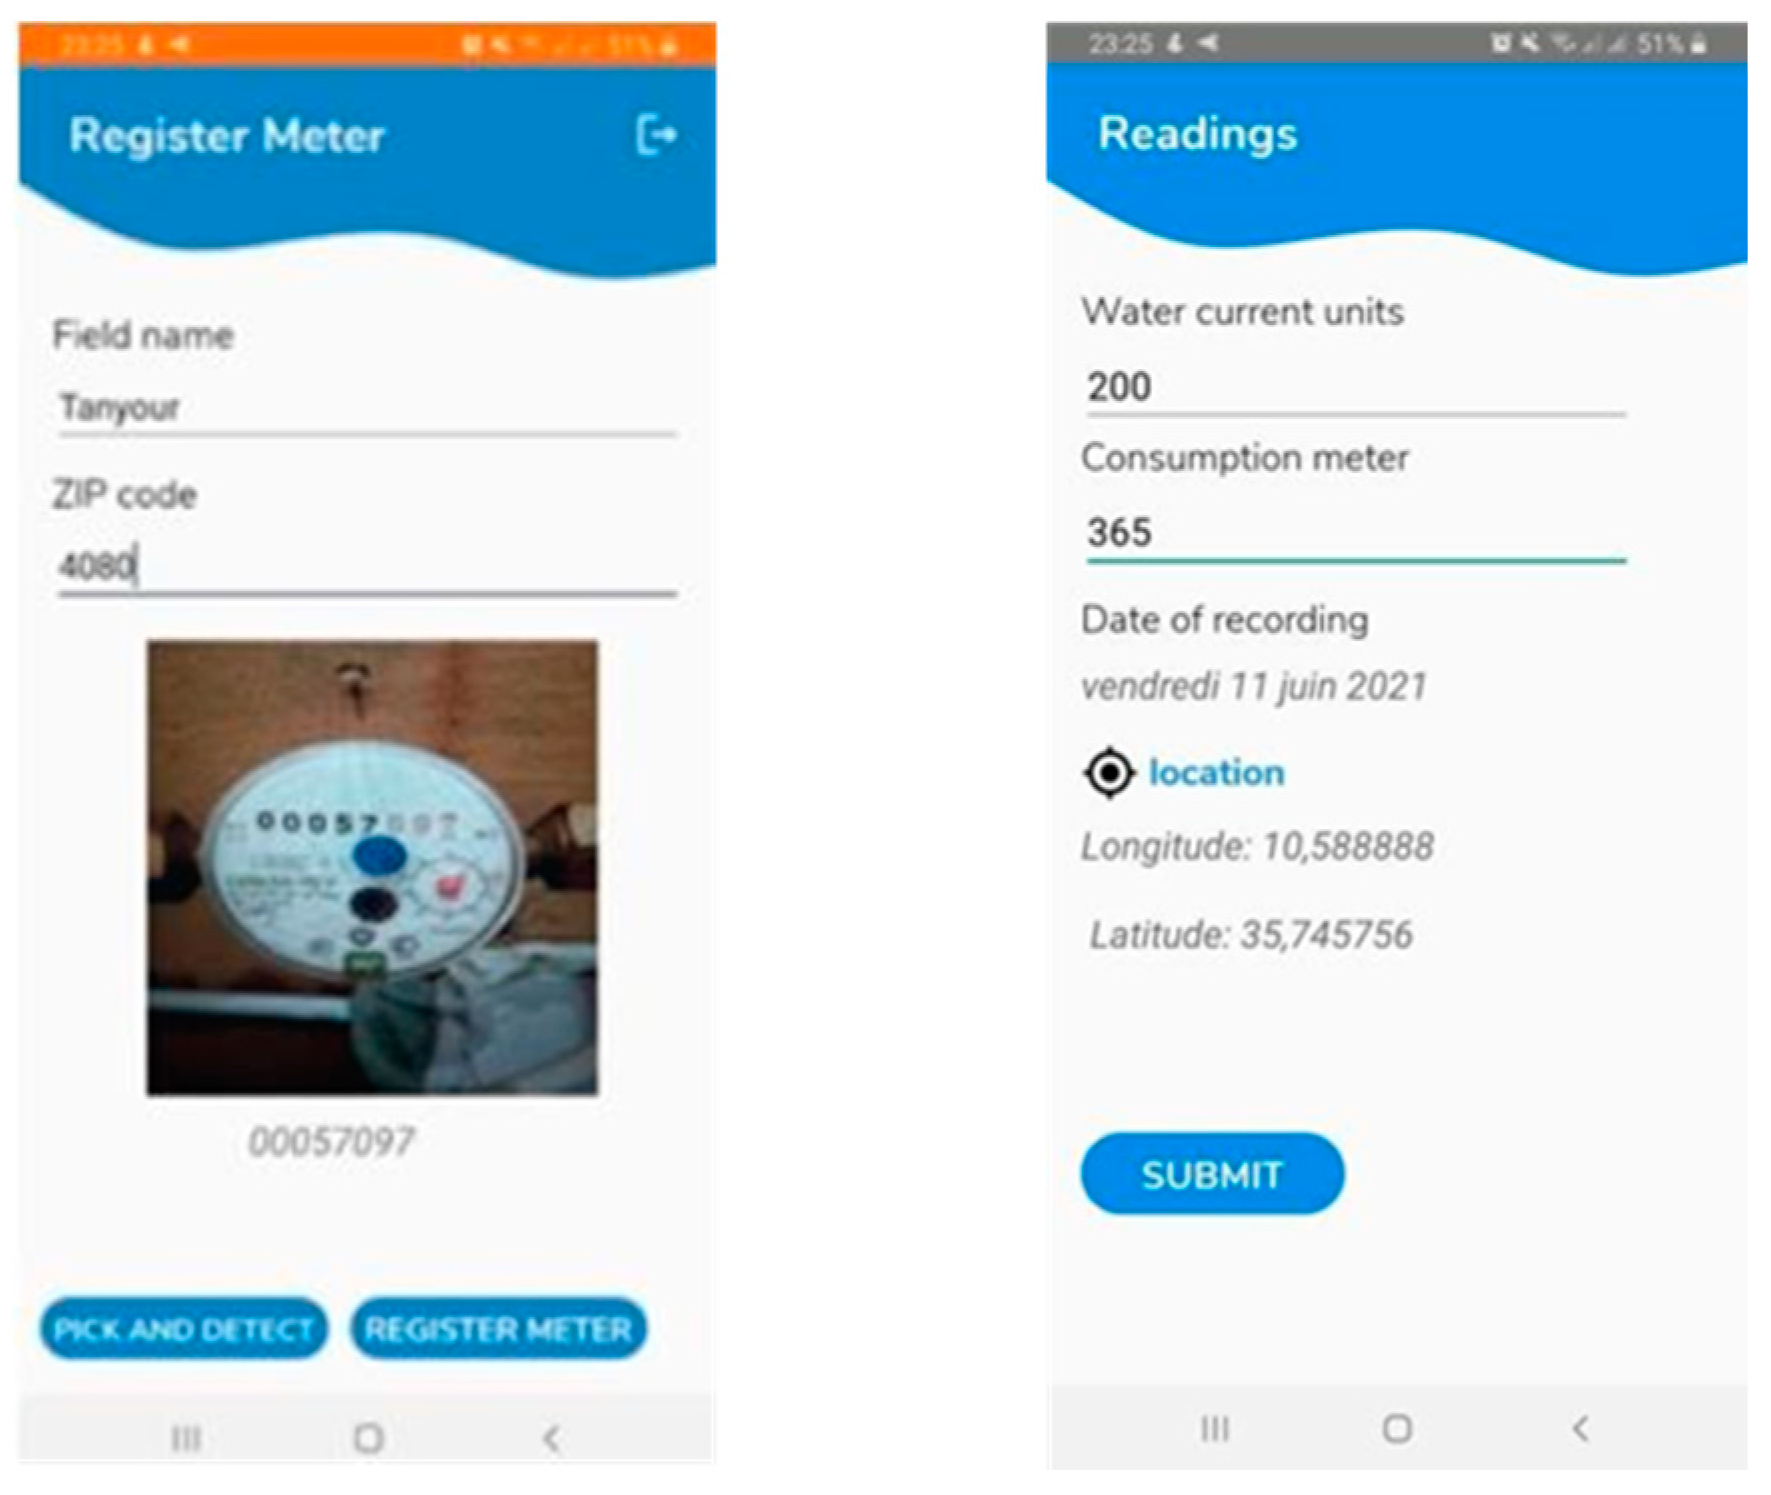
4.3. Application Realization
- If the user is not authenticated, he will be directed to the Sign in interface.
- If not, he will be directed to the Home interface.
- If the information is validated, the user will be redirected to the main interface of the application, which is the Home interface.
- If not, an error message will be displayed.
5. Discussion
6. Conclusions
Author Contributions
Funding
Data Availability Statement
Acknowledgments
Conflicts of Interest
References
- Balouch, S.; Abrar, M.; Abdul Muqeet, H.; Shahzad, M.; Jamil, H.; Hamdi, M.; Malik, A.S.; Hamam, H. Optimal Scheduling of Demand Side Load Management of Smart Grid Considering Energy Efficiiency. Energy Res. 2022, 18, 861571. [Google Scholar] [CrossRef]
- Masood, B.; Guobing, S.; Nebhen, J.; Rehman, A.U.; Iqbal, M.N.; Rasheed, I.; Bajaj, M.; Shafiq, M.; Hamam, H. Investigation and Field Measurements for Demand Side Management Control Technique of Smart Air Conditioners located at Residential, Commercial, and Industrial Sites. Energies 2022, 15, 2482. [Google Scholar] [CrossRef]
- Asif, M.; Ali, I.; Ahmad, S.; Irshad, A.; Gardezi, A.A.; Alassery, F.; Hamam, H.; Shafiq, M. Industrial Automation Information Analogy for Smart Grid Security. CMC-Comput. Mater. Contin. 2022, 71, 3985–3999. [Google Scholar] [CrossRef]
- Boyes, H.; Hallaq, B.; Cunningham, J.; Watson, T. The industrial internet of things (IIoT): An analysis framework. Comput. Ind. 2018, 101, 1–12. [Google Scholar] [CrossRef]
- França, R.P.; Monteiro, A.C.B.; Arthur, R.; Iano, Y. An Overview of the Internet of Medical Things and Its Modern Perspective. In Efficient Data Handling for Massive Internet of Medical Things. Internet of Things (Technology, Communications and Computing); Chakraborty, C., Ghosh, U., Ravi, V., Shelke, Y., Eds.; Springer: Cham, Switzerland, 2021. [Google Scholar] [CrossRef]
- Frikha, T.; Chaari, A.; Chaabane, F.; Cheikhrouhou, O.; Zaguia, A. Healthcare and Fitness Data Management Using the IoT-Based Blockchain Platform. J. Healthc. Eng. 2021, 2021, 9978863. [Google Scholar] [CrossRef]
- Frikha, T.; Chaabane, F.; Aouinti, N.; Cheikhrouhou, O.; Ben Amor, N.; Kerrouche, A. Implementation of Blockchain Consensus Algorithm on Embedded Architecture. Secur. Commun. Netw. 2021, 2021, 9918697. [Google Scholar] [CrossRef]
- Kagermann, H.; Wahlster, W.; Helbig, J. Securing the Future of German Manufacturing Industry: Recommendations for Implementing the Strategic Initiative INDUSTRIE 4.0; Final Report of the Industrie 4.0 Working Group; Forschungsunion im Stifterverband fur die Deutsche Wirtschaft e.V.: Berlin, Germany, 2013. [Google Scholar]
- Duan, L.; Da Xu, L. Data Analytics in Industry 4.0: A Survey. Inf. Syst. Front. 2021, 1–17. [Google Scholar] [CrossRef]
- Perrier, N.; Bled, A.; Bourgault, M.; Cousin, N.; Danjou, C.; Pellerin, R.; Roland, T. Construction 4.0: A survey of research trends. J. Inf. Technol. Constr. 2020, 25, 416–437. [Google Scholar] [CrossRef]
- Serpanos, D.; Wolf, M. Industrial Internet of Things. In Internet-of-Things (IoT) Systems; Springer: Cham, Switzerland, 2018. [Google Scholar] [CrossRef]
- Qin, J.; Liu, Y.; Grosvenor, R. A Categorical Framework of Manufacturing for Industry 4.0 and Beyond. Procedia CIRP 2016, 52, 173–178. [Google Scholar] [CrossRef] [Green Version]
- Blanchet, M.; Rinn, T. The Industrie 4.0 Transition Quantified. Roland Berger Think Act, Munich. 2016. Available online: www.rolandberger.com/publications/publication_pdf/roland_berger_industry_40_20160609.pdf (accessed on 15 May 2022).
- Preuveneers, D.; Ilie-Zudor, E. The intelligent industry of the future: A survey on emerging trends, research challenges and opportunities in industry 4.0. J. Ambient. Intell. Smart Environ. 2017, 9, 287–298. [Google Scholar] [CrossRef] [Green Version]
- Schumacher, A.; Erol, S.; Sihn, W. A Maturity Model for Assessing Industry 4.0 Readiness and Maturity of Manufacturing Enterprises. Procedia CIRP 2016, 52, 161–166. [Google Scholar] [CrossRef]
- Fathalli, A.; Romdhane, M.S.; Vasconcelos, V.; Ben Rejeb Jenhani, A. Biodiversity of cyanobacteria in Tunisian freshwater reservoirs: Occurrence and potent toxicity—A review. J. Water Supply Res. Technol.-Aqua 2015, 64, 755–772. [Google Scholar] [CrossRef] [Green Version]
- Gallo, I.; Zamberletti, A.; Noce, L. Robust Angle Invariant GAS Meter Reading. In Proceedings of the 2015 International Conference on Digital Image Computing: Techniques and Applications (DICTA), Adelaide, SA, Australia, 23–25 November 2015. [Google Scholar] [CrossRef]
- Quintanilha, D.B.P.; Costa, R.W.S.; Diniz, J.O.B.; de Almeida, J.D.S.; Braz, G.; Silva, A.C.; de Paiva, A.C.; Monteiro, E.M.; Froz, B.R.; Piheiro, L.P.A.; et al. Automatic consumption reading on electromechanical meters using HoG and SVM. In Proceedings of the 7th Latin American Conference on Networked and Electronic Media (LACNEM 2017), Valparaiso, Chile, 6–7 November 2018. [Google Scholar] [CrossRef]
- Gonçalves, J.C.; Centeno, T.M. Utilização De Técnicas De Processamento De Imagens E Classificação De Padrões No Reconhecimento De Dígitos Em Imagens De Medidores De Consumo De Gás Natural. Abakos (Brasil) 2017, 5, 59–78. [Google Scholar] [CrossRef] [Green Version]
- Cerman, M.; Shalunts, G.; Albertini, D. A mobile recognition system for analog energy meter scanning. In International Symposium on Visual Computing; Springer: Cham, Switzerland, 2016. [Google Scholar] [CrossRef]
- Gomez, L.; Rusinol, M.; Karatzas, D. Cutting Sayre’s Knot: Reading Scene Text without Segmentation. Application to Utility Meters. In Proceedings of the 2018 13th IAPR International Workshop on Document Analysis Systems (DAS), Vienna, Austria, 24–27 April 2018. [Google Scholar] [CrossRef]
- Elrefaei, L.A.; Bajaber, A.; Natheir, S.; Abusanab, N.; Bazi, M. Automatic electricity meter reading based on image processing. In Proceedings of the 2015 IEEE Jordan Conference on Applied Electrical Engineering and Computing Technologies (AEECT), Amman, Jordan, 3–5 November 2015. [Google Scholar] [CrossRef]
- Tsai, C.M.; Shou, T.D.; Chen, S.C.; Hsieh, J.W. Use SSD to Detect the Digital Region in Electricity Meter. In Proceedings of the 2019 International Conference on Machine Learning and Cybernetics (ICMLC), Kobe, Japan, 7–10 July 2019. [Google Scholar] [CrossRef]
- Yang, F.; Jin, L.; Lai, S.; Gao, X.; Li, Z. Fully convolutional sequence recognition network for water meter number reading. IEEE Access 2019, 7, 11679–11687. [Google Scholar] [CrossRef]
- Li, C.; Su, Y.; Yuan, R.; Chu, D.; Zhu, J. Light-weight spliced convolution network-based automatic water meter reading in smart city. IEEE Access 2019, 7, 174359–174367. [Google Scholar] [CrossRef]
- Salomon, G.; Laroca, R.; Menotti, D. Deep Learning for Image-based Automatic Dial Meter Reading: Dataset and Baselines. In Proceedings of the 2020 International Joint Conference on Neural Networks (IJCNN), Glasgow, UK, 19–24 July 2020. [Google Scholar]
- Zuo, L.; He, P.; Zhang, C.; Zhang, Z. A robust approach to reading recognition of pointer meters based on improved mask-RCNN. Neurocomputing 2020, 388, 90–101. [Google Scholar] [CrossRef]
- Jeong-ah, K.; Ju-yeong, S.; Se-ho, P. Comparaison of Faster RCNN, YOLO and SSD for Real time vehicle type recognition. In Proceedings of the 2020 IEEE International Conference on Consumer Electronics—Asia (ICCE-Asia), Seoul, Korea, 1–3 November 2020. [Google Scholar]
- Forsberg, A.; Lundqvist, M. A Comparison of OCR Methods on Natural Images in Different Image Domains; Degree Project in technology; KTH Royal Institute of Technology: Stockholm, Sweden, 2020. [Google Scholar]
- Allouche, M.; Frikha, T.; Mitrea, M.; Memmi, G.; Chaabane, F. Lightweight Blockchain Processing. Case Study: Scanned Document Tracking on Tezos Blockchain. Appl. Sci. 2021, 11, 7169. [Google Scholar] [CrossRef]


Publisher’s Note: MDPI stays neutral with regard to jurisdictional claims in published maps and institutional affiliations. |
© 2022 by the authors. Licensee MDPI, Basel, Switzerland. This article is an open access article distributed under the terms and conditions of the Creative Commons Attribution (CC BY) license (https://creativecommons.org/licenses/by/4.0/).
Share and Cite
Ktari, J.; Frikha, T.; Hamdi, M.; Elmannai, H.; Hmam, H. Lightweight AI Framework for Industry 4.0 Case Study: Water Meter Recognition. Big Data Cogn. Comput. 2022, 6, 72. https://doi.org/10.3390/bdcc6030072
Ktari J, Frikha T, Hamdi M, Elmannai H, Hmam H. Lightweight AI Framework for Industry 4.0 Case Study: Water Meter Recognition. Big Data and Cognitive Computing. 2022; 6(3):72. https://doi.org/10.3390/bdcc6030072
Chicago/Turabian StyleKtari, Jalel, Tarek Frikha, Monia Hamdi, Hela Elmannai, and Habib Hmam. 2022. "Lightweight AI Framework for Industry 4.0 Case Study: Water Meter Recognition" Big Data and Cognitive Computing 6, no. 3: 72. https://doi.org/10.3390/bdcc6030072
APA StyleKtari, J., Frikha, T., Hamdi, M., Elmannai, H., & Hmam, H. (2022). Lightweight AI Framework for Industry 4.0 Case Study: Water Meter Recognition. Big Data and Cognitive Computing, 6(3), 72. https://doi.org/10.3390/bdcc6030072