Article

Earthquake Insurance in California, USA: What Does Community-Generated Big Data Reveal to Us?

by
Fabrizio Terenzio Gizzi
* and
Maria Rosaria Potenza
Institute of Heritage Science, National Research Council (ISPC-CNR), Area della Ricerca, C.da S. Loja, Tito, 85050 Potenza, Italy
*
Author to whom correspondence should be addressed.
Big Data Cogn. Comput. 2022, 6(2), 60; https://doi.org/10.3390/bdcc6020060
Submission received: 5 April 2022 / Revised: 10 May 2022 / Accepted: 12 May 2022 / Published: 20 May 2022
(This article belongs to the Special Issue Big Data and Internet of Things)

Abstract

:
California has a high seismic hazard, as many historical and recent earthquakes remind us. To deal with potential future damaging earthquakes, a voluntary insurance system for residential properties is in force in the state. However, the insurance penetration rate is quite low. Bearing this in mind, the aim of this article is to ascertain whether Big Data can provide policymakers and stakeholders with useful information in view of future action plans on earthquake coverage. Therefore, we extracted and analyzed the online search interest in earthquake insurance over time (2004–2021) through Google Trends (GT), a website that explores the popularity of top search queries in Google Search across various regions and languages. We found that (1) the triggering of online searches stems primarily from the occurrence of earthquakes in California and neighboring areas as well as oversea regions, thus suggesting that the interest of users was guided by both direct and vicarious earthquake experiences. However, other natural hazards also come to people’s notice; (2) the length of the higher level of online attention spans from one day to one week, depending on the magnitude of the earthquakes, the place where they occur, the temporal proximity of other natural hazards, and so on; (3) users interested in earthquake insurance are also attentive to knowing the features of the policies, among which are first the price of coverage, and then their worth and practical benefits; (4) online interest in the time span analyzed fits fairly well with the real insurance policy underwritings recorded over the years. Based on the research outcomes, we can propose the establishment of an observatory to monitor the online behavior that is suitable for supporting well-timed and geographically targeted information and communication action plans.

1. Introduction

California is one of the most earthquake-prone places on earth [1]. Its high seismic activity is caused by the San Andreas Fault system (SAFS), a complex of faults that show predominantly large-scale strike slip, which crosses almost the entire state from north to south. The SAFS consists mainly of the San Andreas Fault and several major branches [2,3].
To learn more about the SAFS, researchers have performed a stream of studies, thus raising knowledge on the seismic hazard and risk in the area [4]. However, the SAFS has caused many strong and damaging earthquakes in both historical and recent times.
Toppozada and Branum [5] listed 35 significant earthquakes in California for the 19th and 20th centuries. We mention the earthquakes of 9 January 1857 Fort Tejon (M 7.9), 21 October 1868 Hayward Fault (M 7.0), and 18 April 1906 San Francisco (M 7.8) [5]. The last event was one of California’s most famous earthquakes, which caused directly or indirectly over 3000 deaths in San Francisco and USD 400,000,000 in 1906 dollars from the earthquake and earthquake-triggered fires [6,7]. More recently, other earthquakes have occurred, such as the 18 October 1989 Loma Prieta (M 6.9), 17 January 1994 Reseda Boulevard, Northridge (M 6.7), and 6 July 2019 Ridgecrest (M 7.1) [8].
Due to the damage caused by earthquakes and other natural hazards over time, a debate about disaster insurance has developed over the decades, both in California and in other countries around the world, as well as in institutions, also stimulating agreement between different parties. For example, the European Commission dedicated a Green Paper to Insurance against Natural and Anthropogenic Disasters in 2013 [9]. Furthermore, the legally binding 2015 international Paris Agreement of COP 21 makes direct reference to risk insurance and insurance solutions [10].
In California, the insurance issue has gained attention since a law in the 1980s was passed, in which insurance companies that sell homeowner coverage were forced to offer earthquake insurance [11,12]. However, the subject of earthquake insurance suddenly returned to the fore after the 1994 Northridge earthquake (M 6.7), which caused 33 deaths as a direct result, more than 7000 injuries and over 20,000 homeless people, with financial losses estimated at USD 13 billion to USD 20 billion [13]. Due to the damage to properties, the major insurance companies announced their intention to stop selling such contracts due to the high losses [14,15]. To bring order to the earthquake insurance sector, the legislation established the California Earthquake Authority (CEA) in 1996. The Authority is a publicly managed, privately funded organization constituting an aggregate of insurance companies. Currently, the CEA, the largest supplier of residential earthquake insurance in the USA, issues approximately two-thirds of the earthquake policies sold in California [16]; the remaining portion is sold by independent companies not associated with the CEA [12]. The CEA rates are lower on average than non-CEA rates on average [12].
The CEA provides basic residential earthquake insurance coverage throughout the state, and it is purchased in a voluntary market [12]. Recently, higher levels of policy sales were recorded, even though the state-wide adoption rates for residential earthquake policies have never exceeded 16% [17].
The literature has shed light on the motives that control and limit the willingness to buy disaster insurance. Among these, we remember that low risk perception and lack of hazard experiences, state relief or ex post compensation, high coverage premiums, presence of noncompulsory insurance systems, sociodemographic and geographic features of the homeowners, social trust, existing experience of buying other types of insurance, and inadequate advertising of disaster coverage by private companies troubled about catastrophic losses [18,19,20,21,22,23,24,25,26,27]. Recently, the low insurance penetration rate in California was linked to high premiums [17].
That being stated, the purpose of this article is to assess whether Big Data can provide policymakers and stakeholders with useful information in view of planning future actions on earthquake coverage.
Therefore, the study considers a bottom-up approach, analyzing the trends of community-generated online search interest related to earthquake insurance in California by Google Trends (GT) in 2004–2021. GT is the website that analyses the appeal of top search queries in Google Search across various regions and languages. In particular, this article scrutinizes the public interest in earthquake insurance: (i) to link it to the possible increase in people’s preparedness as a consequence of different earthquake experiences matured after natural hazards that occurred both in California and bordering areas, as well as overseas, (ii) to identify the duration of interest over time, once it was triggered by external factors, and (iii) to recognize possible relationships between information seeking and real actions (coverage underwritings).
The literature suggests that hazard experience stimulates higher risk perception [28]. In addition, earthquake experience is documented as swaying preparedness [29,30], which also takes in insurance coverage [31].
Becker et al. (2017) [29] recognize that the experiences that influence people’s behavior affecting preparedness can be classified into four typologies: (1) direct experience (i.e., first hand involvement in suffering losses and direct physical perception of a hazard, such as an earthquake), (2) indirect experience (i.e., persons not directly involved in the hazard and who did not suffer any consequences, such as teams of volunteers travelling to an area affected by an earthquake), (3) vicarious experience (i.e., experience of disasters described by relatives/friends or media accounts of domestic and international disasters), and (4) life experience, not related to disaster experiences (i.e., unfavorable life experiences, such as accidents at work, illnesses, and car accidents). Regarding the role of these experiences, the literature recognizes direct experience as the most effective in encouraging preparation. However, both indirect and life experiences, even if less effective than first-hand involvement, also contribute to influencing preparedness [32,33]. Moreover, vicarious experience is recognized as a significant predisposing element [29].
The article is organized into other three main sections. Section 2 addresses the materials and methodology used to both retrieve and analyze the data. Section 3 includes the exploration of the results and their cross-correlated discussion. Section 4 draws conclusions with both the practical implications and limitations of the research in mind.

2. Materials and Methods

2.1. Google Trends: An Overview

Scholars increasingly consider Google Trends (GT) in their research. The analysis performed by the authors of this article in the Scopus citation index identified 1769 documents published from 2007 to 2021, with a maximum (501 documents) in 2021 (Figure 1). Approximately 30 were the subject areas involved, the first three represented by medicine (25% of the total), followed by computer science (12%), social sciences and economics (10%). GT was used for real-time outbreak surveillance [34], healthcare [35], collective human behavior in financial markets [36], and tourism demand forecasting [37]. More recently, GT was also adopted to reveal dynamic patterns of community interest on floods [38], earthquakes [39], and earthquake insurance [40].
GT gives access to an almost unfiltered sample of real search requests made to the Google search engine. However, the advantages and limits of GT need to be emphasized [41].
According to Google Trends [42], the data sample is completely anonymized (no person is identified), ranked (the subject of the search queries is established) and combined (grouped). This allows us to show interest in a certain topic around the world or in specific cities. GT includes two search strategies: search term and search topic. On the one hand, search terms show matches of all terms in the query in a given language; on the other hand, topics are a set of words that share the same concept in any language. GT also offers interest search activities considering different geographic areas (world, state, metropolitan areas, and cities). In this way, GT includes a GeoMap showing areas where the term searched is popular during the corresponding selected period. In that map, darker shades show in which places the term has a higher probability of being searched by users. There are two samples of GT data that users can access: (1) real-time data, which is a sample for the past seven days, and (2) non real-time data, which is a separate sample of real-time data that can go from 2004 to 36 h prior to the search date.
A significant aspect to be considered is that the relative search volume (RSV) is normalized from 0 to 100 over the selected period, based on the maximum of the absolute activity volume during the same time span explored. Therefore, comparing search results related to different periods is not possible. In particular, selecting a period since 2004, the intervals in which the data are supplied are monthly, for the past five years and single years, weekly, for time intervals equal to or greater than 30 days, but less than 90 days, data provided by GT are on a daily base.
GT also includes the “Related Queries” box. This tool is useful for identifying the popular terms that accompany or follow the selected main search term. GT offers two options: “Most searched” and “Rising”. In the first choice, the search results are visualized on a relative scale: 100 indicates the most searched query, 50 indicates a query with half the searches of the most searched query, and so on; in the second preference, we can categorize the queries whose search frequency has increased the most since the last period.

2.2. The Method

We analyzed the online trend of the earthquake insurance (EQI) topic for the state of California in the period from 1 January 2004 to 31 December 2021 (18 years). For the same period, we also considered the search trend analysis for the earthquake (EQ) topic.
The choice to use “Topics” as a search filter in GT was also suggested by the very diverse composition of the population of California, where no ethnic group constitutes an absolute majority of the over 39 million people, which are made up of 39% Latino, 35% white, 15% Asian American or Pacific Islander, 5% Black, 4% multi-ethnic, and others [43]. This implies different cultures and languages spoken, which can also be used to search for on the internet. Indeed, 44.2% of people speak languages other than English at home [44].
Once the search filter was identified, another point to define was the time resolution of the internet data. Indeed, bearing in mind that for wide-time windows, we can only obtain RSV based on a monthly scale, it was necessary to adopt a strategy to assess the higher resolution (daily) data, useful for performing more inclusive and detailed analyses. For this purpose, we implemented the methodology proposed by Thompson et al. (2021) [38].
In detail, the procedure adopted consisted of four main steps: (1) to perform the search for the topic EQI and EQ for the entire period of 18 years (2004–2021); (2) to identify, for the period, the month with the highest search interest (100) assigning it a weighting of 1 and then rescaling the interest to all the months of the past 18 years; (3) to acquire the daily data for both topics by each of the 216 months that make up the 18 years examined; and (4) to scale the daily data of each month by multiplying the daily search volumes by the corresponding weighted monthly value. In this way, we obtained the daily series for both topics over the entire period (2004–2021). We retrieved data on 8 February 2022. All GT data (both EQ and EQI) were imported in a Microsoft Excel 2013 spreadsheet to be elaborated following the procedure described above. Once obtained, the daily data on both EQ and EQI were analyzed to evaluate potential correlations with earthquakes.
In order to obtain data on earthquakes (date, time, epicentral area, magnitude, and community-determined intensity map (CDI)) that occurred both in California and bordering areas and the USA, as well as over the world, the USGS Earthquake Catalogue was utilized as a reference [45]. The earthquakes that were recognized as triggering online interest in EQI, as explained in Section 3.2, were plotted to build thematic maps using ArcGIS 10.3 software.

3. Results and Discussion

3.1. From the USA to California: A Progressive Zoomed in Analysis

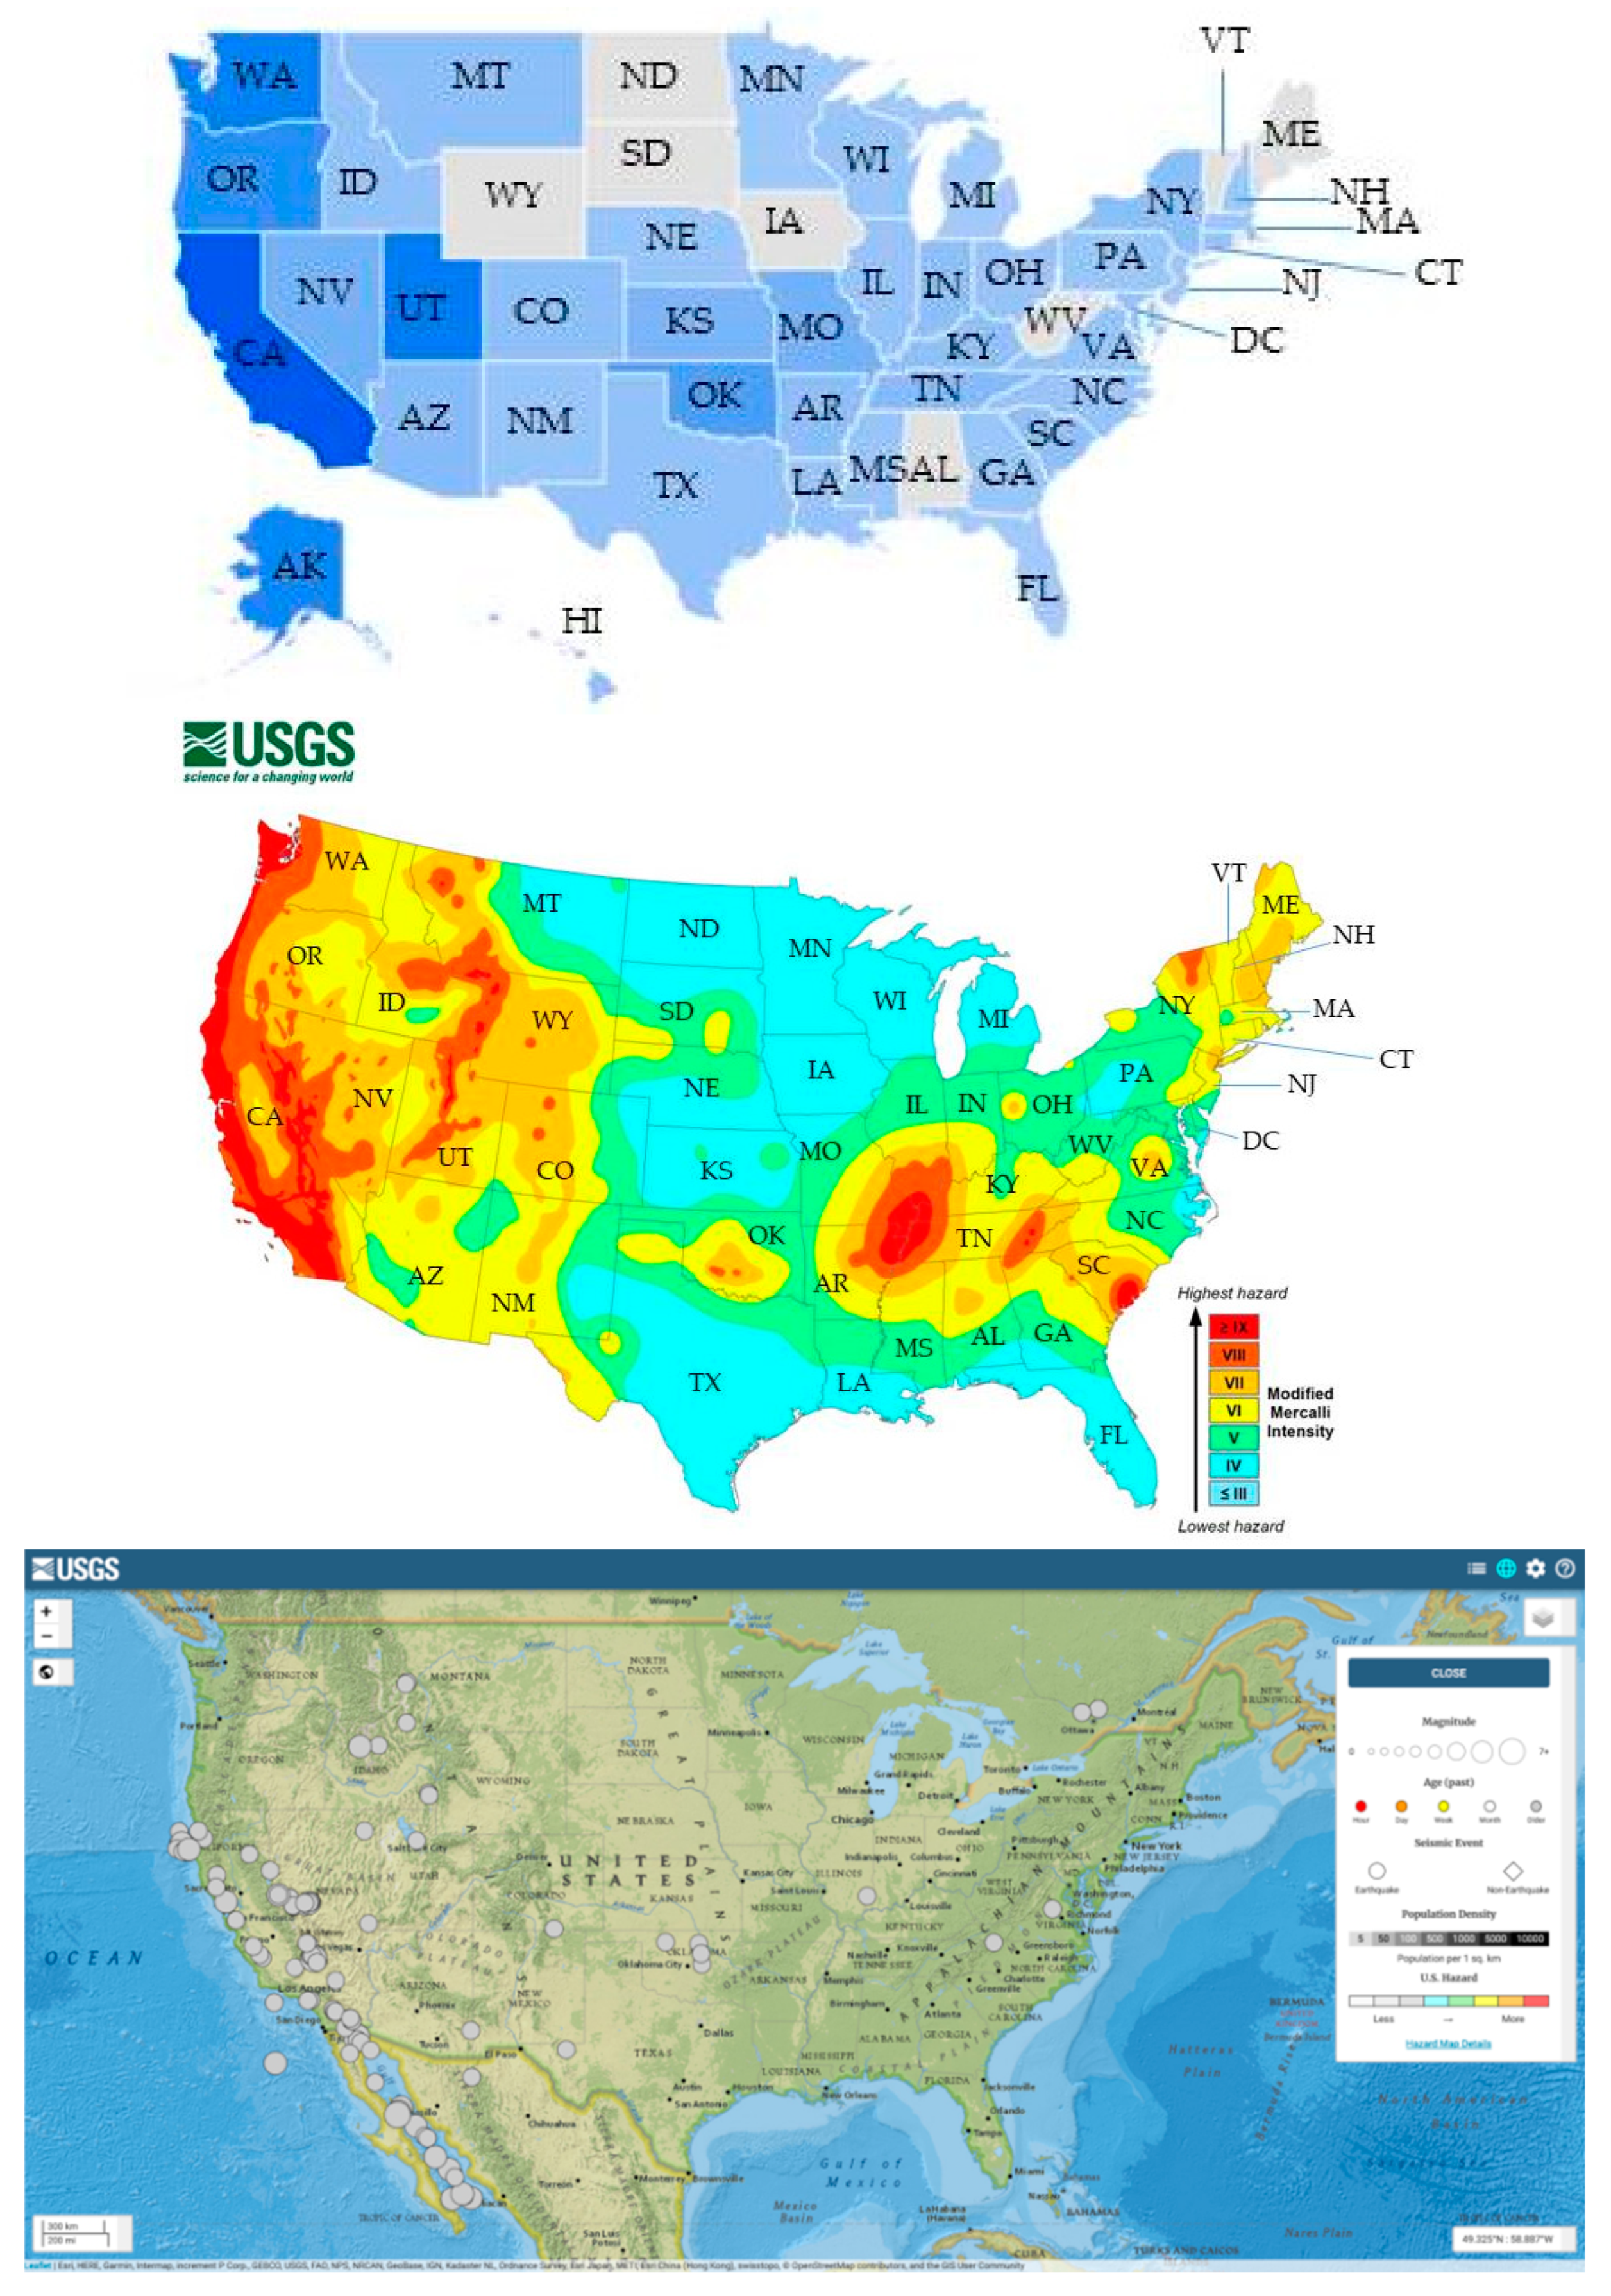
The GeoMap related to the online searches in EQI for the USA capturing the entire period (2004–2021) shows a quite complex picture (Figure 2). In order to take a closer look, we can perform a comparative analysis of GeoMap both with the seismic hazard map of the USA and with the map of earthquakes (M ≥ 5) occurred in the time span of 18 years analyzed in this article (Figure 2).
As we can see from Figure 2, the GT EQI GeoMap fits differently the seismic hazard of the territory of the Federal Republic (Figure 2). Online search interest prevails in the states of the west coast (from south to north: California, 100, Oregon, 53, and Washington, 66), where the seismic hazard is very high or moderate-high. However, numerous and even major earthquakes occurred in California in the 18 years, events which did not occur in the states of Oregon and Washington. In these two states, the interest in EQI was probably nurtured by the seismic activity occurred in the bordering states, primarily California. Moving east, for Utah (70) we can observe an overlap between the seismic hazard map and the GeoMap. However, in Utah, a significant earthquake occurred during the 18 years. For the states of Idaho, Montana, and Wyoming, where there are large areas characterized by moderate and high seismic hazard, online attention fluctuates from zero to low. This difference can be explained by the circumstance that no earthquakes occurred, at least of moderate to high magnitude (Wyoming), or they took place in sparsely populated areas (Idaho and Montana). Looking at the central United States, there is a good agreement between the GeoMap and the hazard map. In fact, the states with low and low-moderate seismic hazard show no or low search activity (North Dakota, 0; South Dakota, 0; Nebraska, 8; Kansas, 22 and Texas, 20). In these states, no important seismic activity was recorded. Looking at Oklahoma, the higher seismic hazard of the state well corresponds to a higher internet activity (41). However, some significant earthquakes occurred in the state. Conversely, the correlation between the GeoMap and the moderate-high seismic hazard of the central-eastern (Arkansas, Missouri, Illinois, and Tennessee), and eastern (South Carolina) states is low. Again, the differences can be explained, at least in part, by the low seismic activity in the period (2004–2021), as Figure 2 shows. Quite a similar consideration can be made for the northeastern states (Maine and New York).
These analyses seem to show that the EQI interest in users was not determined by the awareness of the seismic hazard of the territory by online users (predisposing factor), but rather it was driven by the earthquake occurrence(s) (determining factor). This anticipates what we will now discuss in detail for California.
Focusing on this state, we can consider both the geographic and temporal patterns.
Regarding the first point, the 18-year GeoMap related to earthquake insurance provides evidence that interest was especially concentrated in Southern California (Figure 3). This seems consistent with the circumstance that the Southern San Andreas Fault strand is the most likely to host a large earthquake in the next three decades, as confirmed by the recent Third Uniform California Earthquake Rupture Forecast (UCERF3) [47]. However, analyses that are more detailed will be discussed later.
Regarding the second point (temporal patterns), we can see that the earthquake insurance interest grew over time (Table 1 and Figure 4). Now, we consider this complex pattern in detail.
The period of 18 years can be subdivided into three main temporal windows, each of which is related to a different level of interest: the first period from 2004 to 2009, the second period from 2010 to 2015, and the third period from 2016 to 2021.
Although the interest was low in the first six years, the days in which online searches were carried out tripled in the second period and fivefold in the third period, when compared to the first time interval. The highest activity in the third period is also plain by the total RSV (7373), which in the third period alone represents approximately 55% of the total scores (13,490) over the 18 years analyzed (Table 1). Furthermore, the third period also saw the lowest percentage of days with no online activity (RSV = 0).
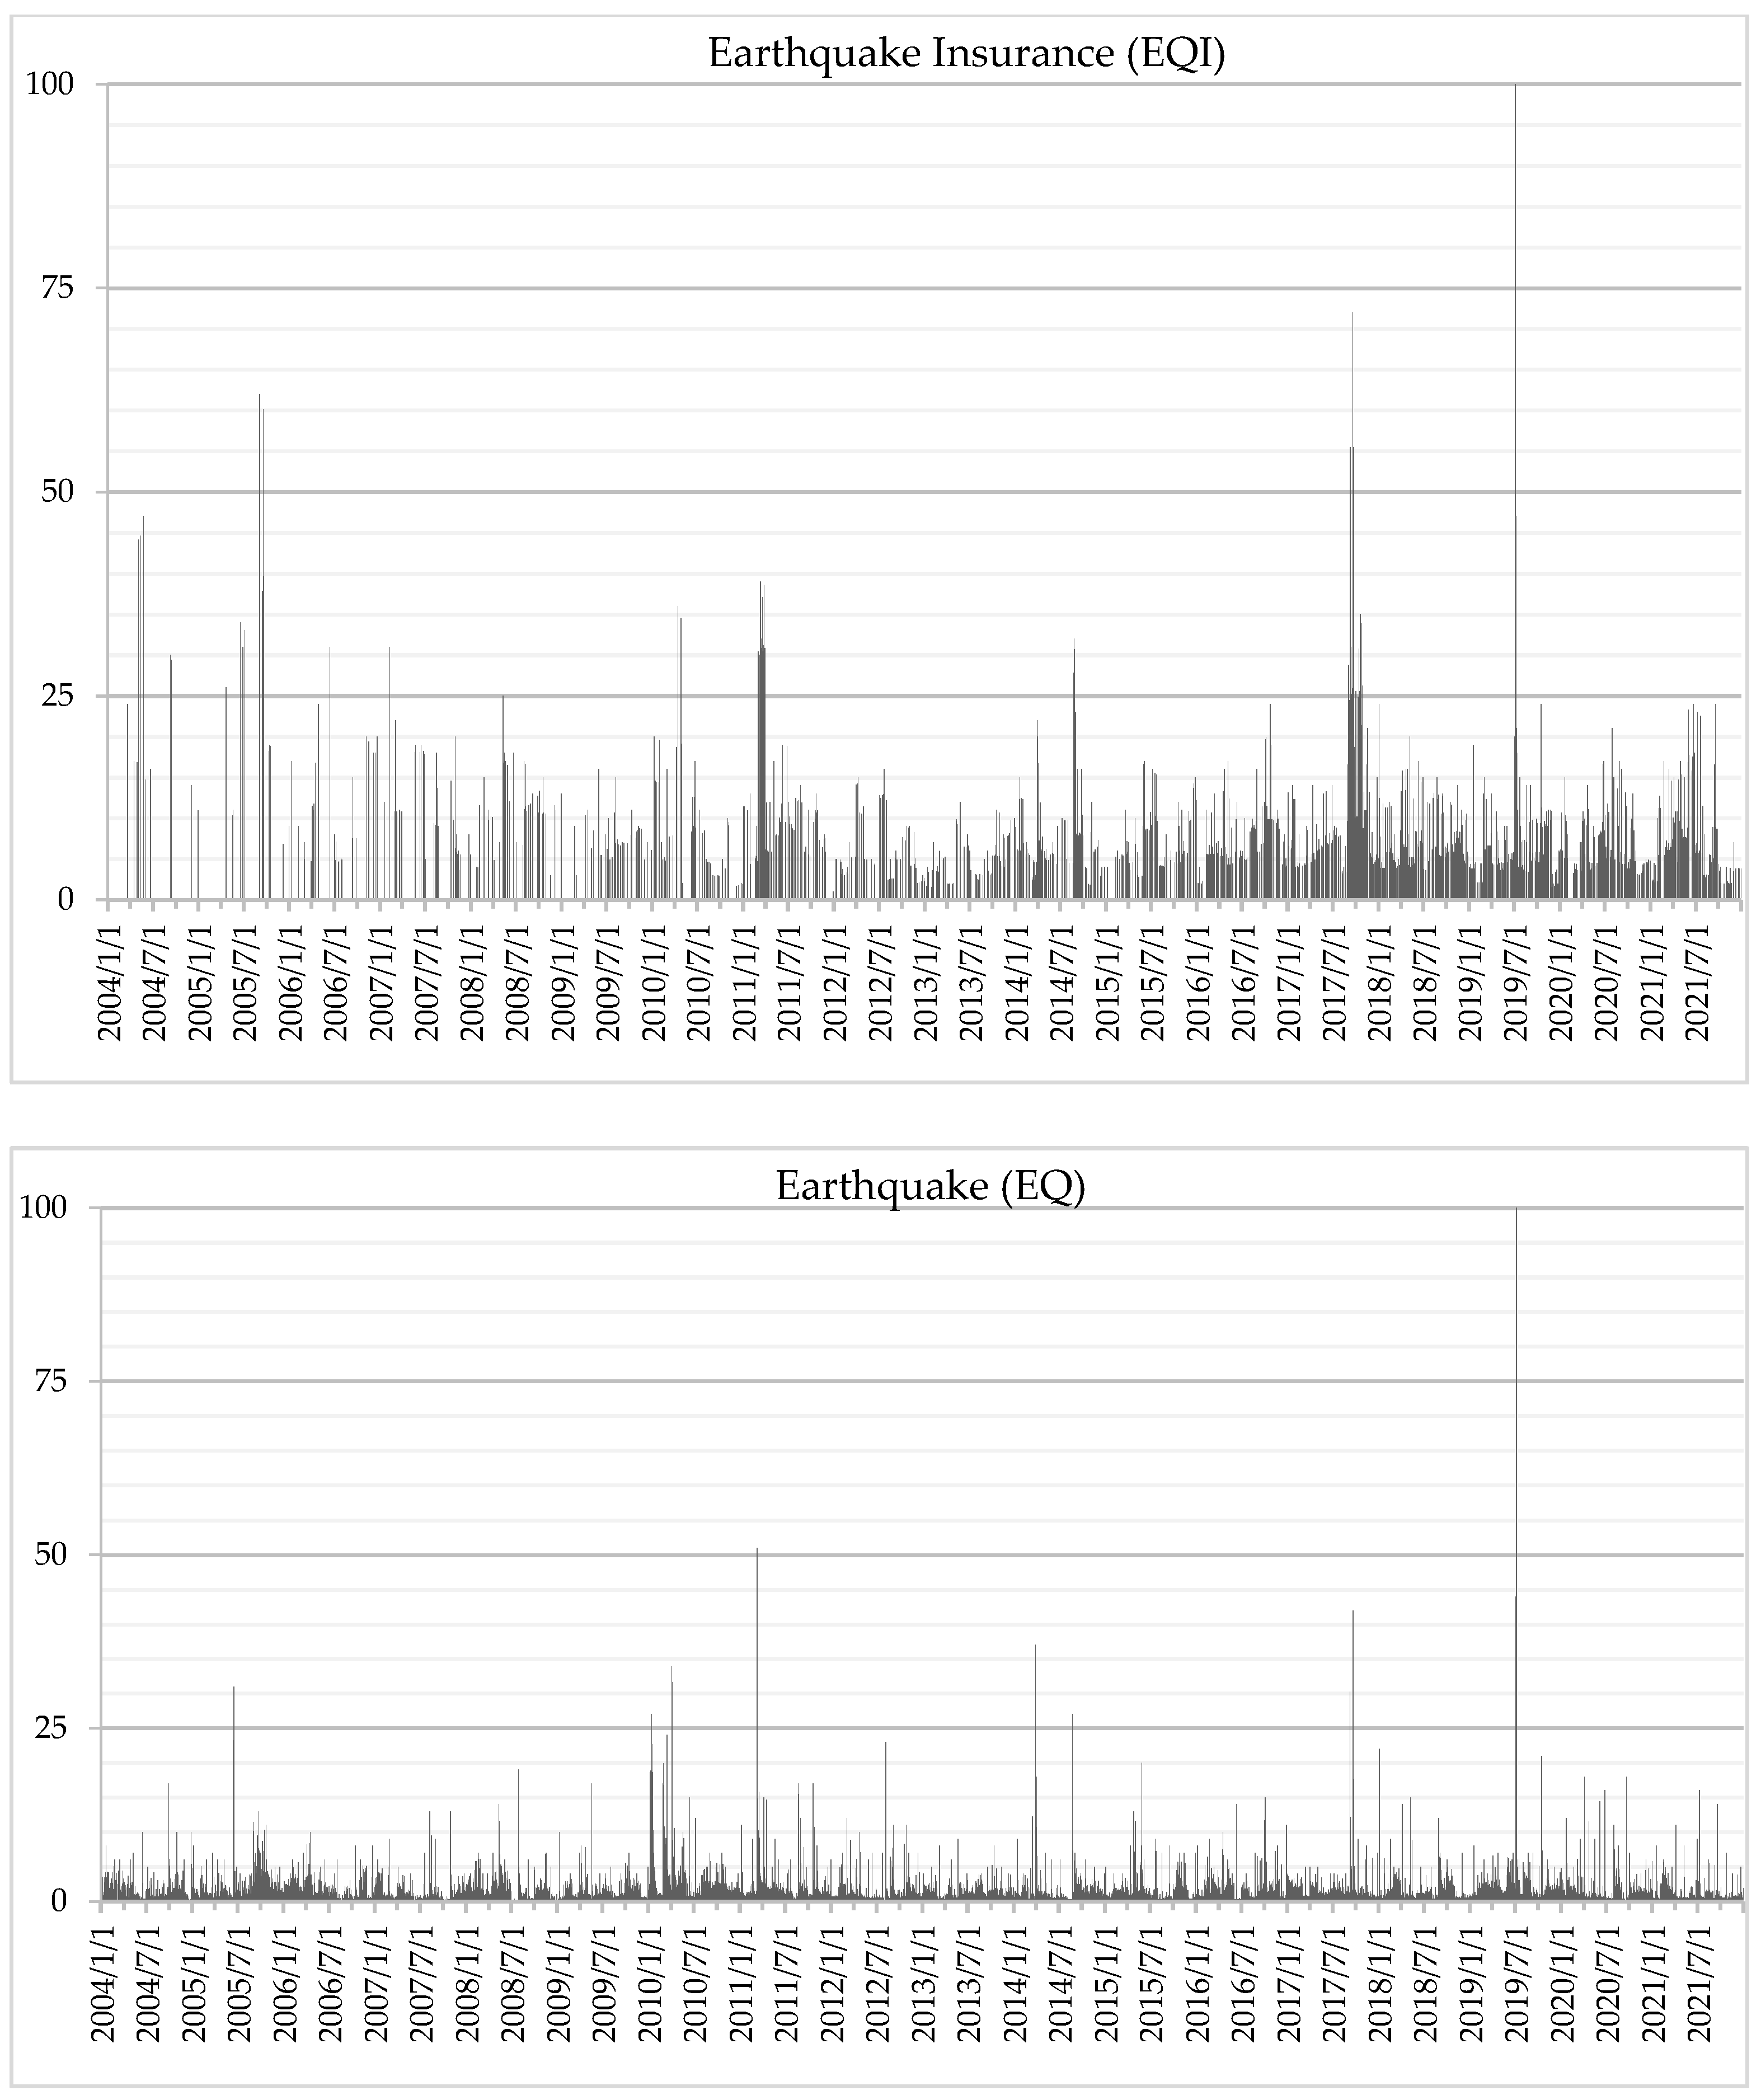
A quick (visual) comparison between the EQI and EQ online data (Figure 4) seems to show a certain similarity in trends, which is consistent with the circumstance that among the EQI-related queries (most searched option), the search for the term “earthquake” had the highest relative frequency (100). This would suggest that interest in online searches on insurance was at least to some extent stimulated by earthquake occurrence, even though the statistical correlation between the earthquakes (M ≥ 5.0) that occurred in California as well as bordering areas and the online interest is not so close (Table 2).
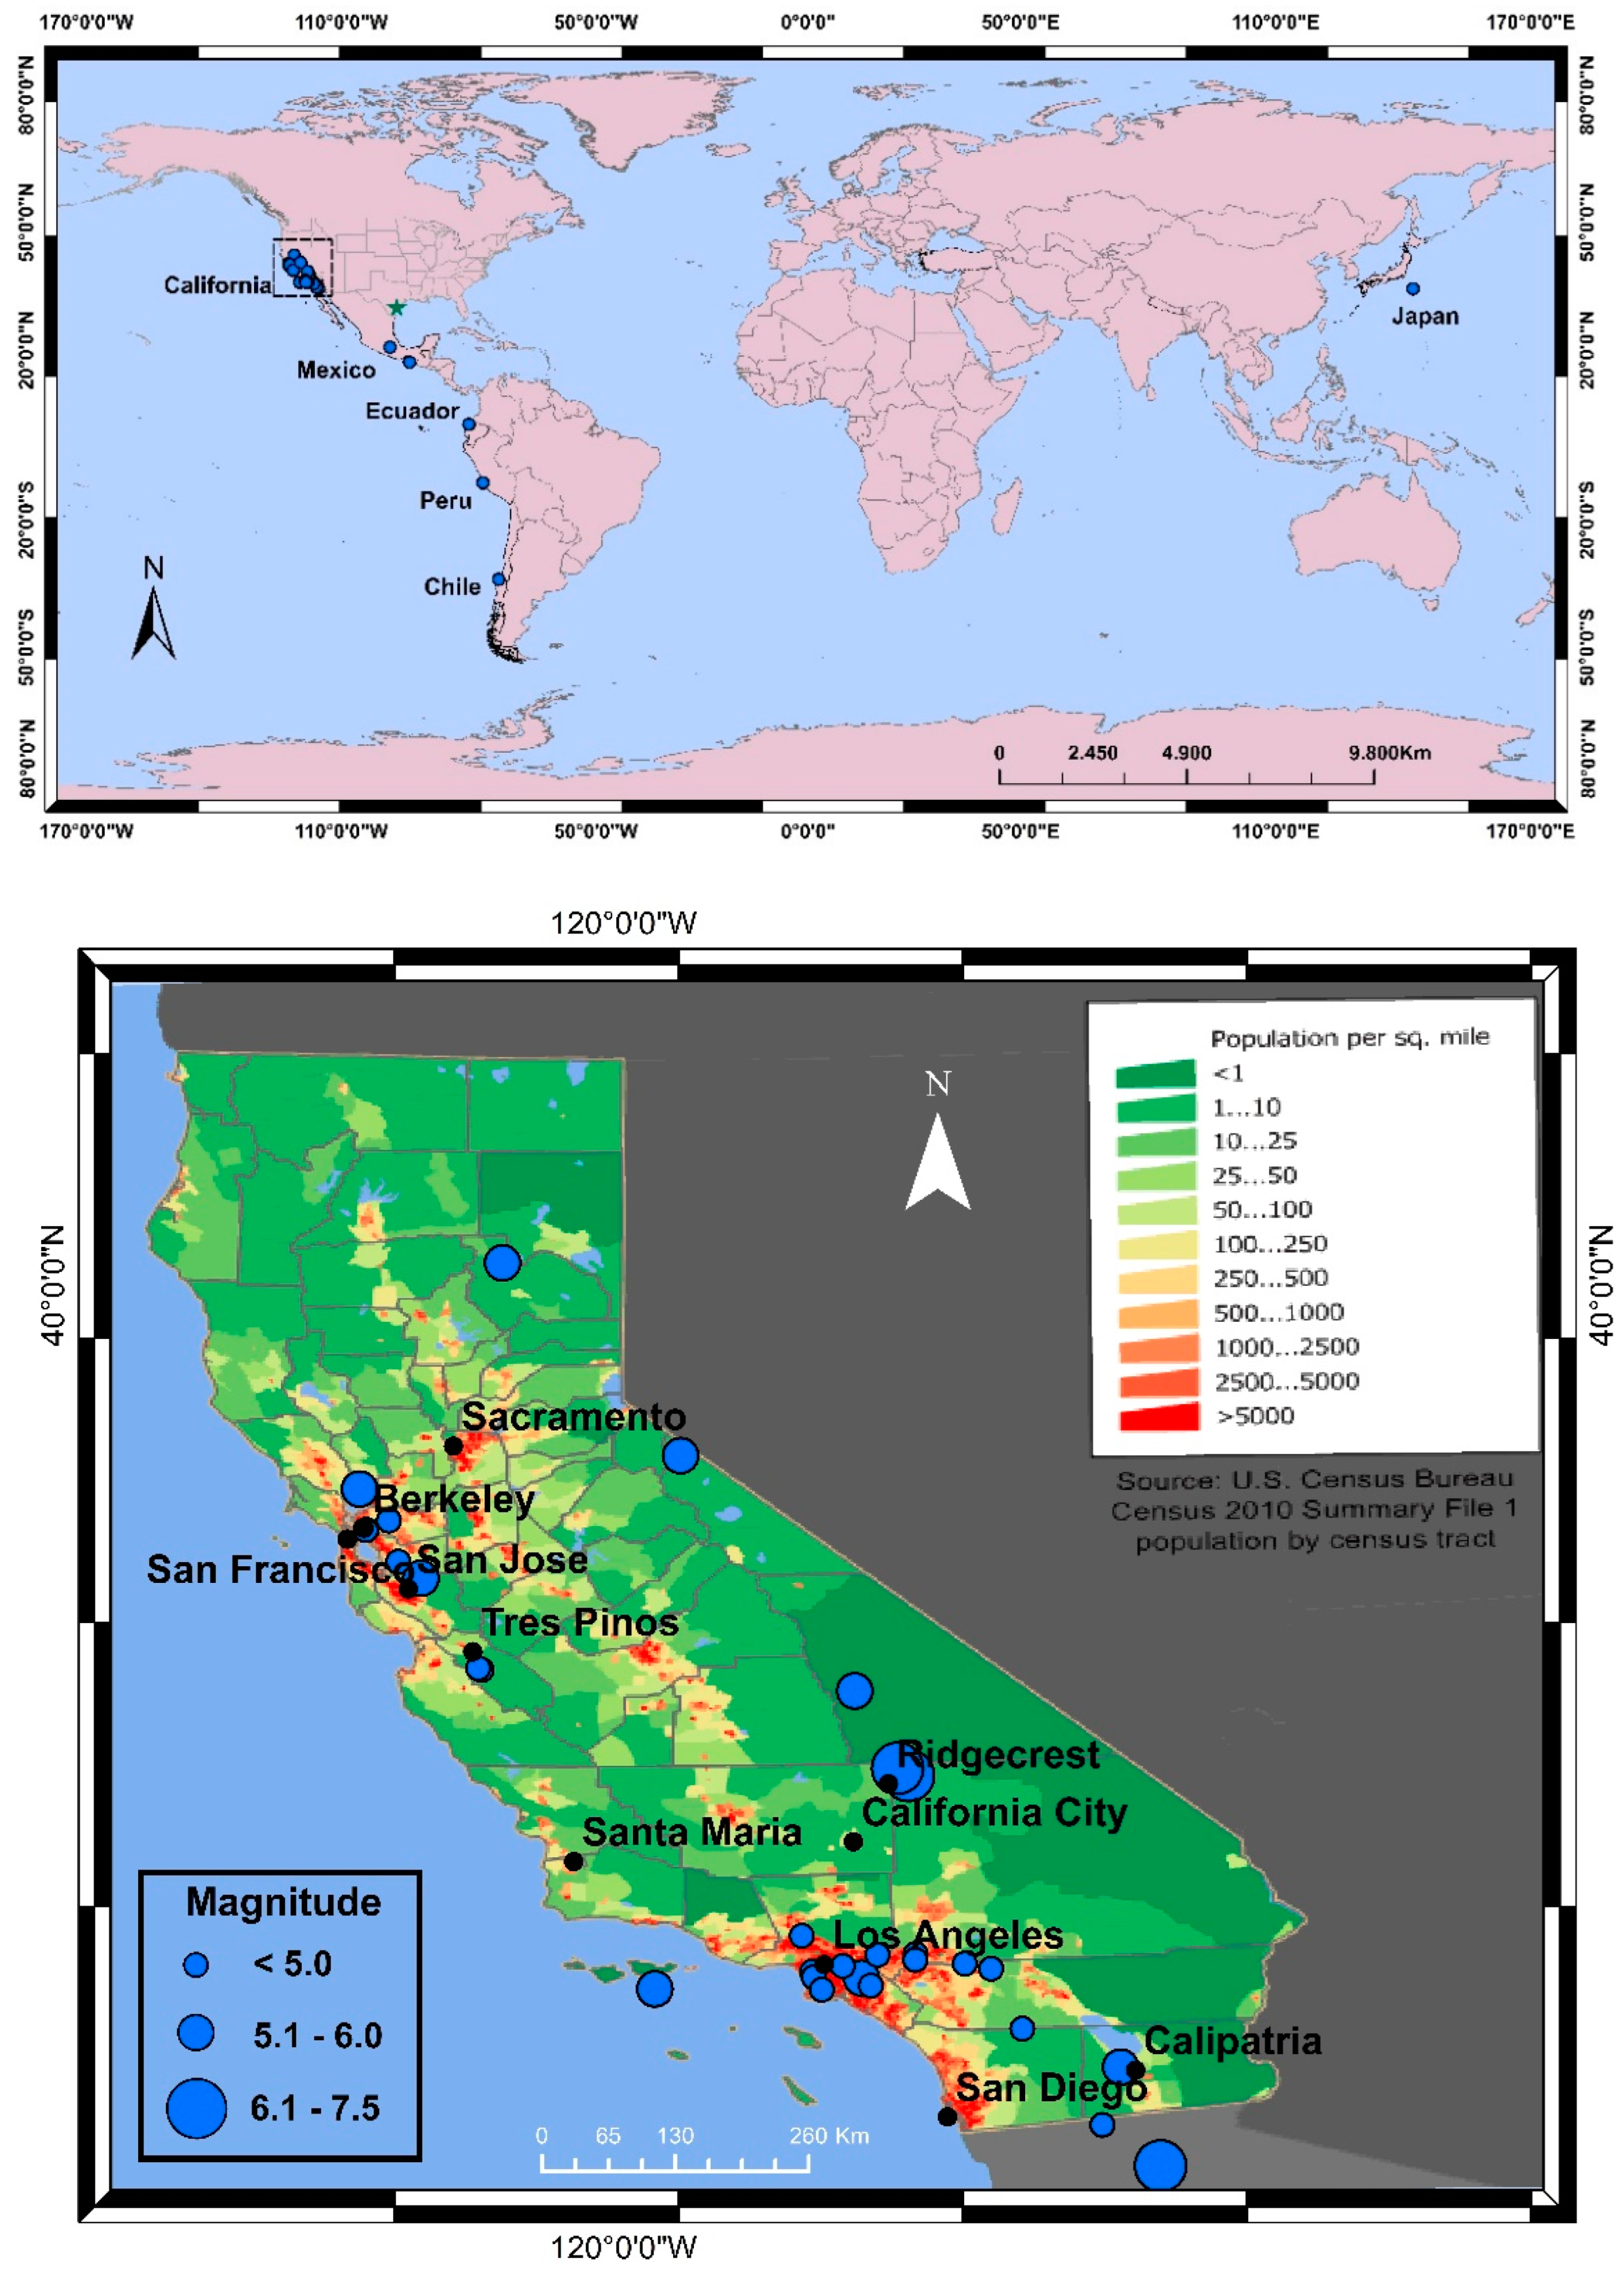
However, the values of correlation coefficients need to be analyzed gauging that (1) earthquake data do not include events outside California and bordering areas, which contributed to online interest, as will be explained later; (2) the analysis does not consider the occurrence of other natural hazards (Hurricane Harley) besides the earthquakes, which had an effect on the insurance search, as discussed later; (3) the occurrence of an earthquake can have direct-immediate and/or indirect-delayed impacts, stimulating online searches in the medium term causing, as we will discuss later, online attention in insurance that can continue for several days or weeks, as in the case of the Mexico earthquake of 2017, even without the occurrence of earthquakes; (4) an earthquake can determine the effects on online searches that increase the day after the earthquake occurred, depending on the time that the earthquake occurred (at night); (5) an earthquake can trigger online effects only after the second or third shocks, after the seismic events generated repeated experience(s) on people; (6) the distribution of the population in California is rather clustered in large urban agglomerations located in the central and western part of the state (Figure 5); therefore, the lack of enough “human sensors” in the eastern areas of the state able to record some of the earthquakes that occur in those areas can prevent sizeable online activity; and (7) the general interest on the subject of insurance is very low in the first period (only 8% of RSV days >0) and rather low in the second, and then clearly rises in the third period (41% of RSV days >0), for which the correlation between the occurrence of earthquakes and online searches on insurance clearly increases.

3.2. A closer Analysis: The Earthquakes and Other Natural Hazards as Factors Sparking off Interest

To analyze what ramifications the occurrence of earthquakes had on online behavior, we considered EQ and EQI online data comparatively. In particular, when we ascertained a rapid growth in daily online interest for both the EQ and EQI topics, we checked for potential contemporary earthquake(s) firstly in California and bordering areas, then in the USA, and lastly overseas. In case of earthquake occurrence(s), the natural hazard(s) was considered as triggering the insurance searches. Spikes of online activity on EQI were also related to possible other natural extreme events other than earthquakes, such as Hurricane Harvey in August 2017, as we will see later.
We classified the EQI online attention into four levels, from low to very high, according to Table 3. We also analyzed the duration of online interest. Table 4 and Figure 5 summarize all these analyses.
In order to make the analysis more complete, we also made some inferences on online EQI data and real data on insurance underwritings.
Overall, we identified 38 events, including earthquakes and other natural hazards. These acted as triggers of online activity on earthquake insurance searches. In detail, 4 were the earthquakes in the first period, 10 were in the second period and 24 were in the third period. From the inclusive analysis, the occurrence of earthquakes or other natural hazards caused a growth of interest that waved between one day and over two weeks, even if with discontinuous activity.
The first event on the list is the Yucaipa earthquake (M 4.9), which caused one day of moderate interest in EQI. Afterwards, the Calipatria earthquake (M 5.1) saw a rise of interest in EQI for two days with an overall level of attention that can be assessed as moderate even though, according to the USGS earthquake catalogue, no people were killed or missing, no people were injured, and no buildings were damaged or destroyed. This finding is in accordance with both the literature that considers the effects of “no-loss” experience that nonetheless raises the salience of seismic risk [48] and the results of other research in earthquake insurance [40].
The next earthquake for which there was a lightning of interest (1 day) was the event that occurred in Peru on 15 August 2007 (M 8.0). The main event occurred at 23:40:57 (UTC), thus resulting in a low increase in EQ interest (9) the next day, accompanied by a sudden increase in searches in EQI (18) with respect to the previous over three weeks, which indicated the total absence of online activity.
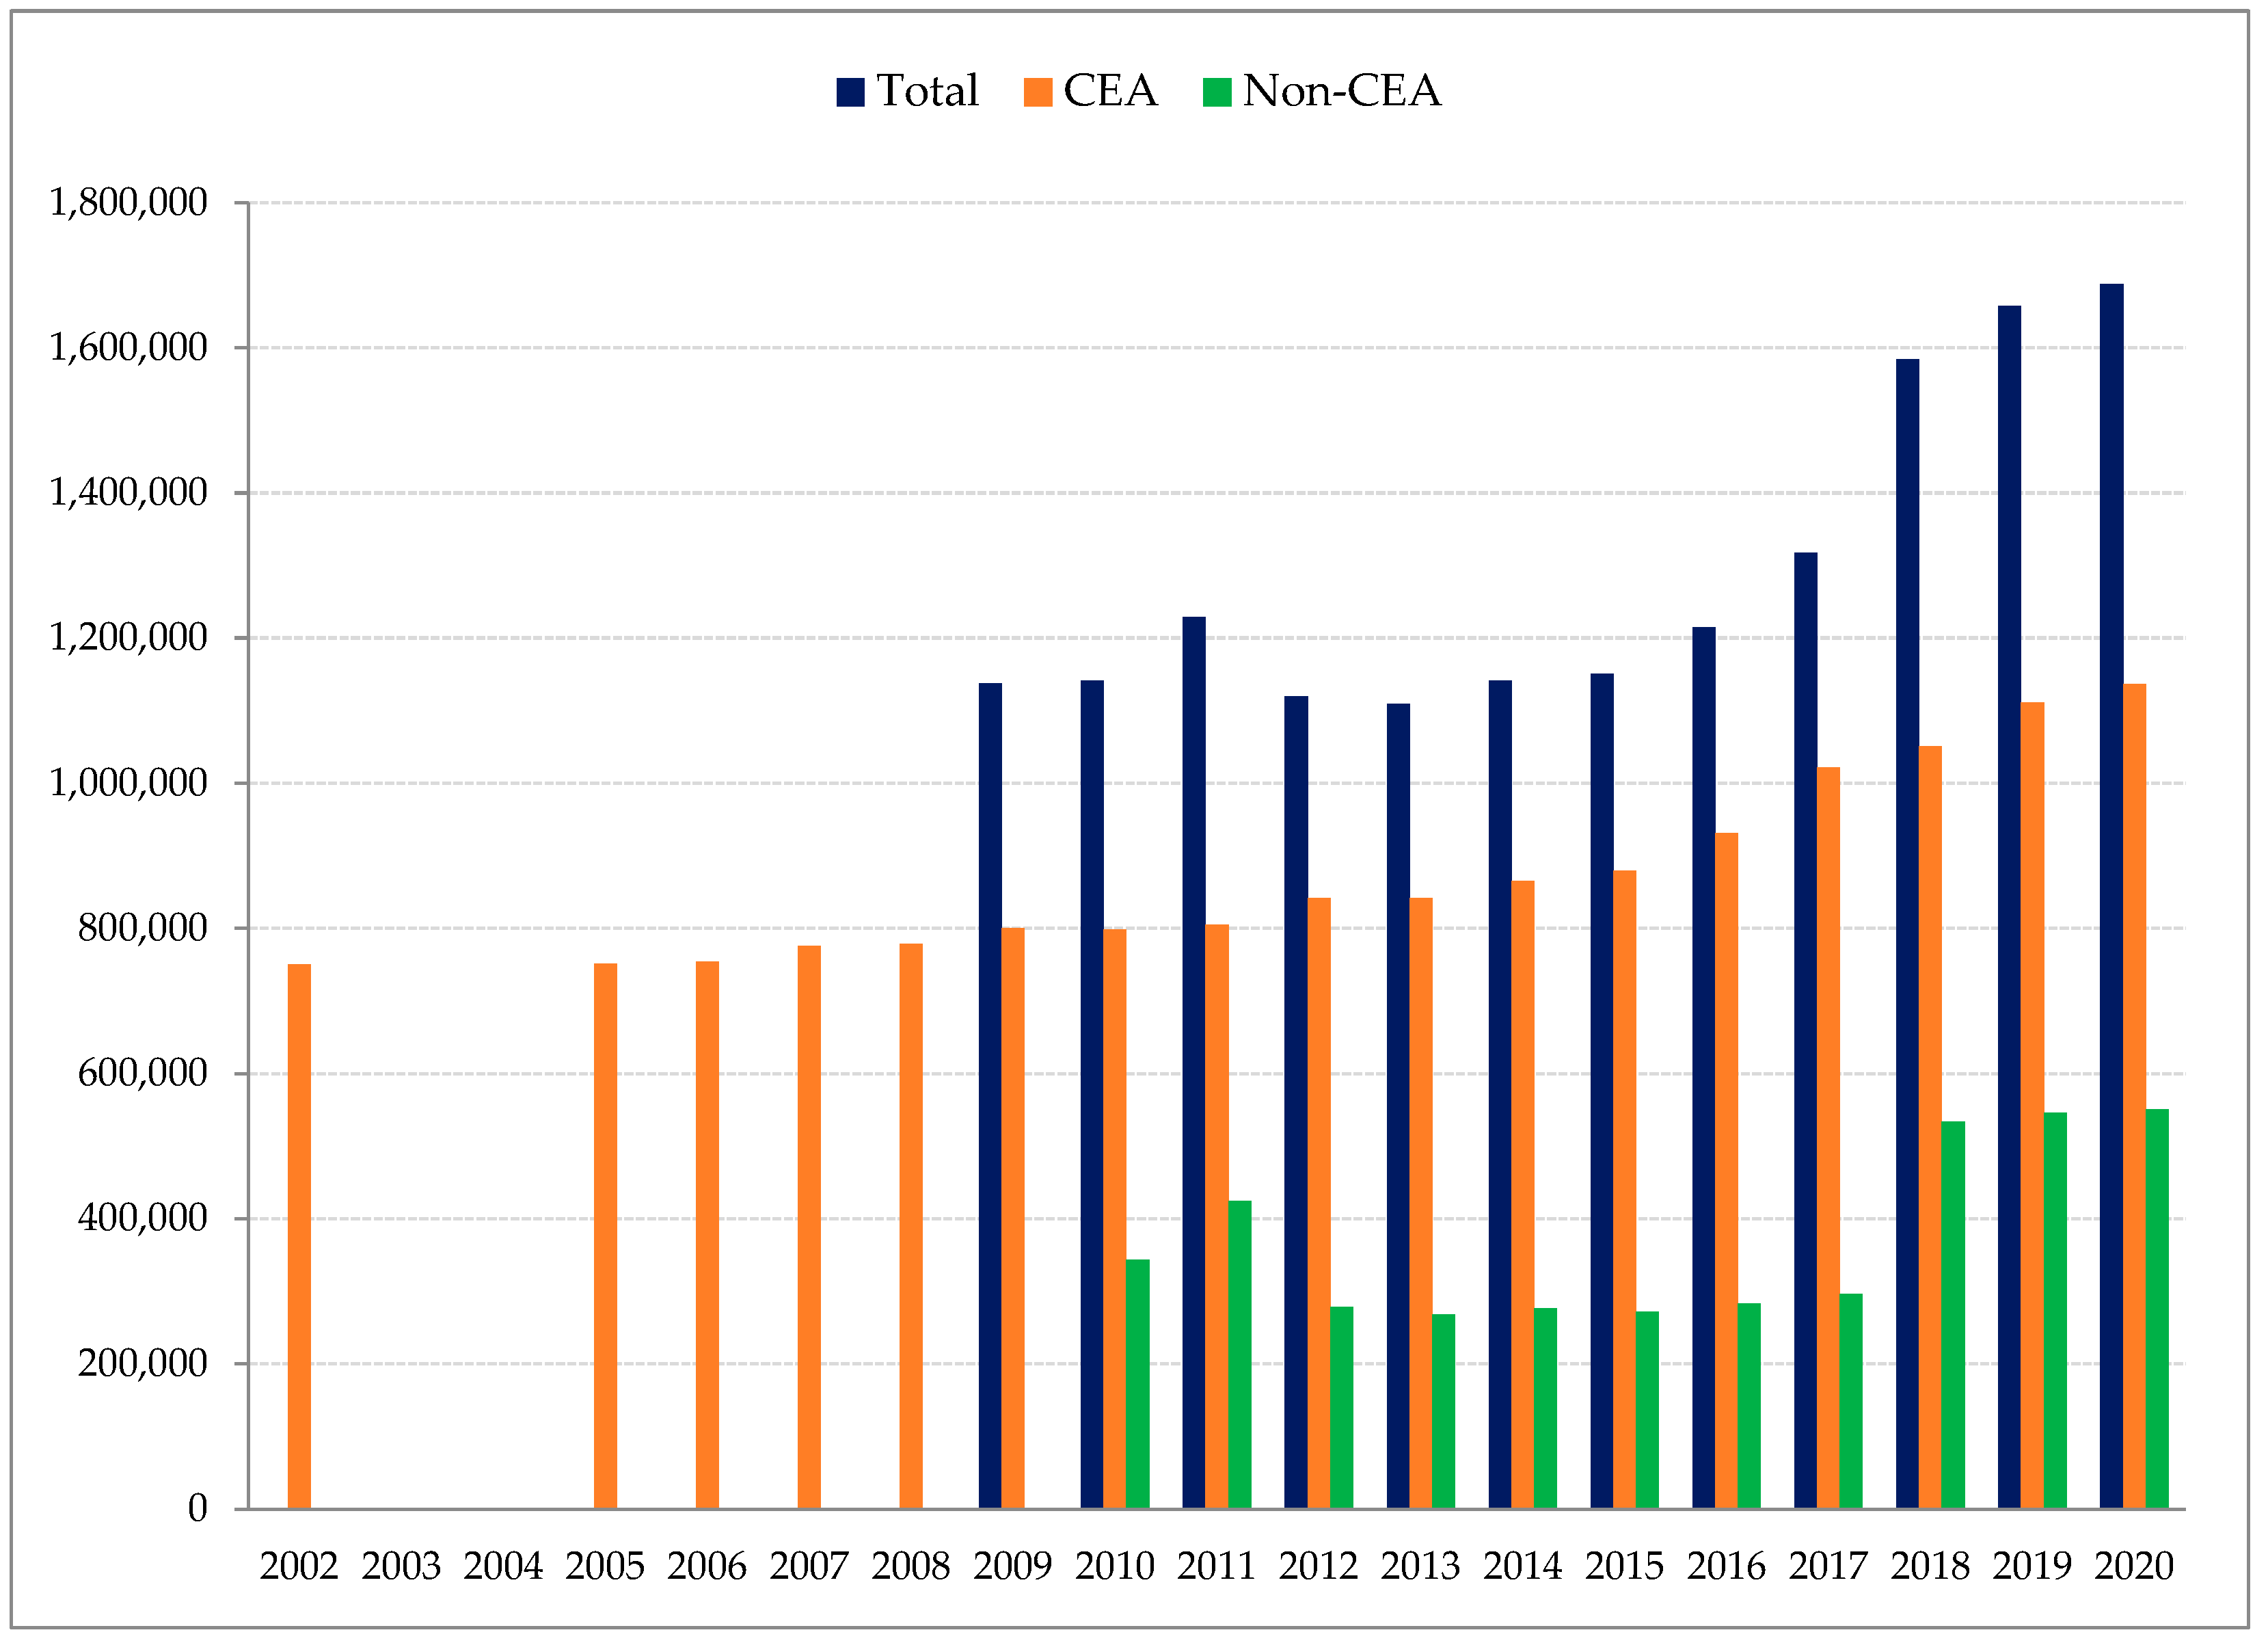
However, according to what we said above, interest in the first period was the lowest over the 18 years. This is in accordance with the low policy underwriting increase for almost the same period (2005–2009). In fact, the subscription data indicate that the total increase in policies sold was less than 50,000 from 2005 to 2009, with an average annual increase of only approximately 12,000 subscriptions, one of the lowest rates in 2005–2021 (Figure 6).
Regarding the second period, on 4 April 2010, a high-magnitude earthquake (M 7.2) occurred in Mexico, approximately 50 kilometers from the California border. The earthquake caused a rapid surge of interest in EQ (34) on the same day. However, there was no direct increase in interest in EQI. The following day (5 April) started a seismic sequence in an area located north of the epicenter of the earthquake with a magnitude of 7.2, near Ocotillo (California). The sequence continued until 7 April. These earthquakes, with a magnitude between 4.6 and 5.0, sustained the interest in EQ and contributed to stimulating online activity in EQI, with an RSV increasing for two days (RSV1 = 18; RSV2 = 19).
The disastrous Japan earthquake–tsunami of 11 March 2011 (Great Tohoku earthquake, M 9.1) caused online attention for approximately 10 days in EQ and 11 days in EQI (in the latter case, the values fluctuated between RSV = 39 on the day following the earthquake and RSV = 31 for 28 March). The high searches were most likely due to the large echo in the international media, thus stimulating the interest in earthquake insurance due to vicarious experience [29].
Real data on insurance underwritings appear to be in good agreement with the online data searches for the second period (Figure 6). In fact, the maximum increase in subscriptions was recorded in 2011, the year in which the maximum volume of online searches (RSV = 1096) of the entire second period was documented (RSV mean = 642). GT data for 2014 also agree well with policy stipulations. In fact, 2014 saw the second most significant increase in policy stipulations in the second period (+32,000 contracts compared to 2013), similar to the total volume of online searches for EQI (RSV = 808).
The third period started with two low-magnitude earthquakes whose epicenters were in California, the 21 July 2015 Freemont and the 25 July 2015 Fonfata events, for which a low interest was recorded.
From 29 August to 5 September 2017 (8 days), interest in insurance seems to be not directly linked to earthquake(s). This can be inferred from both the low daily volumes in searches for earthquakes (≤2) and the absence of significant earthquakes in California as well as all over the world able of capturing attention of internet users for so long. The higher level of interest with respect to the previous months was likely driven by increased awareness of disaster insurance following the devastating Hurricane Harvey that made landfall first in Texas and then in Louisiana between 25 and 31 August 2017. Hurricane Harvey, classified as Category 4, caused more than USD 125 billion in damages [51,52], affecting 203,000 homes, of which 12,700 were destroyed [53].
As a result of the giant losses caused also by widespread flooding started on 26–27 August and the large echo received by Harvey from the media, a spike in searches on flood insurance occurred in California between the end of August and the beginning of September (week of 27 August–2 September) (Figure 7). Approximately in the same period (between 29 August 2017, a few days after the start of the landfall and flooding, and 5 September 2017), the searches for flood insurance likely had a “drag effect”, triggering the increase in online activity on EQI, as discussed before. Therefore, it is interesting to note that the period saw an interest driven probably by vicarious experiences transferred between different natural hazards, which do not seem to be reported in the literature, as far as the authors are aware.
Continuing the analysis, also in September 2017, two very strong earthquakes occurred in Mexico: the earthquake of 8 September 2017 in Chiapas (M 8.2) and that of 19 September 2017 in Matzaco (M 7.1). These two earthquakes resulted in a sharp increase in EQ interest for two and six days, respectively. The two earthquakes also triggered a growth of online searches for EQI for at least eight days in the case of the Chiapas earthquake (from 8 September, RSV = 8 to 15 September, RSV = 25) and seven days for the Matzaco earthquake (from September 19, RSV = 26, to Day 25, RSV = 19, with the maximum value on Day 20, RSV = 72). For this last earthquake, the EQI interest could have been “sustained” by another seismic event (7 km NNE of Ixtepec, Mexico, M = 6.1), which occurred on September 23, stimulating internet activity until 25 September. The earthquakes had wide coverage in the international media, thus nourishing the interest in EQI. Furthermore, the search interest should also be seen in light of the ethnic composition of the California population. In fact, according to the 2014 estimates, 12.5 million people of Mexican origin comprise California’s population [54]. Therefore, a more complex vicarious experience most likely influenced the triggering in online search. As defined above, vicarious experiences occur when a person is exposed to secondary sources of information about the disaster [55,56]. Thus, in the case of the September 2017 Mexican earthquakes, media, relatives, and friends acceptably guided the vicarious experience. However, according to what we discussed before, Hurricane Harley could also have contributed to fueling the interest in searching for EQI after the 2017 Mexican earthquakes. This would expand what other authors found, namely, that having frequent thoughts about earthquakes (natural hazards) induces more preparation and that distant but temporally close events can have positive effects on judgements about preparedness needs [56]. Moreover, since 26 September, when the direct effect of earthquake on EQI searches ended, a quite long period saw the interest to continue, even if in a discontinuous way (45 total days, from 26 September 2017 to 12 November 2017, of which 31 days with RSV > 0, mean RSV = 16, max RSV = 35, and total RSV = 473). The interest in the days following 12 November was then stimulated, for three days, by the 13 November Tres Pinos (CA) earthquake (M 4.6) and continued until the end of 2017 with another 24 days where a certain search volume can be noticed. Overall, 2017 saw the highest interest for EQI (RSV= 1855) over the entire period (2004–2021).
Interest continued in 2018 also without relevant earthquakes. In fact, the period saw 158 (44%) days with RSV > 0 and a total search volume equal to 63% of 2017, thus showing that people continued to search for earthquake insurance. This online behavior was also stimulated by some earthquakes of low–moderate magnitude that occurred in California, such as those that occurred on 5 April 2018 in Santa Cruz (M 5.3) and 4 July 2018 in Berkley (M 4.4).
Considering the online data of both 2017 and 2018, one might wonder whether searching for information and real preparedness actions involved a distinct process [57] or whether coverage underwritings followed online searches. Really, online search data are in good agreement with the number of policies signed both in 2017 and 2018 (Figure 6). In fact, 2017 saw an increase in the sales of policies with respect to the previous year of over 100,000, the highest annual increase in the 2002–2017 period (based on both the CEA and non-CEA contracts). In addition, approximately 270,000 more policies were taken out in 2018 than in 2017, the highest yearly increase ever recorded in the 2002–2020 period. The fact that the largest GT searchers were recorded in 2017 and not in 2018, the year in which the largest number of contracts were signed, does not seem inconsistent. In fact, the contracts signed in 2018 were probably the landing place of online searches carried out both in the last quarter of 2017, after the earthquakes in Mexico in September, and in 2018. From this point of view, the signing of contracts seems to derive, at least in part, from a mature judgement over the months, during which users probably acquired more in-depth information on coverage, how also suggest the related queries of which we discussed below. Therefore, the earthquakes in Mexico appear to have acted as a strong stimulus for increasing policy underwritings; thus, real actions followed intentions. However, the “drag effect” of Hurricane Harvey could also have acted in boosting preparedness motivation.
The occurrence of the Ridgecrest (Southern California) sequence began on 4 July 2019 with the culmination of the earthquake on 6 July 2019 (M 7.1). According to the USGS [58], the last event caused injuries to 5 people; 50 homes were structurally damaged, and 4 homes were damaged by fire from broken gas lines. Water lines were broken, and power outages occurred in the Ridgecrest-Trona area; additional cracks and landslides occurred on California State Route 178. Damage was estimated to be in excess of USD 100 million. The sequence produced effects on EQ from 4 to 7 July, with the maximum (100) on 6 July, and effects on EQI from 4 July (RSV = 20) to 11 July (RSV = 21), with the highest peak (RSV = 100) of the 18 years investigated occurring on the same day as the seismic event with the highest magnitude (M 7.1, 6 July), where also the highest peak in EQ interest was recorded.
After the Ridgecrest sequence, the next earthquakes that caused immediate EQI interest were two events that occurred on 15 October 2019. However, in a period of approximately three months between the Ridgecrest sequence and the two earthquakes of October 2019, approximately 50% of the days saw search volumes above zero, even without the spur of earthquake occurrence(s).
The Pleasant Hill, CA, M 4.5 and the Tres Pinos, CA, M 4.7 earthquakes that occurred on 15 October 2019 caused a relative spike of online interest in EQI. For the latter event, the interest lasted for four days, with RSV rising on the same Day 15 (RSV = 9), reaching a maximum (24) on Day 18 (24) and then zeroing on Day 19. Both the direct and vicarious experience of online users could have driven the increase in searches. The Community Internet Intensity Map of the Pleasant Hill earthquake drawn by the USGS [59] supports the hypothesis that online EQI searches may have been driven by earthquake experience of users. Indeed, about 46,000 people participated in reporting earthquake effects through the USGS website.
The 2019 online interest recorded the second highest search volume (RSV = 1356) of the 18 years. The data can be quite well connected to the increase in total policy underwritings (+73,717) recorded in 2019 in comparison with 2018, even if the amount of such contracts was only one-third of those recorded in 2018 (Figure 6). In any case, the yearly policy increase in 2019 was the fourth most important since 2009.
Overall, the correlations between the current insurance policy data and online earthquake insurance interest, already found in other national contexts, such as Italy [40], are in accordance with that line of research that analyses the effects of the communication of earthquake and earthquake risk, chiefly by media, showing the relationship between information dissemination and the people’s decision to buy a disaster policy [60,61].
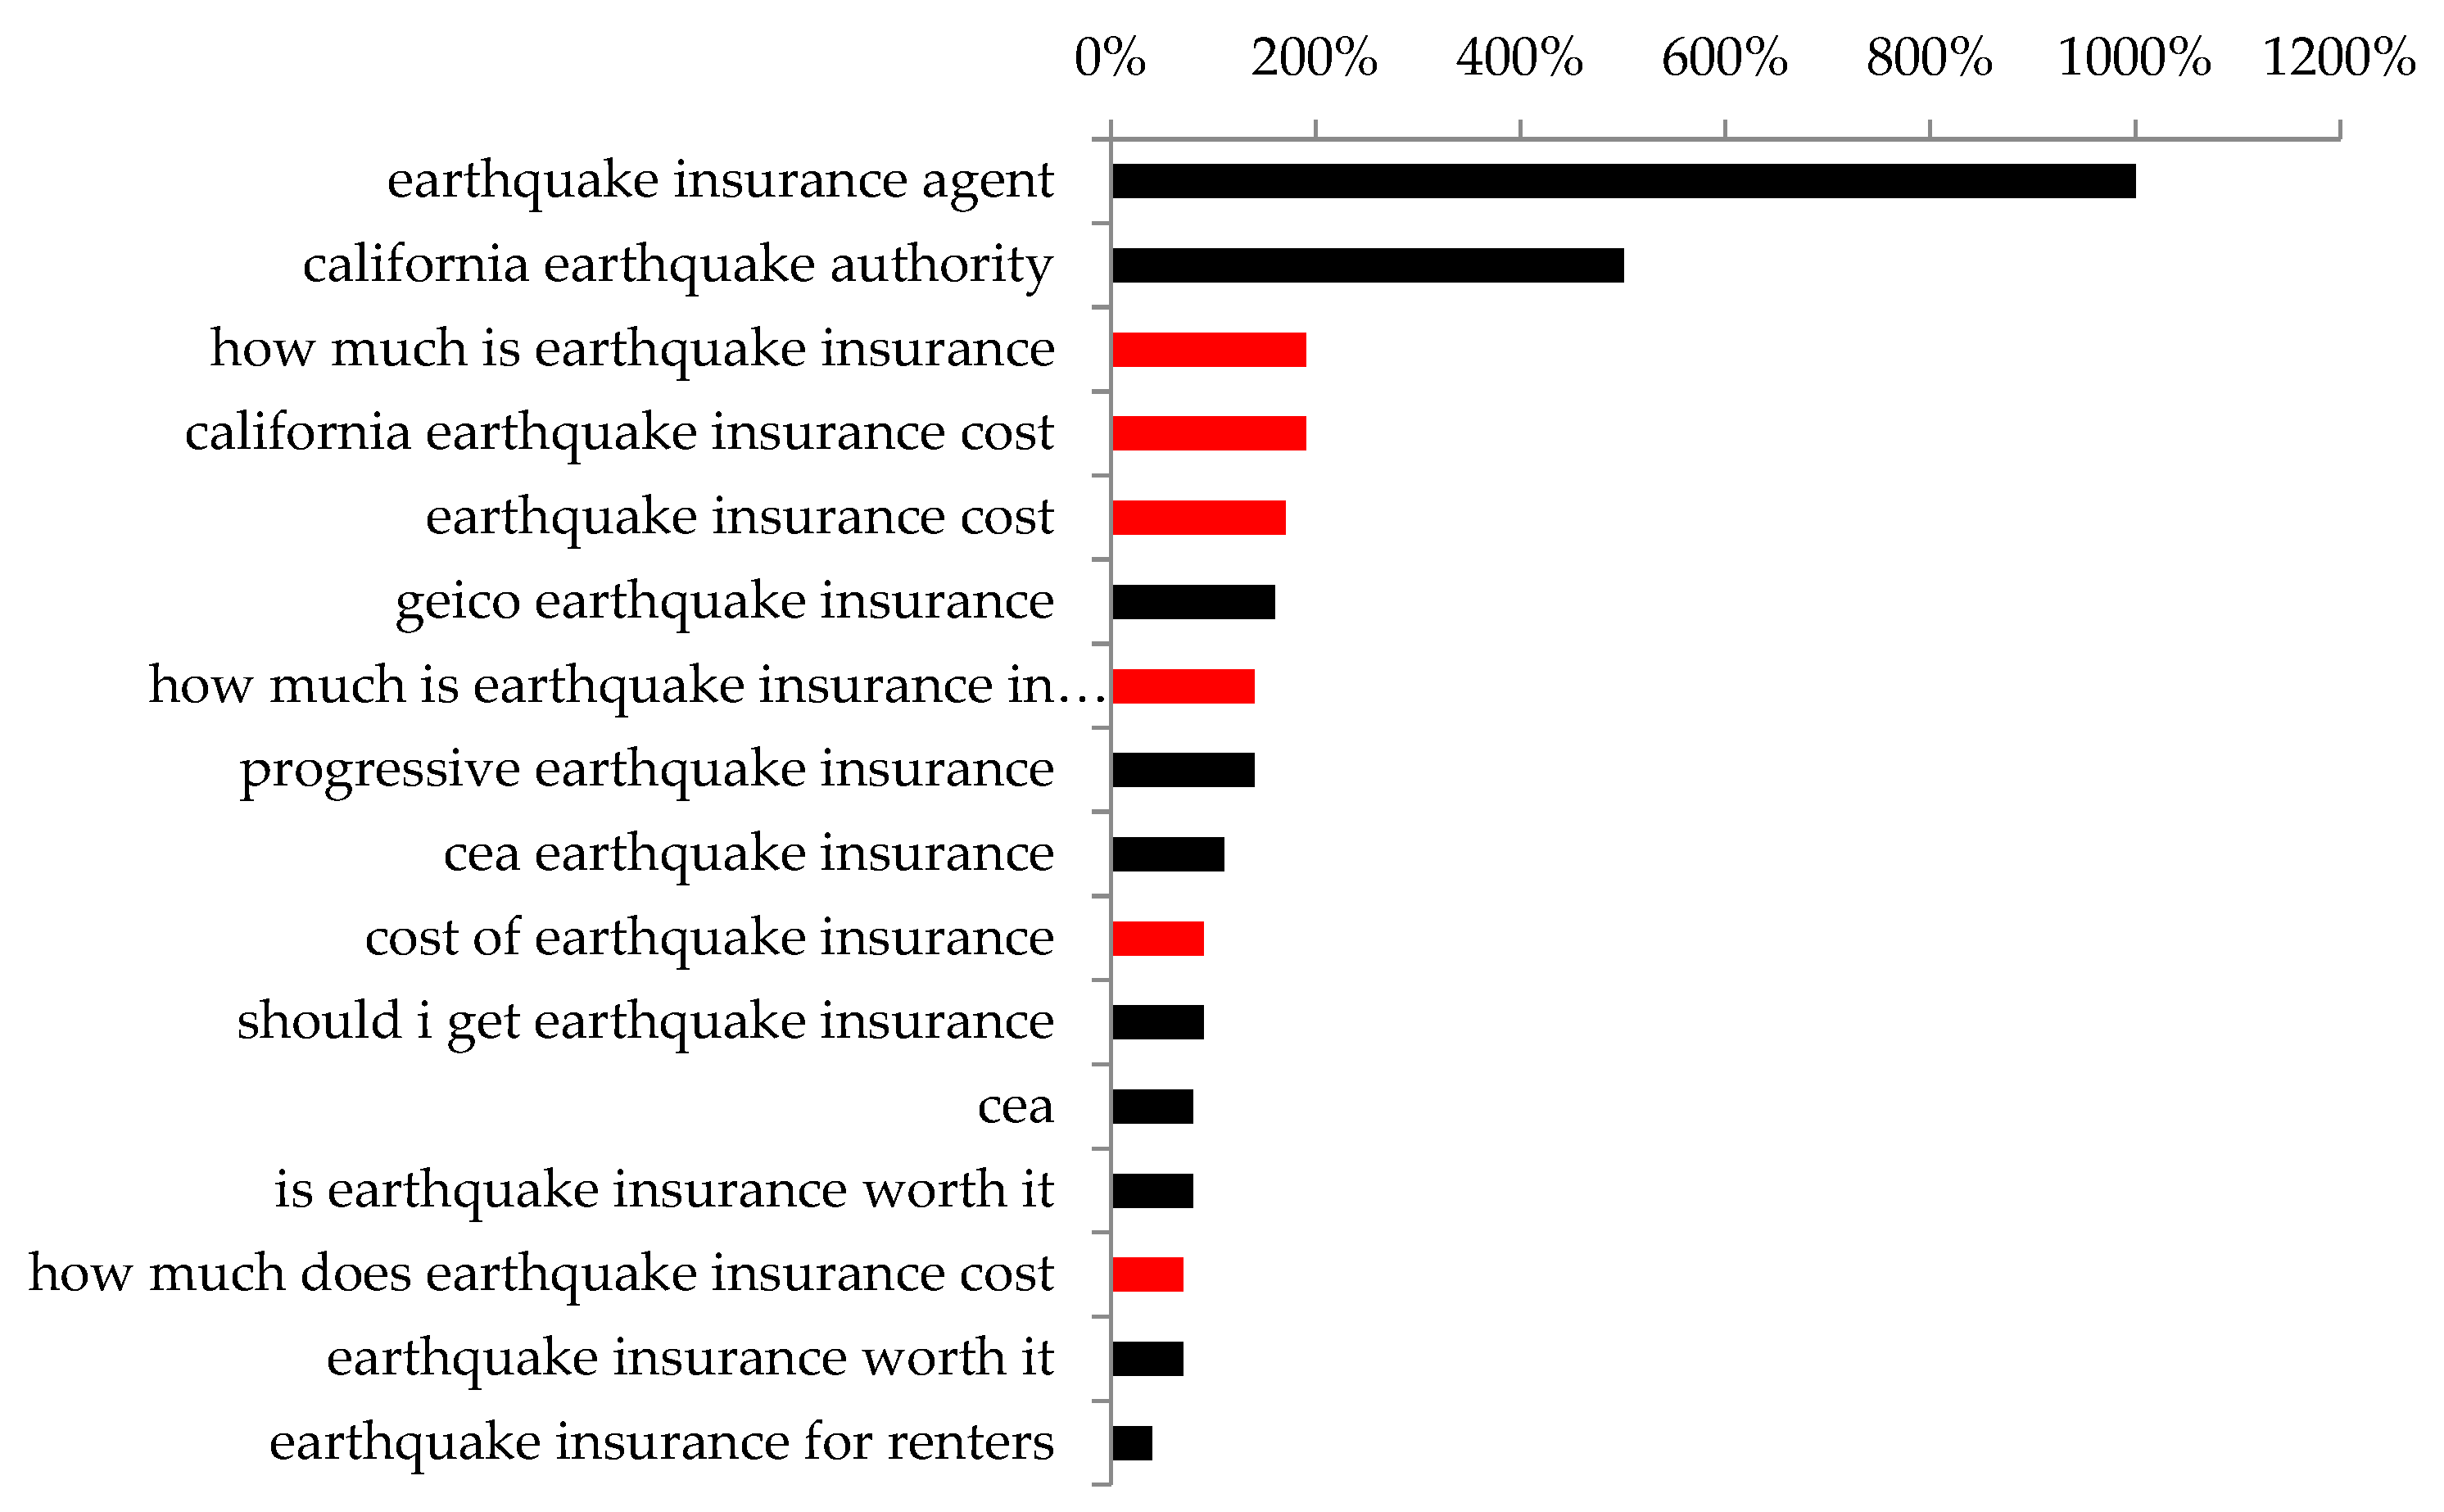
Supporting evidence of the deduction that the underwriting of policies likely followed the online searches is found in the GT-related queries of the third period (2016–2021) (Figure 8). From these, we can see that the searches with a sudden or high increase are those related to obtaining specific information, such as insurance agents and cost of coverage. Regarding the latter, the trigger of interest for insurance caused by the earthquake occurrences seems to have sustained the buying of policies, making less relevant the main obstacle to holding a policy in California, i.e., the price of the coverage [17]. However, considering high user interest in the price, stakeholders should also consider the issue in relation to the possible comparison between different insurers by buyers, thus attempting to overcome those institutional features of the California insurance market, which produce market friction able to prevent comparison shopping [62].
Beyond cost information, users also searched for additional information on insurance, attempting to understand whether coverage can be a suitable solution to compensate for losses. In this direction are the search terms such as ‘earthquake insurance California worth it’ or searches with the same meaning such as ‘should I get earthquake insurance’ (Figure 8). These entire consumer perspectives should be considered by suppliers of insurance when information and communication campaigns on earthquake insurance are planned, thus showing the pros and cons of coverage. This need is in line with what was found by some studies on the life and nonlife insurance sectors, which revealed that access to useful and accurate information is a key element for informed decision making [63] and that consumer awareness and understanding of insurance products are among the important tools to help consumers make better decisions [64].
In summary, GT data suggest that earthquakes and other natural hazards stimulate online interest in earthquake insurance through different typologies of user experiences, namely direct and vicarious. Most likely, real actions followed online interest in some cases with the underwriting of insurance contracts. Figure 9 shows the possible operative flow of internet users.

4. Conclusions, Perspectives and Limitations

This article analyzed the online interest in California on the topic of earthquake insurance. The search made use of Google Trends, the online tool that allows anyone to visualize and discover trends in people’s search behavior within Google Search. The analysis period covered all available whole years, from 2004 to 2021. For this period, we retrieved the monthly data and processed them to derive a daily trend over the 18 years.
The research showed that insurance interest varied greatly over time, increasing in particular during the third period (2016–2021). Numerous seismic events triggered and fed the online interest. These earthquakes originated both in California and contiguous areas as well as overseas, such as the 2011 Japan and 2017 Mexico events, thus connoting that interest of users was motived by both direct and vicarious earthquake experiences.
After the 2017 Mexico earthquakes, we observed a “drag effect” that lasted in time. Most likely, part of these online searches then merged into the sharp increase in contract underwriting recorded in real data for both 2017 and 2018. However, other natural hazards, such as Hurricane Harley, probably contributed to fueling the interest in insurance and the purchase of policies whose real data fit quite well with the GT search volumes over time.
The duration of the peak of interest varied from a minimum of one day to a maximum of one week, even though it can reach over three weeks for extreme natural events of particular magnitude and effects on the anthropic system, as occurred after the 2011 Japan earthquake–tsunami.
To benefit from the advantages and opportunities made available by (free) Big Data, it could be useful to arrange an observatory for monitoring online user behavior through GT to evaluate, especially in coincidence with or close to seismic events or other extreme natural events, how online behavior and interest in insurance change in California over time. Furthermore, the changes can also be monitored considering the metropolitan areas and cities, taking advantage of GeoMaps placed at the community’s disposal by Google Trends. In this way, stakeholders, policymakers, and insurance companies could set up more effective and targeted communication campaigns in the most appropriate geographic areas in a timely manner to grab the rise of interest on the subject. From this point of view, GT also suggests that users are interested in the costs of the policies, where to buy them, and the pros and cons of coverage.
However, this research has some limitations to which the readers have to be attentive. For example, the way in which GT generates data is not clear since GT does not supply comprehensive technical documentation. Furthermore, GT excludes repeated queries from the same users over a short time period to reduce the number of continuous searches. In addition, considering that GT supplies only relative volumes of searches, we cannot identify how many people truly searched for earthquake insurance; thus, we can only suppose the correlation between GT volumes and real data (insurance underwritings). Further research in the socioeconomic field through, for example, the administration of ad hoc questionnaires prepared for policyholders could solve these limitations. Therefore, while the research presented here provides positive and encouraging results, it is necessary to underline the need to perform interdisciplinary research efforts to reach the aim of taking full advantage of Big Data to support practical actions.

Author Contributions

Conceptualization, F.T.G.; methodology, F.T.G.; software, M.R.P.; validation, F.T.G.; formal analysis, F.T.G.; data curation, F.T.G., M.R.P.; writing—original draft preparation, F.T.G.; writing—review and editing, F.T.G.; visualization, F.T.G., M.R.P.; supervision, F.T.G.; All authors have read and agreed to the published version of the manuscript.

Funding

This research received no external funding.

Institutional Review Board Statement

Not applicable.

Informed Consent Statement

Not applicable.

Data Availability Statement

Data are available from the corresponding author on well-founded request.

Acknowledgments

This research did not receive any specific grant from funding agencies in the public, commercial, or not-for-profit sectors. The authors wish to thank two anonymous reviewers for their careful reading of the manuscript and their insightful comments and suggestions.

Conflicts of Interest

The authors declare no conflict of interest.

References

  1. Allan, R. Seconds before the big one. Sci. Am. 2011, 304, 74–79. [Google Scholar] [CrossRef] [PubMed]
  2. Ellsworth, W.L. Earthquake history, 1769–1989. In The San Andreas Fault System, California; Wallace, R.E., Ed.; Paper 1515; U.S. Geological Survey Professional: Washington, DC, USA, 1990; pp. 153–190. [Google Scholar]
  3. Wallace, R.E. General features. In The San Andreas Fault System, California; Wallace, R.E., Ed.; Paper 1515; U.S. Geological Survey Professional: Washington, DC, USA, 1990; pp. 3–12. [Google Scholar]
  4. Gizzi, F.T. Worldwide trends in research on the San Andreas Fault System. Arab. J. Geosci. 2015, 8, 10893–10909. [Google Scholar] [CrossRef]
  5. Toppozada, T.; Branum, D. California earthquake history. Ann. Geophys. 2004, 47, 509–522. [Google Scholar] [CrossRef]
  6. NOAA (National Oceanic and Atmospheric Administration). A Study of Earthquake Losses in the San Francisco Bay Area—Data and Analysis; A Report Prepared for the Office of Emergency Preparedness; U.S. Department of Commerce: Washington, DC, USA, 1972.
  7. Gladys, H.C.; Emmet, C. Denial of Disaster; Cameron and Co.: San Francisco, CA, USA, 1989. [Google Scholar]
  8. USGS. USGS Earthquake Catalogue. Interactive Map. Available online: https://earthquake.usgs.gov/earthquakes/search (accessed on 14 April 2022).
  9. European Commission. Green Paper on the Insurance of Natural and Man-Made Disasters. 2013. Available online: https://eur-lex.europa.eu/legal-content/EN/ALL/?uri=CELEX%3A52013DC0213 (accessed on 18 April 2022).
  10. United Nations. Paris Agreement. 2015. Available online: https://unfccc.int/process-and-meetings/the-paris-agreement/the-paris-agreement (accessed on 18 April 2022).
  11. Zanjani, G. Public Versus Private Underwriting of Catastrophe Risk: Lessons from the California Earthquake Authority. In Risking House and Home: Disasters, Cities, Public Policy; Quigley, J.M., Rosenthal, L.A., Eds.; Berkeley Public Policy Press: Berkeley, CA, USA, 2008; pp. 17–36. [Google Scholar]
  12. Marshall, D. An Overview of the California Earthquake Authority. Risk Manag. Insur. Rev. 2018, 21, 73–116. [Google Scholar] [CrossRef] [Green Version]
  13. Jones, L.; Aki, K.; Boore, D.; Celebi, M.; Donnellan, A.; Hall, J.; Harris, R.; Hauksson, E.; Heaton, T.; Hough, S.; et al. The magnitude-6.7 Northridge, California, earthquake of 17-January-1994. Science 1994, 66, 389–397. [Google Scholar]
  14. Kunreuther, H.; Roth, R. Paying the Price: The Status and Role of Insurance against Natural Disasters in the United States; Joseph Henry Press: Washington, DC, USA, 1998. [Google Scholar]
  15. Jaffee, D.M.; Russell, T. Behavioral Models of Insurance: The case of the California Earthquake Authority. University of California-Berkeley Working Paper. 2000, pp. 1–43. Available online: http://citeseerx.ist.psu.edu/viewdoc/download?doi=10.1.1.61.4972&rep=rep1&type=pdf (accessed on 10 September 2021).
  16. CEA (California Earthquake Authority). Our Financial Strength. Available online: https://www.earthquakeauthority.com/About-CEA/Financials/CEA-Financial-Strength (accessed on 13 April 2022).
  17. Pothon, A.; Gueguen, P.; Buisine, S.; Bard, P.Y. California earthquake insurance unpopularity: The issue is the price, not the risk perception. Nat. Hazards Earth Syst. 2019, 19, 1909–1924. [Google Scholar] [CrossRef] [Green Version]
  18. Kunreuther, H. Mitigating Disaster Losses through Insurance. J. Risk Uncertai. 1996, 12, 171–187. [Google Scholar] [CrossRef]
  19. Kunreuther, H.; Pauly, M. Neglecting Disaster: Why Don’t People Insure against Large Losses? J. Risk Uncertain. 2004, 28, 5–21. [Google Scholar] [CrossRef]
  20. Raschky, P.A.; Weck-Hannemann, H. Charity Hazard: A Real Hazard to Natural Disaster Insurance? Environ. Hazards 2007, 7, 321–329. [Google Scholar] [CrossRef] [Green Version]
  21. Schwarze, R.; Wagner, G.G. The Political Economy of Natural Disaster Insurance: Lessons from the Failure of a Proposed Compulsory Insurance Scheme in Germany. Eur. Environ. 2007, 17, 403–415. [Google Scholar] [CrossRef] [Green Version]
  22. Kunreuther, H.C.; Ginsberg, R.; Miller, L.; Sagi, P.; Slovic, P.; Borkan, B.; Katz, N. Disaster Insurance Protection: Public Policy Lessons; John Wiley: New York, NY, USA, 1978. [Google Scholar]
  23. Slovic, P. Perception of risk. Science 1987, 236, 280–285. [Google Scholar] [CrossRef] [PubMed]
  24. Palm, R.; Hodgson, M. Earthquake insurance: Mandated disclosure and homeowner response in California. Ann. Am. Assoc. Geogr. 1992, 82, 207–222. [Google Scholar] [CrossRef] [Green Version]
  25. Naoi, M.; Seko, M.; Sumita, K. Community rating, cross subsidies and underinsurance: Why so many households in Japan do not purchase earthquake insurance. J. Real Estate Financ. Econ. 2010, 40, 544–561. [Google Scholar] [CrossRef] [Green Version]
  26. Ge, J.; Zhao, J.; Nisar, S. New Consumers’ Perspective in Insuring Earthquakes. In Diversity of Managerial Perspectives from Inside China. Managing the Asian Century; Foo, C., Ed.; Springer: Singapore, 2016. [Google Scholar] [CrossRef]
  27. Gizzi, F.T.; Porrini, D.; De Masi, F. Building a Natural Hazard Insurance System (NHIS): The Long-lasting Italian Case. Sustainability 2021, 13, 12269. [Google Scholar] [CrossRef]
  28. Öhman, S. Previous Experiences and Risk Perception: The Role of Transference. J. Educ. Soc. Behav. Sci. 2017, 23, 1–10. [Google Scholar] [CrossRef] [Green Version]
  29. Becker, J.S.; Paton, D.; Johnston, D.M.; Ronan, K.R.; McClure, J. The role of prior experience in informing and motivating earthquake preparedness. Int. J. Disaster Risk Reduct. 2017, 22, 179–193. [Google Scholar] [CrossRef]
  30. Bronfman, N.C.; Cisternas, P.C.; Repetto, P.B.; Castañeda, J.V. Natural disaster preparedness in a multi-hazard environment: Characterizing the sociodemographic profile of those better (worse) prepared. PLoS ONE 2019, 14, e0214249. [Google Scholar] [CrossRef]
  31. Moon, J.-W.; Hwang, H.; Chung, J.-B. Factors affecting awareness of preparedness after moderate earthquakes. An analysis of the Pohang earthquake in Korea. Disaster Prev. Manag. 2019, 29, 405–420. [Google Scholar] [CrossRef]
  32. Lee, O. Science knowledge, world views, and information sources in social and cultural contexts: Making sense after a natural disaster. Am. Educ. Res. J. 1999, 36, 187–219. [Google Scholar] [CrossRef]
  33. Becker, J.S.; Paton, D.; Johnston, D.M.; Ronan, K.R. Salient beliefs about earthquake hazards and household preparedness. Risk Anal. 2013, 33, 1710–1727. [Google Scholar] [CrossRef]
  34. Carneiro, H.A.; Mylonakis, E. Google trends: A web-based tool for real-time surveillance of disease outbreaks. Clin. Infect. Dis. 2009, 49, 1557–1564. [Google Scholar] [CrossRef] [PubMed]
  35. Thakur, N.; Han, C.Y. Country-Specific Interests towards Fall Detection from 2004–2021: An Open Access Dataset and Research Questions. Data 2021, 6, 92. [Google Scholar] [CrossRef]
  36. Preis, T.; Moat, H.; Stanley, H. Quantifying Trading Behavior in Financial Markets Using Google Trends. Sci. Rep. 2013, 3, 1684. [Google Scholar] [CrossRef] [PubMed] [Green Version]
  37. Önder, I. Forecasting tourism demand with Google trends: Accuracy comparison of countries versus cities. Int. J. Tour. Res. 2017, 19, 648–660. [Google Scholar] [CrossRef]
  38. Thompson, J.J.; Wilby, R.L.; Matthews, T.; Murphy, C. The utility of Google Trends as a tool for evaluating flooding in data-scarce places. Area 2022, 54, 203–212. [Google Scholar] [CrossRef]
  39. Kam, J.; Park, J.; Shao, W.; Song, J.; Kim, J.; Gizzi, F.T.; Porrini, D.; Suh, Y.J. Data-driven modeling reveals the Western dominance of global public interest in earthquakes. Humanit. Soc. Sci. Commun. 2021, 8, 242. [Google Scholar] [CrossRef]
  40. Gizzi, F.T.; Kam, J.; Porrini, D. Time windows of opportunities to fight earthquake under-insurance: Evidence from Google Trends. Humanit. Soc. Sci. Commun. 2020, 7, 61. [Google Scholar] [CrossRef]
  41. Mavragani, A.; Ochoa, G. Google Trends in Infodemiology and Infoveillance: Methodology Framework. JMIR Public Health Surveill. 2019, 5, e13439. [Google Scholar] [CrossRef] [Green Version]
  42. FAQ about Google Trends Data. Available online: https://support.google.com/trends/answer/4365533?hl=en (accessed on 8 January 2022).
  43. PPIC (Public Police Institute of California). California’s Population. Available online: https://www.ppic.org/publication/californias-population/ (accessed on 5 February 2022).
  44. USCB United States Census Bureau. QuickFacts. Statistics on Population of California. 2021. Available online: https://www.census.gov/quickfacts/CA (accessed on 7 February 2022).
  45. USGS. ANSS Comprehensive Earthquake Catalog (ComCat). Available online: https://earthquake.usgs.gov/data/comcat/ (accessed on 2 April 2022).
  46. USGS. Seismic Hazard Map Showing the Intensity of Potential Earthquake Ground Shaking That Has a 2% Change of Occurring in 50 Years. 2016. Available online: https://d9-wret.s3.us-west-2.amazonaws.com/assets/palladium/production/s3fs-public/thumbnails/image/GroundShaking.jpg (accessed on 14 April 2022).
  47. Field, E.H.; Biasi, G.P.; Bird, P.; Dawson, T.E.; Felzer, K.R.; Jackson, D.D.; Johnson, K.M.; Jordan, T.H.; Madden, C.; Michael, A.J.; et al. Long-Term Time-Dependent Probabilities for the Third Uniform California Earthquake Rupture Forecast (UCERF3). Bull. Seismol. Soc. Am. 2015, 105, 511–543. [Google Scholar] [CrossRef] [Green Version]
  48. Lin, X. Feeling is believing? Evidence from earthquake shaking experience and insurance demand. J. Risk Insur. 2019, 87, 351–380. [Google Scholar] [CrossRef]
  49. CEA, California Earthquake Authority. Annual Legislative Reports, Years 2009–2020. Available online: https://www.earthquakeauthority.com/About-CEA/Annual-Legislative-Report (accessed on 10 February 2022).
  50. CEA, California Earthquake Authority. Audited Financial Statements. Years 2002, 2005–2008. Available online: https://www.earthquakeauthority.com/About-CEA/Financials/Financial-Statements (accessed on 10 February 2022).
  51. Craig, R.K. Harvey, Irma, and the NFIP. Did the 2017 Hurricane Season Matter to Flood Insurance Reauthorization? (23 February 2018). University of Arkansas at Little Rock Law Review, Forthcoming, University of Utah College of Law Research Paper No. 249. 2018. Available online: https://ssrn.com/abstract=3129088 (accessed on 20 February 2022).
  52. NOAA. Costliest U.S. Tropical Cyclones Tables Updated. 2018. Available online: https://www.nhc.noaa.gov/news/UpdatedCostliest.pdf (accessed on 26 January 2022).
  53. House Hearing, Assessing Fema’s Readiness for Future Disasters. Hearing before the Committee on Homeland Security on Homeland Security House of Representatives One Hundred Sixteenth Congress First Session. 2019. Available online: https://www.govinfo.gov/content/pkg/CHRG-116hhrg38302/html/CHRG-116hhrg38302.htm (accessed on 9 February 2022).
  54. PRC (Pew Research Center). Demographic and Economic Profiles of Hispanics by State and County. 2014. Available online: https://www.pewresearch.org/hispanic/states/state/ca (accessed on 3 February 2022).
  55. Breakwell, G.M. The Psychology of Risk; Cambridge University Press: Cambridge, UK, 2007. [Google Scholar]
  56. McClure, J.; Henrich, L.; Johnston, D.; Doyle, E.E. Are two earthquakes better than one? How earthquakes in two different regions affect risk judgments and preparation in three locations. Int. J. Disaster Risk Reduct. 2016, 16, 192–199. [Google Scholar] [CrossRef] [Green Version]
  57. Paton, D.; Smith, L.; Johnston, D. When good intentions turn bad: Promoting natural hazard preparedness. Aust. J. Emerg. Manag. 2005, 20, 25–30. [Google Scholar]
  58. USGS. M 7.1—2019 Ridgecrest Earthquake Sequence, Impact Summary. Available online: https://earthquake.usgs.gov/earthquakes/eventpage/ci38457511/impact (accessed on 27 April 2022).
  59. USGS. Community Internet Intensity Map for M 4.5-1km SSE of Pleasant Hill, CA. Map Processed 5 November 2021. 2021. Available online: https://earthquake.usgs.gov/earthquakes/eventpage/nc73291880/dyfi/intensity (accessed on 10 February 2022).
  60. Marti, M.; Stauffacher, M.; Matthes, J.; Wiemer, S. Communicating earthquake preparedness: The influence of induced mood, perceived risk, and gain or loss frames on homeowners’ attitudes toward general precautionary measures for earthquakes. Risk Anal. 2018, 38, 710–723. [Google Scholar] [CrossRef] [PubMed]
  61. Lindell, M.K.; Perry, R.W. Household adjustment to earthquake hazard: A review of research. Env. Behav. 2000, 32, 461–501. [Google Scholar] [CrossRef]
  62. Lin, X. Risk Awareness and Adverse Selection in Catastrophe Insurance: Evidence from California’s Residential Earthquake Insurance Market. J. Risk Uncertain. 2020, 61, 43–65. [Google Scholar] [CrossRef]
  63. Colón-Morales, C.M.; Giang, W.; Alvarado, M. Informed Decision-making for Health Insurance Enrollment: Survey Study. JMIR Form. Res. 2021, 5, e27477. [Google Scholar] [CrossRef] [PubMed]
  64. EU. Study on Consumers’ Decision Making in Insurance Services: A Behavioural Economics Perspective. Final Report. Specific Contract—No. 2014 85 08. Implementing Framework Contract—EAHC/2011/CP/01/LE. Prepared by London Economics, Ipsos and VVA Europe. Available online: https://european-union.europa.eu/ (accessed on 28 February 2022).
Figure 1. Number of documents per year related to Google Trends according to Scopus (analysis performed by the authors of this article in title-abstract-keywords fields, on 16 February 2022).
Bdcc 06 00060 g001
Figure 2. Comparison between the GT EQI GeoMap for the USA in 2004–2021 ((upper panel), modified from the original source), the seismic hazard map of the conterminous USA ((central panel), modified from the original source) [46], and the earthquakes occurred in the conterminous USA and surrounding areas, which are outside the conterminous USA in 2004–2021 (M ≥ 5.0) [45] (lower panel). In the GeoMap, darker shades indicate the states where the EQI searches were more frequent. Therefore, the states where online search was the highest were CA = 100; UT = 70; WA = 66; AK = 60; OR = 53; OK = 41; MO = 25; NV = 25; KS = 22. The seismic hazard map (central panel) shows the intensity (MMI scale) of potential earthquake ground shaking that has a 2% probability of occurring in 50 years.
Bdcc 06 00060 g002
Figure 3. GeoMap of interest for earthquake insurance in California metropolitan areas over the entire time span (2004–2021, GeoMap modified from the original source).
Bdcc 06 00060 g003
Figure 4. GT daily search interest (2004–2021) for earthquake insurance (upper panel) and earthquake (lower panel).
Bdcc 06 00060 g004
Figure 5. Earthquakes and other natural hazards causing direct rising of GT search interest in earthquake insurance in California; (upper panel) worldwide overview, the circles show the earthquakes; the star identifies the Hurricane Harvey landfall in Texas. The dashed box identifies the enlarged area in the figure below; (lower panel) California overview. The earthquakes were plotted on the California population density map based on United States Census Bureau for 2010 (https://www.worldofmaps.net/ accessed on 20 February 2022).
Bdcc 06 00060 g005
Figure 6. Yearly number of residential earthquake policies from 2002 to 2020. Elaboration of the authors of this article from the CEA data [49,50]. For the period before 2009, the data refer only to the CEA subscriptions. Data for 2003 and 2004 are not available in the sources consulted.
Bdcc 06 00060 g006
Figure 7. Search results (screenshot) for GT “flood insurance” topic in California during the time span of five years (2017–2021). Due to the time window length, search volumes are plotted weekly. The highest peak (100) was recorded in the week 27 August–2 September 2017, during or in the aftermath of Hurricane Harvey landfall. However, according to what we noticed for online attention in EQI and EQ, the searches in flood insurance started reasonably at the beginning of the week, in close temporal relationship with the occurrence of flooding.
Bdcc 06 00060 g007
Figure 8. GT-related queries (rising option) for 2016–2021 (III period). In red, the queries having the same meaning (cost of coverage).
Bdcc 06 00060 g008
Figure 9. Possible operative flow for internet users interested in earthquake insurance.
Bdcc 06 00060 g009
Table 1. Google Trends interest in earthquake insurance in California. The main statistical data for the whole time span and for each of three periods.
PeriodYearsTotal DaysTotal RSV Days RSV = 0% Days RSV = 0% Days RSV > 0
Whole2004–2021657413,49050407723
I2004–2009219122672023928
II2010–20152191384917187822
III2016–20212192737312995941
Table 2. Spearman rank correlation and Pearson linear correlation between (1) GT earthquake insurance and GT earthquake daily data; (2) GT earthquake and the magnitude of earthquakes (M ≥ 5.0) occurred in California and bordering areas; (3) GT earthquake insurance and the magnitude of earthquakes occurred in California. In cases of more than one earthquake the same day, the highest magnitude was considered.
PeriodYearsSpearman
(1)
Pearson
(1)
Spearman
(2)
Pearson
(2)
Spearman
(3)
Pearson
(3)
I2004–20090.050.120.110.250.070.11
II2010–20150.08 0.180.110.260.050.07
III2016–20210.080.470.130.420.120.35
Table 3. Criteria followed to attribute the level of online attention for earthquake insurance.
RSV RangeLevel of Attention
1–25Low (L)
26–50Moderate (M)
51–75High (H)
76–100Very High (VH)
Table 4. Main earthquakes and other natural hazards causing interest rise on earthquake insurance. For each event, the class of interest is attributed both to the day of the highest peak and the whole period in which the increase of RSV was recorded. For the whole periods, the class was attributed considering the mean value of the daily search interest.
PeriodEvent DateTriggering EventEpicentral/
Affected Area
Magnitude/
Category
Period of Interest (days)Days RSV = 0RSV
(min, max, mean)
Level of Interest in the Highest RSV DayLevel of Interest of the Period
I16 June 2005EQ4 km NE of Yucaipa, CA4.91034,34,34MM
I2 September 2005EQ13 km WNW of Calipatria, CA5.12034,62,48HM
I15 August 2007EQ41 km SW of San Vicente de Cañete, Peru8.01018,18,18LL
I31 October 2007EQ6 km NNE of East Foothills, CA5.5206,20,13LL
II27 February 2010EQ36 km WNW of Quirihue, Chile8.8307,16,10LL
II4 April 2010
5–7 April
EQ12 km SW of Delta, B.C., MX;
Eqs close to Ocotillo
7.2
5.0 (max)
2018,19,18LL
II11 March 2011EQ2011 Great Tohoku Earthquake, Japan9.11760,39,21ML
II20,21 October 2011EQ2 km,1 km SE of Berkeley, California4.0
3.8
6010,11,13LL
II24 May 2013EQ2 km NNE of Canyondam, CA5.72010,12,11LL
II15 January 2014EQ5 km NNE of Fontana, CA4.4406,15,10LL
II29 March 2014EQ2 km NW of Brea, CA5.15012,22,17LL
II24 August 2014EQSouth Napa, CA6.0810,32,18ML
III21 July 2015
25 July, 2015
EQ3 km of Freemont, CA
1 km of Fonfata, CA
4.0
3.8
408,15,10LL
III16 April 2016EQ27 km SSE of Muisne, Ecuador7.8610,16,9LL
III25–31 August 2017HURHurricane Harvey (TX-LA)48010,29,21ML-M
III8 September 2017EQnear the coast of Chiapas, Mexico8.2808,55,26HM
III19 September 2017EQ1 km S of Matzaco, Mexico7.17011,72,39HM
III13 November 2017EQ18 km SSE of Tres Pinos, CA4.6306,11,11LL
III4 Jan 2018EQ2 km SE of Berkley, CA4.42012,24,18LL
III5 April 2018EQ29 km SW of S. Cruz Is, CA5.3307,16,12LL
III8 May 2018EQ11 km N of Cabazon, CA4.52020,20,20LL
III29 August 2018EQ4 km N of La Verne, CA4.42012,12,12LL
III4 July 2019
6 July 2019
EQRidgecrest Earthquake Sequence, CA6.4
7.1
8020,100,43VHM
III15 October 2019EQTres Pinos, CA
Pleasant Hill, CA
4.7
4.5
409,24,14LL
III4 April 2020EQ17 km ESE of Anza, CA4.9205,11,8LL
III22 April 2020EQ1 km S of View park-Wind. Hills, CA3.72014,14,14LL
III24 June 2020EQ18 km SSE of Lone Pine, CA5.83017,17,17LL
III30 July 2020EQ1 km SE of Sylmar, CA4.22011,21,16LL
III3 August 2020EQ3 km SW of Yorba Linda, CA3.5405,15,10LL
III19 September 2020EQ3 km WSW of South El Monte, CA4.5704,13,7LL
III5 April 2021EQ2 km E of Lennox, CA4.0505,15,8LL
III8 July 2021EQAntelope Valley, CA6.0206,23,14LL
III18 September 2021EQ2 km E of Carson, CA4.3404,24,11LL
Publisher’s Note: MDPI stays neutral with regard to jurisdictional claims in published maps and institutional affiliations.