Article

Gambling Strategies and Prize-Pricing Recommendation in Sports Multi-Bets

1
Department of Mathematics, Bar-Ilan University, Ramat Gan 5290002, Israel
2
Faculty of Engineering, Bar-Ilan University, Ramat Gan 5290002, Israel
3
The Institute of Nanotechnology and Advanced Materials, Bar-Ilan University, Ramat Gan 5290002, Israel
*
Author to whom correspondence should be addressed.
Big Data Cogn. Comput. 2021, 5(4), 70; https://doi.org/10.3390/bdcc5040070
Submission received: 10 October 2021 / Revised: 10 November 2021 / Accepted: 24 November 2021 / Published: 29 November 2021

Abstract

:
A sports multi-bet is a bet on the results of a set of N games. One type of multi-bet offered by the Israeli government is WINNER 16, where participants guess the results of a set of 16 soccer games. The prizes in WINNER 16 are determined by the accumulated profit in previous rounds, and are split among all winning forms. When the reward increases beyond a certain threshold, a profitable strategy can be devised. Here, we present a machine-learning algorithm scheme to play WINNER 16. Our proposed algorithm is marginally profitable on average in a range of hyper-parameters, indicating inefficiencies in this game. To make a better prize-pricing mechanism we suggest a generalization of the single-bet approach. We studied the expected profit and risk of WINNER 16 after applying our suggestion. Our proposal can make the game more fair and more appealing without reducing the profitability.

1. Introduction

The current rise of big data has dramatic implications on almost all aspects of modern life. Data are accumulated in an unprecedented way, and tools to analyze these data are continuously developed. Two fields significantly benefiting from this are finance and sports [1]. In particular, professional sport has become more data-driven and quantitative. Although traditionally sports statistics were collected in an aggregated fashion, now all sorts of data are recorded with great specification on the individual level, with high spatial and temporal resolution. The overwhelming amounts of data, along with means to access and analyze them, make testing quantitative hypotheses possible [2,3,4,5,6].
Sports betting is a financial product that rewards gamblers according to the risk they take. In traditional financial markets, there is an extensive and detailed documentation of transactions and price fluctuations that affect the market. In recent years, sports betting is closing the gap and more high frequency and high-quality data are available to the public. Despite the similarities between financial markets and sports betting, there are important characteristics that differentiate between them. The biggest difference is the legal issue; In sports betting there are countries that limit the age of participants, countries that forbid citizens to gamble on websites of other countries, and countries that forbid any online gambling. However, in most financial markets, these limitations do not exist. Moreover, in financial markets traders can essentially buy or sell any legal product without restrictions, as long as there is a counter trader that is willing to trade with them. This free market boosted the field of Fin-tech in which there are high frequency trading and automatic exploitation of arbitrages and market temporary inefficiencies [7]. In contrast, in most jurisdictions sports betting houses save their participants’ information and share it with other betting agencies, so that trading simultaneously in different betting houses is not possible.
Another difference is trading fees. In financial markets, fees collected by the clearing houses are particularly low (usually <1%) [8]. In sports betting, every betting house has its own fees, which normally are much higher, for example the betting houses William Hill and Bet365 have an average fee of ∼10% or a bit higher.
Gambling houses exploit the available data to create new kinds of bets, such as which team will score the first goal, which team will foul first, how many goals will be scored in the second half etc. Smart money gamblers on their part, explore these data to develop and test betting strategies, ranging from rule-based [9] through analytical portfolio management [10] to artificial intelligence [11,12,13,14].
Sports betting games are usually derived from the outcome probability. In Israel, however, the “Winner” betting house created a soccer gambling game called “Winner 16” that is not outcome-derived but rather resembles a lottery game in some aspects. Winner 16 is a soccer betting game that offers betting on predetermined 16 games, picked by the Winner betting house. To participate, one must fill one or more forms costing 3 NIS each. The Winner 16 game has several prize categories: the first prize is for correctly guessing the outcomes of all 16 games, the second prize is for 15 out of 16 correct guesses, the third prize is 14 out of 16 and so on down to 12 out of 16. The prizes in WINNER 16 are fixed in their distributions, meaning that the sum of all prizes is 42 % of the total income, where 63 % of that is dedicated to the 1st prize (guessing all 16 games correctly) and the 37 % to all other prizes (12–15 correct guesses). In case there is no winner in one or more of the categories in a specific week, the money from the current round accumulates to following rounds. In case more than one gambler won a specific category, the prize is divided equally between the winning gamblers. Since there is no connection between the prizes and the probability of winning them, there is a “sweet spot” that may change the expected profit of the gamblers to positive and determine our approach to gamble this game/round. Winner 16 is open for online participation to gamblers from across the globe.
Wisdom of crowds is a phrase that reflects the thought that large groups of individuals are collectively smarter than professional experts [15]. In sports, the wisdom of crowds is expressed for example in predicting the results of football games using Twitter [16]. Another example is the market of betting odds. Gambling houses set initial odds based on internal expert evaluation. As new bets are placed, the gambling houses change the betting odds in a way that hedges themselves. An implicit assumption of this mechanism is that the wisdom of crowds will drive the betting odds towards the best estimation for this game, i.e., the hypothesis is that the wisdom of crowds converges the betting odds to the most accurate estimations. Accurate estimation of the betting odds results in an efficient sports betting market. Of note, information such as player injury, illness, weather conditions, etc. as well as action taken on both sides of the line factor into the tightening of betting lines as the date of play for events approach. Here, we first study this exact point by analyzing big data sets of sports gambling. We then explore strategies that build upon the wisdom of crowds to invest in multi-bets. Finally, we propose a generalization of the prize-pricing approach of single bets into multi-bets.

2. Materials and Methods

2.1. Data Processing

The information from the various websites was downloaded using a Python code using the phantomjs package [17], to deal with javascripts that prevented us from downloading data. Data were collected for the period of June 2011–January 2017, which were available on the website. Data processing was performed using the statistical software R. Rounds that had non-complete information such as less than 16 games indicated, clear confusion in the prize table, or ambiguity of the listed games were omitted from the analysis. All together these incomplete rounds summed to 144 rounds out of the 312 rounds that took place during that period, leading to a dataset of 168 complete rounds. Of these, 16 rounds were missing data for the prizes, which resulted in a complete dataset of 152 rounds. The code is available upon request.

2.2. Defining and Labeling Profitable Rounds

To determine the prize sizes in our simulations, we had to take into account the effect of the additional forms that were considered in each simulation. Adding more forms in a specific round affects the prizes in two ways: (1) WINNER’s income increases, leading to an increase in the pool of money allocated to future prizes. (2) The prize sizes are influenced by the number of winning forms. Hence the prizes considered in our simulations were adjusted according to these two effects.

3. Results

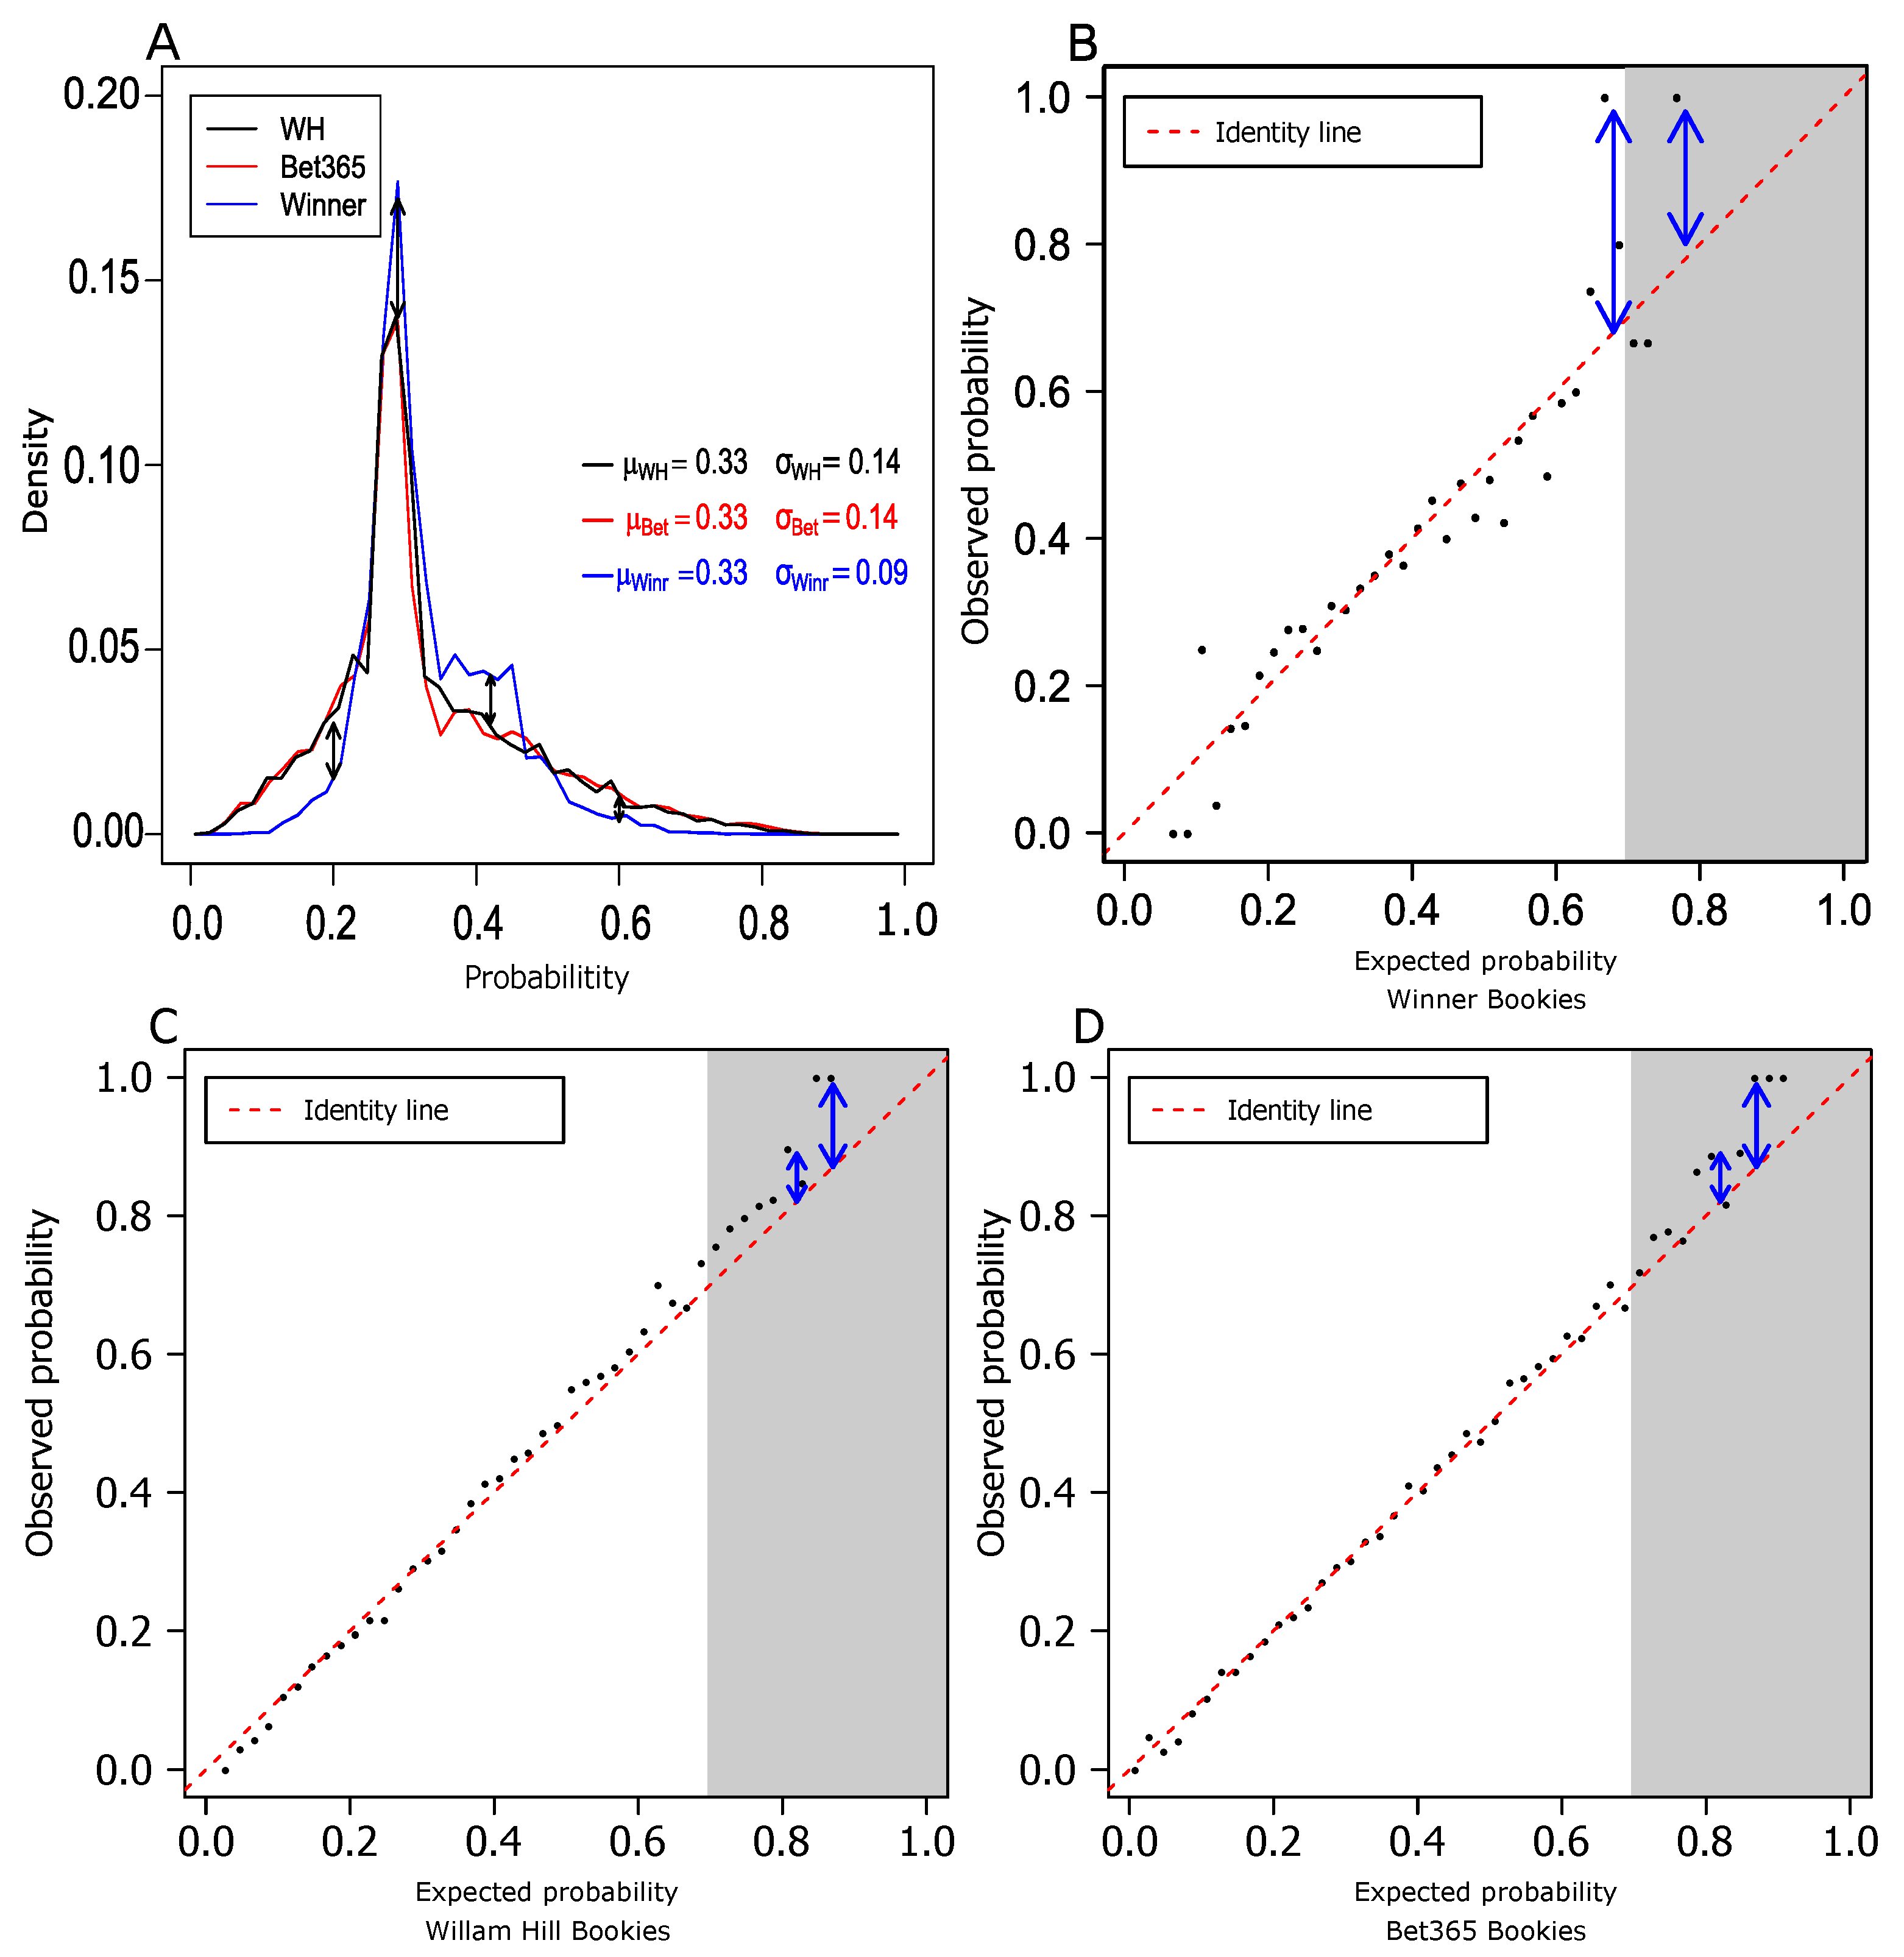
3.1. Market Efficiency of Single Bets

Market efficiency is defined as a situation in which prices reflect the information available to all competitors. In these situations, there is an equilibrium price, so that excess profit cannot be gained by applying a certain strategy by one of the competitors [18]. Sports betting provides an ideal setup to examine market efficiency [9,19]. In sports betting, the results for a single game are categorical (Home, Draw, Away), making it straight forward to study market efficiency of single game bets. In particular, we are interested in assessing whether the betting odds prior to the games reflect the end results of these games. For this purpose, we collected betting odds and final results of 44,671 games from three betting houses (see methods). The probabilities for given results were calculated as the inverse of the corresponding betting odds after taking into account the betting fees [20]:
P ( x ) = 1 b r ( x ) x 1 b r ( x ) ; x { H o m e , D r a w , A w a y } ,
where b r ( x ) is the betting odds for x in a specific game.
Figure 1A shows the probability distribution of single game bets. It is evident that WINNER’s bets are more concentrated on non-extreme probabilities and have less support for low and high probability bets. Indeed, we found that WINNER’s distribution is different from the other two in a statistically significant manner (see Supplementary Materials).
When the differences between the observed probabilities and the expected are larger than the combination of betting fees and standard deviations of the observations, there is an inefficiency in the market that in principle can be exploited by an investment strategy. In all gambling houses, bets that have high expected probabilities (>0.7, shaded areas in Figure 1B–D) show hints of potential inefficiencies (see blue arrows in Figure 1B–D). To test whether these deviations could indeed be profitable, we applied an approach inspired by the Kelly strategy [10], as detailed below.

3.2. Single-Bet Gambling Profitable Strategy Is Hard to Find
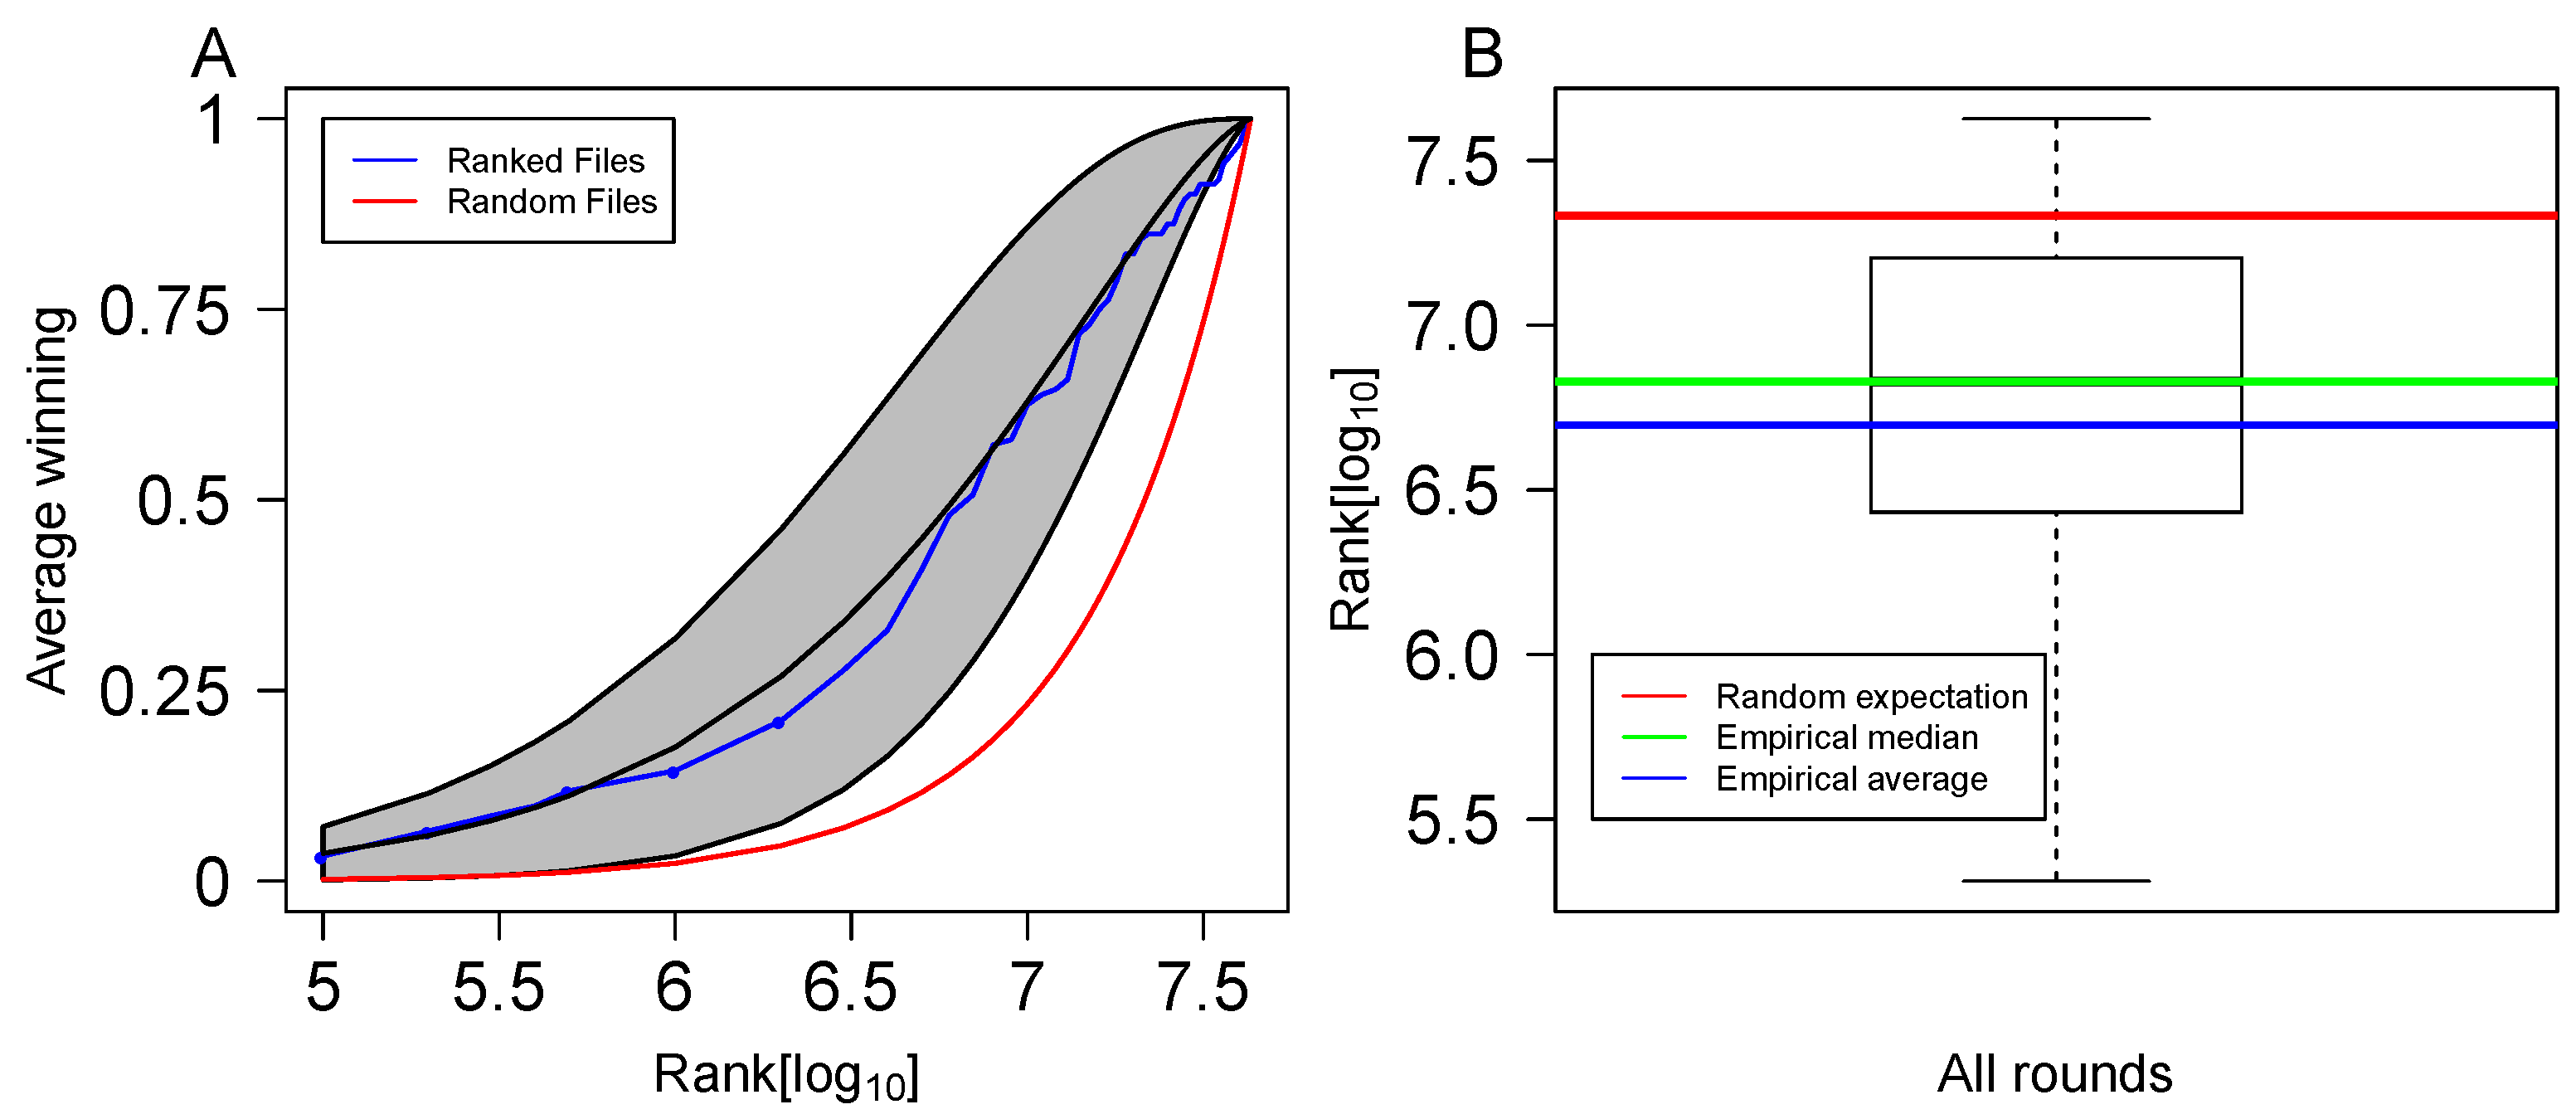
To build a profitable gambling strategy for single bets, we selected parameter regimes in which we can expect a profit, i.e., the expected probability is lower than the observed (Figure 1B–D). The Kelly strategy uses a portfolio that finances itself [21]. It starts with initial capital and does not add money to or subtract money from the cumulative amount. The only free parameter in this strategy is the fraction of wealth that is invested in the current bet. In sports bets, if the entire portfolio is invested in a single bet, one loss is enough to lose all the accumulated wealth. To find F * , the optimal fraction of the portfolio to be invested in a single bet, we applied Kelly’s formula [10]: F * = ( p · d q ) / d , where p is the expected probability of the result to occur, q is the complement of this probability ( q = 1 p ), and d is the net gain in USD on a 1 USD investment. We applied this strategy with p = ( 1 + p ^ ) 2 where p ^ is the expected probability for the bet (Equation (1)), and it allows control of the losses [22]. This strategy did not yield a significant profit (data not shown). Moreover, following [9], we split the bets into two classes: home and away, and applied the Kelly strategy to each of these classes separately. Additionally, here the strategy was not profitable. The failure to construct a profitable strategy for single bets is a result of the relatively high fees and the sparseness of bets with extreme probabilities. This failure does not allow us to reject the hypothesis that the single-bet gambling market is efficient.

3.3. Form Ranking

After failing to reject the market efficiency hypothesis for single bets, we developed a form ranking algorithm that uses single game probabilities in the context of WINNER 16. The form ranking algorithm is based on single game probabilities with the assumption of independence between games. In a 16-game bet such as WINNER 16, there are 3 16 = 43,046,721 possible forms. These forms were ranked according to their probability of winning the big prize. The probability of each form to win the big prize is simply the product of the single game probabilities composing this form. The top ranked form was determined as the set of the most likely single game results, while the bottom one was calculated as the set of the least likely single game results. Figure 2 illustrates the ranking method.
To assess the form ranking algorithm on real data, we collected and processed 152 WINNER 16 rounds over a period of 5 years. We then applied the ranking algorithm to these data, and obtained 152 ranked lists of 3 16 forms each. After ranking the possible forms for each round, the next step was to decide how many forms should be submitted in each round. On the one hand, we want to send the highest-ranking forms, to improve the chances of winning the big prize in one of the submitted forms. On the other hand, the financial cost of purchasing additional forms has a strong effect on the potential profit by increasing the cost of the strategy. To address this issue, we estimated the expected profit/loss for varying values of the number of forms submitted in a round (N; see Figure 3).
Figure 3 shows the number of rounds in which the strategy obtained the first prize and the mean profit per round for varying values of N. Figure 3A shows the results for 10 3 N 10 7 , and we can see that the number of profitable rounds (yellow circles) is peaked around 10 6 . Figure 3B zooms in on 4 · 10 5 N 2 · 10 6 , verifying that indeed N = 10 6 yields the largest number of profitable rounds. Nevertheless, for all these strategies the average profit per round over all rounds is negative, due to the form costs. To address this, we added a step in which we attempt to choose smartly rounds on which to apply our algorithm.

3.4. Choosing the Best Rounds to Bet

As shown above, applying the form ranking strategy is not profitable if applied to all rounds. To improve our approach, we added a step in which machine-learning (ML) methods are applied to pre-select the more profitable rounds. A successful classifier can help us to decide whether we should bet or not in a given round. For this, we explored many ML algorithms including models that are easier to interpret such as logistic regression and decision trees, as well as more implicit models such as SVM applied to PCA space as described below.

3.4.1. Feature Extraction and Engineering

To classify rounds into profitable and non-profitable, we applied ML classification methods. We optimized the ML classification with a repeated cross validation scheme, in which 60% of the data were randomly chosen and used to train the model, 20% were used to test it, and the remaining 20% were used to validate our results and assess model profitability. This random division of the data was repeated 100 times, and in each division the modified betting strategy was assessed on the test data. The features that were considered for the classification models were all derived from the individual game betting probabilities. For each game there are three probabilities, Home, Draw, or Away, but since the sum of these probabilities is 1, we used only the top two probabilities from each game. From these 2 · 16 = 32 features we engineered eight new features to sum up to 40 features that were the input of the model. The engineered features were the sum of the top 10 probabilities in the top ranked form (SMP10), the product of the top 10 probabilities in the top ranked form (PMP10), F100K, F200K, F500K, F1M, and F2M. The F100K-F2M features were derived from the ranked list of forms in the following way: FN is the sum of the probabilities of the top N forms to win the big prize (N ∈ {100 K, 200 K, 500 K, 1 M, 2 M}). Figure 4A visualizes these features and shows the additional information that is incorporated in the ranked list of forms, compared to a random strategy. For a given prize, the higher FN is, the better it is to invest in that round by filling the top forms. Figure 4B shows another example of the superiority of the ranked form strategy over a random strategy. Without taking into account the individual game probabilities, the winning form should be ranked on average 3 16 2 21.5 M (red line in the figure). With the ranked form algorithm, it is ranked 8 M on average (blue line in the figure).

3.4.2. Model Selection

Six classification models were considered, namely logistic regression, SVM with linear kernel, decision tree, SVM with radial basis function (RBF) kernel, Random Forest, and Xgboost. These models were applied to PCA and tSNE transformed data. The number of principle components was chosen to explain 80% of the total variance. The fraction of profitable rounds is relatively small. For example, ∼7.5% of the rounds are profitable when 200 K forms are filled. This leads to an imbalanced setup. To overcome it we used down-sampling and ROSE [23].
To choose the best model, we used the same cross validation setup: the data were split into train (60%), test (20%), and validation (20%) sets. This division was repeated randomly 100 times. The models were compared according to their recall calculated from the results of the test sets. All combinations of models, and dimensionality reduction were assessed on the test sets of all random divisions of the data. The performance of the best model applied to the test sets, was assessed on the validation sets. The best results were obtained by a Random Forest model with 10 trees, while using ROSE to re-balance the data.
The results of the chosen model are presented in Figure 5 for 100 simulations of 30 rounds (∼half a year). Figure 5A shows an example of a typical simulation of a 200 K form strategy. In this simulation, the algorithm did not place a bet in 16 rounds, and was profitable in only two rounds out of the 30. The total amount of wealth gained in this simulation is ∼256 K.
Figure 5B shows the profit distribution of single rounds in which the model output was to place a bet. In many simulated rounds the algorithm was not profitable (92% of the rounds), and despite the relatively long positive tail of the distribution, the average profit per round was not positive for 200 K forms. The mean profit per round of all simulations as a function of the number of submitted forms is shown in Figure 5C.
The model’s profitability monotonically decreases with the number of submitted forms. However, as opposed to the situation in which all rounds were counted (Figure 3), here the decrease in profitability is extremely mild until 500 K forms. In fact, in the classification mechanism developed here, submitting 100 forms per round was profitable and yielded more than 100 % profit. Moreover, the borderline profitability of the models of <500 K submitted forms indicates that the model could be improved and may cross the profitability threshold, should the model be trained on more data.

3.5. Proposed Fair Prize-Pricing Mechanism in Multi-Bets

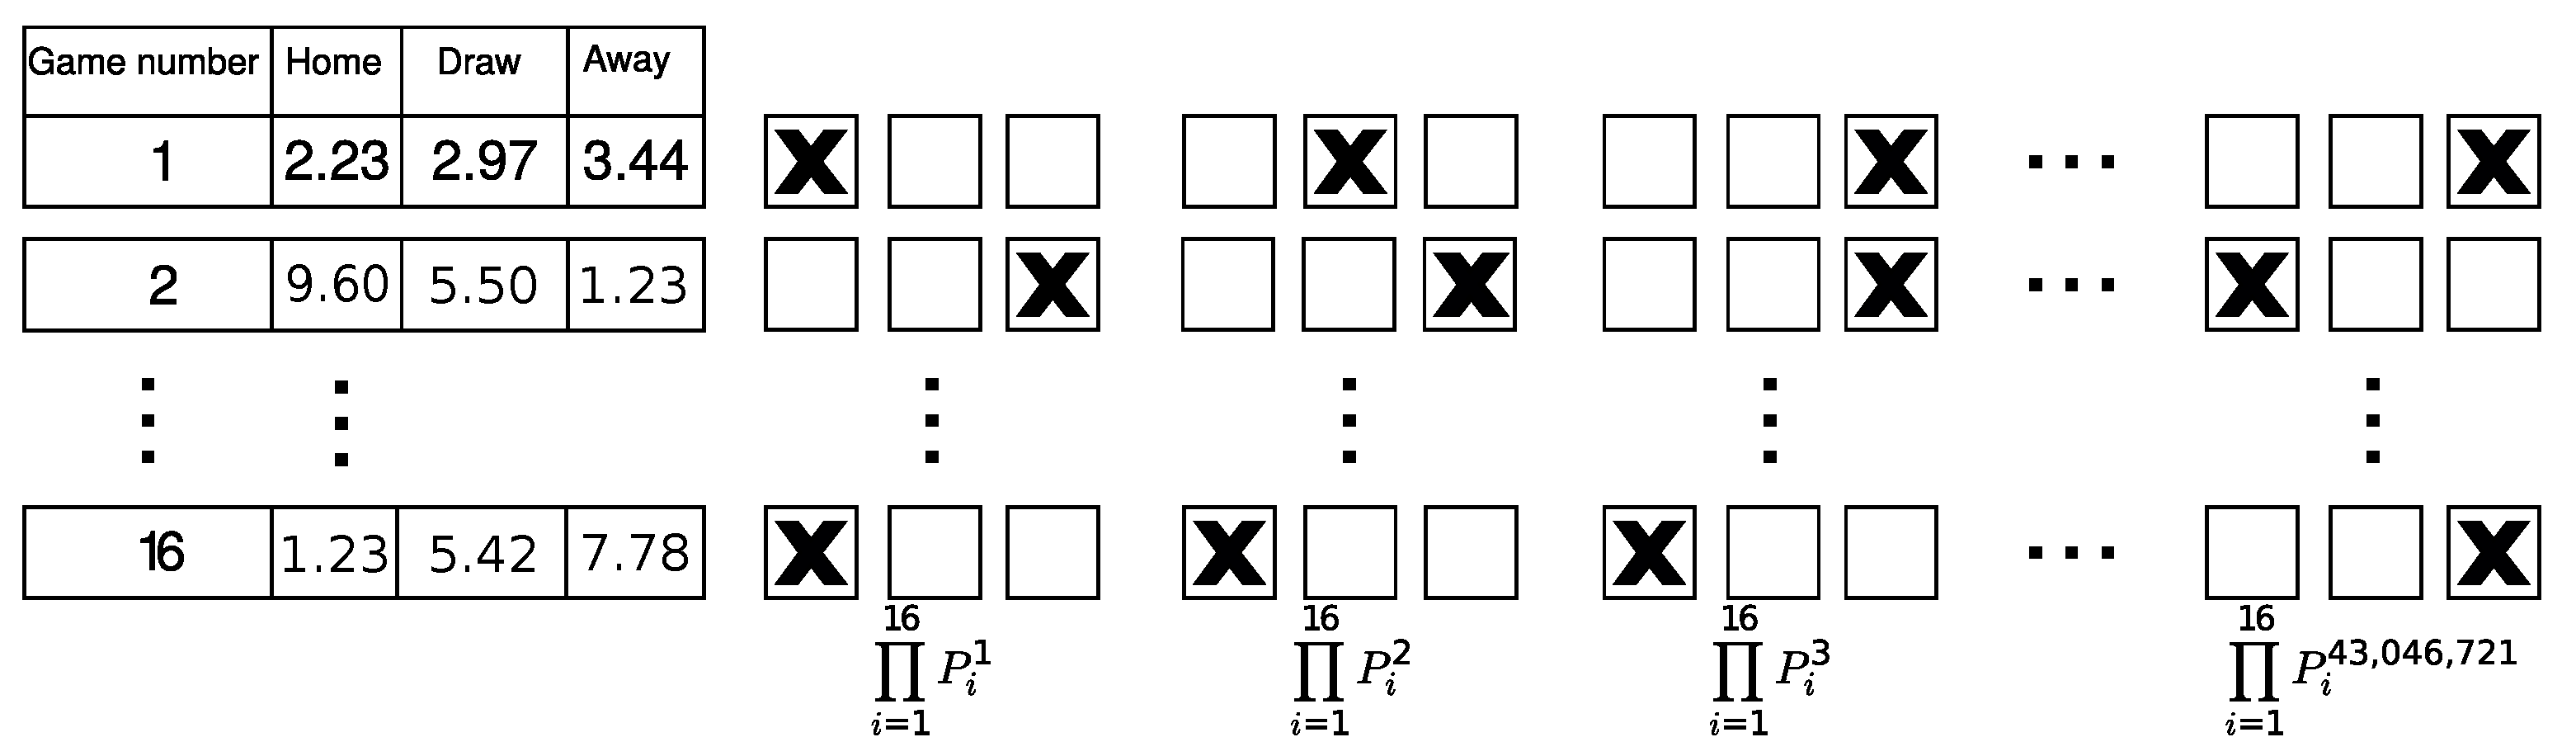
3.5.1. Generalizing the Single-Bet Prize-Pricing Mechanism to Multi-Bets

WINNER 16’s prize-pricing mechanism suffers from two major issues: (1) The amount of money allocated for the big prize is determined by the number of bets in the previous round and not in the current one. (2) The big prize splits between all winning forms in the cases where more than one winning form had been submitted. These issues derive the notion that WINNER 16 is a non-fair bet. If one is to design a betting strategy for this game (as we aimed to do above), the uncertainty about the sum of money that each winning form will receive, makes it very difficult to assess the performance of the strategy. To address these issues, we propose here a different prize-pricing approach, generalizing the single-bet prize-pricing mechanism. In this approach, the amount of money that a winning form receives is fixed regardless the number of winning forms. On the one hand, this puts WINNER 16 at risk of not being profitable in certain rounds, since there could be a large number of grand prize winners in these rounds. On the other hand, a predetermined fixed prize per winning form may encourage more individuals to bet. Thus, we propose the following approach for determining the big prize:
B i g P r i z e = T i c k e t C o s t P
where P is the probability of the top ranked form to win the big prize (see Figure 2). Using this prize-pricing method, the worst-case scenario from WINNER 16’s point of view is if all gamblers fill the number one ranked form. In this case, the expected profit of WINNER 16 will be 0. However, we know that despite all the information being available to all gamblers, they fill out a diverse set of forms and not necessarily the bets with the highest probability. This means that the proposed prize-pricing mechanism has an implicit commission that contributes to WINNER 16’s expected profit. Explicit commission is included by introducing a new parameter, α , that is the expected fraction of the income that WINNER 16 leaves for itself. In this prize-pricing approach, WINNER 16 is exposed to potential losses in certain rounds, in which the amount at risk is an increasing function of the big prize amount. Hence, the choice of which games to include in each round is very important. The choice of “easy” games, in which there is a dominant predicted outcome, and/or “hard” games in which there is none, affects the prize size and WINNER 16’s risk. Choosing easy games will lower the required security capital that WINNER needs to supply. On the other hand, choosing harder games will result in larger prizes and hence may attract more potential players. The hardest possible round occurs when all games included have a uniform distribution for each possible outcome ( p = 1 / 3 for Home, Draw, or Away). In this situation ( α = 0 ), the highest prize will be M a x P r i z e = 3 ( M M 1 / 3 ) 16 = 129,140,163. To the contrary, if the most likely outcome of each game has a probability of 0.6, then the prize reduces to B i g P r i z e = 10,634. The choice of which games to include in each round will determine the size of the first prize, and hence will affect both the motivation of players to bet and the risk level that WINNER 16 is exposed to.
So far we did not take into account the possibility of having more prizes apart from the big prize. For this, all that needs to be done is to multiply the right-hand side of Equation (2) by F 1 , the fraction of the ticket cost that supports the big prize. To calculate the second-best prize, which corresponds to guessing 15 correct results out of 16, P must change to reflect all 32 combinations, and F 1 should be replaced by F 2 , the fraction of the ticket cost that supports the second-best prize. In general, the size of the N best prize will be:
P r i z e N = T i c k e t C o s t P N · F N · ( 1 α )
where P N is the probability that an event that qualifies for winning the N prize will happen, F N is the fraction of the ticket cost that supports this prize, and α is the expected explicit fee of WINNER. The allocation of the ticket cost into the different prizes will affect the size of each prize, as well as the level of risk taken by WINNER 16. Next, we will assess this risk for our proposed prize-pricing mechanism.

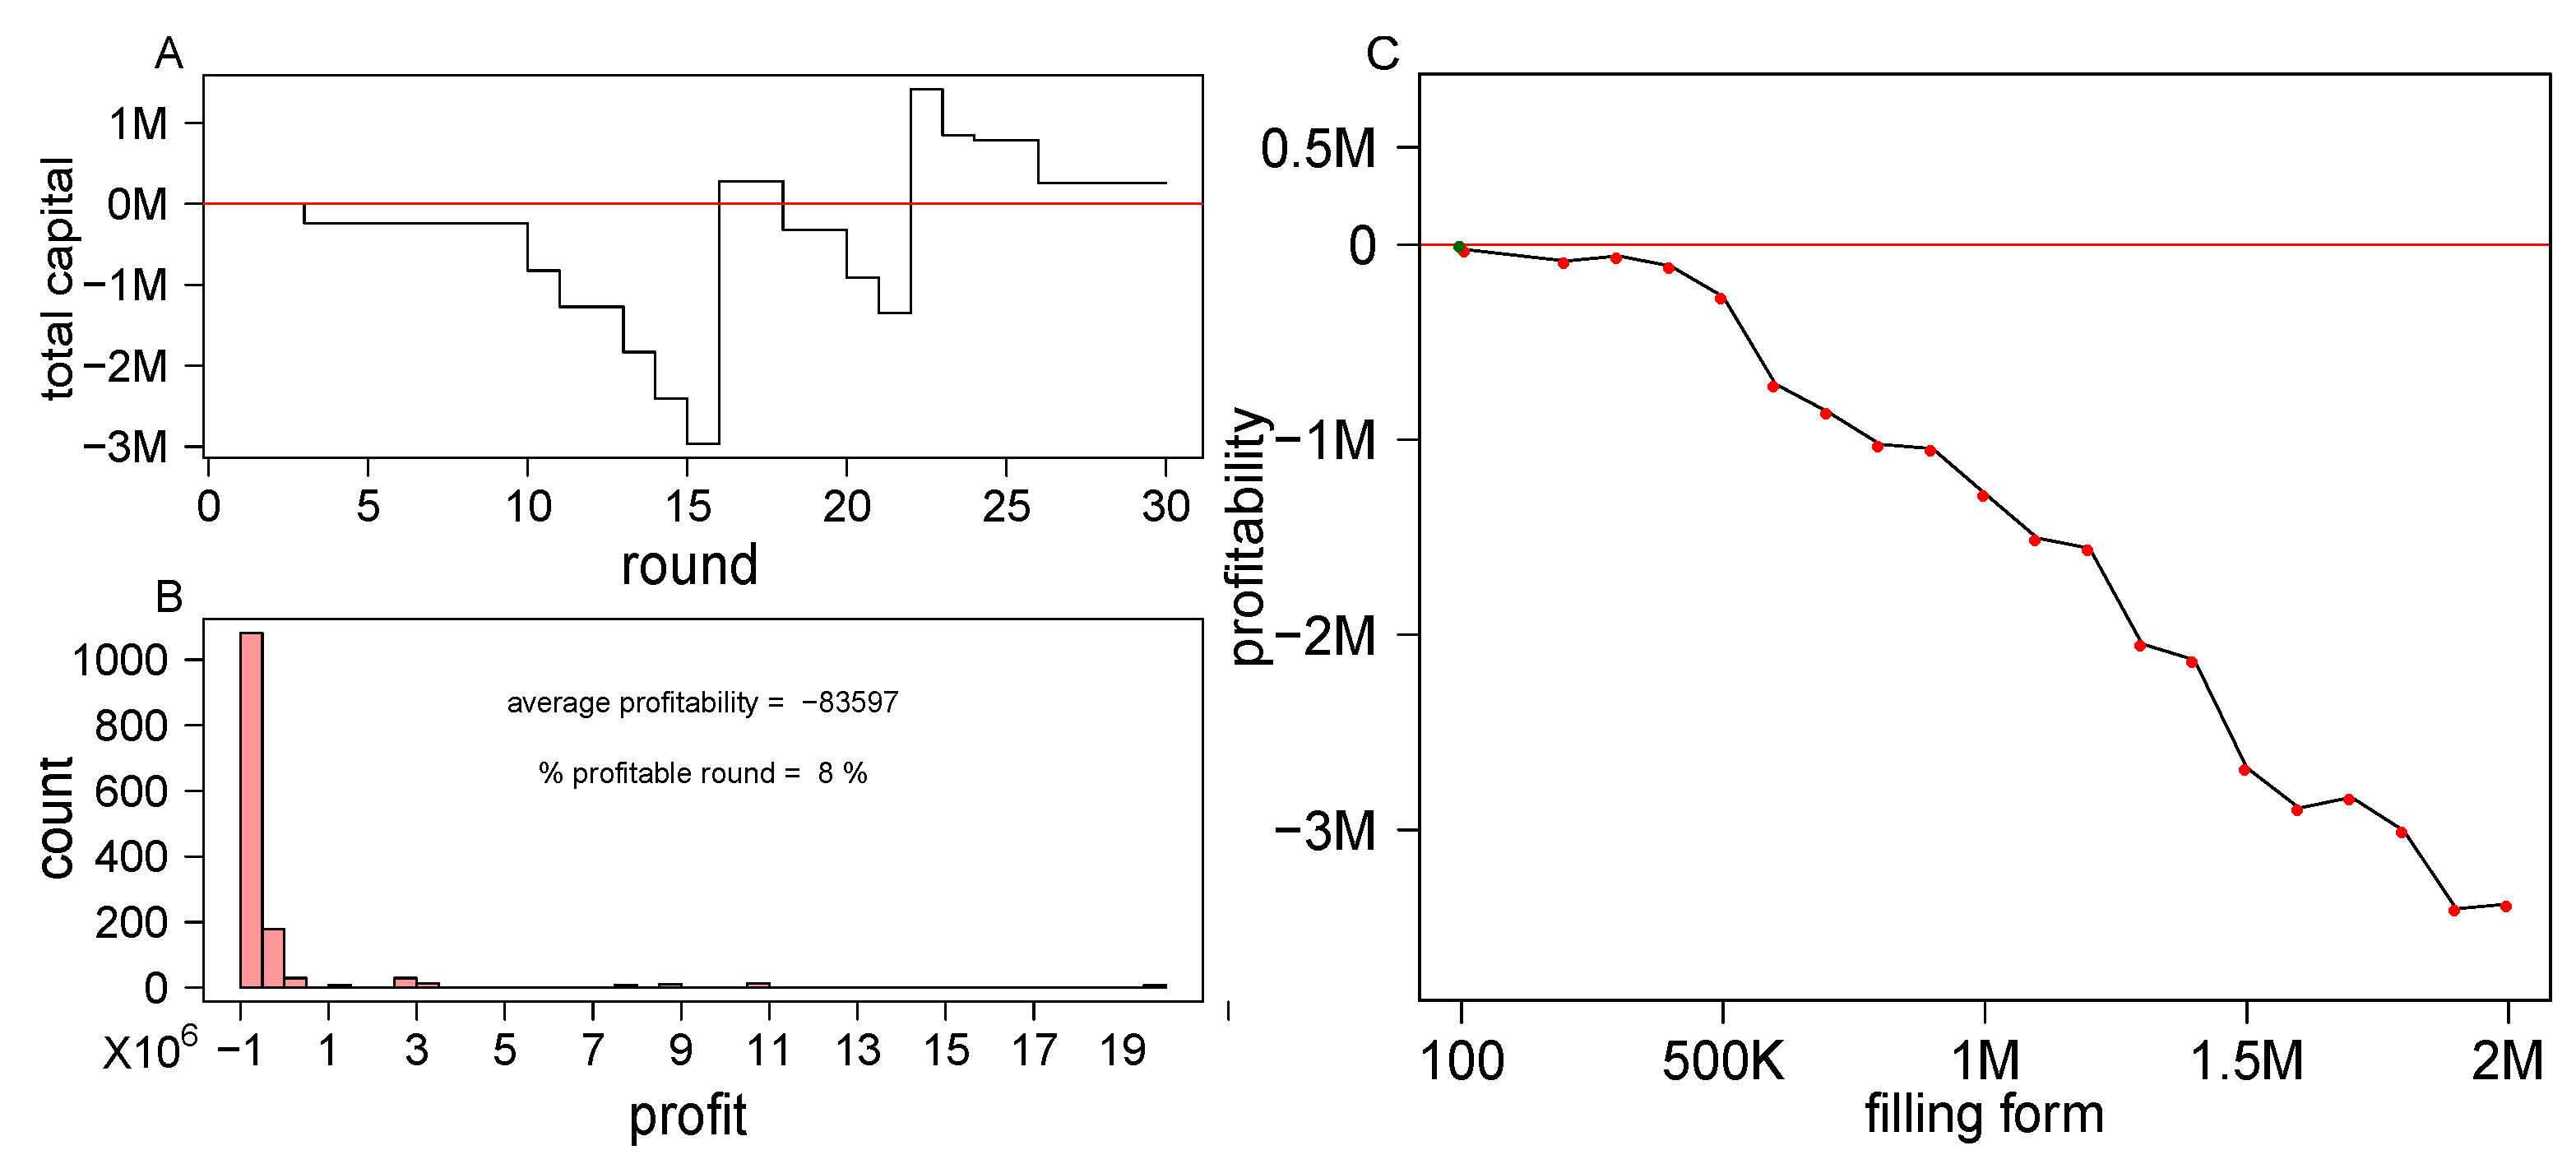
3.5.2. Risk Assessment of the Suggested Prize-Pricing Mechanism

Compared with the current prize-pricing method, the method suggested above is exposed to risks as the commutative cost of the big prizes is not bounded. Theoretically, many gamblers can fill the winning form in a specific round, and then WINNER 16 will need to pay all these gamblers the big prize, exposing itself to potential risks. To evaluate the performance of the proposed prize-pricing mechanism and to assess the risks in the cases where there is a large number of winners, we simulated scenarios in which all gamblers possess all public information (odds of each individual game), and act rationally.
The games that were included in each simulated round were drawn randomly from all past games that participated in WINNER line (WINNER line offers also single game bets of the games that are included in WINNER 16).
We chose games from WINNER over William Hill and Bet365, because the distribution of maximum probabilities for games included WINNER 16 has a larger support for small values compared with the distribution of maximum probabilities for games included in the other two betting houses (Figure 6A). For each simulated round, the prizes were determined according to Equation (3) when F 1 = 0.67 , and F 2 = 0.2 , F 3 = F 4 = F 5 = 0.044 , reflecting the current prize allocation. Three values for α were considered in the simulations: α = 0 , α = 0.3 , and α = 0.6 which is similar to the value currently used by WINNER 16. In WINNER 16, the money allocated to all prizes in a single round, is the combination of the money that was not awarded in the previous round plus 42 % of the total income of the current round. This secures WINNER 16 a profit of 58% of the total income (!). The risk in using our proposed prize-pricing mechanism is that the big prize is not derived from the total income, but rather from the set of single game probabilities included in that round. The expected profitability of WINNER 16 is determined by the parameter α (Equation (3)).
We conducted 100 K simulations of 2 M forms and recorded the number of big prize winners in each simulation. Summary of these results is shown in Figure 6B–D. WINNER’s share of the total income is shown to always be larger than the α coefficient used in the simulation. This consistent excess of WINNER’s share over α (appears also for larger numbers of forms, data not shown) can be traced to the implicit fee that winner earns, since not all gamblers fill the same form. This implicit fee adds to the explicit fee, α . The deviation between WINNER’s share of the total income and α monotonically decreases with the number of filled forms. For 2 M forms the difference between the two is as low as 0.02 % . In terms of risk assessment, the fraction of non-profitable rounds (f) is f = 48.5 % for α = 0 , f = 5.77 % for α = 30 % , and f = 0.02 % for α = 60 % . These numbers are calculated for single rounds. To assess the implications of the single round probability to not be profitable (f) into an annual performance, we simulated 1 M scenarios of 52 rounds per year. The results of these simulations indicate that the probability of having a non-profitable year is 0.495 for α = 0 , and is < 10 7 for α = 0.3 , and for α = 0.6 . In summary, we show here that WINNER 16 can maintain the same level of profitability using our proposed prize-pricing mechanism with the desired α coefficient, and not expose itself to unnecessary risks.

4. Discussion

In this paper, we studied market efficiency of single and multi-bets in soccer. We showed that the market of single bets in soccer is efficient, and the betting odds offered by the main betting agencies reflect the unbiased expected probabilities of all possible results. There are many attempts to exploit all sorts of information, such as team ranking, budget, referees, and location, to better guess the results of single games. Here, we showed that all this information is encapsulated in the betting odds, which is a striking example of crowd wisdom and market efficiency. In the context of multi-bets where prizes are set according to past rounds and are split by all winning forms, we proposed a form filling strategy based on “crowd wisdom” and machine learning, and showed a proof of concept for the profitability of this algorithm. This proof of concept can be explored and developed further given more high-quality data. On this note, we would like to mention that only a few gambling houses use application programming interface (api), and this makes the task of collecting and curating high-quality data extremely challenging. We believe that promoting open-access policies for sports and betting data is of fundamental importance for the scientific community, as well as other stakeholders including the betting agencies themselves. To make multi-bets fairer, we proposed another mechanism to set the prizes, which is essentially a generalization of single bets with a reduced house share compared to a concatenation of a series of single bets. We studied the expected house share and risk in this generalization and showed that this suggestion can be adapted by gambling houses without exposing themselves to unnecessary risks.
In most betting agencies, the common fee of a single bet for a soccer game is α 10 % . A multi-bet is allowed in these agencies by propagating the outcome of one bet into the other. In this way, the betting odds are multiplying but the house share is growing with every new bet. For example, if the house share of a single bet is α = 0.1 , then a multi-bet of 16 games will have an effective house share of α e f f = 1 ( 1 0.1 ) 16 = 81.5 % (!). In our multi-bet prize-pricing proposal, we simply suggest setting the effective house share ( α e f f ) to a desired value regardless of the number of bets. We believe that this is fairer way to bet, keeping the margins appealing to the betting operator as well as making multi-bets more appealing for smart money gamblers.

Supplementary Materials

The following are available at https://www.mdpi.com/article/10.3390/bdcc5040070/s1, Figure S1: Statistical comparison between probability distributions of the bets offered by three betting houses.

Author Contributions

Conceptualization, G.Y.; methodology, G.Y. and O.P.; software, G.Y. and O.P.; investigation, G.Y., M.F. and O.P.; data curation, O.P.; writing—original draft preparation, G.Y. and O.P.; writing—review and editing, G.Y. and M.F.; supervision, G.Y. All authors have read and agreed to the published version of the manuscript.

Funding

This research received no external funding.

Institutional Review Board Statement

Not applicable.

Informed Consent Statement

Not applicable.

Data Availability Statement

Publicly available datasets were analyzed in this study. The data can be found here: https://bitbucket.org/OzPirvandy/gambling-strategies-dataset/src (accessed on 20 November 2021).

Acknowledgments

We thank Pazit Polak for helpful discussions and for critical reading of the manuscript.

Conflicts of Interest

The authors declare no conflict of interest.

References

  1. Davenport, T. Big Data at Work: Dispelling the Myths, Uncovering the Opportunities; Harvard Business Review Press: Brighton, MA, USA, 2014. [Google Scholar]
  2. Skinner, B.; Guy, S.J. A Method for Using Player Tracking Data in Basketball to Learn Player Skills and Predict Team Performance. PLoS ONE 2015, 10, e0136393. [Google Scholar] [CrossRef] [PubMed] [Green Version]
  3. Radicchi, F. Who Is the Best Player Ever? A Complex Network Analysis of the History of Professional Tennis. PLoS ONE 2011, 6, e17249. [Google Scholar] [CrossRef] [PubMed]
  4. Yaari, G.; Eisenmann, S. The Hot (Invisible?) Hand: Can Time Sequence Patterns of Success/Failure in Sports Be Modeled as Repeated Random Independent Trials? PLoS ONE 2011, 6, e24532. [Google Scholar] [CrossRef] [PubMed]
  5. Yaari, G.; David, G. “Hot Hand” on Strike: Bowling Data Indicates Correlation to Recent Past Results, Not Causality. PLoS ONE 2012, 7, e30112. [Google Scholar] [CrossRef]
  6. Stins, J.F.; Yaari, G.; Wijmer, K.; Burger, J.F.; Beek, P.J. Evidence for sequential performance effects in professional darts. Front. Psychol. 2018, 9, 591. [Google Scholar] [CrossRef] [PubMed] [Green Version]
  7. Jensen, M.C. Some anomalous evidence regarding market efficiency. J. Financ. Econ. 1978, 6, 95–101. [Google Scholar] [CrossRef]
  8. Alper, O.; Somekh-Baruch, A.; Pirvandy, O.; Schaps, M.; Yaari, G. Effects of correlations and fees in random multiplicative environments: Implications for portfolio management. Phys. Rev. E 2017, 96, 022305. [Google Scholar] [CrossRef] [PubMed]
  9. Woodland, L.M.; Woodland, B.M. Market efficiency and profitable wagering in the national hockey league: Can bettors score on longshots? South. Econ. J. 2001, 983–995. [Google Scholar]
  10. Kelly, J. A New Interpretation of Information Rate. Bell Labs Tech. J. 1956, 35, 917–926. [Google Scholar] [CrossRef]
  11. Bailey, M.; Clarke, S.R. Predicting the match outcome in one day international cricket matches, while the game is in progress. J. Sport. Sci. Med. 2006, 5, 480. [Google Scholar]
  12. Paul, R.J.; Weinbach, A.P. An Analysis of the Last Hour of Betting in the NFL. Int. J. Sport Financ. 2011, 6, 307. [Google Scholar]
  13. Hucaljuk, J.; Rakipović, A. Predicting football scores using machine learning techniques. In Proceedings of the 2011 34th International Convention, Opatija, Croatia, 23–27 May 2011; pp. 1623–1627. [Google Scholar]
  14. Ganeshapillai, G.; Guttag, J. A data-driven method for in-game decision making in MLB. In Proceedings of the MIT Sloan Sports Analytics Conference, Chicago, IL, USA, 11–14 August 2013. [Google Scholar]
  15. Surowiecki, J. The Wisdom of Crowds; Anchor Books: New York, NY, USA, 2005. [Google Scholar]
  16. Sinha, S.; Dyer, C.; Gimpel, K.; Smith, N.A. Predicting the NFL using Twitter. arXiv 2013, arXiv:1310.6998. [Google Scholar]
  17. Hidayat, A. Phantom, J.S. 2011. Available online: https://github.com/ariya/phantomjs (accessed on 4 July 2016).
  18. Fama, E.F. Random walks in stock market prices. Financ. Anal. J. 1995, 51, 75–80. [Google Scholar] [CrossRef] [Green Version]
  19. Gray, P.K.; Gray, S.F. Testing market efficiency: Evidence from the NFL sports betting market. J. Financ. 1997, 52, 1725–1737. [Google Scholar] [CrossRef]
  20. Cortis, D. Expected values and variances in bookmaker payouts: A theoretical approach towards setting limits on odds. J. Predict. Mark. 2015, 9, 1–14. [Google Scholar] [CrossRef]
  21. Yaari, G.; Solomon, S. Cooperation evolution in random multiplicative environments. Eur. Phys. J. B. 2010, 73, 625–632. [Google Scholar] [CrossRef] [Green Version]
  22. Hassanniakalager, A.; Sermpinis, G.; Stasinakis, C.; Verousis, T. A conditional fuzzy inference approach in forecasting. Eur. J. Oper. Res. 2020, 283, 196–216. [Google Scholar] [CrossRef]
  23. Lunardon, N.; Menardi, G.; Torelli, N. ROSE: A Package for Binary Imbalanced Learning. R J. 2014, 6, 82–92. [Google Scholar] [CrossRef] [Green Version]
Figure 1. Assessing market efficiency for single bets. (A) Density curves of the betting probabilities for the three betting houses considered in this work: William Hill (WH), Bet365, and WINNER. The x-axis shows the expected probability for a single bet. The y-axis reflects the associated densities of these probabilities. (BD) Single bet observed probability vs. the matching expected probability for WINNER (B), William Hill (C), and Bet365 (D). Each point in the plots corresponds to a set of bets in a range of expected probabilities (x-axis). The y-axis was calculated from the obtained results of these bets.
Bdcc 05 00070 g001
Figure 2. Schematic view of the form ranking algorithm. The table on the left shows the final odds for each game in an example round. The odds are the return for investing 1 dollar. The panels to the right of the table illustrate the ranked forms that are filled according to the strategy. The left-most form is ranked 1st as it has the highest probability to win the big prize, and the right-most form is ranked 43,046,721 as it has the lowest probability to win the big prize.
Bdcc 05 00070 g002
Figure 3. Number of profitable rounds and the mean profitability averaged over all rounds. The x-axis corresponds to the number of filled forms sent in each round according to the described algorithm. The yellow circles correspond to the number of profitable rounds. Each dot corresponds to a single round, and the associated y-axis (to the left in black) is the average profit per form. The average profit per round is indicated on the right y-axis in red. (A) shows the results for 10 3 N 10 7 , and (B) zooms in on 4 · 10 5 N 2 · 10 6 .
Bdcc 05 00070 g003
Figure 4. The ranking algorithm vs. random form filling strategy. (A) The cumulative probability to win the big prize (y-axis) vs. the number of top N forms filled (x-axis). The gray shaded area corresponds to the mean probability of winning the big prize (black line in the middle of it) ± one standard deviation over all rounds. The blue line corresponds to the empirical winning fraction in the rounds given that the top N forms were filled (x-axis). The red line corresponds to a situation in which all probabilities equal 1/3. (B) Box plot of the winning form in the form ranking approach. The green line represents the median and the blue line represents the mean. The red line represents the mean ranking of the winning form in a situation where all probabilities equal 1/3.
Bdcc 05 00070 g004
Figure 5. Assessing the selected model’s performance. (A) An example of a typical simulation. Vertical jumps of the curve indicate rounds in which the model output was to place a bet in the specific round (x-axis) by filling the 200 K top ranked forms. (B) Shows the profit distribution of single rounds from 100 simulations of 30 rounds, in which the model output was to place a 200 K forms bet. The mean profit per round of all simulations as a function of the number of submitted forms is shown in (C).
Bdcc 05 00070 g005
Figure 6. Expected house share of the proposed prize-pricing mechanism. (A) A distribution of the maximum probabilities for all single games of WINNER, William Hill and bet365. The x-axis corresponds to the maximum probabilities for all single games provided by the gambling houses, and the y-axis corresponds to their density. (BD) Histograms of the house share for the proposed prize-pricing mechanism with three levels of α . A total of 100,000 simulations were conducted and the house share was recorded in all of them for α = 0 (B), α = 0.3 (C), and α = 0.6 (D). The profitable rounds are shown in light blue and the non-profitable in gray. The f value indicated on the graphs refers to the fraction of non-profitable simulated rounds.
Bdcc 05 00070 g006
Publisher’s Note: MDPI stays neutral with regard to jurisdictional claims in published maps and institutional affiliations.

