1. Introduction
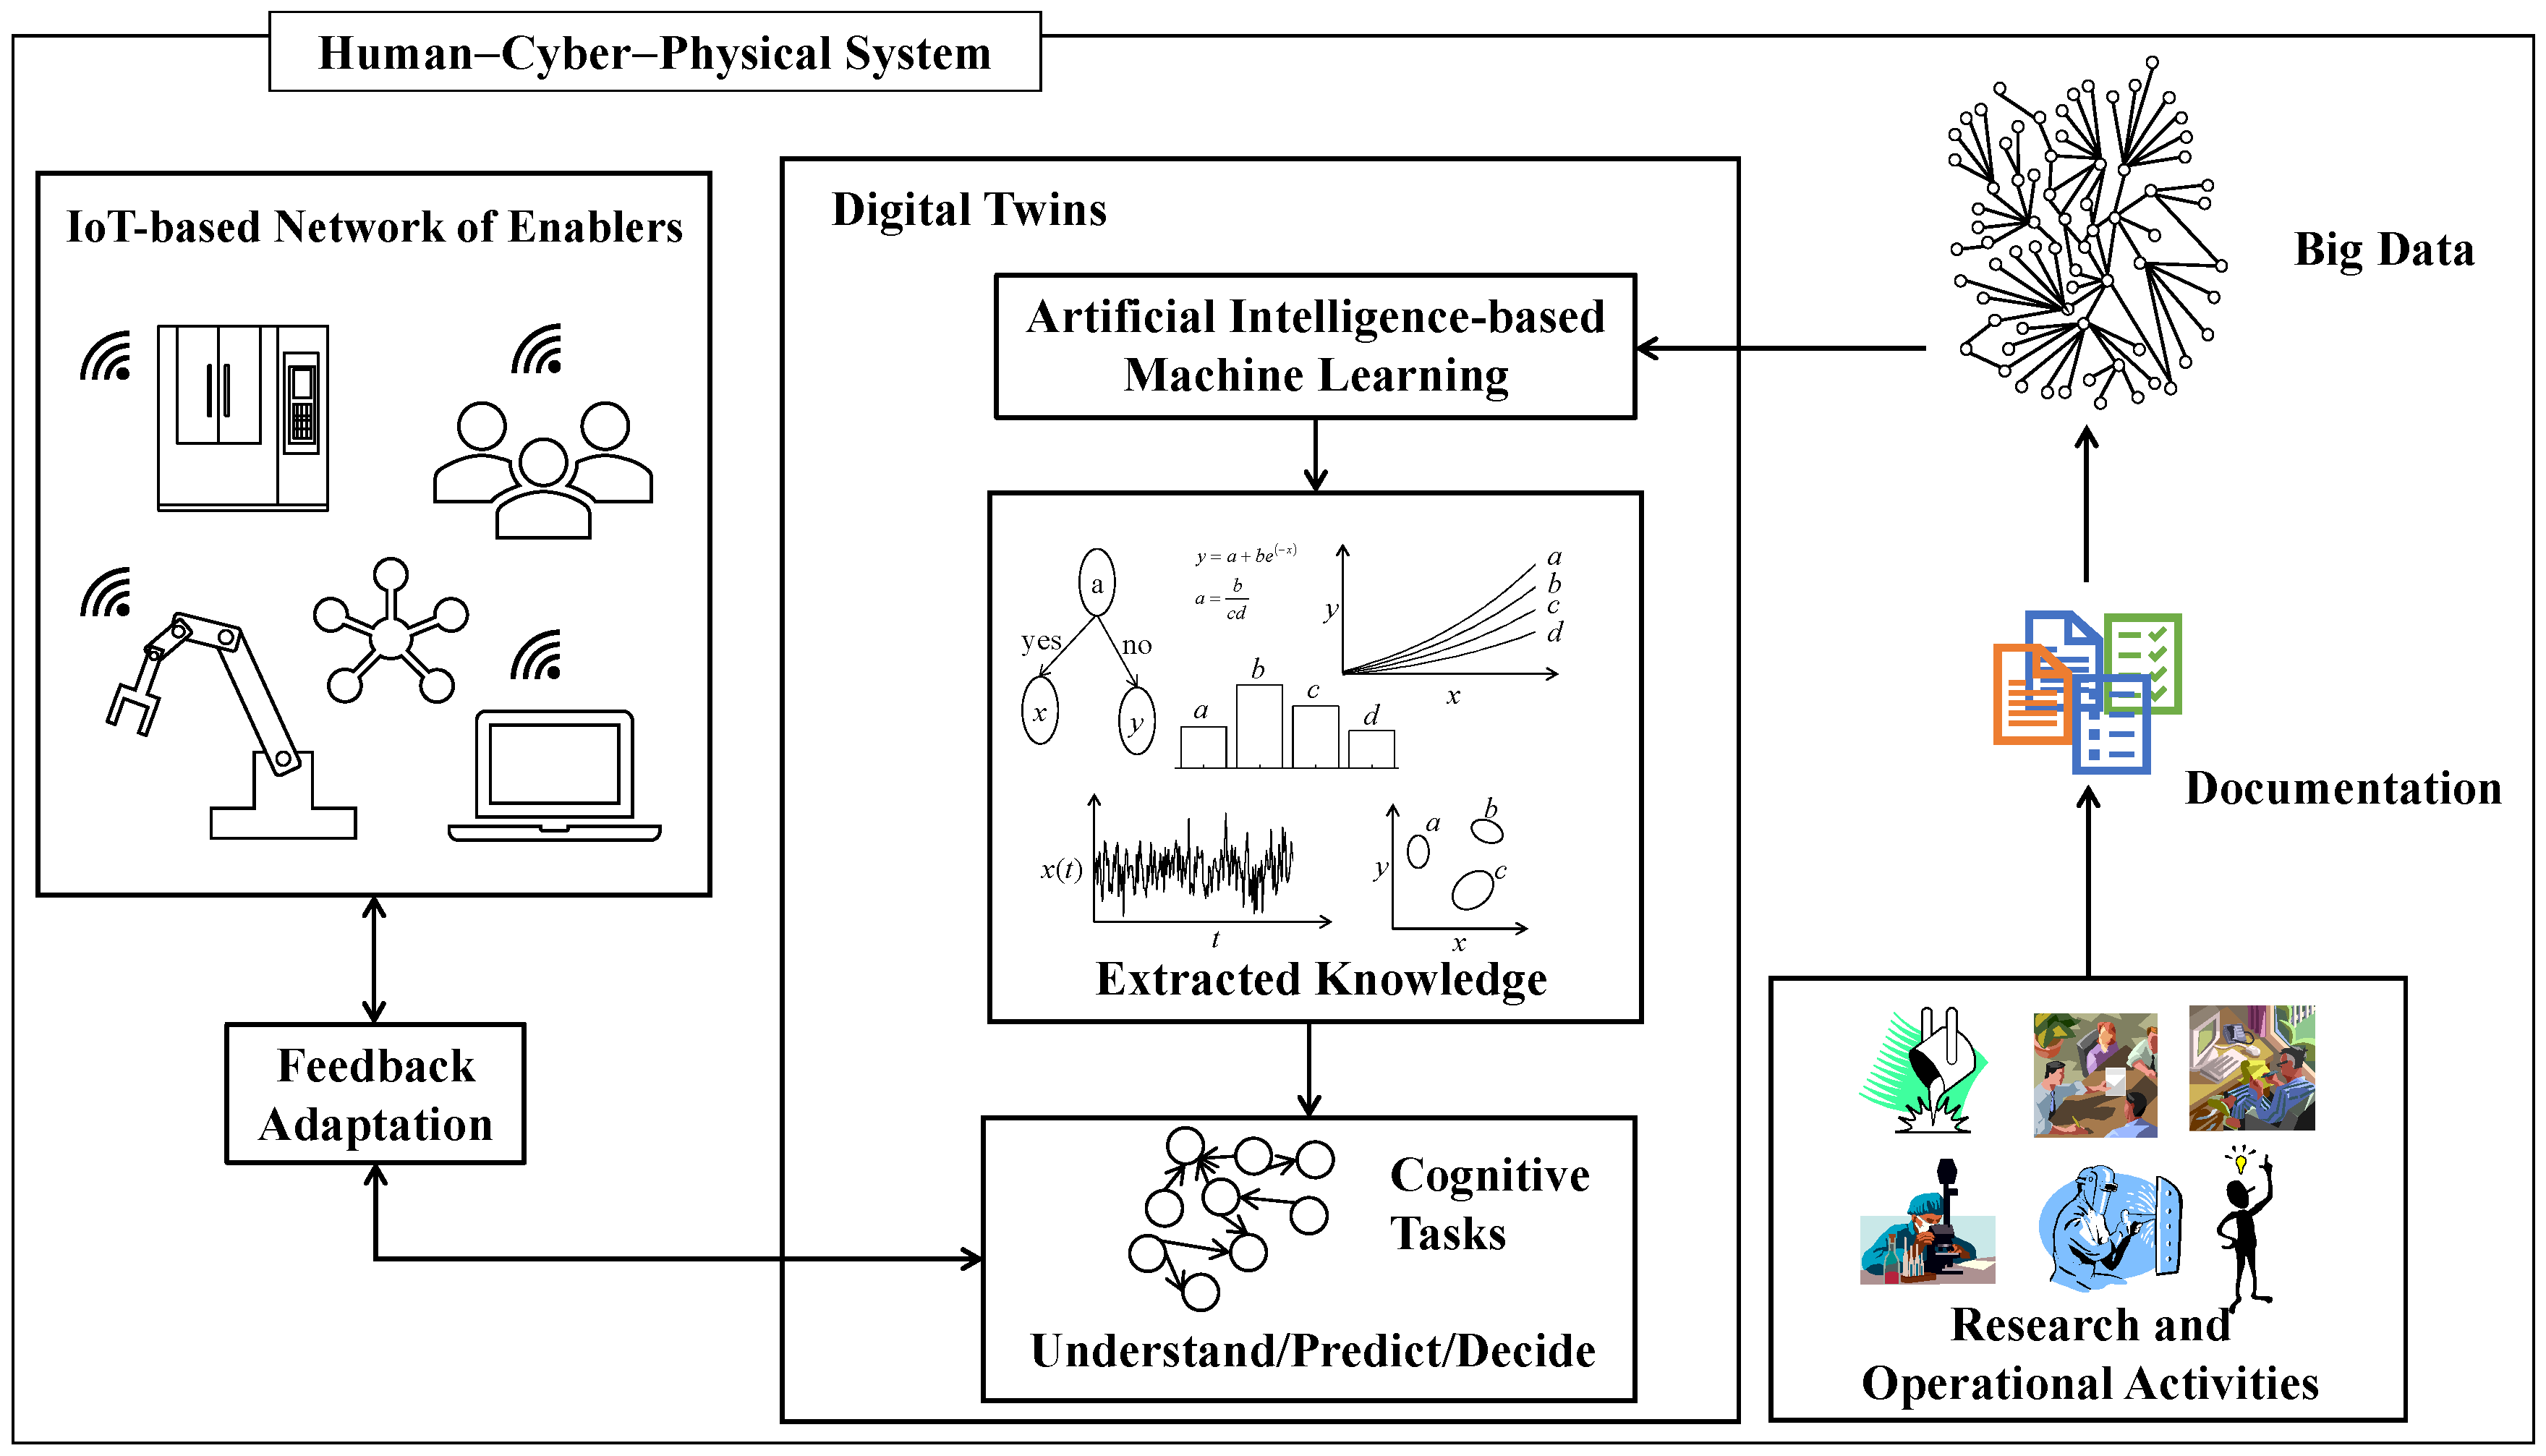
Smart manufacturing (or Industry 4.0) [
1] embarks on a human-cyber-physical system (HCPS) [
2], as shown in
Figure 1. The HCPS (
Figure 1) [
2] consists of Internet of Things (IoT)-based manufacturing enablers [
3], digital twins (DT) [
4,
5], big data (BD) [
6], and documentation of past research and operational activities.
Like its predecessors, smart manufacturing needs manufacturing enablers such as CAD/CAM systems, process planning systems, CNC machine tools, measuring devices, actuators, robots, and human resources. The difference is that the enablers create an IoT-based network [
3], allowing both vertical and horizontal integrations. At the same time, the enablers must perform human-like cognitive tasks [
1,
5] such as understanding current situations, predicting future consequences, deciding the right courses of action, and adapting to new situations as autonomously as possible. The autonomous execution of the abovementioned cognitive tasks requires a great deal of knowledge [
5,
7,
8] that can be extracted from the relevant segments of BD using artificially intelligent systems. Machine learning capacities empower these systems [
9]. DTs contain knowledge extraction systems, extracted knowledge, and capacities to perform human-like cognitive tasks [
5]. DTs also provide (or receive) feedback to (or from) the IoT-based manufacturing enablers to keep the enablers adaptive to new situations [
10].
Let us focus on BD [
6]. Generally speaking, BD consists of a vast array of heterogeneous unstructured, semi-structured, and structured datasets [
11,
12]. Some datasets can be accessed through the Internet, and some cannot. However, the HCPS-friendly segments of BD must have the following characteristics. The segments must be readily accessible to all stakeholders, preferably through the Internet. In addition, the segments must be both human- and machine-readable. Moreover, the segments can be effortlessly integrated with the knowledge extraction systems and, thereby, to DT. The segments of BD exhibiting the abovementioned characteristics are not readily available. They need to be prepared using the relevant documentation of past research and operational activities. The documentation is, by nature, messy, and there is no steadfast procedure by which the documentation can be converted into an HCPS-friendly BD. This study sheds some light on this issue. In particular, this study uses the case of surface roughness and elucidates a method for preparing datasets to be included in an HCPS-friendly BD.
Surface roughness [
13,
14] is a major concern of all manufacturing processes, and ensuring the right surface roughness requires knowledge. In most cases, the required knowledge is extracted from experimental datasets. In an HCPS, a dedicated DT supplies the surface roughness-relevant knowledge to the manufacturing enablers. However, before a DT supplies the required knowledge, it must be constructed. (See
Section 3 for more details.) The question is, from where does the DT collect the information? The obvious answer is that BD supplies the information. In other words, BD must host datasets useful for building a DT. Consequently, a mere digitized version of the documentation of experimental and operational activities (
Figure 1) is not enough to build BD; datasets needed to build DT must be added to BD. Otherwise, BD may not be useful for the HCPS. Based on this consideration, this article is written.
The rest of this article is organized as follows.
Section 2 briefly reviews selected publications on big data for smart manufacturing, highlighting the methods currently used to construct and functionalize BD and analytics.
Section 3 presents the different types of datasets often used to document research and operational activities of surface roughness. This section also highlights the current utilization level of surface roughness datasets in cyberspace.
Section 4 presents a method for preparing datasets of surface roughness to be included in BD for making it (BD) meaningful to DT. This section also articulates the major issues, the structure and segments of the datasets, and their interplay with DT.
Section 5 presents some noteworthy results when the proposed method is applied to preparing datasets of the roughness of turning, milling, grinding, electric discharge machining, and polishing.
Section 6 concludes.
2. Literature Review
This section briefly reviews selected publications on big data for smart manufacturing. The goal is to highlight the methods currently used to construct and functionalize BD and relevant analytics. The research gaps are highlighted in
Section 4, however.
Moktadir et al. [
15] studied the barriers of BD implementation in real-life manufacturing organizations located in a developing economy. They found that collecting reliable datasets from relevant sources is the most significant barrier. The second most significant barrier is related to technology and resource—lack of IT infrastructure, data privacy assurance, complexity in data integration, lack of appropriate BD analytics, and high investment. As far as a developed economy is concerned, similar barriers still exist, as reported in [
16,
17].
Syafrudin et al. [
18] proposed a real-time monitoring framework of manufacturing systems focusing on the automotive industry. The framework utilizes BD collected from IoT-based sensors and processes it (BD) by a hybrid prediction model. In particular, unstructured datasets collected from manufacturing processes by temperature, humidity, accelerometer, and gyroscope sensors were preprocessed using platforms known as Apache Kafka (message queue), Apache Storm (real-time processing engine), and MongoDB (data storage). Subsequently, density-based spatial clustering with noise removal capacity was used to detect outliers and to classify data for fault detection. They proposed BD-driven system to prevent unexpected losses caused by faults during manufacturing automotive parts and performing assembly operations.
Wiech et al. [
19] considered that BD analytics and manufacturing execution systems are needed to achieve the objectives of Industry 4.0. They studied the implementation levels of BD analytics and manufacturing execution systems by conducting a survey in which more than one hundred organizations participated. They found that the BD analytics and manufacturing execution systems are heavily correlated, and the performance is not likely to depend on organizational structures.
Escobar et al. [
20] conducted a literature review to understand the interplay of BD and process monitoring for quality control from the context of Industry 4.0 (i.e., Quality 4.0). They proposed that manufacturing BD-centric challenges can be tackled by implementing a seven-step approach: identify, accessorize, discover, learn, predict, redesign, and relearn. In addition, they found that a vast array of process datasets collected either from plants or from laboratories in the form of pictures, signals, and direct measurements can be analyzed in real-time using simple machine learning algorithms rather than deep learning.
Yu et al. [
21] presented a BD ecosystem for predictive maintenance. The data sources were the sensor signals collected from large-scale manufacturing plants. The ecosystem used numerous technologies (data lake, NoSQL database, Apache Spark, Apache Drill, Apache Hive, and OPC Collector) to solve data ingestion, integration, transformation, storage, analytics, and visualization. In addition, the required transformation protocols, authentication, and encryption methods were also addressed to secure the data transfer. Finally, a Map-Reduce decentralized principal component analysis made sense of BD for predictive maintenance. The Map-Reduce decentralized principal component analysis, which is simple and can respond faster on a real-time basis, was used to make sense of sensor signals for predictive maintenance.
Faheem et al. [
22] considered that sensor datasets collected by a wireless sensor network from various sources (equipment, machines, assembly lines, material handling devices, and inspection activities) constitute industrial BD. The datasets are subjected to trigger errors and low transmission quality due to high noise, signal fading, multipath effects, heat, and electromagnetic interference. In order to solve the abovementioned problems, they introduced a multi-channel and multi-radio architecture denoted as CBI4.0. As confirmed by an EstiNet 9.0 simulator, the proposed architecture exhibited robust performance compared with other wireless sensor signal networks used to support BD in the automotive industry.
O’Donovan et al. [
23] presented data requirements, system requirements, and information system models for utilizing BD in equipment maintenance. The goal was to provide a scalable and fault-tolerant BD pipeline for integrating, processing, and analyzing datasets relevant to industrial equipment. The focus was on the highly automated large-scale manufacturing environments in which Internet-aware smart sensors play a vital role.
Shah et al. [
24] showed that BD of sensor signals collected from IoT-networked manufacturing devices effectively modeled and monitored manufacturing processes. However, to make sense of a large array of datasets, machine learning techniques must be employed. In particular, they developed an IoT-based testbed capable of handling BD (about 70 GB) underlying a pipe flow system coupled with five IoT-based vibration sensors. Furthermore, they compared the complex deep learning models with simple statistical learning models in processing the sensor signals. They identified that simple statistical learning could achieve superior results over deep learning because there are still unsolved challenges making deep learning less effective.
On the contrary, Fang et al. [
25] showed that deep learning is more effective than other machine learning (e.g., linear regression, back-propagation, and multi-layer and deep belief networks) in making sense of manufacturing BD when predicting the remaining time to complete a part. They used BD collected from various sensors in a large-scale job shop equipped with 44 machines producing 13 types of parts. The proposed framework needs raw data collection, candidate dataset design and selection, and predictive modeling using a deep learning approach denoted as a stacked sparse autoencoder.
Zhang et al. [
26] proposed an energy-aware cyber-physical system in which energy-related BD and production-related BD play a vital role. The datasets were originated from energy monitors (sensors) mounted on machine tools and on gas, liquid, and cutting fluid circulation devices. Before making sense of these datasets, they were cleaned by removing the noise and abnormalities. Finally, deep belief networks classified the continuous energy consumption data according to different machining states, which helped ensure low energy consumption.
Ko and Fujita [
27] developed evidential analytics for unearthing the buried information in BD samples, focusing on the manufacturing of semiconductors. They found that raw datasets in BD often exhibit undesirable characteristics such as unspecified sampling principles and analytics baselines, a large number of redundant variables or features, a mixture of relevant and irrelevant datasets, indistinguishable noise, and outliers in datasets. BD analytics must handle these characteristics and identify the causes of damage beforehand. To achieve this, they proposed analytics denoted as evidential analytics for buried information (EABI) that used the concept of granular information. EABI consists of three phases. The first phase generates baselines expressing the relevance to damages in the directions of high and low for reducing the number of variables. The second phase unearths the preference and relevance together. The last phase aggregates evidence among variables for evaluating the samples.
3. Surface Roughness Data
As described in the previous section, the root of all problems associated with constructing BD and its utilization is the datasets themselves [
15,
16,
17,
22,
27]. Thus, before presenting the proposed method for preparing the datasets to be included in BD of surface roughness, it is important to see how and what kind of datasets of surface roughness are often documented after performing experimental and operational activities. This section serves this purpose.
Nowadays, surface roughness [
13,
14] is measured by laser-based non-contact surface metrology instruments [
28], as shown in
Figure 2a. This type of instrument moves a laser source on the surface to be measured in a definite trajectory, as shown in
Figure 2b. For this, the instrument first sets an
xy-mesh (
Figure 2c) and obtains the height information of the surface (
Figure 2d). In addition to height information, the instruments can represent a mesh using a pixel [
29]. As such, two types of information are produced. One of the types consists of a 3D surface based on height information (
Figure 2e,f).
The other is the images of the measured surface, as shown in
Figure 3a–c. In particular,
Figure 3a shows a raw image of an arbitrary surface [
29].
Figure 3b shows a binary image [
29]. This image is extracted from the image shown in
Figure 3a and carries valuable topographical information of the surface [
29].
Figure 3c shows a color image in which different heights are depicted using different colors (height gradation image). This is also useful for surface topography analysis.
Figure 3d shows a 3D surface rendered from the height datasets using a curve-smoothening technique.
Figure 3e shows a height profile (surface profile) of the surface for a given
y (or
x) along the
x (or
y) direction [
28]. A primary profile (not shown in
Figure 3) is obtained by removing linear or curved “form error” underlying the surface height profile [
14,
28].
Figure 3f shows a surface roughness profile obtained by removing the waviness from a primary profile.
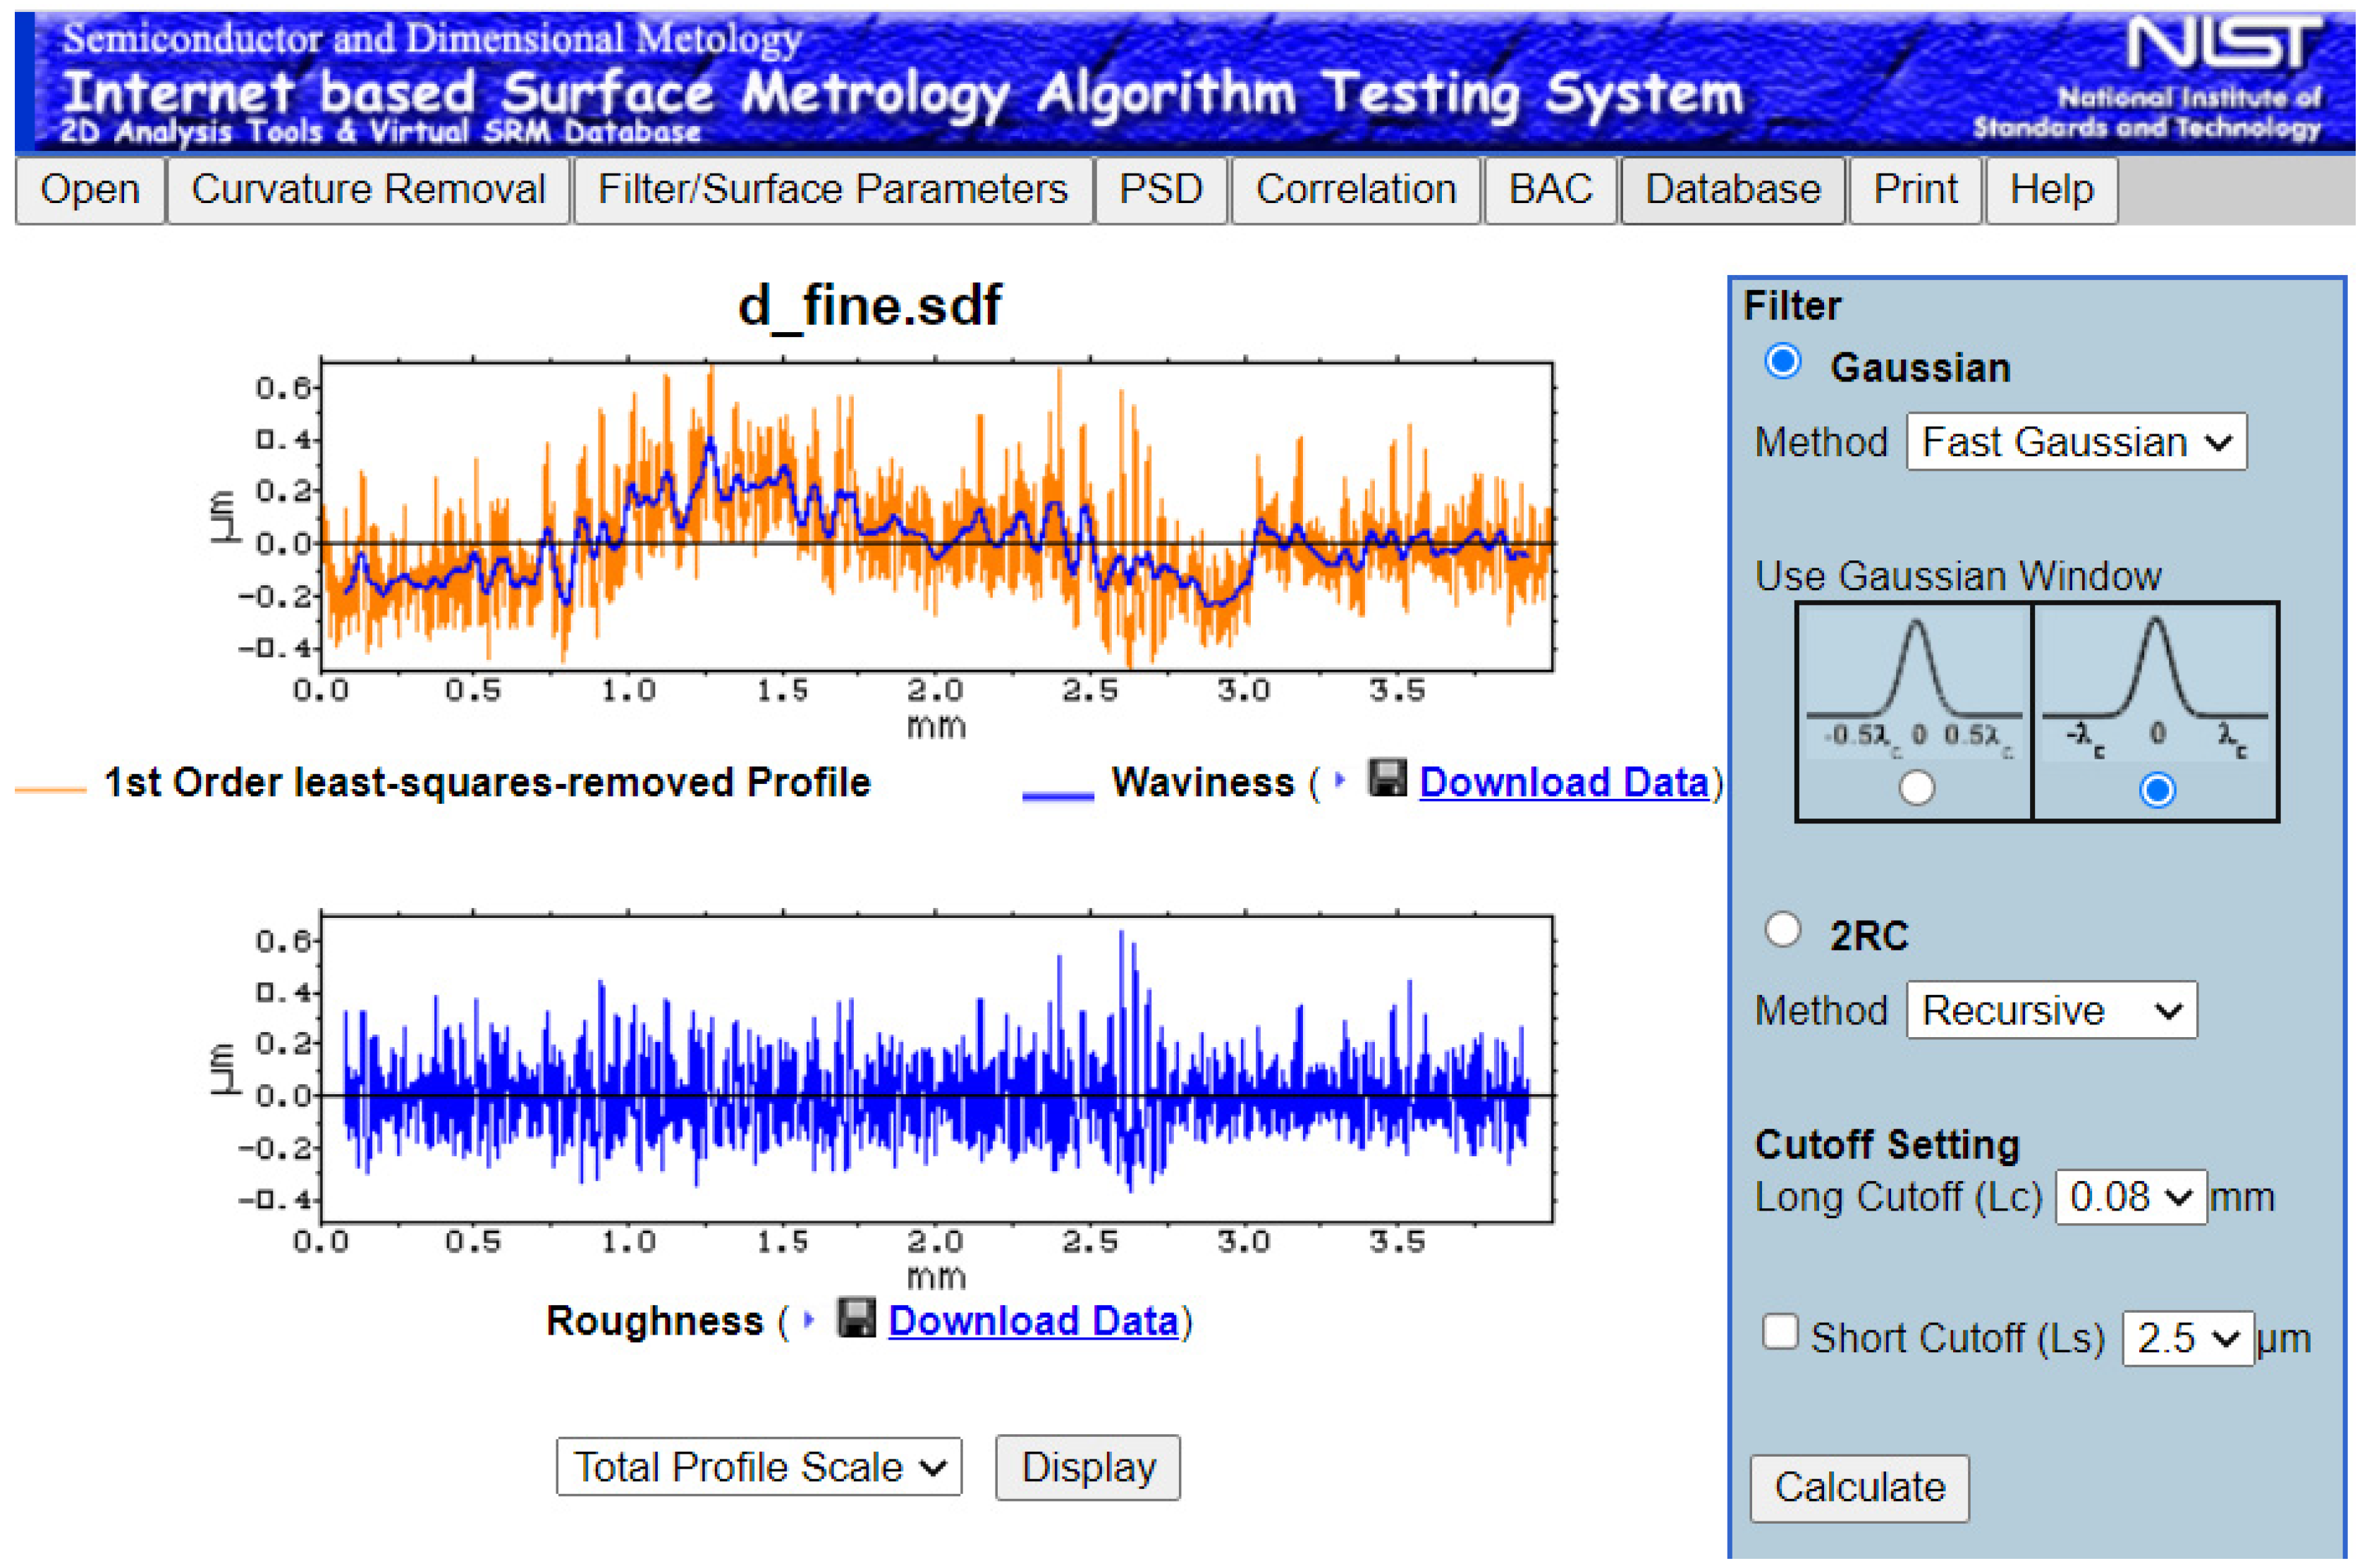
An online system developed by the NIST of the USA [
14,
30] (see
Figure 4) supports the surface height processing as mentioned above.
The system [
14,
30] provides a user interface (
Figure 4) for uploading a raw surface profile dataset. The system then uses the standard procedures and calculates parameters, including
Ra and
Rz [
14,
28,
30]. Instead of using the standard parameters, advanced parameters such as fractal dimension, surface entropy, and possibility distributions [
30] can be used to accurately quantify the complexity of surface roughness. For calculating the advanced parameters, the surface profile height datasets must be retained in BD. Thus, Extensible Markup Language (XML)-based datasets in which the information of
Ra and
Rz, only, is retained, as shown in [
31], require a revisit.
4. Preparing Datasets of Surface Roughness for BD
In
Section 2, using the literature review [
15,
16,
17,
18,
19,
20,
21,
22,
23,
24,
25,
26,
27], the scope of limitations of BD from the perspective of Industry 4.0 is described. In synopsis, the following remarks can be made.
- (a)
The raw or proposed datasets added to BD may not be able to bring benefits to smart manufacturing if the targeted usages of the datasets are not considered in the first place. This means that the datasets regarding surface roughness, as shown in
Section 3 (
Figure 3), should not be added directly to construct BD of surface roughness. Instead, the datasets must be preprocessed based on the targeted use before adding them to the BD of surface roughness.
- (b)
There is no steadfast approach available for preprocessing raw datasets collected from real-time sensor signals or past experimental and operational activities for building BD.
- (c)
Large organizations having the strength to maintain sophisticated IT infrastructures (for example, the automotive industry and chemical industry) can execute sophisticated BD analytics. However, an opposite scenario prevails for small- and medium-sized organizations.
- (d)
The effectiveness of well-known machine learning approaches while making sense of BD is controversial. For example, some authors advocate complex machine learning approaches (artificial neural networks-driven machine learning such as deep learning); others advocate rather simple ones.
Therefore, many open questions remain regarding how to construct and functionalize BD for smart manufacturing. In order to address the abovementioned problems in a befitting manner, this section presents a method that can be used to prepare the datasets of BD of surface roughness from the context of an HCPS. Before presenting the proposed method, three salient issues (BD inequality, semantic annotation, and DT) are presented as follows.
First, consider the issue of BD inequality [
32]. Recall that BD consists of a vast array of heterogeneous datasets (unstructured, semi-structured, and structured) that evolve with time [
11,
12]. Arrangements for extracting knowledge from a relevant segment of BD are computationally heavy and highly resource-dependent as well. As a result, BD benefits large organizations. Medium and small organizations fall behind. This results in BD inequality [
32]. Unfortunately, studies dealing with BD integration with an HCPS, e.g., [
33,
34,
35,
36], have not yet addressed BD inequality. For example, consider the work in [
33]. The authors formulated BD analytics, where the BD is integrated with machine learning and computational intelligence paradigms. The arrangement requires highly sophisticated computing devices and highly skilled human resources. As such, these systems are beyond the affordability of medium and small organizations. One way to minimize the involvement of sophisticated computing devices and highly skilled human resources is addressing how the datasets are prepared in the first place. Care should be taken while developing dataset preparation methods so that the methods help mitigate BD inequality.
Second, consider the issue of semantic annotation or metadata. It (semantic annotation or metadata) has become a crucial issue due to the advent of web technology, and many authors have contributed toward semantic annotation or metadata [
37,
38,
39,
40,
41,
42,
43,
44,
45]. The fact of the matter is that the new web technology called Semantic Web (SW) [
46] is in the process of replacing its predecessor. SW-based datasets need both the datasets themselves and “data about datasets”. This “data about datasets” is referred to as semantic annotation or metadata. As a result, all relevant datasets can be gathered quickly—the search engines become more effective—which is not the case now. At the same time, the semantic annotations facilitate the amalgamation of relevant datasets scattered in different information silos. However, for constructing metadata, different types of ontological approaches are proposed in the literature. Most of the approaches depend heavily on the query language and data access protocol (e.g., SPARQL) customized for the resource description framework (RDF) [
47]. As a result, the current semantic annotation preparation approaches are unscalable and esoteric. Making the semantic annotation preparation approaches more user-friendly and scalable and less esoteric is a challenge. This challenge can be overcome if natural language-based semantic annotations are used, ensuring the freedom of using any phrases that the users prefer. In this respect, concept mapping is the right approach, as shown in [
5,
48].
Last, consider the case of DT (
Figure 1). By definition, DTs are the computable virtual abstractions of real-world objects, processes, and phenomena [
5,
39]. They have real-time response capacity. As mentioned, DTs host knowledge extraction systems, knowledge-base, and human-like cognitive tasks and provide (or receive) feedback to (or from) the IoT-based manufacturing enablers. They keep the enablers adaptive to new situations. Thus, they serve as the brains of the IoT-based enablers. Since surface roughness is a manufacturing phenomenon, a DT dealing with surface roughness is a phenomenon twin. A phenomenon twin (of surface roughness) consists of five modules: input module, modeling module, simulation module, validation module, and output module [
49]. The input module extracts information from a source (e.g., BD) for building other modules. The modeling module models a phenomenon. The simulation module simulates the expected outcomes of the phenomenon upon request from the respective enablers. The validation model validates the integrity of results produced by the twin. Finally, the output module integrates the twin with the relevant IoT-embedded enablers. See [
49,
50] for more details.
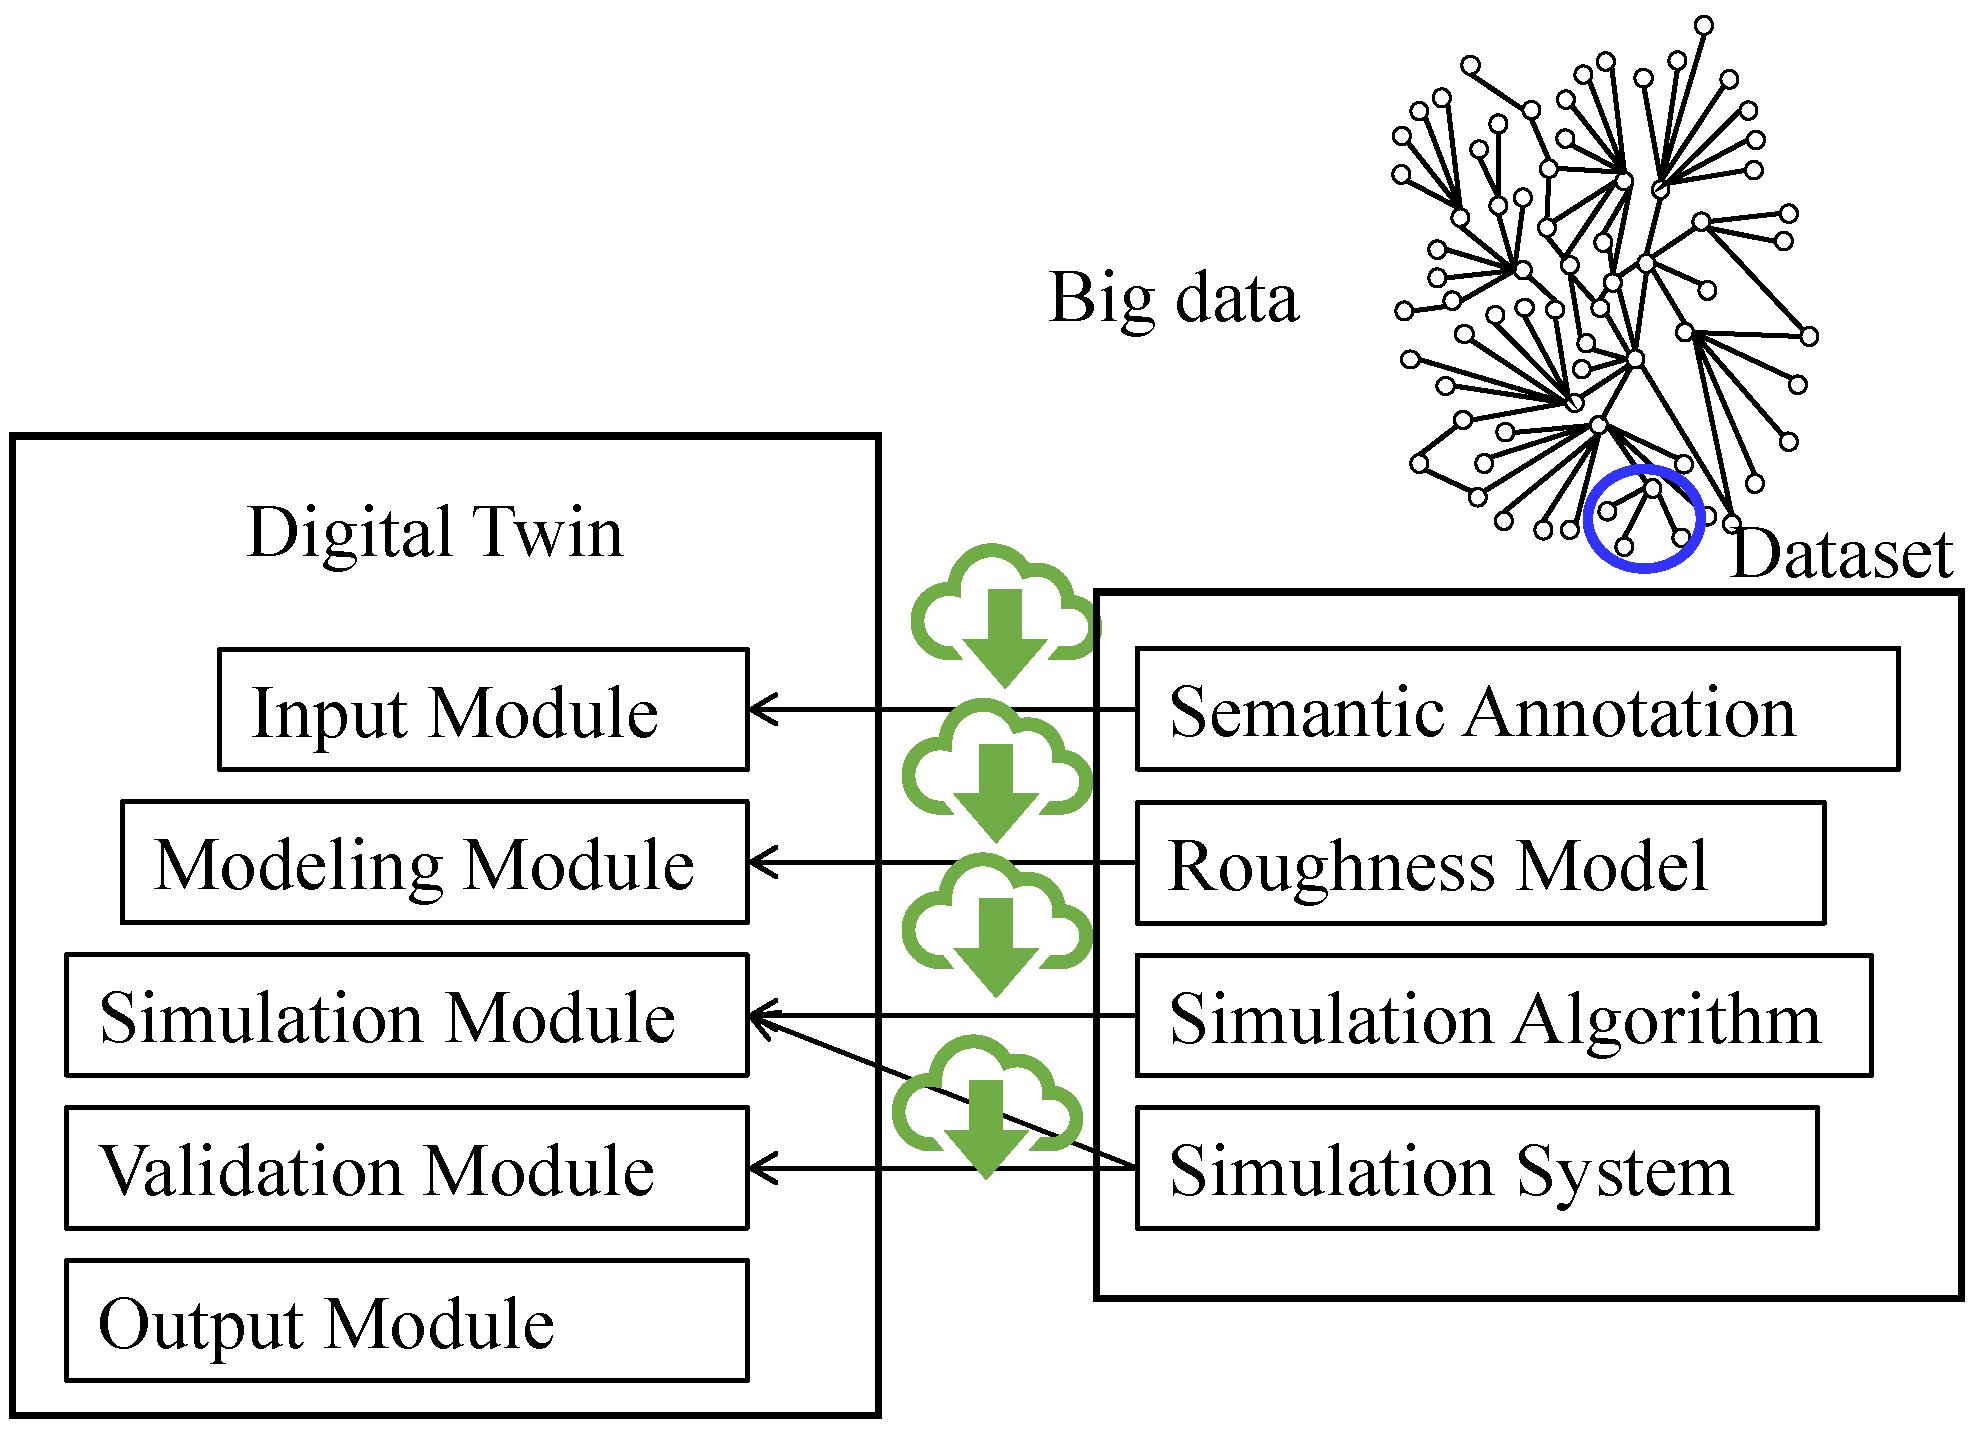
Considering the issues of BD inequality, semantic annotation, and DT, a BD preparation method is proposed, as schematically illustrated in
Figure 5. As seen in
Figure 5, a dataset of BD consists of four segments denoted as semantic annotation, roughness model, simulation algorithm, and simulation system. These segments can be downloaded while developing a DT of surface roughness.
The segment denoted as semantic annotation provides information for the input module of the digital twin. The segment denoted as the roughness model provides information for the modeling module of the digital twin. The segment denoted as the simulation algorithm provides information for the simulation module of the digital twin. The segment denoted as simulation system provides information for both the simulation and validation modules of the digital twin. There are no segments in a dataset that provide information for the output module of the digital twin. Based on the proposed method, a set of datasets of surface roughness is constructed for different types of material processes such as turning, milling, grinding, polishing, and electric discharge machining. The results regarding grinding are shown in the next section.
5. Results and Discussions
This section presents the noteworthy results obtained using the proposed method and discusses the results’ implications.
For better understanding, the roughness model segment of the dataset is presented first, as follows. The roughness model segment presents the information of the delay map of a roughness profile. Two pieces of information are stored. The first is the roughness DNA, and the other is two sets of possibility distributions induced from the delay map. For this, the following formulation is considered. Let
x(
i) ∈ [0,1],
i = 0, 1, …, be the normalized heights of a measured surface. A delay map consists of the ordered-pair (
x(
i),
x(
t +
d)),
i = 1, 2, …, where
d denotes the delay, a non-zero integer. Let
Sj,
i = 1, 2, …,
M be the states of roughness dividing the interval [0,1] into
M mutually exclusive intervals. The states of
x(
i) are represented by a roughness DNA = (
Si|
i = 0, …,
N) so that ∀
Si ∈ {
Sj|
j = 1, …,
M}. The abscissa of the delay map is represented by the triangular fuzzy numbers (
a1(
Sj),
b1(
Sj),
c1(
Sj)),
j = 1, …,
M, where [
a1(
Sj),
c1(
Sj)] is the range of
Sj, and
b1(
Sj) is the midpoint of
Sj. The ordinate of the delay map is represented by the triangular fuzzy number (
a2(
Sj),
b2(
Sj),
c2(
Sj)),
j = 1, …,
M, where the support [
a2(
Sj),
c2(
Sj)] and core
b2(
Sj) are determined using the probability-possibility transformation applied to the map, as defined in [
51].
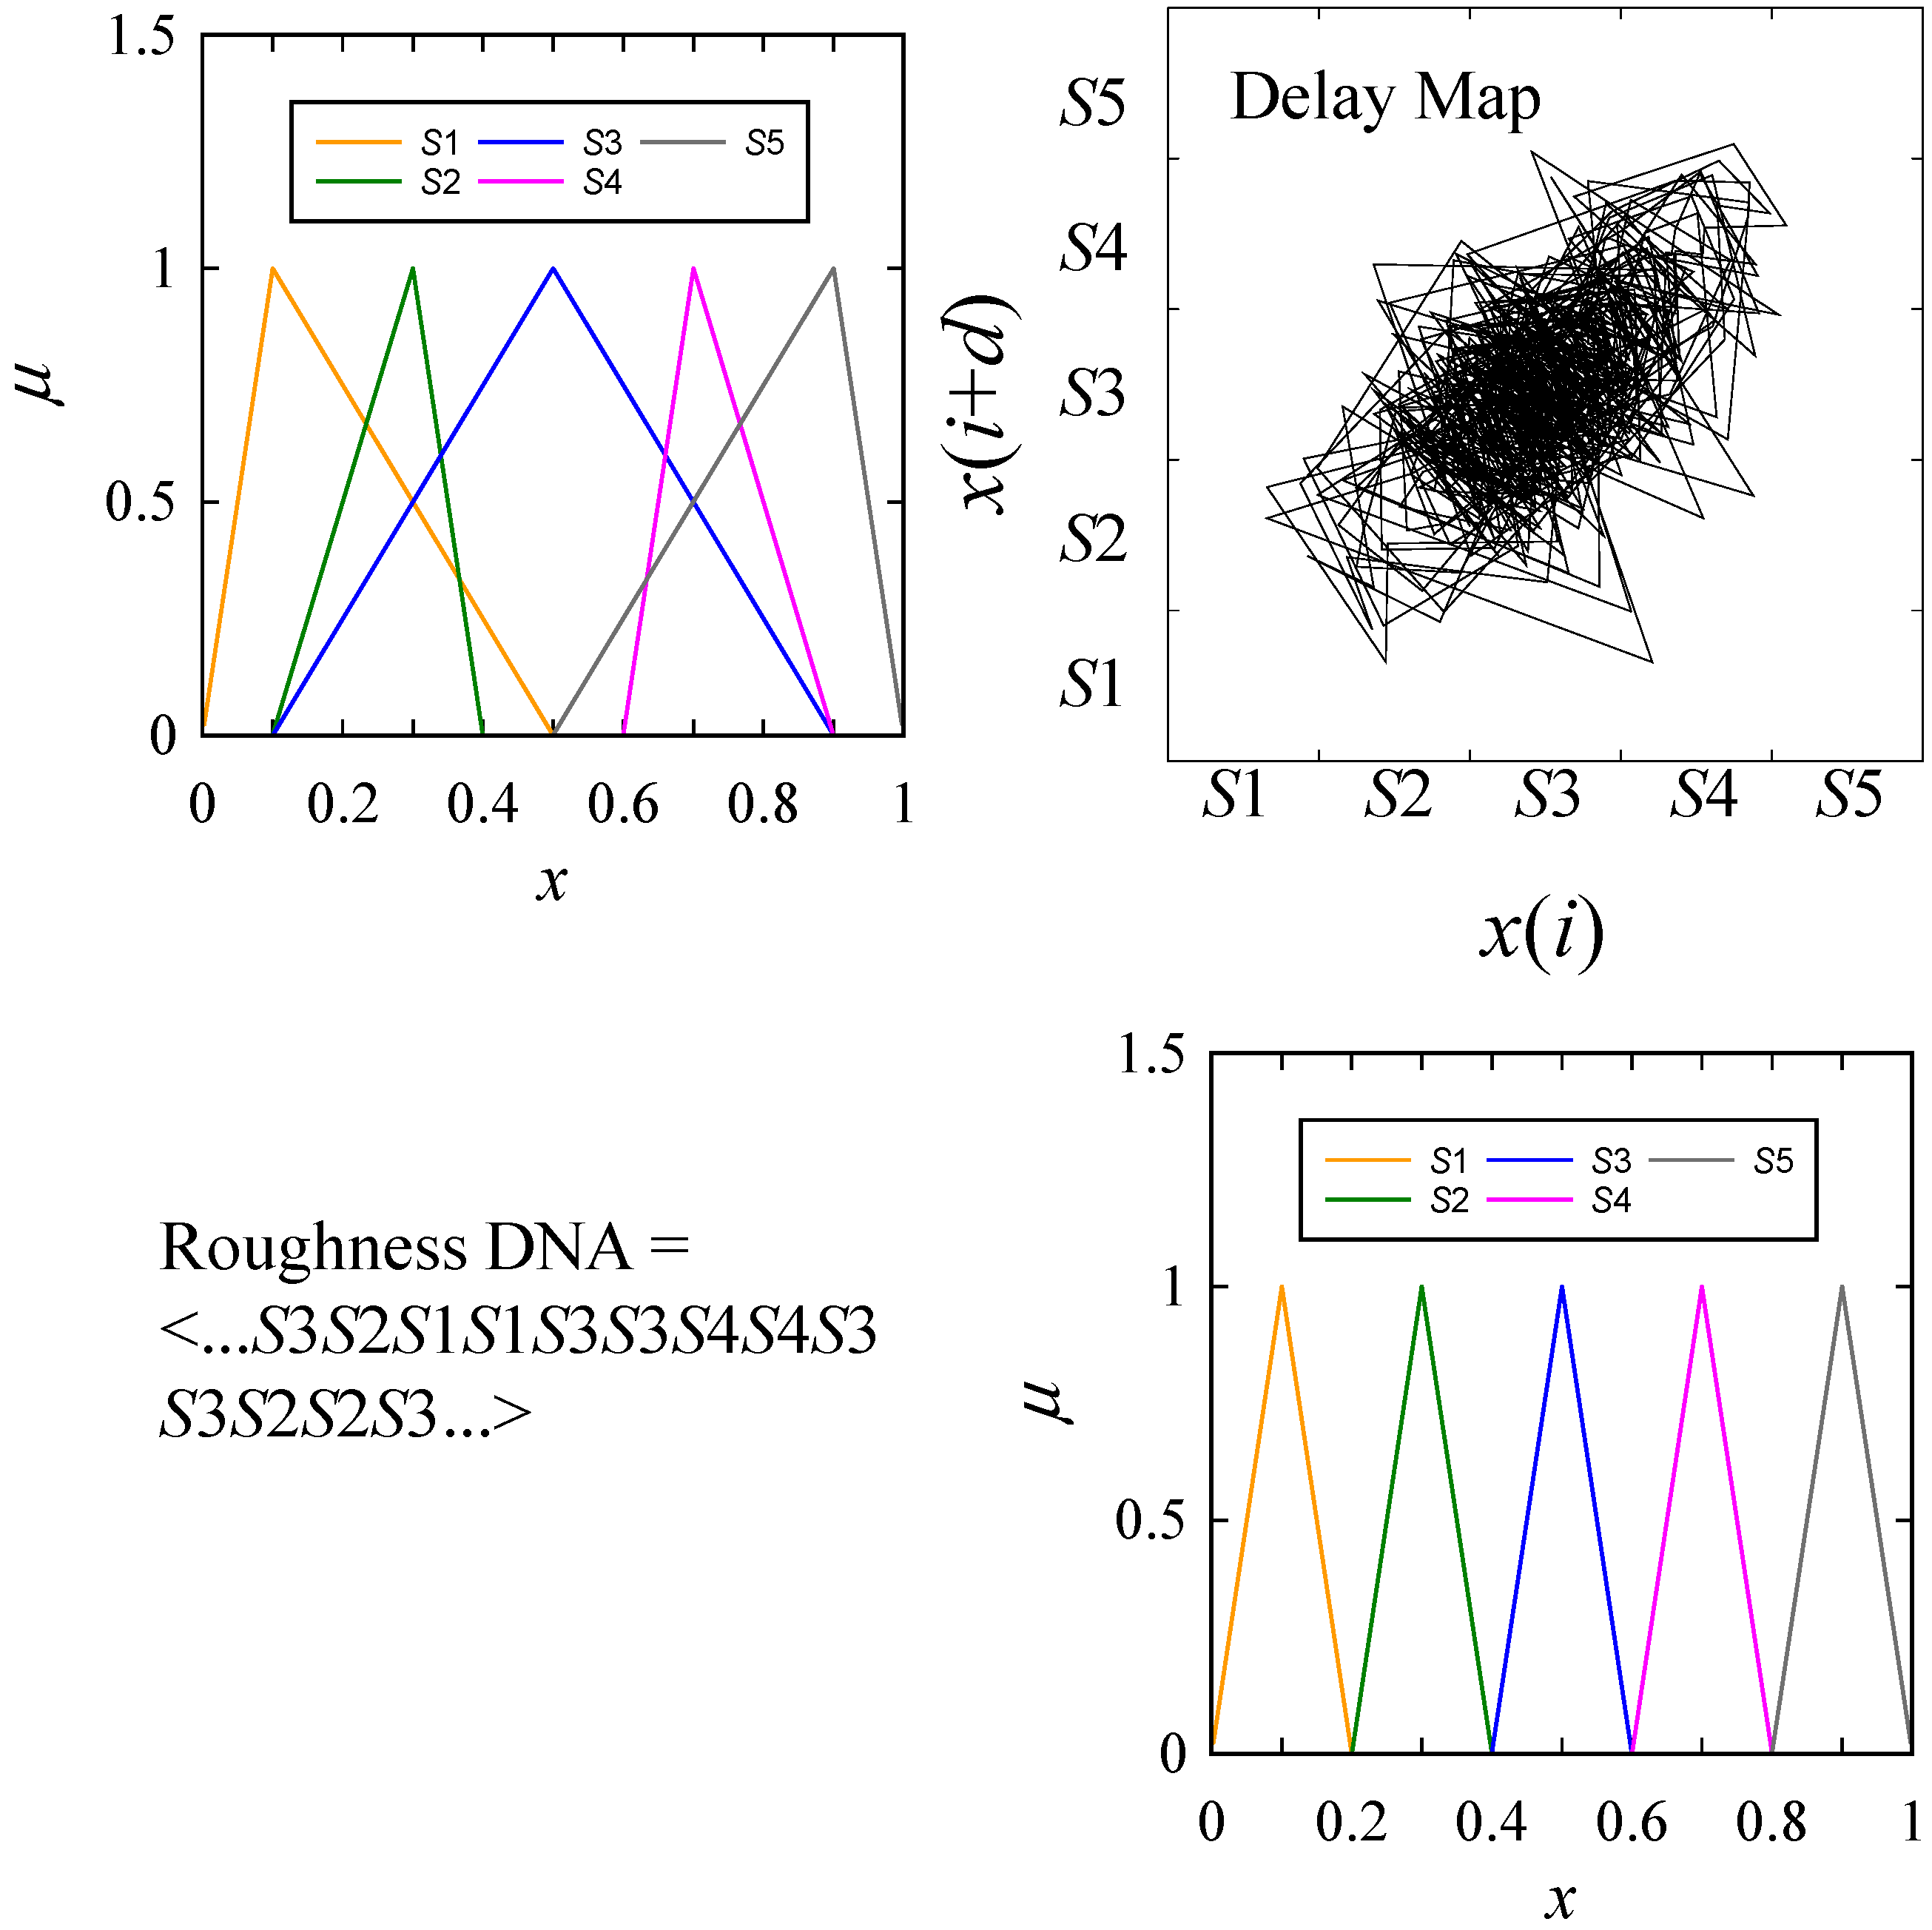
Figure 6 shows a typical surface roughness model.
Note the presence of two sets of possibility distributions and the roughness DNA. The case shown in
Figure 6 corresponds to five-state modeling, S1, …, S5, where
M = 5. The simulation algorithm is shown by Algorithm 1 (Surface Profile Simulation).
| Algorithm 1: Surface Profile Simulation. |
| 1: | Define | |
|
|
| 2: | Initialization | |
| 3: | Calculate | For |
| 4: | | For |
| 5: | | | |
| 6: | | | |
| 7: | | End For |
| 8: | | |
| 9: | | For |
| 10: | | If Then |
| 11: | | | |
| 12: | | | |
| 13: | | | If Then |
| 14: | | | |
| 15: | | | Else |
| 16: | | | |
| 17: | | End For |
| 18: | End For |
| 19: | Output | |
| 20: | Calculate | For |
| 21: | | | If |
| 22: | | | | |
| 23: | | | Else |
| 24: | | | | |
| 25: | | | | |
| 26: | End For |
| 27: | Output | |
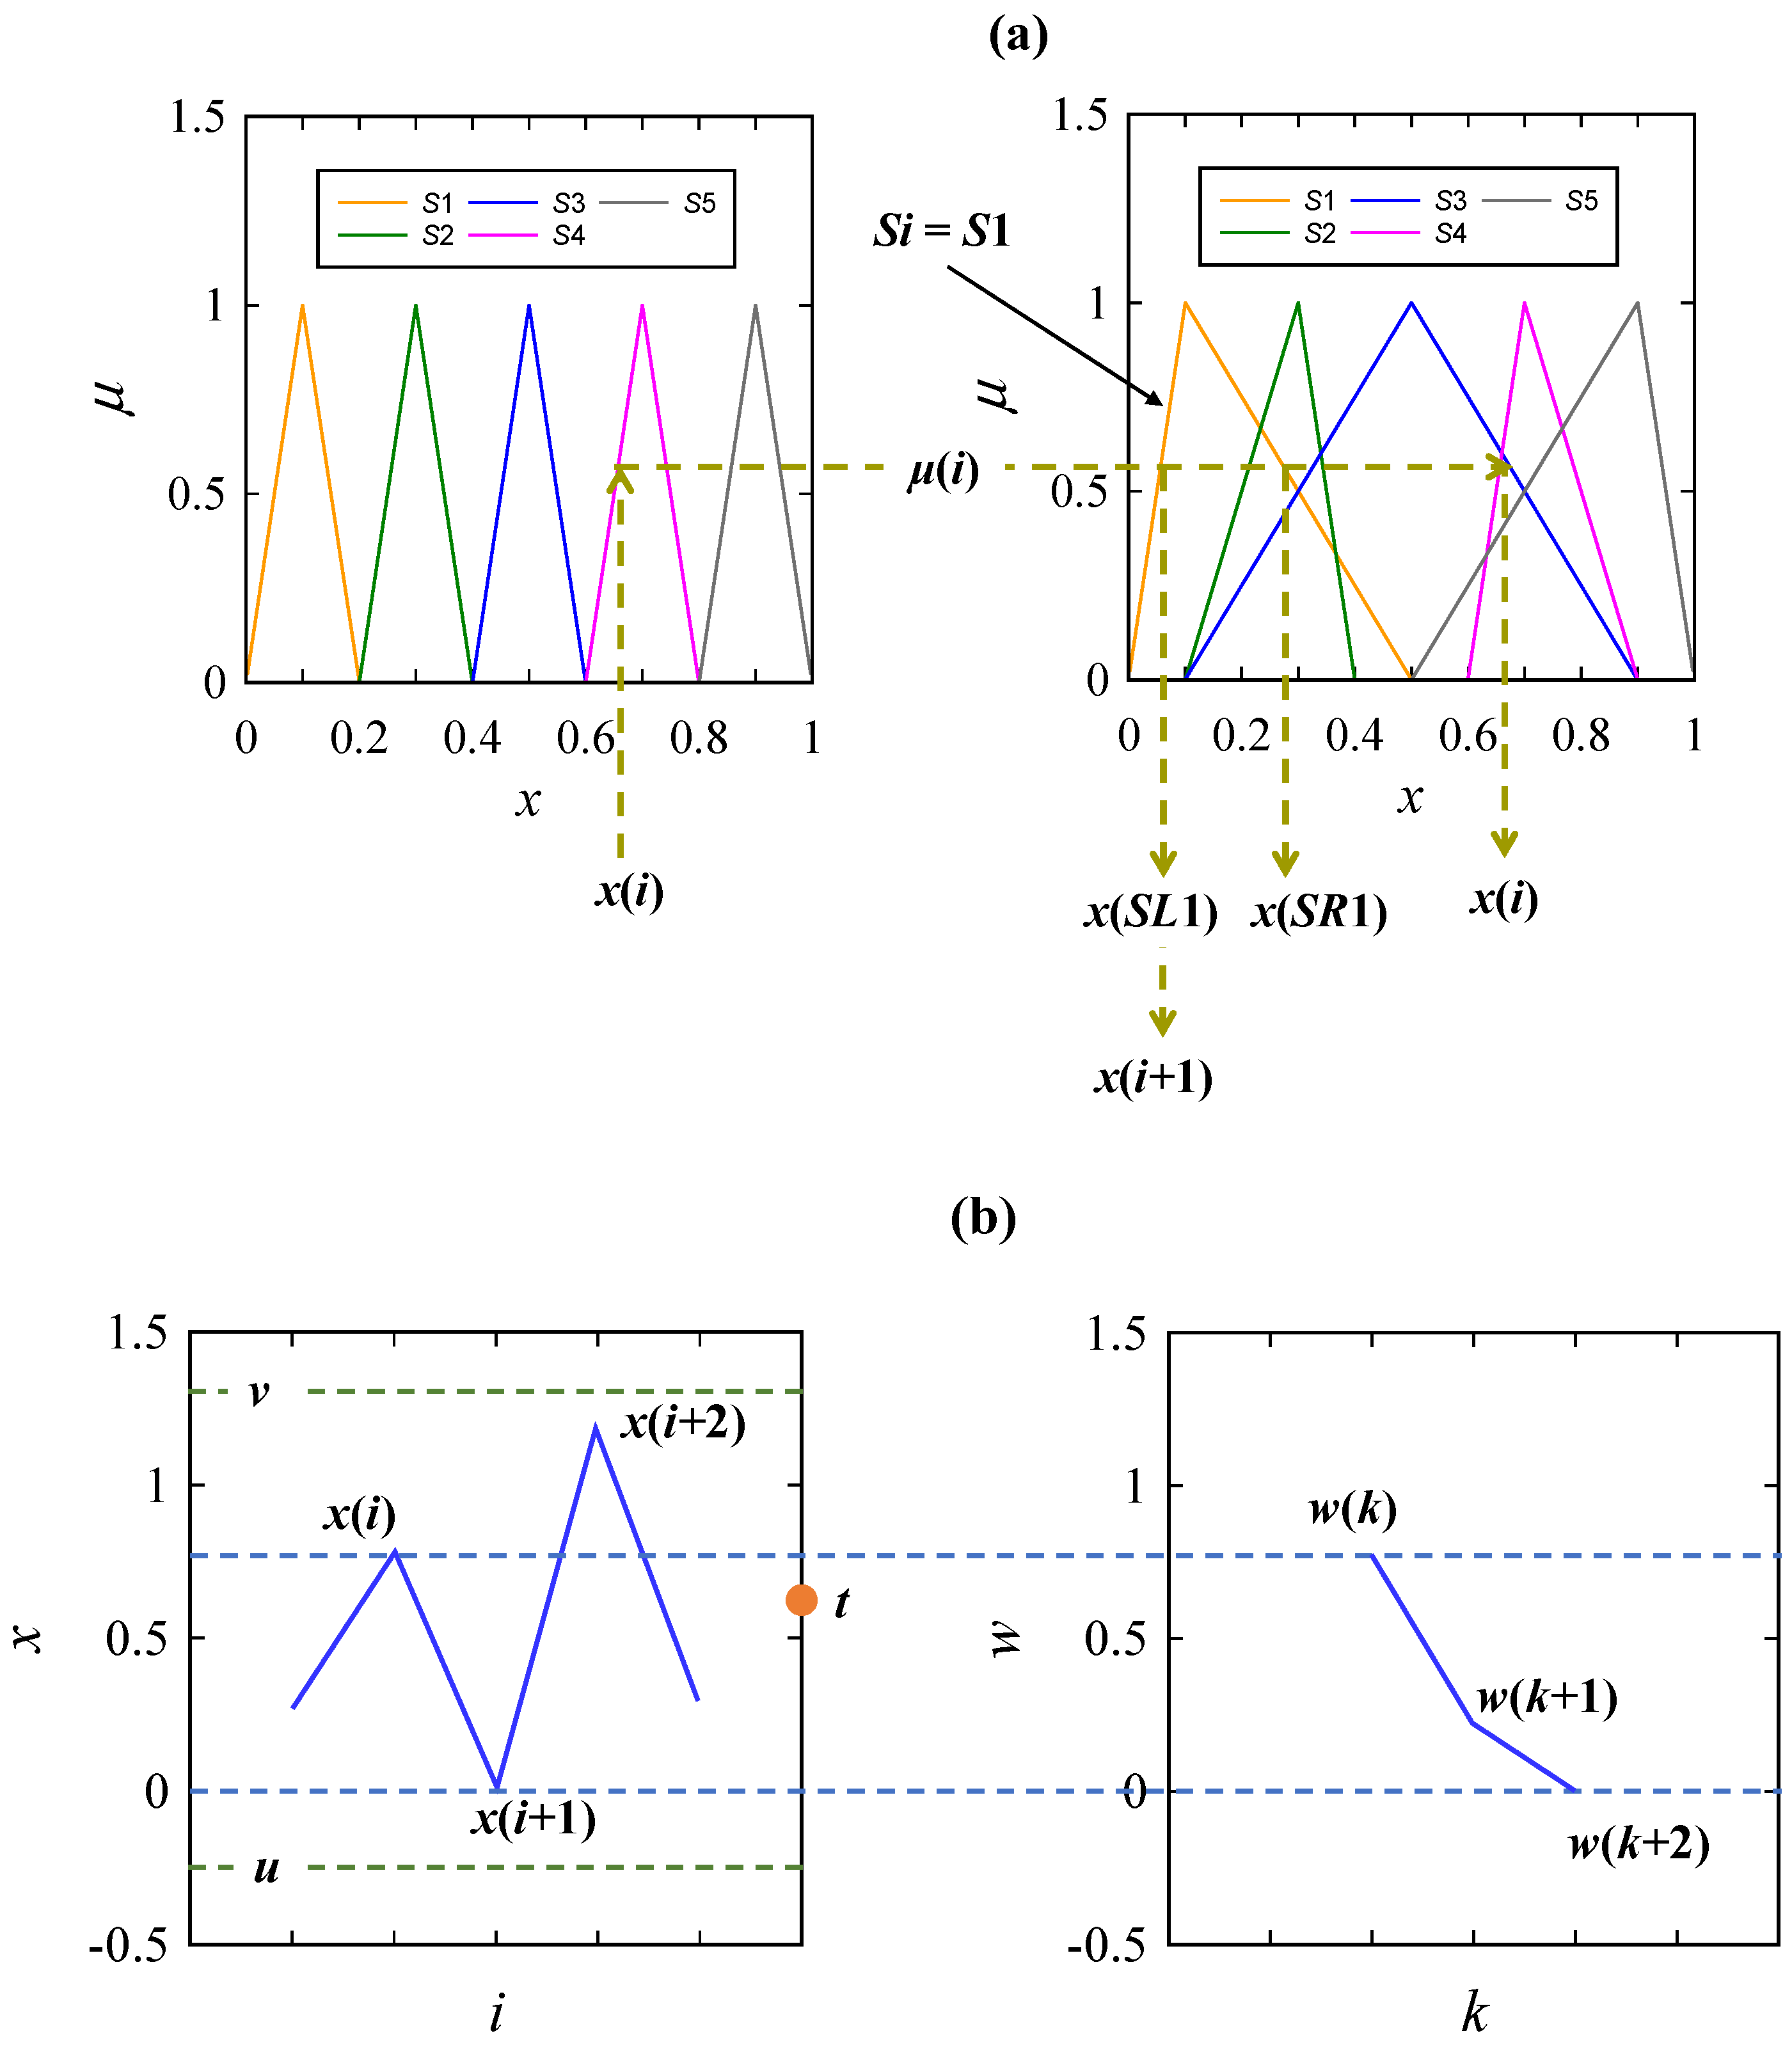
The calculation processes associated with Algorithm 1 are schematically illustrated in
Figure 7. As seen in
Figure 7, the simulation process acknowledges the roughness model (roughness DNA, possibility distributions, definitions of states). It initializes the roughness height
x(0) by a random number
r1 ∈ [0,1]. After that, it calculates the maximum degree of belief and sets it as
μ(0) from the fuzzy numbers assigned to the abscissa. It then calculates the values denoted as
x(
SLj) and
x(
SRj) for the state
Si (this time,
i = 1) dictated by the roughness DNA, as schematically illustrated in
Figure 7a. The algorithm then chooses one of the calculated values that is the most far from
x(0) compared with the other and assigns it as
x(1). This way, the simulation algorithm continues its simulation process for all
i = 0, …,
N. This results in simulated roughness heights
x(
i),
i = 0, …,
N. The simulated heights are linearly interpolated according to steps 20, …, 26, as schematically illustrated in
Figure 7b. As seen
Figure 7b, two consecutive heights,
x(
i) and
x(
I + 1), are linearly interpolated using a random value
r2 ∈ [
u,
v], where
u ≤ 0 and
v ≥ 1. This results in a new time series
w(
k),
k = 0, …, 2
N, where
x(
k) =
x(
k/2) if
k is an even number, and
w(
k) is the interpolated value when
k is an odd number. Therefore, the outcomes,
w(
k),
k = 0, …, 2
N, are the simulated surface roughness models.
The segment coupled with the simulation algorithm segment is the simulation system because the system is developed using the simulation algorithm. The simulation system must be kept simple to mitigate the BD inequality (see
Section 4). At the same time, it must be executable by many stakeholders, including those who belong to medium and small organizations. Based on this consideration, the authors used a spreadsheet-based computer program to build the simulation system; one of the user interfaces is shown in
Figure 8. As seen in
Figure 8, the user can set a delay and input the data points of surface roughness heights. The system simulates the surface roughness heights. The similarity between the simulated and real surface roughness heights can be compared in terms of time series, delay maps, and possibility distributions, as shown in
Figure 8.
The contents shown in
Figure 6,
Figure 7 and
Figure 8 do not incomplete the dataset of surface roughness for constructing BD. The semantic annotation segment must be added to complete the dataset. This segment (semantic annotation) becomes the face of the dataset. It integrates other segments shown in
Figure 6,
Figure 7 and
Figure 8. At the same time, the XML codes generated from the semantic annotation link the BD to a DT and other constituents of the HCPS. The remarkable thing is that the semantic annotation segment manifests a concept map (a user-defined ontology of the issue considered). Before constructing the concept map, a set of proposition blocks (PBs) must be considered expressed by natural language (here, English). The number of propositions depends on the individuals who construct them. Some of the PBs provide a general description, and some others represent the dataset segments. PBs share some common concepts, resulting in a concept map.
Here, a seven proposition-based set of PBs for constructing the semantic annotation segment of the dataset are considered. These PBs are listed in
Table 1.
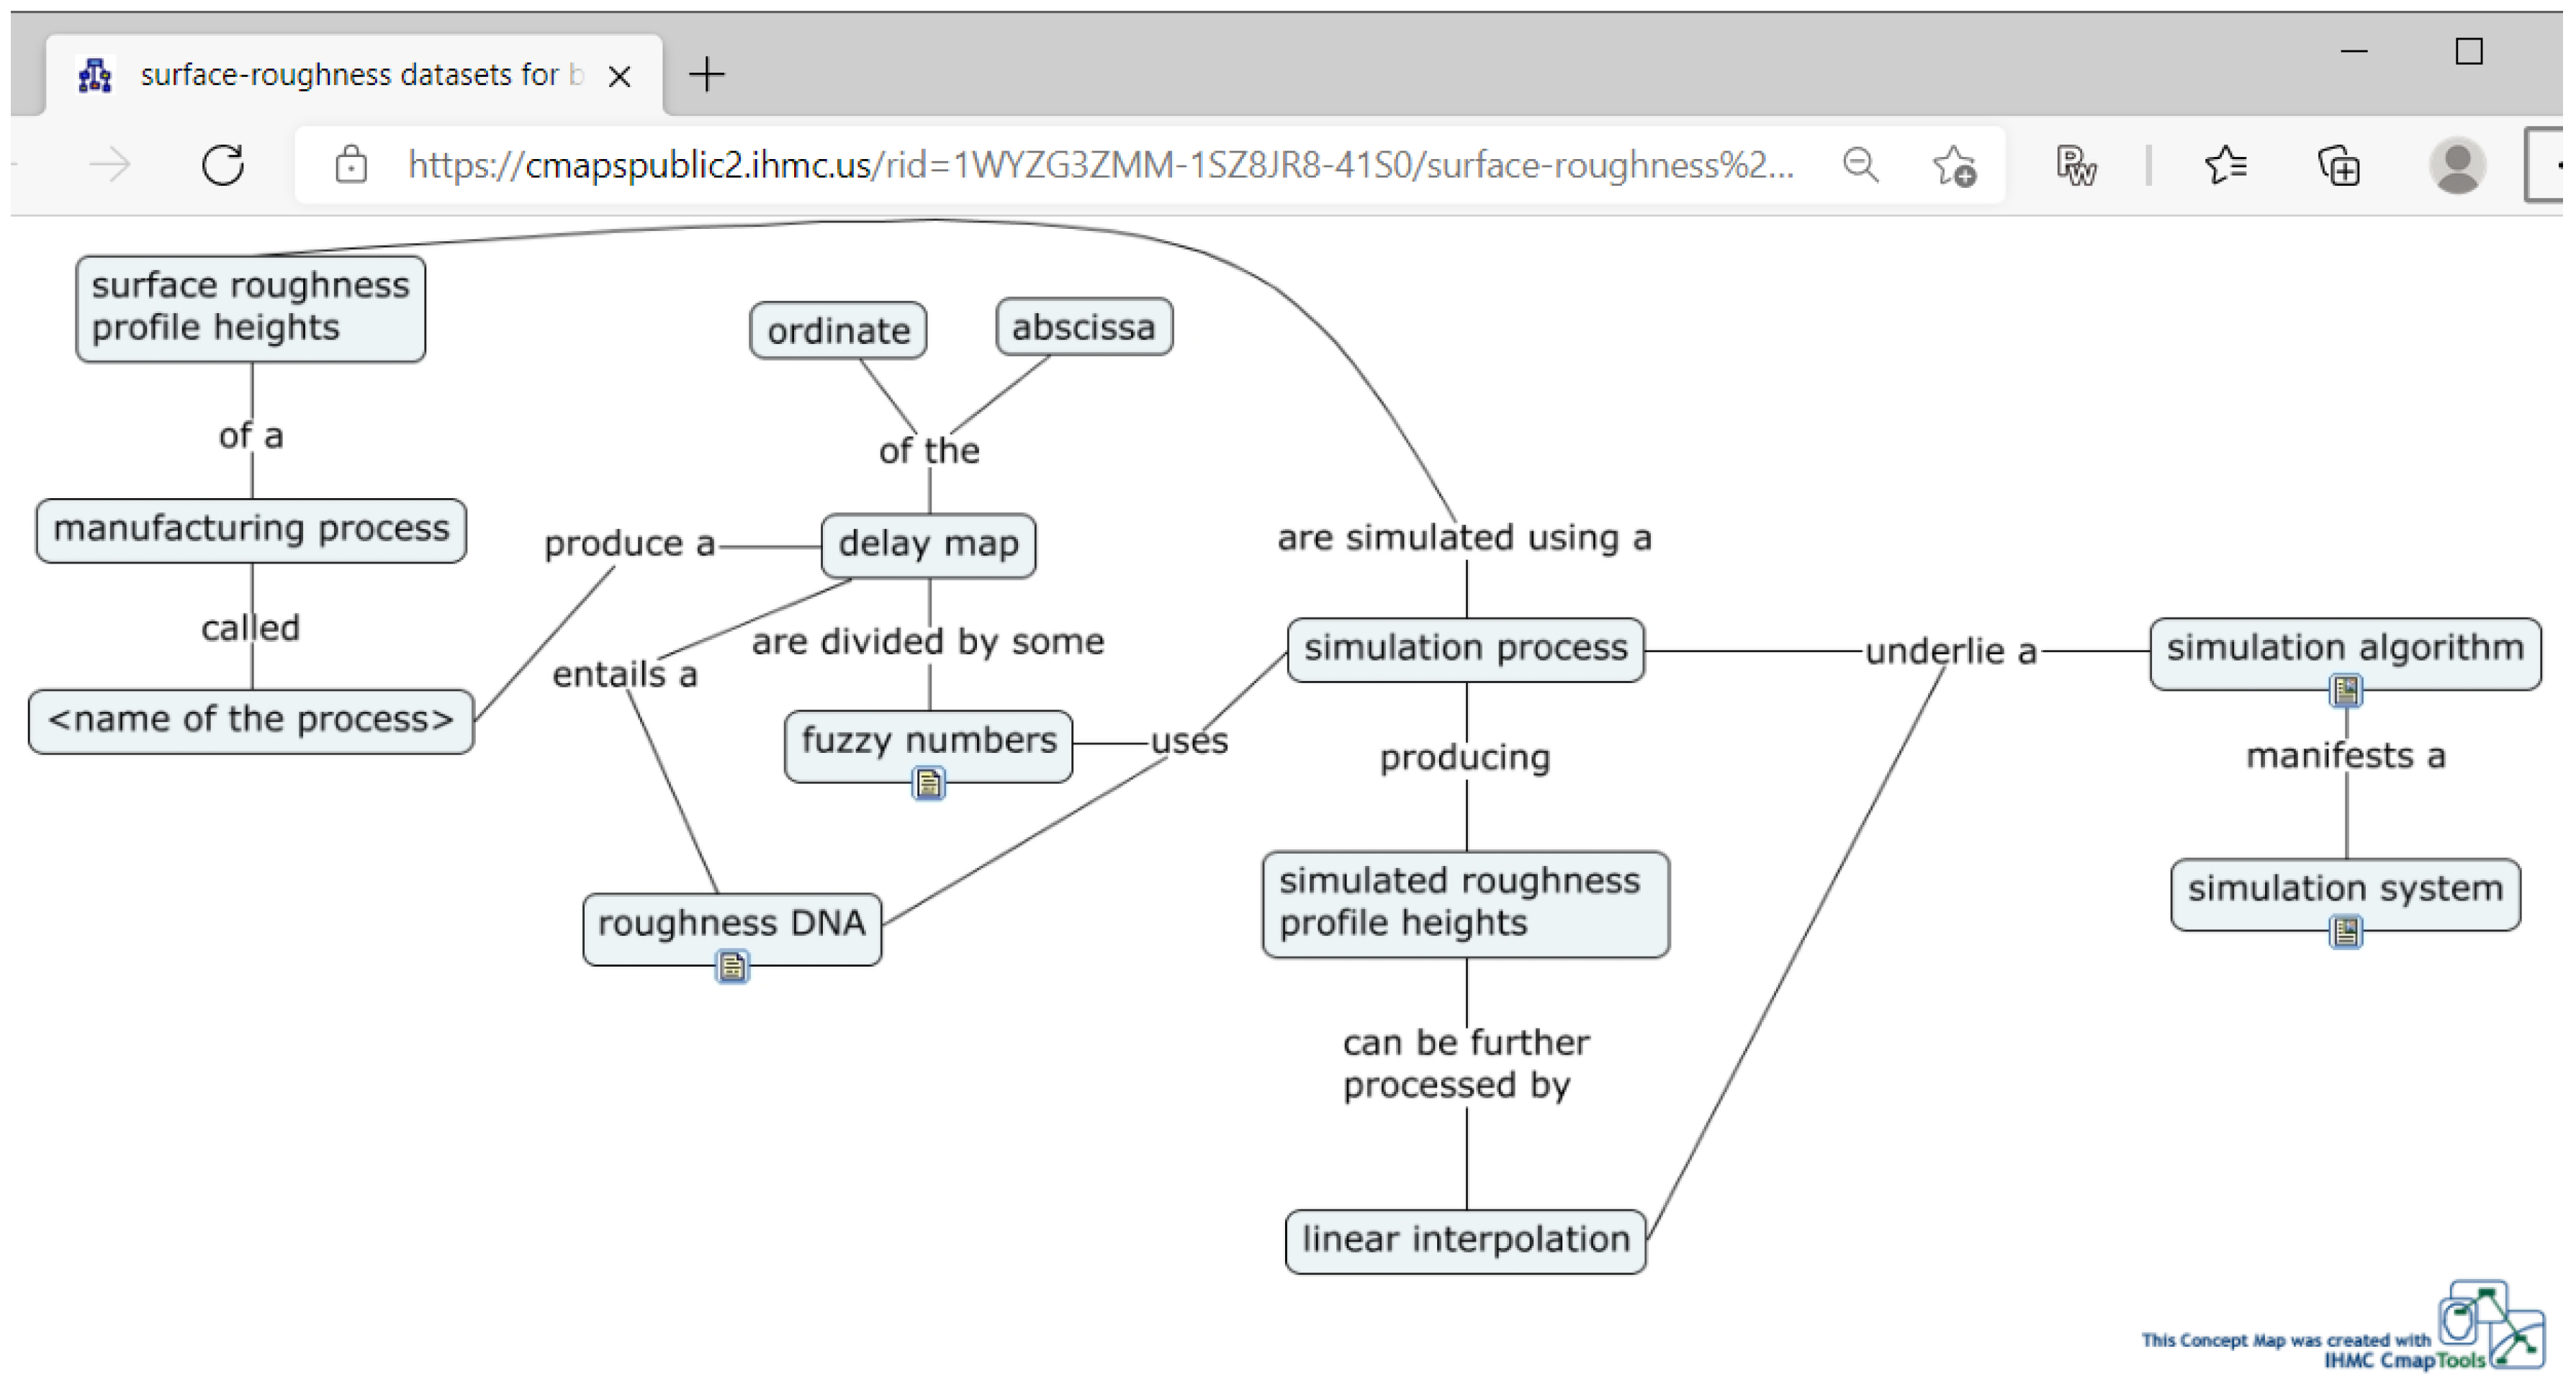
The resulting concept map is shown in
Figure 9. This map is the semantic annotation segment of the surface roughness dataset to be added to BD. The URL of this annotation is
https://cmapspublic2.ihmc.us/rid=1WYZG3ZMM-1SZ8JR8-41S0/surface-roughness%20datasets%20for%20big-data.cmap (accessed on 20 October 2021). It can be accessed through the Internet. The annotation also carries the roughness DNA, fuzzy numbers of the return map, simulation algorithm, and the simulation system, which can be downloaded for reuse (for building DT of surface roughness). Alternatively, XML code of the annotation can be generated to use the code in an IoT-based enabler network directly.
Note that other methods can also model chaotic data points such as surface roughness heights: Markov chain, DNA-based computing, non-stationary Gaussian process, semantic modeling, and the like [
49]. The roughness model, simulation algorithm, and simulation system segments are in accord with the modeling method. Even though the dataset segments are reconstructed according to the modeling method, the dataset structure remains the same. Thus, the dataset structure (semantic annotation, roughness model, simulation algorithm, and simulation system) serves as the metadata of the surface roughness.
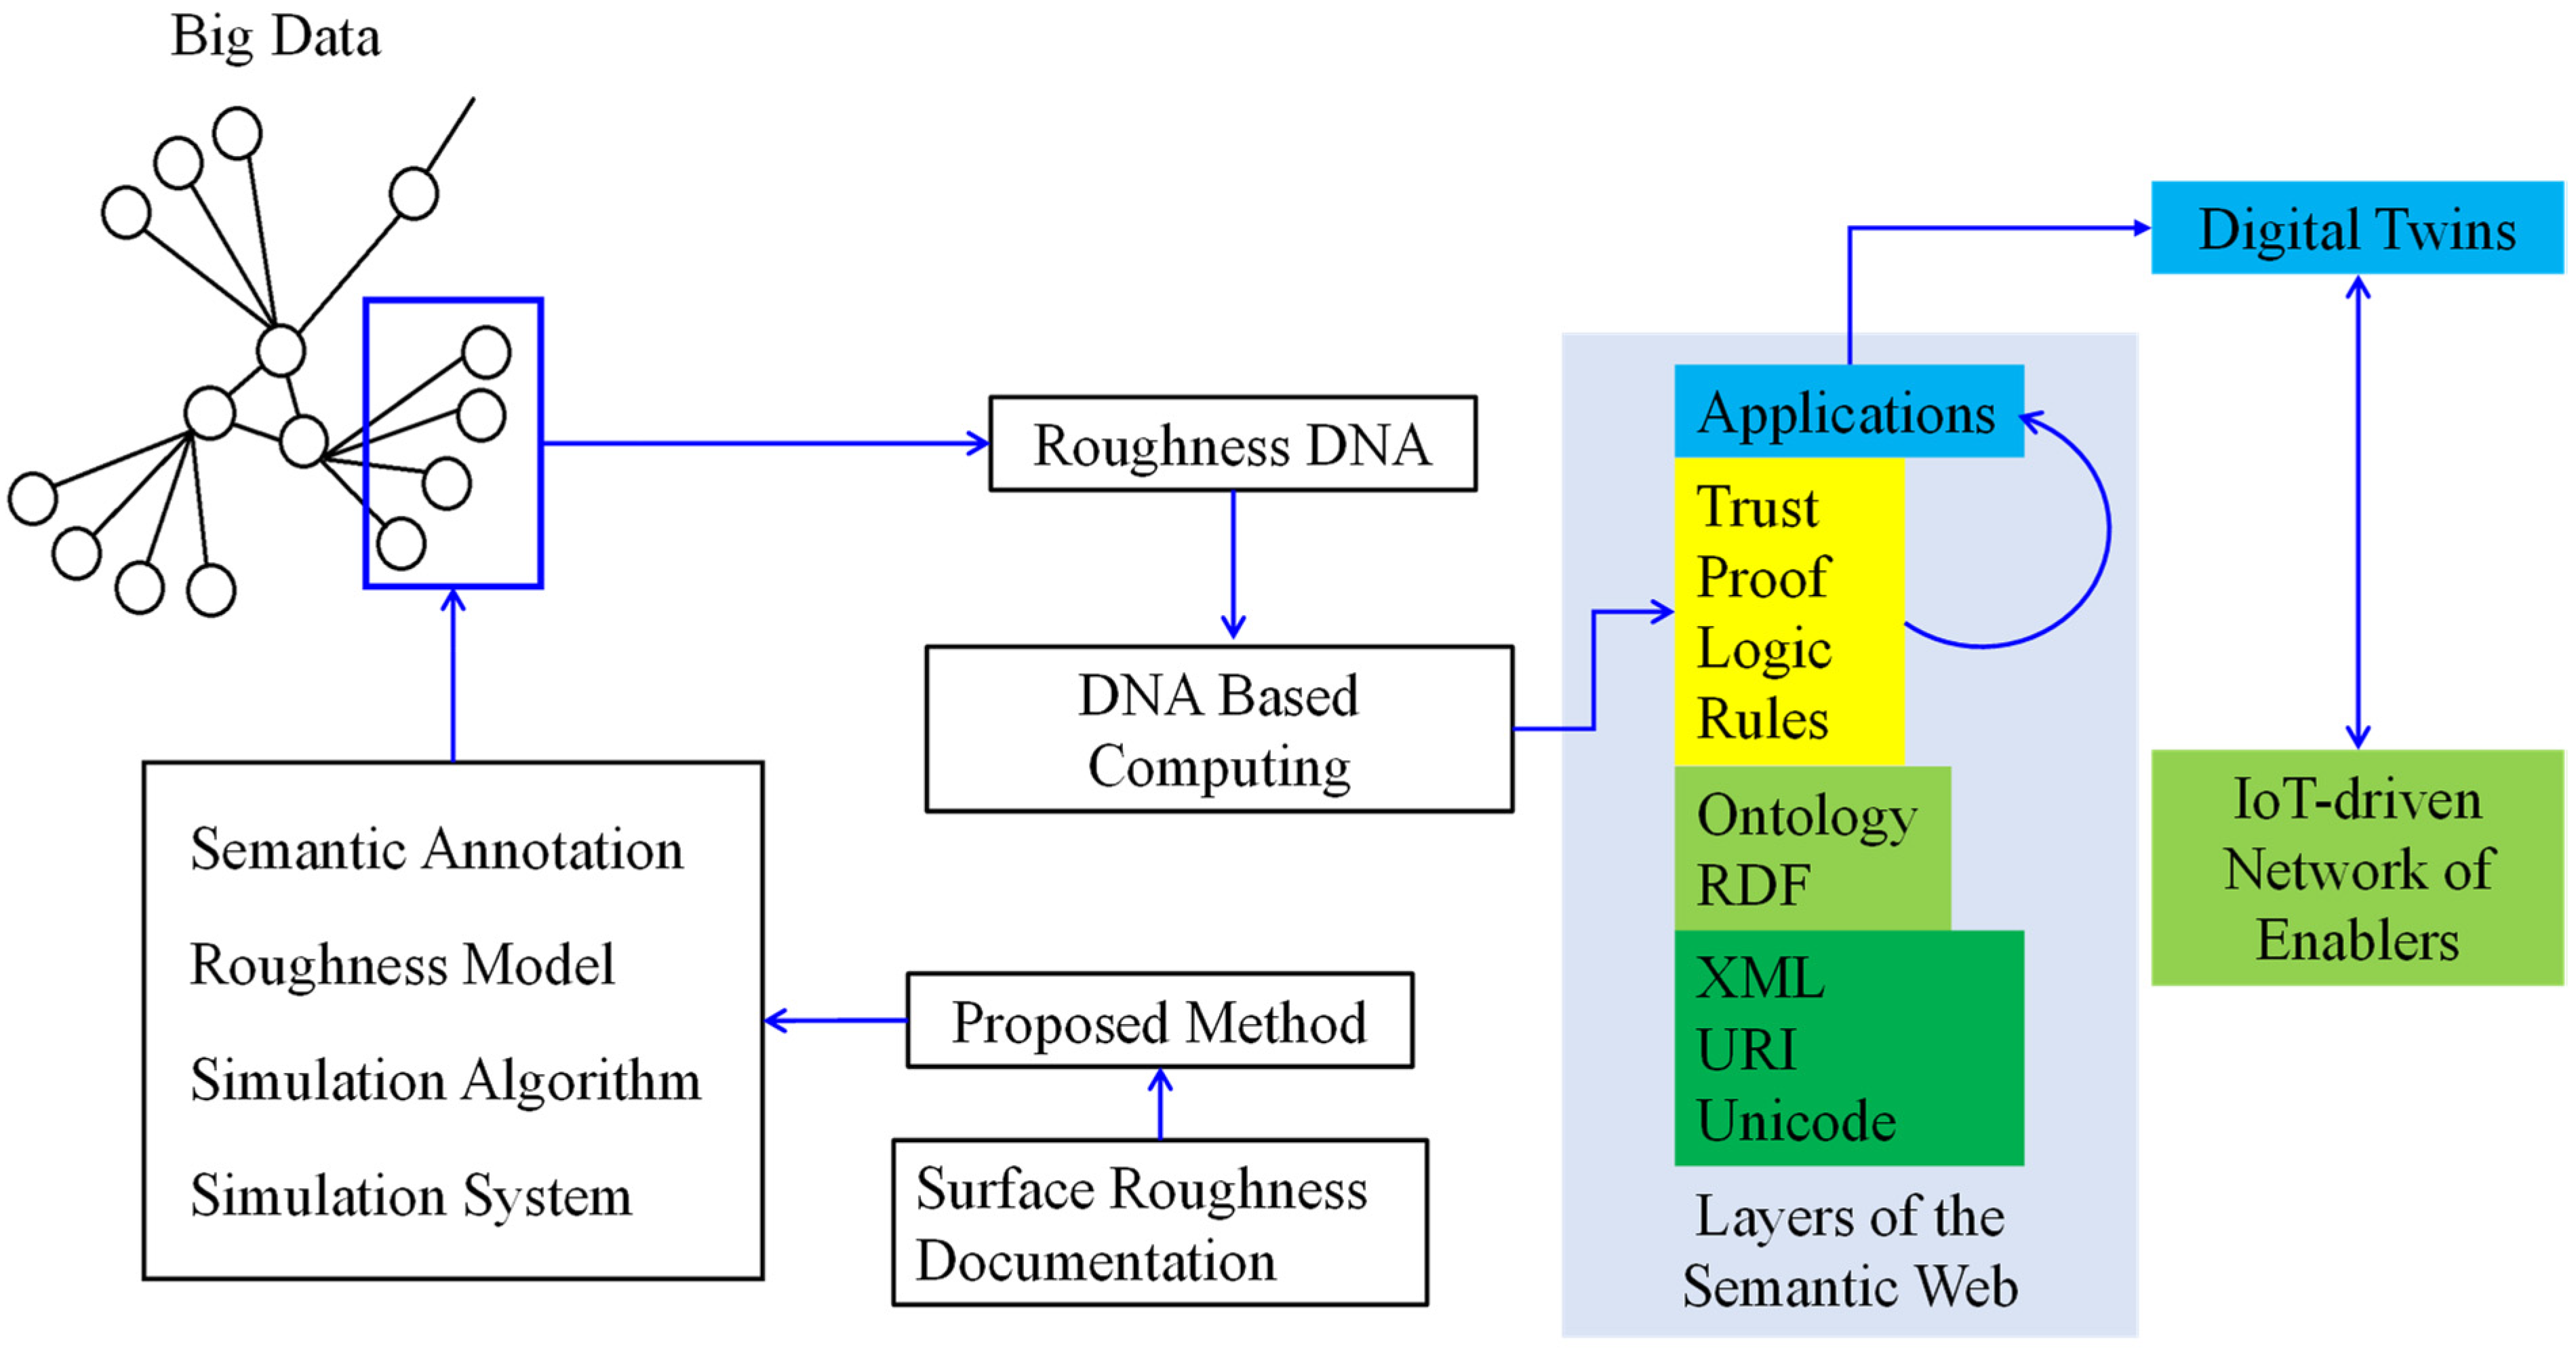
Security Assurance
Security assurance in Industrial Internet of Things (IIoT) is a critical issue. The datasets prepared by the presented data preparation method help assure security. For understanding the interplay of security assurance and presented dataset preparation method, consider Roughness DNA (one of the elements of the roughness model) and the provenance layer of the Semantic Web (SW), as schematically illustrated in
Figure 10. The concept of SW has been proposed for smoothly exchanging and reusing information among large information silos [
52]. The main idea is to extend the potency of the Web with an analogous extension of the human’s cognitive process [
52,
53]. SW consists of four layers—syntax layer (XML, URI, and Unicode), semantic layer (ontology and RDF), provenance layer (rule, logic, proof, and trust), and application layer [
53]. The syntax layer encodes datasets to be exchanged. The semantics layer provides the meaning of the datasets. The provenance layer ensures the trustworthiness of the datasets for reuse. Finally, the applications layer hosts the applications by which the users (humans and other systems) exchange and reuse the information. The XML code produced from the semantic annotation (
Figure 9) populate the syntax layer. Similarly, the semantic annotation itself provides the information for the semantics layers. Finally, some segments of the Roughness Model (
Figure 6) can be used in the provenance layer. In this case, Roughness DNA can be input to a DNA-Based Computing (DBC) [
54,
55] system to see the integrity of the datasets to be transferred to digital twins of surface roughness. It has been shown that a DBC system effectively builds trust in the content related to the manufacturing process. Consequently, a DBC system can help achieve a trustworthy exchange of content. This phenomenon is referred to as
pragmatic adaptation of resources from one working environment (big data) to another (digital twin). See [
54,
55] for more details. It is worth mentioning that as a consequence of the
biologicalization of manufacturing, representation of manufacturing data and knowledge using DNA-like information has earned a great deal of attention [
29,
56].
6. Concluding Remarks
The datasets included in human-cyber-physical system-friendly BD must have the following three characteristics: (1) The datasets must be readily accessible to all stakeholders through the Internet; (2) The datasets must be both human- and machine-readable; (3) The datasets can effortlessly be integrated with the machine-learning-based knowledge extraction segment of a digital twin. Unfortunately, BD exhibiting the abovementioned characteristics is not readily available. Thus, it (BD) needs to be prepared from the documentation of past research and operational activities. This is a challenge because of the lack of a steadfast procedure. This study fills this gap by presenting a state-of-the-art method for preparing the datasets of surface roughness to be included in industrial BD from the context of smart manufacturing and cognitive computing.
The surface roughness datasets included in human-cyber-physical system-friendly BD consist of four segments: semantic annotation, roughness model, simulation algorithm, and simulation system. These segments provide input information for the input module, modeling module, simulation module, and validation module, respectively, of a digital twin dedicated to administering surface roughness in a human-cyber-physical system.
The semantic annotation segment of the dataset boils down to a concept map. A human- and machine-readable concept map is developed for the dataset of surface roughness. The information of other segments (roughness model, simulation algorithm, and simulation system) can be integrated with the semantic annotation, which is done in this article.
The delay map of surface roughness profile heights plays a pivotal role in the dataset preparation.
It is confirmed that the proposed method can be used to prepare datasets of surface roughness of milling, turning, grinding, electrical discharge machining, and polishing. In the next phase of this study, the surface profile height datasets of other processes will be considered to prepare surface roughness BD comprehensively.
Instead of the surface roughness modeling method used in this study, other modeling methods such as Markov chain, DNA-based computing, non-stationary Gaussian process, and semantic modeling can be used. The roughness model, simulation algorithm, and simulation system segments are in accord with the modeling method. Even though the dataset segments are reconstructed according to the modeling method, the data structure remains the same. Thus, the dataset structure (semantic annotation, roughness model, simulation algorithm, and simulation system) serves as the metadata of the surface roughness.


