Abstract
Ageing has always directly impacted the healthcare systems and, more specifically, the eldercare costs, as initiatives related to eldercare need to be addressed beyond the regular healthcare costs. This study aims to examine the general issues of eldercare in the Singapore context, as the population of the country is ageing rapidly. The main objective of the study is to examine the eldercare initiatives of the government and their likely impact on the ageing population. The methodology adopted in this study is Cross-Industry Standard Process for Data Mining (CRISP-DM). Reviews related to the impact of an ageing population on healthcare systems in the context of eldercare initiatives were studied. Analysis methods include correlation and machine learning algorithms, such as Decision Tree, Logistic Regression and Receiver Operating Characteristics curve analysis. Suggestions have been provided for various healthcare and eldercare systems’ initiatives and needs that are required to transform to cope with the ageing population.
Keywords:
ageing; healthcare; eldercare; healthcare systems; healthcare facilities; machine learning 1. Introduction
Though the country’s economic progress has been a success story, recently, Singapore is dealing with a rapidly ageing population, like many other developed countries around the world. The problem of an ageing population has been caused due to increasing longevity among older people and, at the same time, a decline in the birth rate [1]. The healthcare systems need to evolve to support these ageing populations, and various initiatives, such as eldercare, residential care, long-term care, acute care, etc., need to be advocated [2]. There needs to be a proactive approach from the various stakeholders to the impact of an ageing population on Singapore Healthcare Systems to arrive at necessary policy implications. Similarly, [3] underlined that Singapore is facing a significant challenge from the ageing population. There needs to be a variety of healthcare initiatives with policy changes across various domains with changing and challenging eldercare health needs and requirements. There is a crucial and urgent requirement to study the eldercare initiatives taken by the Singapore government in the context of an ageing population.
1.1. Population Growth and Structure in Singapore
It should be noted that Singapore is a small island country where the population in 1950 was 1,022,100, which kept growing to 1,646,400 in 1960 and 2,074,507 in 1970. In the past few decades, Singapore witnessed better economic growth; consequently, there was a significant rise in the population too. During 1980, 1990, 2000 and 2010, the population growth was, respectively, 2,413,945, 3,047,132, 4,027,887 and 5,076,732. From 1990, it can also be seen that the population figures have included the Permanent Resident Population and the Non-resident Population apart from the Singapore Citizen Population. The growing economy has made the government bring in more immigrant populations to ensure that the growth is not affected due to the limited number of Singaporeans.
It is clear from Table 1 that there has been a steady but marginal increase in the population from 2010 onwards. However, the rate of total population growth was 2.5% in 2012 and has subsequently declined since 2013. In 2017, it was 0.1%, and 2018 was 0.5%. The decreasing trend of the population growth rate was arrested with an increase in the rate to 1.2% in 2019. The resident population, including the Singapore Citizen Population, has been steady with a marginal increase over the last few years since 2012, though the Permanent Resident Population declined from 533,065 in 2012 to 525,269 in 2019. The non-resident population growth has also been steady, except for the decreasing trend in 2017 and 2018. It is also noted that the natural increase and the rate of natural increase have been showing a decreasing trend. Table 1 also shows that the Sex Ratio (Males per Thousand Females) had been decreasing from 974 in 2010 to 957 in 2019. The median age of the resident population has also shown an increasing trend as 2010 was 37.4 years, which grew steadily over the years, and in 2019 was 41.1. In a similar context, it can also be seen that the citizen population’s median age demonstrated an increasing trend from 2010 when the median age was 38.6 to 2019 when the median age was 42. This clearly shows that the population is ageing in Singapore, and there has been limited growth in the population of Singapore that would help in the changing demographic trend, which would be the ageing of the Singapore population. Similarly, the life expectancy rate went from 80.6 at birth to 82.6 at the age of 65. Additionally, the total fertility rate has remained below the replacement level at 1.2 births per female [4].

Table 1.
Population figures of Singapore: 2010 to 2019.
It is seen that when there is a decline in the fertility rate, there is an increase in the life expectancies. The country would experience some healthcare-related expenditure issues, and there is a possibility of affordability issues creeping up, as highlighted by [5]. A similar study conducted earlier by [6] indicated the necessity of greater access to healthcare and resources required for the ageing population in terms of healthcare cost. Another study conducted by [1] on The National Policy on Elderly People in Singapore examined that the expansion of longevity among the elderly and the decline in fertility contribute to an ageing population in Singapore, and Singapore’s elderly people are suffering from a high level of involuntary dependency which needs to be reviewed. It also stated that a consultative approach would help Singapore achieve higher standards of care for the increasingly wealthy elderly.
Problem Statement
Ageing has always directly impacted the healthcare systems and, more specifically, the eldercare costs, as initiatives related to eldercare need to be explicitly addressed beyond the regular healthcare costs. Such costs related to healthcare for the elder and its costs are significant. It is noted that Singapore had been spending about 11% each year from 2012 to 2017, and the expenditure related to healthcare has increased from $13 billion to $22 billion. Further, the operating healthcare costs also rise, and the workforce costs account for 60% of the costs. The need for eldercare and its associated costs is quite crucial, as it is noted that people aged above 65 years, on average, stayed 6.9 days in the public holidays, whereas the younger patients stayed for 3.9 days [7]. A study by [8] has also cautioned that there are several issues that the Singapore healthcare systems need to address for chronic and communicable diseases and ageing population issues. Even though Singapore’s healthcare systems have done well over the past 50 years and have been seen as one of the superior healthcare systems compared to the developed western countries, the research issue on eldercare initiatives and healthcare costs associated with eldercare needs to be studied for effective policymaking.
2. Review of Literature
It is important in a research study to review the current and available literature to understand the eldercare initiatives and the issues associated with them more clearly. An in-depth review of literature related to previously conducted research helped identify the research gaps, which the present study has focused on. Reviews related to the study are presented in the following section.
2.1. Healthcare and Eldercare Initiatives
Previous studies highlight that the policy initiatives related to healthcare, and particularly eldercare, need to be addressed in an ageing society. The authors of [9] highlighted that, usually, the healthcare of older people is generally under tremendous pressure due to rising healthcare costs; as such, the prevalent healthcare systems in terms of insurance are highly unfair. There is also evidence that the resources provided for eldercare are also insufficient as there are only a few hospitals and nursing homes for aged patients, leading to ineffective addressing of older people’s needs, which may go beyond non-communicable diseases and include disability and chronic illness for the elderly. Though the study is specific to China, the arguments stand relevant to many other countries and societies.
The author in the Ref. [10] agrees that the insurance related to eldercare needs to be addressed, as most societies’ support for eldercare is inadequate. Additionally, the study highlights how the Japanese government was able to initiate mandatory public long-term care insurance, which helped the older people to meet their healthcare needs, as the benefits provided do not differentiate people based on their income or financial situation. It is also extraordinarily liberal on both coverage and benefits, though there are challenges on home-based care, fiscal sustainability and relevant support for the family careers of older people. The study suggests that the rest of the world should use Japan’s expertise and strategies, as it argues that Japan’s eldercare policy is one of the most comprehensive long-term care systems for the world’s most ageing populations. A similar study conducted on the Nordic countries by [11] revealed that the healthcare reforms related to eldercare need to address the more significant healthcare needs. Most societies rarely evaluate the impact of equity in access to greater healthcare needs of older people.
Another study by [12] examined various provisions on the elderly care services with respect to Australia, which included a residential care model fully providing the geriatric health services. However, the problems in such eldercare are usually the coordination between various government bodies, including healthcare communities, and the services are typically fragmented. A study with reference to Taiwan conducted by [13] argues that elderly care services definitely assist in successful ageing, while [14] highlighted that the encouraging participation of older people in society needs to be part of the eldercare facilities.
2.2. Eldercare in Singapore
The authors of the Ref. [15] highlighted that by 2030, 19% of the Singapore population will be above 65 years, and there is an urgent need for a paradigm shift in regulating the eldercare sector in Singapore to cater to the changing demographics of the population. The study argued that the shift needs to be in the form of holistic, humanistic and multidimensional care for older people. The author of the Ref. [16] highlighted that the diseases in Singapore, which are chronic and non-communicable, such as coronary heart disease, stroke and cancer, would account for 60% of the death due to the rapidly ageing population and would present challenges to the healthcare delivery and financing systems in Singapore by 2020 and 2030.
Another study on the ageing population with respect to the future living arrangements of Singaporeans with age-related dementia by [17] agreed that the eldercare options for Singaporeans would need to ensure that it needs to accommodate the impact of the demographic shift on its healthcare and eldercare initiatives. Addressing the concerns proactively, the Ministry of Health in Singapore provides both intermediate services and long-term services in the form of residential healthcare services and community healthcare services. Residential healthcare services are provided in the community hospitals, chronic sick hospitals, nursing homes, inpatient hospice care and respite care. Community-based healthcare services are provided in both home hospice care services and also in the home medical and home nursing, which are home-based. Centre-based healthcare services provided within a centre include day rehabilitation centres, dementia daycare centres, psychiatric daycare centres and rehabilitation homes [18]. Further, the study by [19] has also indicated that the government is working to increase the number of nursing home beds to 14,000 by 2020, a 50% increase from 2010. A similar study by [20] reported that older adults with multiple chronic diseases are likely to demand more beds as the population grows older, and there is also a requirement for support with the ease of commuting and the proximity of service centres homes [21]. These studies indicate that there is a need to study the facilities for beds.
Evaluating various policies of the Ministry of Health, [22] studied the eldercare in Singapore with reference to how the country is using smart technologies to ensure that eldercare services are provided cost-effectively. The study concluded a need for a more collaborative and contextually sensitive approach to devise and develop smart eldercare solutions. In a similar context, another study conducted by [23] hoped that the government of Singapore, the various policymakers and the resource planners would review the health needs of the Singapore population proactively. The study identified that the likely demand for healthcare professionals and the various eldercare facilities are prevalent. The study has used the modelling approach and proposed eldercare requirements to address the strategic workforce planning in the healthcare sector. It provides projections required for the eldercare services among ophthalmic nurses, technicians and patient service assistants in Singapore.
As most of the households in Singapore need to work, older people depend on nursing homes to provide adequate custodial care, and the seniors are engaged in these homes. It increases the demand for nursing homes and is not only limited to nurses but also to other health professionals, including doctors [24]. The authors of the Ref. [25] indicated that due to unplanned hospitalization of older patients, there is a demand factor that needs to be addressed in the form of medical services, such as home medical care, doctor visits and hospitalization.
The study of [26] has a different view; it is indicated that eldercare policies should go beyond the healthcare needs of older people. Older people need to be encouraged for employment after retirement on either a full-time or part-time basis. They also integrate health and social services along with a reduction in the cost related to healthcare that has also been highlighted by [27] in their study on the Singapore eldercare facility in the context of over accommodation. A similar view was also reflected by [28], focusing on the interdependencies that would flow between the migration of care specialists in the area of costs and the possible issues of social change.
2.3. Research Gap
The review of the present literature indicates a fair amount of literature is related to the ageing of the population and its healthcare-related issues that the stakeholders need to address. However, there have been limited studies and differing perspectives on the healthcare needs of the elderly population. There have not been adequate studies from Singapore’s perspective, especially with the enormous scale of societal and demographic change that the country is undergoing. Further, the models adopted by Singapore have often been seen as the most tested and comprehensive initiatives, which most countries across the world replicate. Thus, a detailed and thorough study using big data tools is the need of the present situation.
2.4. Research Framework
The Cross-Industry Standard Process for Data Mining [29] has been used for the process of data mining exercise, which consists of the phases: business understanding, data understanding, data preparation, modelling, evaluation and deployment, and it is the framework of this study. From the current research problem perspective, which is the first step of the CRISP-DM (see Figure 1), the study has covered all the relevant improvements and steps in the healthcare systems in the context of the ageing population and also evaluated the initiatives related to eldercare, thereby ensuring that the objectives of the study have been appropriately addressed. In the second stage of CRISP-DM, the study has listed and collected the data sets required for the study. Data collection is not only limited to data loading but also understanding the data from multiple sources. Therefore, a holistic view of the research problems related to the study has been addressed, as it helps to see things in an integrated way rather than a disconnected and disjointed interpretation. Further, this leads to the third stage of CRISP-DM, where decisions related to data mining goals, availability of data, the volume of data, data types and the data attributes have been looked at, along with the quality of data and the constraints of obtaining such data. As the research choice used in the study is multi, in the fourth stage, the CRISP-DM looks at selecting the specific modelling technique for each task. The fifth stage of CRISP-DM applies the appropriate models, tools and applications. Moreover, it ensures that the research objectives are met in spite of the constraints on time and cost. It is noted that in the evaluation stage, the assessment of the results determined through data analysis is studied, whereas, in the development stage, various predictive analytics have been conducted to help achieve the objectives of the study.
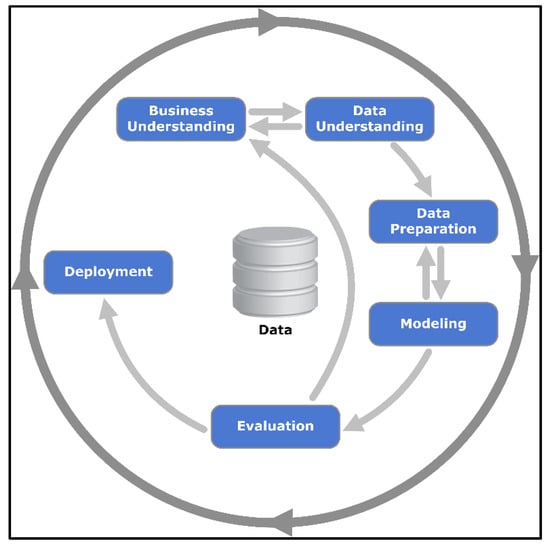
Figure 1.
CRISP-DM Process Diagram. Source: CRISP-DM, 2020.
Other models used in this study are regression, decision tree and random forest. Data mining has been used in this study as the gathered data has been analysed and produced, which helped process the data to sustain data analytics and predictive modelling [30].
2.5. Modelling
Common types of modelling in the data sciences for decision making are the analytics that relies on the nature of data, which is descriptive, predictive and prescriptive. The current research has used the data and worked on all three modelling techniques to examine and analyse the healthcare requirements of the ageing population. It is considered predictive rather than descriptive. This study has used machine learning algorithms, including Decision Tree, Logistic Regression and ROC (Receiver Operating Characteristics) curve.
The Decision Tree is a tree-structured classifier and is one of the supervised machine learning algorithms used for both classification problems and regression problems. The decision tree has an internal node that represents the dataset features, and the branches represent the decision rules. The outcome is represented with the leaf node. The decision tree algorithm is simpler as it is more like a human’s way of decision-making with less of a requirement of data cleaning than other machine algorithms. However, the process would be complex when the number of layers increases, leading to computational complexities. As such, the present study also uses other machine algorithms beyond the decision tree, which is Logistic Regression and Receiver Operating Characteristics (ROCC) curve analysis. Logistic Regression is a popular statistical model, which is a commonly and widely used classification algorithm in machine learning. Logistic regression uses binary classification, which translates the inputs to 0 or 1. 0 denotes negative class, and 1 denotes positive class. The input values (x) are usually referred to as Beta, which linearly combines using weights or coefficient values. The output values that are predicted as usually “y”. The equation for the Logistic Regression is as follows:
where y is the predicted output, b0 is the bias or intercept term and b1 is the coefficient for the single input value (x). Each column in the input data has an associated b coefficient (a constant real value) that must be learned from the training data.
Further, this research also used another machine learning algorithm, which is Receiver Operating Characteristics (ROC) curve analysis. ROC cure analysis uses a graphical plot to show the diagnostic ability of binary classifiers. The construction of the ROC curve is conducted by plotting the true-positive rate against the false-positive rate. It is a plot of the true-positive rate versus the false-positive rate at different classification cut-offs. [31]. As such, ROC curves are used when there are roughly equal numbers of instances for each class, in other words, when the data are balanced [32]. The present research uses Decision Tree, Logistic Regression and ROC (Receiver Operating Characteristics) curve to obtain a higher accuracy level in the results. Model building was used with the estimating model parameters. In this study, the training models in the machine learning algorithms, as well as data splitting and determining the parameters’ values, arrive at better results in the predictions. The process undertaken was to initially define the research problem with the objective to reach clarity and propose a solution, which was followed by constructing the data set, transforming the data, training a model, and then using the model to make the predictions.
3. Research Methodology
3.1. Research Questions
The ageing population issues are related to the careful policymaking on the various eldercare initiatives in the context of healthcare; the present study addresses the research questions provided below:
- How do the government’s eldercare initiatives likely impact the ageing population?
- What are the various healthcare systems initiatives and needs required to transform to cope with the ageing population?
3.2. Aims and Objectives
The study aims to examine the prevailing issues around eldercare in the Singapore context, as the ageing of the population is clearly seen. In this context and to address the research questions, the following objectives are presented in this study:
- To examine the eldercare initiatives of the government and their likely impact on the ageing population.
- To suggest various healthcare system initiatives and needs required to transform to cope with the ageing population.
Research methodology is an approach to systematically and methodically analytically solve the research problem. The present study’s research philosophy is Epistemology focusing on realism, where a quantitative method has been used to analyse the data and establish a relation to a scientific enquiry. A deductive approach has been used to arrive at the research questions, and the model has been used in the study after a literature review. The study is also inductive as it has developed a model, after gathering and then analysing the data to arrive at the predictive models using various data analysis and machine learning tools, which may be used in the healthcare and eldercare sectors in Singapore. The model may be looked at as a comprehensive theory if other countries see how healthcare and eldercare services are undertaken in Singapore. The research design used in this study is descriptive, as the study is based on existing secondary data, which are collected from various government sources. The justification for using secondary data can be underlined by the time and cost constraints, apart from the nature of the research area.
4. Results and Findings
4.1. Singapore Residents by Age Group
It is important for this study that the age group of the resident population needs to be studied, as the research focuses on the ageing population’s healthcare requirements. The ageing population is determined based on the number of residents in Singapore within the age segment that is growing older.
From Table 2 and Figure 2, it can be clearly understood that the age group of Singapore residents drastically changed from 2010 to 2019. In 2010, the differences between age groups had been more or less equally distributed among the groups. However, the subsequent years have witnessed a decline in the young population (see 0–4 years) and an increase in the middle-age population (see, 35–39 years, 40–44 years, 45–49 years, 50–54 years and 55–59 years). These age groups of Singapore residents contribute to more than 300,000 in each group, with the middle-age group of 45–49 years topping with 311,682.
Table 2.
Singapore Residents by Age Group: 2010 to 2019.
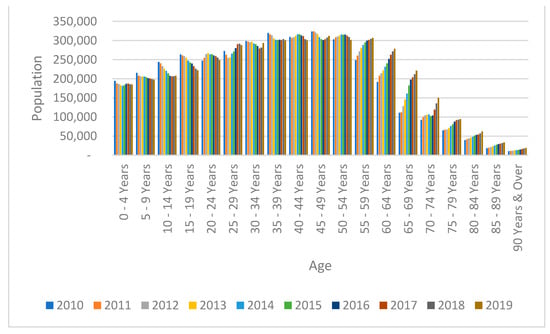
Figure 2.
Singapore Residents by Age Group: 2010 to 2019. Source: Developed for the study.
4.2. Projection of Singapore Residents by Age Group
The analysis on the Singapore residents by age group from 2010 to 2019 indicates that the population is ageing, and it is important to see how the resident population will change over the next few years, which will help the policymakers frame the necessary action plan if required. Based on the data from 2010 to 2019, the population ages have been forecasted for 2020 to 2030. The base year set for comparison for the projection is 2019. To detect the seasonal pattern, FORECAST.ETS function in Excel 2016 is used. FORECAST.ETS function predicts a future value using Exponential triple Smoothing.
The projections as per Table 3 and Figure 3 indicate that the population is ageing. In 2019, most of the population was between the age of 45–49 but was closely followed by the 50–54 and 55–59 age groups. It is also noted that the 35–39 years age group is not far behind. These age groups of people move towards the following age group segments, making the population grey. The replacement population in the younger age groups is also not healthy enough to lower the ageing population percentage. The analysis reveals that the 60–64 age group will be a clear majority of the population in 2030 and is very closely followed by the 55–59 and 65–69 age groups, making this research more relevant. The current situation’s needs enforce that adequate policy measures need to be implemented to cater to the ageing population’s requirements.
Table 3.
Projection of Singapore Residents by Age Group: 2020 to 2030.
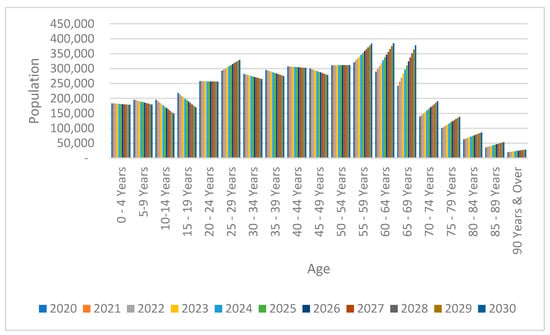
Figure 3.
Projection of Singapore Residents by Age Group: 2020 to 2030. Source: Developed for the study.
4.3. Comparison of Age Groups (65 Years and over versus Less Than 64 Years)
As it is clear from the Singapore residents’ age-wise analysis and from the projection till 2030 that the population is ageing, it is important to compare the population figures of the Singapore residents between 65 years and over versus less than 64 years. Figure 4 provides the comparison details of the above age groups, and Table 4 and Table 5 provide the projection till 2030 calculated with 2019 as the base year.
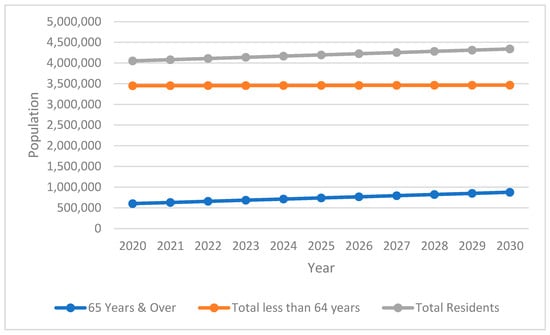
Figure 4.
Comparison of Age Group (65 Years and Over versus less than 64 years). Source: Developed for the study.
Table 4.
Comparison of Age Group (65 Years and Over versus less than 64 years).
Table 5.
Projection of Age Group (65 Years and Over versus less than 64 years).
Table 4 reveals that in 2019, the percentage of residents of the age group 65 years and over was 14.45%. The projection of the age group in Table 5 shows a gradual increase from 2020 to 2030. From the base year of 2019 (14.45%), the increase is seen as 15.54% in 2021, 16.78% in 2023, 18.02 in 2025, 19.25 in 2027 and 20.49% in 2029. Additionally, Figure 4 shows the comparison of age groups. It is also alarming to see the percentage moves drastically from 20.49% in 2029 to 21.11% in 2030.
4.4. Eldercare Facilities
When examining the eldercare initiatives, it is essential to look at the support that the old-aged people receive because older people are less economically active. As such, the working and economically active population would need to support the older aged people and economically inactive population. Further, the initiatives can be seen in the stakeholders spending on eldercare facilities; for instance, the data related to the beds for inpatient facilities would help.
4.5. Analysis of Old-Age Support Ratio
The examination of the old-age support ratio: residents aged 15–64 years per resident aged 65 years and over (per resident aged 65 years and over) is conducted in the study to understand the eldercare requirements and the initiatives that the policymakers need to consider, as support is key. The data are also presented with old-age support ratio: residents aged 20–64 years per resident aged 65 years and over (per resident aged 65 years and over), as the majority of the Singapore resident population becomes very much economically active from 20 years old onwards and thereby contribute to the national income and support for the residents 65 years and over, which is relevant and significant. The Ministry of Manpower in Singapore allows young persons aged 15–16 to work but with some restrictions with reference to the work in a non-industrial setting, and employers need to notify MOM along with the medical report submission requirements in case the work is in an industrial setting [33]. Hence, the data related to aged 15 and 20 are studied separately to see whether it makes any significant difference.
The projections in Table 6 reveal that the ratio continues to reduce, and as such, policymakers need to address the support for the old aged resident population with eldercare needs. Table 7 and Figure 5 show that there has been a decrease in population support per resident aged 65 years and over from 7.4 (Aged 20–64) and 8.2 (Aged 15–64) in 2010 to 4.5 and 4.9, respectively. This shows an urgent requirement for eldercare initiative measures to be looked at, as the support group for the elderly population is shrinking.
Table 6.
Old-age support ratio: residents aged 15–64 and 20–64 years per resident aged 65 years and over (per resident aged 65 years and over).
Table 7.
Old-age support ratio: residents aged 15–64 and 20–64 years per resident aged 65 years and over (per resident aged 65 years and over).
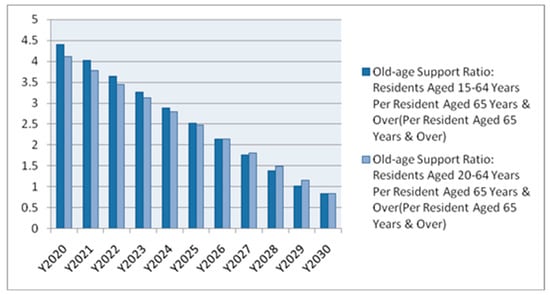
Figure 5.
Projection of the old-age support ratio: residents aged 15–64 and 20–64 years per resident aged 65 years and over (per resident aged 65 years and over) till 2030. Source: Developed for the study.
4.6. Eldercare Facilities with Reference to the Resident Population from the Age of 65 Onwards
When examining the eldercare facilities in Singapore, the data related to the ‘Beds in Inpatient Facilities’ in the various types of hospitals in Singapore for the resident population aged 65 and over have been studied. The various types of eldercare facilities that have been examined are Acute Hospitals, Psychiatric Hospitals, Community Hospitals, Nursing Homes and Inpatient Hospices. The correlation of the resident population from the age of 65 onwards and the various eldercare facilities is provided in Figure 6. It highlights that the resident population aged 65 years and over has a positive correlation with the eldercare facilities in the context of ‘Beds in Inpatient Facilities’ in the Acute Hospitals, Community Hospitals, Nursing Homes and Inpatient Hospices, except for Psychiatric Hospitals. There is a negative correlation between psychiatric hospitals and eldercare facilities for residents aged 65 years (−0.910004).
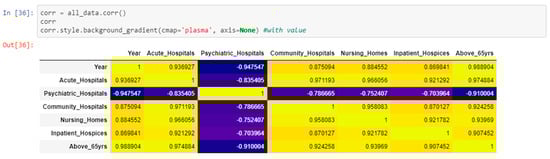
Figure 6.
Correlation between eldercare facilities and the resident population aged 65 onwards. Source: Developed for the study.
The Heat Map in Figure 7 also shows positive correlations between the eldercare facilities in the context of ‘Beds in Inpatient Facilities’ in the Acute Hospitals, Community Hospitals, Nursing Homes and Inpatient Hospices, except for Psychiatric Hospitals with the resident population aged from 65 years. The cells in the GREEN colour indicate a positive correlation, while the PINK-coloured cells flag a negative correlation. The maximum negativity correlation is seen with reference to the Psychiatric Hospitals.
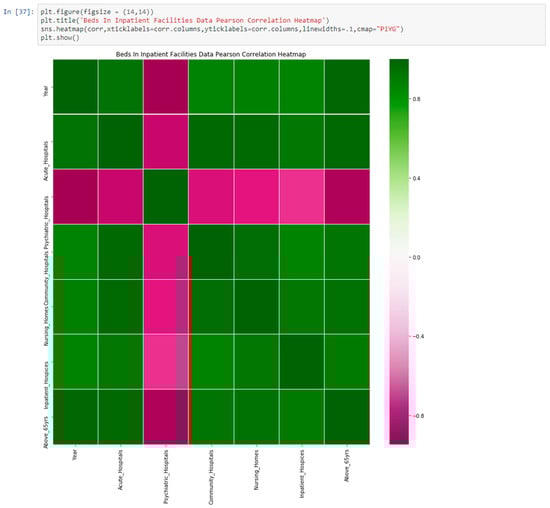
Figure 7.
Heat Map showing the correlation between eldercare facilities and the resident population aged 65 onwards. Source: Developed for the study.
4.7. ROC Curve Analysis Using Decision Tree and Logistic Regression Method for Eldercare Facilities Focusing Beds in Inpatient Facilities
ROC stands for Receiver Operating Characteristics curve and has also been used to analyse the dataset related to eldercare in the area of ‘Beds in Inpatient Facilities’. The ROC curves are usually presented in the graph mode, and the area under the ROC curve indicates the value of using the analysis concerned.
Further, the Decision Tree and Logistic Regression method algorithms for analysis were tested using the ‘Beds in Inpatient Facilities’ data set. The output is provided in Figure 8.
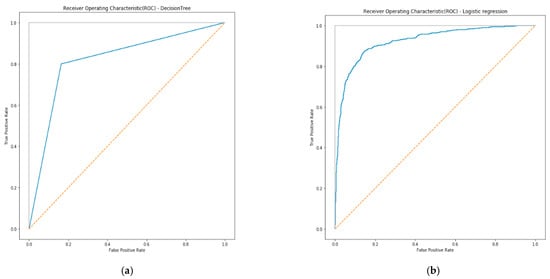
Figure 8.
ROC curve analysis using (a) Decision Tree and (b) Logistic Regression method for eldercare facilities focusing on ‘Beds in Inpatient Facilities’. Source: Developed for the study.
The Decision Tree and Logistic Regression outputs are as follows:
roc_auc_score for Decision Tree: 0.817866718210672
roc_auc_score for Logistic Regression: 0.9229188841149525
Logistic Regression is superior to the Decision Tree method because the true positive rate is higher at all cut-offs, and the false positive rate is lower than for the Decision Tree method. The area under the curve for Logistic Regression is larger than the area under the curve for the Decision Tree method. Based on the result, the Logistic Regression method attained a good result compared to the Decision Tree ROC curve. Therefore, this indicates that beds in inpatient facilities need to be increased as the population will grow older, and they will be necessary to cater to the eldercare requirements of the ageing population.
5. Conclusions
The research clearly shows that there has been limited growth in the Singapore population that could help change the demographic trend, which is the ageing population of Singapore. The analysis with the base year as 2019 shows that the percentage of residents aged 65 years and over is 14.45%. The projection of the age group revealed that there is a gradual increase from 2020 to 2030, which policyholders need to deeply look at and react to. It can be seen that the eldercare facilities in the form of ‘Beds in Inpatient Facilities’ in Acute Hospitals, Community Hospitals, Nursing Homes and Inpatient Hospices have a positive correlation with the resident population aged 65 years onwards. This indicates that there needs to be continuous investment in such facilities as the population is ageing. Further, it can also be seen that there exists a negative correlation between eldercare facilities in the form of ‘Beds in Inpatient Facilities’ in Psychiatric Hospitals and the resident population aged 65 years and over. This may be because the awareness among the ageing population for such services and the investments in such facilities are not as high as the other healthcare facilities. The study also examined eldercare initiatives, and it is important to look at the support that old-aged people receive because as people become older, they become less economically active. The analysis on the old-age support ratio was performed, and further, the beds for inpatient facilities were also studied when examining eldercare initiatives. The results align with the “Silver Tsunami” projections presented by [34], which highlighted that, by 2030, nearly one in five (20%) adults would be aged 65 and older, and the percentage of US workers caring for an elderly person is expected to triple. Further, another study by [35] also supports the present study results, as it argues that caring for ageing parents while trying to manage demands from work and other life roles successfully will be crucial in the future, as the old-age support ratio will be challenging. The results also align with the ageing population issues in another South-East nation, Indonesia, which has increased from 4.5% in 1971 to 9.6% in 2019 and is thought to be a trigger for widespread community care for the elderly [36].
The methodology adopted in this study is CRISP_DM, where the data mining exercise is conducted in phases, namely business understanding, data understanding, data preparation, modelling, evaluation and deployment. The data plans required are data collection, data monitoring, data cleaning and filtering, data modelling, and deployment, leading to superior insights on the data, where data optimisation and data harmonisation are evident. Technology innovation using such big data is a continuous process that assists eldercare initiatives within Singapore and Community-Based Healthcare. The entire big data architecture would come together, with the Ministry of Health playing the regulatory role. Thereby, the model contributes to the accuracy of the results and, in turn, aids the decision making and assists the policymakers. Further, the study by Ageing International on eldercare in Asia [37] suggests that at least in Asian countries, ownership for support of working elder-caregivers is not yet determined. It is argued that government organizations, families, religious communities, social organizations, healthcare organizations and workplaces may bear some burdens in supporting employed caregivers. Similar to the present study, these researchers call for a more collaborative and integrative societal approach to supporting family-based informal eldercare in Asia and abroad.
5.1. Recommendations
Based on the results, findings and conclusions of this examination of the government’s eldercare initiatives, it likely impacts the ageing population, and we indicate the following recommendations. Firstly, increased spending is needed on the eldercare facilities in the ‘Beds in Inpatient Facilities’ in Acute Hospitals, Community Hospitals, Nursing Homes and Inpatient Hospices to meet the requirements of the resident population aged 65 years onwards. Secondly, with Logistic Regression showing good results compared to the Decision Tree ROC curve, there needs to be additional funding and resource allocations towards the Beds in Inpatient Facilities. This is crucial as such infrastructure needs to grow to cater to the eldercare requirements of the ageing population because the population will continue to grow older. Thirdly, the policymakers are also required to look at options for further investment in eldercare facilities for Psychiatric Hospitals, which need to be increased, as the current psychiatric facilities do not correlate with the requirements of the resident population aged 65 years onwards. Additionally, the awareness for such services related to the psychiatric requirements for the resident population aged 65 years onwards needs to be promoted. Targeted campaigns on the ageing population’s awareness and preparedness and the eldercare needs and facilities need to be widely undertaken. Lastly and most importantly, the Per-capita government health expenditure needs to be aligned, and the government needs to continuously spend to meet the healthcare requirements of the ageing population.
5.2. Limitations of the Study
The study used the data collected originally for different purposes and not exactly to understand the issues related to eldercare initiatives. As such, the relevance and reliability of the data in the context of the present study are debatable. Though consistency, relevancy and reliability of the data used cannot be assured due to its secondary nature, data sources have been verified for authenticity with data from only the relevant regulatory authorities used in this study. Despite the above limitation, there has been no compromise on the data mining models used in this study, and the research objectives of the study are appropriately addressed. Though stronger in the present study, data models would be even better if comprehensive big data architecture had been used to gain even more insights into the data.
5.3. Scope of Future Research
The study has examined the eldercare initiatives of the government, along with their likely impact on the ageing population; however, the study used 65 years old as a base year to evaluate the elderly initiative data. With the increase in life expectancy, future studies can examine the elderly initiatives and requirements for different categories, such as 75 years old and beyond, 90 years old and beyond, etc. Additionally, with communicable diseases, such as COVID-19, disrupting the healthcare costs and taking away much-needed attention from eldercare, studies related to such impacts can also be conducted. In addition, studies related to chronic illnesses that are likely to impact elderly individuals and the effects on the healthcare systems can also be studied.
Author Contributions
Conceptualization, E.R., G.P. and N.N.; methodology, E.R. and G.P.; software, E.R., G.P. and N.N.; validation, G.P., E.R. and N.N.; formal analysis, G.P.; investigation, G.P. and E.R., data curation, G.P.; writing—original draft preparation, E.R. and G.P.; writing—review and editing, E.R., G.P. and N.N.; visualization, E.R. and N.N.; supervision, E.R. and N.N. All authors have read and agreed to the published version of the manuscript.
Funding
This research received no external funding.
Institutional Review Board Statement
Not applicable.
Informed Consent Statement
No primary data were collected as part of this study.
Data Availability Statement
Not applicable.
Conflicts of Interest
The authors declare no conflict of interest.
References
- Teo, P.; Chan, A.; Straughan, P. Providing health care for older persons in Singapore. Health Policy (N. Y.) 2003, 64, 399–413. [Google Scholar] [CrossRef]
- de Meijer, C.; Wouterse, B.; Polder, J.; Koopmanschap, M. The effect of population aging on health expenditure growth: A critical review. Eur. J. Ageing 2013, 10, 353–361. [Google Scholar] [CrossRef] [PubMed] [Green Version]
- Rogerson, A.; Stacey, S. Successful ageing in Singapore. Geriatrics 2018, 3, 81. [Google Scholar] [CrossRef] [PubMed] [Green Version]
- Wong, W.K. Population Trends 2017; Singapore Department of Statistics: Singapore, 2017; ISBN 1793-2424. [Google Scholar]
- Pruchno, R. International aging: Spotlighting the spotlights. Gerontologist 2017, 57, 392–395. [Google Scholar] [CrossRef]
- Galobardes, B.; Shaw, M.; Lawlor, D.A.; Lynch, J.W.; Smith, G.D. Indicators of socioeconomic position (part 1). J. Epidemiol. Community Health 2006, 60, 7–12. [Google Scholar] [CrossRef] [PubMed] [Green Version]
- Lai, L. Koh Poh Koon Details Key Drivers of Rising Healthcare Costs Here. Available online: https://www.straitstimes.com/singapore/koh-poh-koon-details-key-drivers-of-rising-healthcare-costs-here (accessed on 10 December 2020).
- Satkunanantham, K.; Lee, C.E. Singapore’s Health Care System: What 50 Years Have Achieved; World Scientific: Singapore, 2015; ISBN 9814696072. [Google Scholar]
- Wang, X.Q.; Chen, P.J. The Lancet; Elsevier Ltd.: Amsterdam, The Netherlands, 2014; p. 870. [Google Scholar]
- Tamiya, N.; Noguchi, H.; Nishi, A.; Reich, M.R.; Ikegami, N.; Hashimoto, H.; Shibuya, K.; Kawachi, I.; Campbell, J.C. Population ageing and wellbeing: Lessons from Japan’s long-term care insurance policy. Lancet 2011, 378, 1183–1192. [Google Scholar] [CrossRef]
- Keskimäki, I. Market oriented health care reforms and equity in access in health care in the Nordic countries–impact on the ageing populationIlmo Keskimäki. Eur. J. Public Health 2017, 27, ckx187.612. [Google Scholar] [CrossRef]
- Cameron, I.D. Aged care issues and services in Australia. Ann. Acad. Med. Singap. 2003, 32, 723–727. [Google Scholar] [PubMed]
- Lin, L.H. Successful aging among Taiwan’s elderly learners. J. Popul. Stud. 2006, 33, 133–170. [Google Scholar]
- World Health Organization. Active Aging: A Policy Framework; World Health Organization: Geneva, Switzerland, 2002. [Google Scholar]
- Wong, G.H.Z.; Pang, W.S.; Yap, P. A paradigm shift in regulating and running nursing homes in Singapore. J. Am. Med. Dir. Assoc. 2014, 15, 440–444. [Google Scholar] [CrossRef]
- Tan, C.C. National disease management plans for key chronic non-communicable diseases in Singapore. Ann. Acad. Med. Singap. 2002, 31, 415–418. [Google Scholar]
- Thompson, J.P.; Riley, C.M.; Eberlein, R.L.; Matchar, D.B. Future living arrangements of Singaporeans with age-related dementia. Int. Psychogeriatr. 2012, 24, 1592–1599. [Google Scholar] [CrossRef]
- Ministry of Health. 2019 Elderly Care. 2021. Available online: https://www.moh.gov.sg/hpp/all-healthcare- (accessed on 11 May 2021).
- Chin, D. Nursing Home Care Gets $120 m Boost. The Straits Times, 19 December 2010. [Google Scholar]
- McCann, M.; Donnelly, M.; O’Reilly, D. Gender differences in care home admission risk: Partner’s age explains the higher risk for women. Age Ageing 2012, 41, 416–419. [Google Scholar] [CrossRef] [Green Version]
- Bradley, E.H.; McGraw, S.A.; Curry, L.; Buckser, A.; King, K.L.; Kasl, S.V.; Andersen, R. Expanding the Andersen model: The role of psychosocial factors in long-term care use. Health Serv. Res. 2002, 37, 1221–1242. [Google Scholar] [CrossRef] [Green Version]
- Kong, L.; Woods, O. Smart eldercare in Singapore: Negotiating agency and apathy at the margins. J. Aging Stud. 2018, 47, 1–9. [Google Scholar] [CrossRef]
- Ansah, J.P.; Koh, V.; De Korne, D.; Jayabaskar, T.; Matchar, D.B.; Quek, D. Modeling manpower requirement for a changing population health needs: The case of ophthalmic nurses and allied health ophthalmic professionals. Health Policy Technol. 2019, 8, 282–295. [Google Scholar] [CrossRef]
- Liu, G.; Yap, P.; Wong, G.H.Z.; Wei, H.X.; Hua, E.C. Day Care Centers for Seniors in Singapore: Looking back and looking ahead. J. Am. Med. Dir. Assoc. 2015, 16, 630-e7. [Google Scholar] [CrossRef]
- Mittal, R.; Tan, C.S.; Tham, W.Y.; Seong, L.P.S.; Tan, T.L.; Koh, G.C.-H. Trend and predictors of unplanned hospitalization of older patients during the first year after admission into a home medical service. Home Health Care Serv. Q. 2017, 36, 145–163. [Google Scholar] [CrossRef] [PubMed]
- Lin, W.-I.; Chen, M.-L.; Cheng, J.-C. The promotion of active aging in Taiwan. Ageing Int. 2014, 39, 81–96. [Google Scholar] [CrossRef]
- Cavallaro, F.; Seilhamer, M.F.; Chee, Y.T.F.; Ng, B.C. Overaccommodation in a Singapore eldercare facility. J. Multiling Multicult. Dev. 2016, 37, 817–831. [Google Scholar] [CrossRef]
- Yeoh, B.S.A.; Huang, S. Singapore’s changing demography, the eldercare predicament and transnational ‘care’migration. TRaNS Trans-Reg. Natl. Stud. Southeast Asia 2014, 2, 247–269. [Google Scholar] [CrossRef]
- CRISP-DM. The CRoss Industry Standard Process for Data Mining (CRISP-DM), Data Science Project Management. Available online: https://www.datascience-pm.com/crisp-dm-2 (accessed on 16 September 2020).
- Russom, P. Big data analytics. TDWI Best Pract. Rep. Fourth Quart. 2011, 19, 1–34. [Google Scholar]
- Hasanin, T.; Khoshgoftaar, T.M.; Leevy, J.L.; Bauder, R.A. Investigating class rarity in big data. J. Big Data 2020, 7, 23. [Google Scholar] [CrossRef]
- Saito, T.; Rehmsmeier, M. The precision-recall plot is more informative than the ROC plot when evaluating binary classifiers on imbalanced datasets. PLoS ONE 2015, 10, e0118432. [Google Scholar] [CrossRef] [PubMed] [Green Version]
- Teo, P. The national policy on elderly people in Singapore. Ageing Soc. 1994, 14, 405–427. [Google Scholar] [CrossRef]
- Griggs, T.L.; Lance, C.E.; Thrasher, G.; Barnes-Farrell, J.; Baltes, B. Eldercare and the psychology of work behavior in the twenty-first century. J. Bus. Psychol. 2020, 35, 1–8. [Google Scholar] [CrossRef] [Green Version]
- Bott, N.T.; Sheckter, C.C.; Milstein, A.S. Dementia care, women’s health, and gender equity: The value of well-timed caregiver support. JAMA Neurol. 2017, 74, 757–758. [Google Scholar] [CrossRef]
- Sumini; Sukamdi; Pangaribowo, E.H.; Keban, Y.T.; Darwin, M. Elderly Care: A Study on Community Care Services in Sleman, DIY, Indonesia. J. Aging Res. 2020, 2020, 3983290. [Google Scholar] [CrossRef]
- Hinton, L.; Chen, H. Introduction to the Special Section: “Eldercare in Asia: A Call for Policy Development Beyond Traditional Family Care”. Ageing Int. 2016, 41, 331–334. [Google Scholar] [CrossRef] [Green Version]
Publisher’s Note: MDPI stays neutral with regard to jurisdictional claims in published maps and institutional affiliations. |
© 2021 by the authors. Licensee MDPI, Basel, Switzerland. This article is an open access article distributed under the terms and conditions of the Creative Commons Attribution (CC BY) license (https://creativecommons.org/licenses/by/4.0/).