Abstract
Rising demand for optimized digital marketing strategies has led firms in a hunt to harvest every possible aspect indicating users’ experience and preference. People visit, regularly through the day, numerous websites using both desktop and mobile devices. For businesses to acknowledge device’s usage rates is extremely important. Thus, this research is focused on analyzing each device’s usage and their effect on airline firms’ digital brand name. In the first phase of the research, we gathered web data from 10 airline firms during an observation period of 180 days. We then proceeded in developing an exploratory model using Fuzzy Cognitive Mapping, as well as a predictive and simulation model using Agent-Based Modeling. We inferred that various factors of airlines’ digital brand name are affected by both desktop and mobile usage, with mobile usage having a slightly bigger impact on most of them, with gradually rising values. Desktop device usage also appeared to be quite significant, especially in traffic coming from referral sources. The paper’s contribution has been to provide a handful of time-accurate insights for marketeers, regarding airlines’ digital marketing strategies.
Keywords:
desktop; mobile; usage; Big Data; web analytics; SEO; airlines; web traffic; digital marketing; digital brand name; regression; FCM; agent-based modelling 1. Introduction
Today more than ever, the percentage of visitors’ mobile application experience is higher than desktops. This can be explained by various factors, with rising usage of mobile devices being the most forcible. Present technological plethora, helpful for better customer targeting in emerging and existing markets, are a priceless tool for marketeers. Since the user’s needs can be satisfied by technology, value is created, with users continuing to exploit technology [1]. Devices are becoming more personalized than ever before, containing more details about an individual than any other piece of equipment. Businesses are aiming to predict users’ experience and behavioral patterns through their websites, translating it into successful website evaluation and, as a consequence, search results.
The current business technological ecosystem provides a monetization potential for companies, especially since the Big Data environment design offers a holistic implementation for organizations pursuing transformations and being completely data-driven [2]. In a highly connected world, a wide range of data channels such as social media, mobile devices, and even the Internet of Things (IoT) create a significant amount of data that changes fast. Among the most commonly used progress in the area of web usage mining is web analytics [3]. Key Performance Indicators (KPIs) in web analytics are essential metrics often used to assess websites and applications pages versus goals [3].
Enhanced search results can be related to optimize a firm’s digital brand name, which can then be related to profitability. In the Big Data era, Search Engine Optimization’s (SEO) role can be seen as one of the most crucial roles in optimizing firm’s search results and thus, digital brand name. Its purpose is to supply web developers and content creators with necessary tools for developing websites, that score higher rankings in search engine results, leading to remarkable rise in website’ organic traffic [4]. Website traffic can be increased, apart from desktop visits, by mobile (smartphones) device usage, when a firm has developed its unique app. It is practically mandatory for firms to develop a template designed for mobile devices, for the reason that visitors may convert at a lower rate on websites that are not optimized for mobile viewing [5].
Regarding desktop usage, visitors experience personal workspaces across the Internet, which gives them direct access to a cloud-based workspace at any place, whether the device is a desktop or a smartphone [6]. In recent years, opposed to the past, the majority of website designs are mobile-friendly with increased responsiveness, driving their usage at higher levels. Since 2011, the shipment of mobile devices has overrun those of desktop devices. The mobile-growing audience has increased mobile transactions, irrespective of time and space of usage [7]. The rise of mobile device usage has been highly related with the rapid increase of marketplace applications. Marketing through mobile devices appears to attract more customers than desktops, mostly due to incentives offering cashback offers, discounts, etc. [8].
In our research, we focused on the airline sector by trying to estimate the effect that device usage has over their digital brand name. More specifically, we aim to examine whether desktop and mobile usage can lead to higher levels of web traffic, providing information over the preferable visitors’ device. In order to represent an airline firm’s digital brand name, we examined web traffic sources as organic, direct, and referral, which can efficiently indicate the level of impact airline firms have on people visiting their websites. Extensively, apart from organic, direct, and referral airline website traffic, we deploy web metrics of total and unique visits, as well as pages per visit of desktop and mobile devices, so as to calculate the variable of device usage.
1.1. Big Data, Mobile and Desktop Usage Background
1.1.1. Big Data and Web Analytics Connection with Device Usage
As the terminology indicates, Big Data refers to massive amounts of data that are difficult to handle using traditional software or web-based solutions. As technology development encompasses many aspects of human, environmental, and socioeconomic variables, Big Data storage, mining, analysis, and associated research are required to fully grasp the dense tendencies in vast data [9]. Nearly every single research field, whether it is in commerce or university, obtains and assesses large amounts of data for a variety of purposes. Web analytics approaches and technologies have been shown to be highly efficient in analyzing how internet users utilize websites, as well as refining and enhancing websites and digital content. The above has been shown in a variety of domains and activities, such as e-commerce [10] and digital marketing [11].
As long as Internet users are concerned, device preference is quite a subjective matter and lies to users’ characteristics and choices such as convenience, etc. When it comes to firms’ perspective, knowledge over most preferred device with the highest usage levels can be proven critical in decision-making process. That drives firms to spend time and resources in understanding key differences between the devices. According to Maurer et al. [12], groups of people voted in favor of the desktop version of websites, thinking it was more informative, while both those who voted in favor of desktop or mobile thought their platform provided better clarity. The newest mobile variables such as apps with a task-specific nature, limited usability and bandwidth, location-awareness, high personal device nature, etc., were not as important to pertain people to desktop device usage [13].
Marketeers need to comprehend how some emerging aspects affect user acceptance, usage, and implications of mobile apps. Foregoing factors have a direct impact on the interpretation of mediated environments’ perceived user engagement. Factors of simplicity and clarity promote mobile usage over desktop usage, while higher speed rates are in favor of desktop usage [12]. Furthermore, people’s subjective customs appear as one of the key factors for continuance of using services through a particular device and not the device’s satisfaction degree [14]. According to Law et al. [15], when it comes to sales promotion tactics, visual merchandising can be proven effective in increasing transactions and combining it with an optimized website can convert more visitors to customers, especially over mobile devices where conversion rates are lower [5].
1.1.2. Determination of Usage in Mobile and Desktop Devices
In what way can we determine the usage of devices? It can be seen as a combination of users’ metrics that set its measurement over each device. Mobile and desktop devices appear to have some peculiarities. Social media access through mobile devices is significantly more frequent than through other devices, giving additional information about the preferred social media sites. One of the most obvious differences between mobile and desktop usage deals with User Experience (UX), which consists of components as content organization, form filling, etc., differentiating mobile usage from desktop usage. UX reflects on the mobile usage for navigating over search engines, thus increasing web traffic. The user’s perceived value has positive impact on satisfaction and loyalty over mobile usage [16], Kim et al. [17] stated that a higher perceived value fortifies mobile engagement, given that mobile device usage for shopping activities may lead to notable perceived value and experience of the user [18].
Users on mobile devices tend to return frequently to the website and desktop users stay on the website for a longer period of time. So, mobile users visit websites frequently and for short time periods [13]. In this respect, Racherla et al. [13], found that the average time spent on a website cannot influence a site’s conversion rates and other metrics such as frequent returns to the site (visits and unique visits) can be more important. Website visits differ from unique visits, due to cookies recognizing the same IP address reentering the website in a small period of time (e.g., a couple of days). So, through a selected period, unique visits count as the same visit (cookies remembering the IP address) and visits are general IP addresses website visit, in more than 2-days’ time.
Device perceived usefulness and by extension usage is positively affected by mobile devices’ ubiquitous character, making further positive impact on visitors’ perceived value [19]. Jang et al. [20], highlighted the importance of comprehending mobile utilization for the purpose of customer participation and usage increase. Ubiquity could pose an important role in the online retail industry, because of mobiles’ universal connectivity and customer targeting [21]. For usage to be calculated, statistics and metrics defining the growth of mobile users through the web are important, with the need of close relation with the time spent on site from mobiles [22]. More than half of the web traffic worldwide comes from mobiles, which is predicted to rise up to 80% [23]. In our research, we combined total visits, unique visits, and pages per visit to obtain the variable of usage in each device.
1.2. Related Background in Mobile and Desktop Usage and Firms’ Digital Brand Name
1.2.1. Connection of Firms’ Traffic Sources with Their Digital Brand Name
As regards airlines’ brand name, factors affecting it should be analyzed and taken into consideration over its estimation. In order to get a clear view of digital brand name variables, we use three web traffic sources of organic, referral, and direct traffic, which indicate the variations of a digital brand name. Organic traffic, in particular, is traffic that ends to a website through unpaid searches in search engines (e.g., Google, Bing, etc.), whose role in business’ success is vast. Search Engine Optimization (SEO) projects are based on organic traffic results for website ranking improvement, since it represents over 60% of a website’s total traffic [24]. Furthermore, organic traffic has many benefits for businesses, such as small number of investments, trust, credibility and inbound marketing, as well as providing long lasting results over Pay Per Click (PPC) campaigns [25].
Increased traffic from search engines, which means higher website ranking, can lead to higher conversion rates. So, the higher the organic traffic the higher the conversion rates [24]. An important objective for digital marketeers is to increase traffic and lower the bounce rate by using practical and appealing templates [8]. In this respect, if firms want to raise their sales, they need to create a reliable online presence for their customers to locate a firms’ services and products [24]. Apart from organic traffic, there is high connection between direct traffic and firms’ digital brand name visibility [25]. This means that an increasing amount of web users typing an URL to their browser (direct traffic), indicate a strong brand name [26]. Referral traffic also has multiple benefits over digital brand awareness and recognition, because visitors coming to a firm’s website, through trustful websites, increase the possibility of them becoming customers and the visibility of a firm’s online products [27]. The web metrics tracking proposed in this paper are presented in the table below (Table 1).

Table 1.
Description of the examined web metrics.
1.2.2. Impact of Mobile and Desktop Usage on Digital Brand Name’s Factors
Having defined a digital brand name’s factors connected with web traffic sources, we seek to examine its relationships with desktop and mobile usage. Mobile devices offer a dynamic medium to website visitors for online shopping, granting a satisfying experience which keeps shoppers’ using mobile apps [31]. In a related manner, McLean et al. [32] demonstrated that a meaningful and satisfying user experience will expand consumers’ mobile usage. Consumers tend to search on desktop devices more than mobile ones. Despite the fact that mobiles are used for a wide variety of services, current mobile adoption rates are lower than anticipated [33]. Mobile searches account for almost one-quarter of all searches.
In mobile devices, deal proneness increases mobile usage, revealing that consumers tend to switch to mobile devices in order to benefit from personalized promotion deals [34]. Mobile usage is also affected by loading times, as 53% of mobile users tend to abandon the websites they visit when loading time is above 3 minutes [35]. This highlights the importance of page loadings to user experience and mobile usage, sending a direct message to web developers. A recent study found that 50.48% of web traffic originates from mobile devices, while desktop traffic accounts for 46.51% of total web traffic [36]. According to Merchant Savvy [37], 58% of total online sales occur from mobile devices, where users prefer mobiles’ convenience and accessibility over desktops bigger screens.
As mentioned by Bouchrika [38], 58% of Google searches are done from mobile devices, which means that worldwide over half of all search queries originated from mobiles, proving their high usage preference. In comparison of desktops and mobile-optimized websites, mobile devices have higher engagement rates and around 100–300% higher conversion rates [39]. It clearly shows us that mobile apps are winning over mobile-optimized websites in user engagement and conversion, with these mobile metrics varying at regional levels, depending on factors such as mobile-only population and market maturity [40]. We can clearly see strong correlations between mobile and desktop usage with firms’ digital brand name and its different variables.
1.2.3. Key Performance Indicators of Mobile/Desktop Usage and Digital Brand Name
Nowadays, almost all people and transactions have gone online, which means that the usage of devices enabling browsing and transactions to happen has risen exponentially. Performing forethoughts concerning devices uses that lead to the completion of transactions opens up portals for a firms’ digital brand name advantages. Before defining the exact indicators for estimating a firms’ digital brand name performance and benefits, we should consider the definition of performance indicators. A key performance indicator (KPI) is a category of performance measurement [41], that assesses a firm’s progress in certain activities it is taking over.
Accounting for the deficiency of web metrics and the large number of digital marketing strategies, it becomes more difficult for KPIs to meet necessary requirements [42]. It lies on marketeers to optimize and align the propriate metrics to the correct KPIs [43]. Keeping in mind that, the more usage a device has, the more trust and user engagement it acquires [13], we define the exact metrics and KPIs we seek to estimate in our paper, in terms of usage and digital brand name factors. For the paper’s purposes, we seek to examine the KPIs of Table 2. KPIs utilization should be compared on a daily basis for an accurate depiction of firms’ efficiency.
Table 2.
Reference of paper’s suggested KPIs and Performance Measurement.
1.3. Research Hypotheses, Problem Formulation
Rising competition and technology enhancement applications tend to increase companies’ efforts for efficiency in digital marketing campaigns. Brand name improvement, strongly connected with firms’ digital marketing efficiency, can be displayed by the increased organic, direct and referral web traffic. Airline companies seek to comprehend the usage of their desktop and mobile devices, so as to organize and maximize their website efficiency and effectiveness. Since companies enabled access for visitors to their websites through desktop and mobile devices, they need to grasp the opportunity of knowing which mean of usage affects the important traffic sources more. Furthermore, by understanding how the mobile and desktop usage affects their digital brand name and which one has a higher effect on it, airline firms might be in a positive position to increase digital marketing benefits. The results of the data collected from the airline companies’ desktop and mobile device activity give valuable feedback, including:
- To strategists to easily comprehend the exact web metrics impacting their digital brand name and the various means of traffic sources attracted to their website.
- To marketeers to get a clear picture of the most user-preferred device (mobile-desktop) in favor of brand name optimization.
- To the organization itself, so as to benefit from user preferred device, especially for SEO development, based on the specific visitor usage metrics, such as pages per visit. In this way, the organization will be able to leverage desktop and mobile usage metrics, such as unique visitors, pages per visit, etc., in favor of their digital marketing optimization and improve website’s visibility and firm’s digital brand name.
Therefore, we settle six research hypotheses, aiming to extend the practical knowledge over the significance and impact of desktop usage versus mobile usage on a firm’s digital brand name.
The first purpose of this paper is to acknowledge whether desktop usage impacts airlines’ direct and referral traffic and to verify that amount (Hypothesis 1). By knowing whether potential visitors used the desktop device to visit an airlines’ website provides valuable information and potential benefits for those firms, meaning it important to look into.
Hypothesis 1 (H1).
Do Airline Direct and Referral Traffic get affected by Usage of Desktop Devices?
Having estimated desktop’s usage effect on referral and direct traffic, we then proceed to estimate mobile’s usage impact on airlines’ direct and referral traffic (Hypothesis 2). Again, the examination of the important of the impact caused by website’s referral and direct traffic by mobile usage can help airline firms make decisions about a mobile application and its requirement.
Hypothesis 2 (H2).
Do Airline Referral and Referral Traffic get affected by Usage of Mobile Devices?
After examining the repercussions of mobile and desktop usage to airlines direct and referral traffic, we continue estimating desktop and mobile usage impact to airlines’ organic traffic (Hypotheses 3 and 4). On the same route, a much more important metric than referral and direct traffic, is the organic traffic, with airline firms having a bigger interest in estimating and predicting it. Thus, knowing the significance of desktop and mobile usage’s impact on airlines organic traffic are two of the most important research hypotheses of our paper.
Hypothesis 3 (H3).
To what extent does Airline Organic Traffic gets affected by the choice of Desktop Devices?
Hypothesis 4 (H4).
To what extent does Airline Organic Traffic gets affected by the choice of Mobile Devices?
Next on, we focus on comparing the impact of each usage mean, aiming to perceive which device affects airlines’ direct traffic more (Hypothesis 5). In other words, insights regarding which device brings the most direct visitors, induces multiple benefits for airline companies concerning costs linked to device choice, development of mobile app, etc.
Hypothesis 5 (H5).
Which Device Usage affects more Airline Direct Traffic, Mobile or Desktop?
For the last hypothesis and retaining the comparison touch, we seek to estimate whether the average visit duration of mobile devices affect airlines organic traffic more, than desktop average visit duration does (Hypothesis 6). Insight of that kind seek to compare the preference of visitors in terms of average visit duration, and acknowledging which device has the strongest impact to airlines organic traffic is useful.
Hypothesis 6 (H6).
Which Average Visit Duration affects more Organic Traffic, those generated at Mobile or Desktop Devices?
2. Materials and Methods
The purpose of this paper has been the proposal of an innovative methodology for deploying an efficient framework for understanding the preferred visitors’ device, namely desktop or mobile, through their web metrics, providing valuable insights for airline firms’ digital marketing strategy. In this way, we incorporate the above aims to the presented research stages (Figure 1).
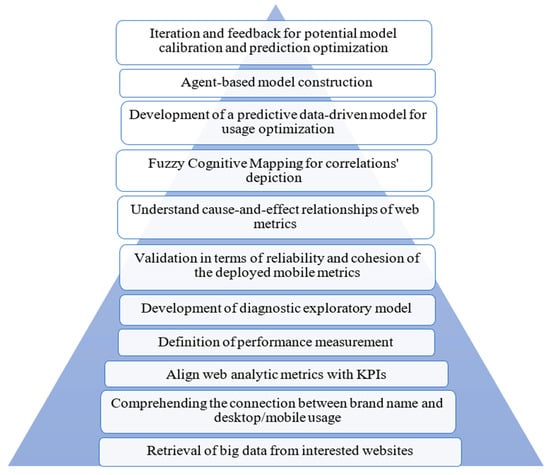
Figure 1.
Overall representation of the proposed methodology, step-by-step, reflecting the stages for comparing desktop and mobile usage with websites’ traffic.
- Big Data retrieval from airlines’ websites through web analytics tools (SEMrush), for discovering possible connections between them and airlines’ traffic, in alignment with KPIs. From the data gathered, we distinguish that both desktop and mobile usage highly affect airlines’ traffic sources and especially organic traffic;
- Developing a Diagnostic Exploratory Model, for existing strong correlations estimation of the chosen web analytics metrics, based on integrity, veracity, and credibility, by the deployment of Fuzzy Cognitive Mapping [48], linear regression, and correlation analysis;
- Lastly, we develop a predictive and simulation model (Agent-Based Modelling) in combination with regression analysis outputs, for examining the extent of desktop and mobile usage and average visit duration impact on airlines’ traffic sources and their joint impact, for estimating which has the strongest effect on the chosen traffic sources.
At the first stage of the methodology, after underlining the reflection of digital marketing topics, such as SEO, in our approach, we aim to give a handful of insights to marketeers regarding web page data. In this stage, interested web metrics collection and alignment with the selected KPIs is a compulsory part of the process (e.g., high usage of mobile devices may indicate a rise in direct and referral traffic to airlines’ website, giving stimulus for harnessing that device in favor of digital marketing strategy). Web metrics collection took place by utilizing SEMrush tools (www.semrush.com, accessed on 22 September 2021), which is a website that helps businesses improve their website’s visibility and discovering marketing insights. Its tools gather web data, such as visitors, bounce rate, organic traffic, etc., and sorts them in historical order.
At the second stage, after having extracted the parameters and means that impact the organization’s traffic the most, marketeers and strategists will be in a better position than before. The use of quantitative statistical analysis escorts the above process, with variations of mobile and desktop usage causing a variation in organic, direct, and referral airline traffic. So, after having checked the correlations of selected metrics of both devices, such as total and unique visitors, bounce rates, average visit duration, we run linear regression models for the significant variables, offering more accurate decision-making info for marketeers.
At the last stage, the remaining action is to incorporate the metrics correlations and outputs of the regression analysis to a predictive and simulation model. This can give more accurate and temporal prediction results. According to Giabbanelli et al. [49], through simulation and prediction model development we can reach out to both micro and macro level approaches, combined with decision-making originated in data-driven philosophy. Thus, we aim to connect the users that interact with airline websites with the results of the proposed and extracted model. In this path, the aid of eye tracking and emotions application and software could provide valuable data for model development.
2.1. Sample Selection, Data Retrieval, and KPIs’ Alignment
For the purpose of this paper, we retrieved data from some of the most known airline companies in the world. Those firms were chosen according to travelers’ opinions and ratings for 2019 [50], based namely on their personal criteria. So, based on consumers’ opinion and ratings for the airline sector, an analysis of their website visibility accompanied with visitors’ website behavior is gaining ground. The airline companies included in our research are the top 10 on the above list, Qatar Airways, Singapore Airlines, ANA All Nippon Airways, Cathay Pacific Airways, Emirates, EVA Air, Hainan Airlines, Qantas Airways, Lufthansa, and Thai Airways. For the above airline firms, data were collected from desktop and mobile devices, concerning their websites’ organic, direct and referral traffic, as well as their total visitors’ and unique visitors’ number, the pages per visit and the websites’ bounce rate. The vast amount of web data can lead to promising results regarding the usage of mobile and desktop devices.
Data were collected on a daily basis from the firms’ websites, for the purpose of more accurate examination and comprehension of web metrics’ variance. The testing period extended to 180 observation days, which is limited to specific dates due to data availability and COVID-19 transportation restrictions from approximately March 2020 to June 2020, Thus, testing period starts from 1 August 2020 and ends 1 January 2021, with data differing from day-to-day and visitor-to-visitor, leading to big fluctuation of the web metrics. Moreover, in order to align the need of marketeers to reduce the amount of tracking data, we suggest tracking total visitors and unique visitors’ number and pages per visit, organic, direct, and referral traffic, so as to better handle and understand Big Data from websites in favor of their digital marketing optimization.
2.2. Development of Diagnostic and Exploratory Model
In diagnostic and exploratory model development, we aim to capitalize web analytics data from the selected airline firms, so as the model output to:
- Emphasize on the strong correlations of the selected metrics;
- Include the valuable veracity and credibility, enabling digital marketing strategy’s potential model implementation.
Starting with the first stage, we implemented statistical analysis for ensuring linearity and normality of the selected metrics from the chosen airline websites. The insurance of the normality and linearity in the 180 observation days was enabled through appropriate statistical tests, i.e., Scatter plots, histograms, etc. Psychometric properties of scales were performed via Cronbach’s alpha [51] and Kaiser-Meyer-Olkin’s [52] tests on the selected variables. The tests above aim to provide the combined variables with the required cohesion and tolerance. For the deployment of the diagnostic exploratory model, we performed linear regression modelling to metrics with the strongest correlations.
Results of the regression analysis, present significant relationships for mobile and desktop usage with the organic, direct and referral traffic of airlines’ websites. Namely, for the 10 airlines’ websites used, mobile and desktop usage appear to have strong positive correlations with organic, direct, and referral traffic, while having strong negative correlations with mobile pages per traffic and desktop bounce rate. Thus, we aim to provide additional insights to marketing strategists over the impact of mobile and desktop usage to airlines’ digital brand name and answer the most valuable and important device for each brand name’s factor, in favor of their digital marketing strategy.
Therefore, we deployed a Fuzzy Cognitive Mapping (FCM), which will implement selected web metrics of both airline devices depicting the relationships, so as to get a more adaptive model for process assessment. Fuzzy cognitive mapping deploys a descriptive and consolidated stochastic classification methodology, mainly used to represent the correlations between airlines’ web metrics. Blue and red arrows in Figure 2 illustrate variables with positive and negative relations accordingly. Development of the FCM has been conducted via the Mental Modeler cloud-based application.
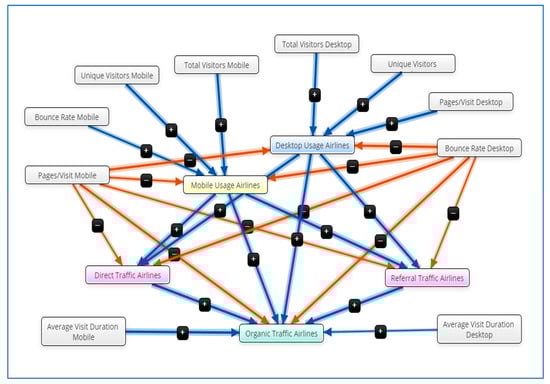
Figure 2.
Fuzzy Cognitive Mapping depiction of a macro-level approach.
The Fuzzy Cognitive Map provides proper illustration of agents’ relationships, which is used in our paper for recognition of important relationships, putting in use arithmetic clouts. As Salmeron [48] states, the implementation of Exploratory Modelling in digital marketing decision-making is broad and very practical. FCM deployment enables firms to reflect on a macro-level approach their digital marketing strategy plan, based on factors’ relationships [53]. As we see in Figure 2, mobile and desktop usage is affected by the most known web analytics and thus, affecting organic, referral and direct traffic. In this way, we illustrate the macro-level depiction of related digital marketing strategy (e.g., SEO, SEM) and promotion factors, while giving the propriate optimizing tools, which in our case means reviewing the effects of mobile and desktop usage on airlines’ traffic sources.
Besides FCM, we need to develop at the same time a micro-level analysis for a more complete depiction of a firm’s market situation. Agent-Based Modeling can provide that needed analysis, since it depicts the dynamic variations of selected factors, atomically or amongst them, producing the necessary predictive and simulation model [49]. In our case, mobile and desktop usage can affect various airline traffic sources such as organic, referral, or direct. Agent-Based Modelling (ABM) offers the possibility of calculating the impact of mobile and desktop usage to the above traffic sources, rendering it essential for the predictive and simulation analysis, at the examined 180 observation days.
2.3. Development of Predictive and Simulation Model
An agent-based models concept, consists of different characteristics and behavior agents that interact with each other via a variety of operators, giving us a suitable designed system portrayal of the containing units. The benefits of agent-based modelling (ABM) in digital marketing are highly obvious, meaning its incorporation in prediction and simulation model development is substantial. This makes decision making on a managerial level more feasible. So, digital marketing topics such as SEO, etc., could take advantage of the implementation of web metrics, combined with mobile and desktop usage, to traffic source analysis, creating benefits for a firms’ digital brand name. Through ABM, a calculative and heuristic process is developed by capitalizing large scale Big Data, domain competence and factors’ relationships. Study [54] highlighted the offerings of micro-level modelling picture of real-time problems and decision-making configuration, while in the meantime it can provide further benefits to marketing strategist, such as:
- Full data range exploitation of mobile and desktop usage, with the business being able to determine the most profitable device. Up to that point, a clear depiction of a firms’ best choice for harnessing device data in favor of their digital marketing strategy.
- Acknowledgment of visitors’ micro-level modelling in favor of simulation, keeping the cost at a low level. Lower costs concerning mobile and desktop strategy can help airlines design digital marketing campaigns and SEO more efficiently. Thus, whether a desktop or a mobile device is mostly preferred has the potential to affect a firm’s organic traffic and consequently the firm’s digital brand name.
- Alignment of the prediction model, through making it more adaptable with continuous supply of necessary analysis tools. For the above purposes, we deployed the Agent Based Model, for its precise predictive and simulation capabilities in terms of web metrics, since the dynamic type it has fits the challenging digital marketing sector.
3. Results
In this section, we present the results generated from the chosen statistical approach after being collected from the selected airlines’ websites. Table 3 depicts the chosen descriptive statistics such as mean, min, max, and standard deviation for each of the involved web metrics. The results shown in Table 3, Table 4, Table 5, Table 6, Table 7, Table 8, Table 9 and Table 10, refer to data gathering between 1 August 2020 and 1 January 2021.
Table 3.
Descriptive statistics of the 10 airline companies’ websites, during a 6-month period.
Table 4.
Consistency of combined variables.
Table 5.
Impact of desktop usage to direct and referral traffic.
Table 6.
Impact of mobile usage to direct and referral traffic.
Table 7.
Impact of mobile and desktop usage to organic traffic.
Table 8.
Concurrent impact of mobile and desktop usage to direct traffic.
Table 9.
Impact of mobile and desktop average visit duration to organic traffic.
Table 10.
Comparison between desktop and mobile usage affecting airlines organic, direct, and referral traffic.
As we can see in Table 4, the items consisting of the used variables, produce results near the required levels of tolerance and item coherence. With KMO and Cronbach’s alpha values higher than 0.7 [51,52], items are proper for statistical analysis. Our proposed variables of desktop and mobile usage have almost 0.7 results in the above tests, so they can be considered appropriate for the upcoming regression analysis.
Table 5, Table 6, Table 7, Table 8, Table 9 and Table 10, present the results of the multiple linear regressions, performed for the 10 airlines’ websites comparing device usage with traffic sources. In Table 5 and Table 6, we see that both regression models are statistically significant with p values below 5%, verifying the first and second research hypotheses. The significant regressions of desktop usage equations had p = 0.009 and 0.002, R2 = 0.848 and 0.932, potential variation of 0.921 for direct and 0.966 for referral traffic, respectively. With every 1% increase of desktop usage, airlines’ direct traffic increases by 92.1% and referral by 96.6%. The same applies for mobile usage, which had p = 0.000 and 0.003, R2 = 0.999 and 0.912, and potential variation of 100 for direct and 0.955 for referral traffic. Every 1% increase of mobile usage, airlines’ direct traffic increases by 100% and referral by 95.5%.
Next, in Table 7 we have two other statistically significant regressions models with p = 0.006 and 0.004, R2 = 0.876 and 0.897 and potential variation of 93.6 and 94.7 of organic traffic caused by desktop and mobile usage, respectively. For every 1% increase of desktop usage the organic traffic is increased by 93.6%, while for every 1% of mobile usage increase organic traffic is increased by 94.7%. In this way the third and fourth hypotheses are verified as both desktop and mobile usage have statistically significant regressions with organic traffic. In Table 8, we have statistically significant regression for airlines’ direct traffic with mobile and desktop usage, with p = 0.000, total R2 of 0.999 and potential variation of 0.999 for mobile usage, while desktop usage appears to have no significant impact on direct traffic. So, with every 1% rise in mobile usage, direct traffic increases by 99.9%. At last, in Table 9, an airlines’ organic traffic gets statistically significant impact from mobile usage, with p = 0.042, total R2 of 0.824 and potential variation of 1.019, while it appears to have no statistically significant connection with desktop usage. If mobile average duration is increased by 1%, an airlines’ organic traffic will be increased by 101.9%. In this way, our sixth hypothesis is verified also with deployment of statistically significant coefficient for organic traffic and mobile average duration, but not for desktop average duration.
The results above, indicate that desktop usage in comparison with mobile usage produces greater percentage impact. Nevertheless, the statistical significance of mobile’s impact in organic and direct traffic is stronger (p-levels of significance have lower score) meaning that mobile usage’s impact is bigger than desktop’s usage. For referral traffic, the opposite is applied with desktop usage having slightly bigger impact that mobile usage. When it comes to visit duration, mobile average visit duration has a higher impact to airlines’ organic traffic than desktop duration, which appears to have no statistically significant impact to it at all. From Table 10, we can see that both mobile and desktop device usage increase an airlines’ digital brand name by increasing their traffic sources, specifically organic traffic. In order to calculate the exact effect device usage has on an airlines’ traffic, we should examine how the individual metrics form usage variable, and of course how they interact between them. In this way, we can have a clearer picture of the impact each device’s usage has. There is great opportunity of exploiting mobile or desktop devices’ usage in favor of airlines’ digital brand name through organic, direct, and referral traffic.
Development of Agent-Based Model
Using regression analysis we exploit the significant results in favor of ABM development, for deploying a simulation and prediction model. ABM and regression analysis usage, assists in information gathering of concerned agents’ behavioral pattern, thus leading to better understanding of ways to optimize digital marketing strategy, through analyzing variables’ correlations and event-occurring probabilities. Based on Davis et al. [55] methodology, we developed an agent-based model relying on data-driven and decision-making activities. In this respect, ABM’s implementation in digital marketing can create many opportunities for digital marketing promotion and strategy planning, such as, in our case, the prediction of preferred user device (mobile or desktop) in the airline sector.
Type of Data: Information on quantitative data collected by regression and statistical analysis are incorporated into the AMB. By being represented numerically, they reveal the relationships between variables that are required for model deployment.
Data measurement repetition: For analysis purpose, we implement one-time snapshot dataset process to retrieve data concerning definite date range. In this way, we supply the ABM with real-time web metrics data, something that can be proven to be highly important for a firm’s digital marketing strategy deployment.
Agents’ involvement: During the last stage, we analyze the steps of applying and estimating the Agent-Based Model through the gathered data. By implementing the results of a Fuzzy Cognitive Model, which will provide the connection of the macro-level modelling, we execute the regression statistics results to every individual agent. Namely, we do so by referring to the individual-level of ABM, while also introducing the Poisson probability distribution with lambda values (λ) around mean value of total Potential Visitors. Implications of Poisson probability function [56] in our research, can lead to:
- More accurate time window determination for optimized execution of the predictive model (research use of 180 observation days);
- Feasible expression by the constant descriptive statistics of the ten involved airline websites during the 180 observation days;
- Singularity definition of performance in digital brand name, in terms of organic, direct, and referral traffic of the selected airline websites.
In Figure 3, the Agent-Based Model is introduced, aiming to give practical and handful knowledge regarding the impact of crowdsourcing web traffic to a firm’s gross profit and the later impact on their web traffic/keywords. Insights of this kind help marketeers to optimize airline firm’s digital marketing strategy. The calculative ABM deployment can be observed at the JAVA coding output in Table A1 (see Appendix A).

Figure 3.
Agent-based predictive model development for the potential influence prediction of desktop and mobile devices on airlines’ organic, direct, and referral traffic.
The model’s start is the Potential Visitors in the first state chart, setting the pace for Agent Based Modelling creation procedure. The analogy of mobile visitors to desktop visitors is bigger, so a larger part of Potential Visitors end up in the Mobile Usage state chart and a smaller part in Desktop Usage. Potential Visitors follow the Poisson distribution, so Visitors, Unique Visitors and Pages per Visitors of Mobile and Desktop Usage are affected by the allocation rate of the distribution. Due to high or low levels of Mobile and Desktop Bounce Rate, a number of visitors using mobile and desktop devices leave the website and affect the overall results. In the meantime, with every device’s website visit, an Average Visit Duration of mobile or desktop mean is calculated. Every variation in Mobile and Desktop Usage as well as Bounce Rate affect Airlines’ Organic, Direct, and Referral Traffic according to the regression’s coefficients and variables’ relationships. In this model simulation, we represent the path that Mobile and Desktop Users follow to provoke change in airlines’ Organic, Direct, and Referral Traffic. ABM’s procedure outcome generates an agent population allocation (Figure 4) and a time-graph (Figure 5) that display the variation of airlines’ Organic, Direct, and Referral Traffic, caused by higher Mobile and Desktop Usage, while also giving information about the comparison of device usage effect on their traffic sources.
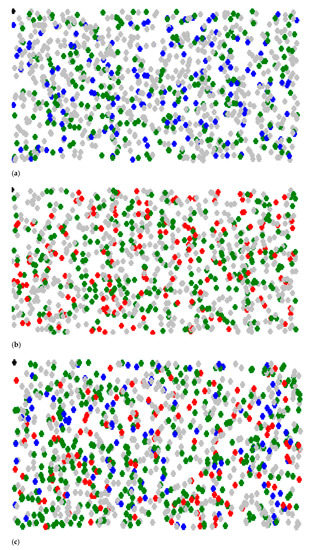
Figure 4.
Population distribution in an experiment with 1000 agents. The silver color represents potential airline visitors, red the analogy of airline mobile device usage, and blue the desktop usage, with green color showing the analogy of affected direct, referral, and organic traffic (digital brand name). (a) shows the contribution of desktop usage to airlines’ digital brand name, (b) the contribution of mobile usage, and (c) the allocation of both devices’ usage and their contribution to airlines’ digital brand name.
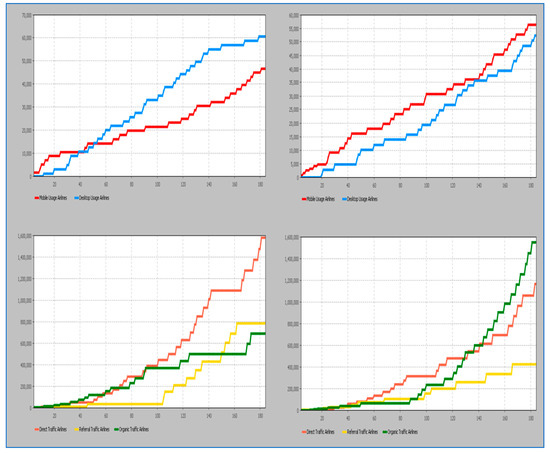
Figure 5.
Depiction of Airline companies’ desktop and mobile usage, impacting their organic, direct, and referral traffic. On the left side, desktop usage is higher than mobile usage, while on the right side, mobile usage is higher.
In Figure 4, we see the dispersion of 1000 agents in a period of 180 observation-days. It involves potential airline visitors, mobile and desktop visitors/users and organic, direct and referral visitors summing the organic, direct, and referral traffic. The model begins with 100 airlines’ website potential visitors (silver) and those visitors are split to mobile users (red) and desktop users (blue). Then, we get the number of visitors from mobile and desktop devices ending up in organic, direct, and referral airline traffic, summing up their digital brand name variable (green).
On both vertical axis, we observe the number of visitors that use either device and end up increasing an airlines’ traffic, while on the horizontal axis we see those devices and traffic sources. The simulation date range counts 180 sequential observation days for the 10 chosen airlines’ websites. From the simulation model, we extract the following results. Mobile device usage attracts more airline website visitors than desktop devices. Direct traffic is affected more by mobile usage than desktop usage, while referral traffic is highly affected by desktop usage rather than mobile usage. Finally, we can also see that an airlines’ organic traffic follows the variation of desktop usage and mobile usage, with mobile usage appearing to have a bigger impact to organic traffic than desktop usage.
4. Discussion
The purpose of this paper has been the development of a precise methodology, containing pioneering context, aiming to provide useful insights concerning digital marketing refinement from device usage. The main sources of data gathering have been mobile and desktop devices, where we sought to distinguish the preferred device for airline firms’ utilization. Airlines can utilize information regarding users’ device preferences, in favor of their digital marketing strategy (SEO) and the choice of mobile apps deployment. Regression analysis showed that an airlines’ organic traffic could be increased by up to 94.7% and 93.6% from desktop and mobile usage, respectively, while direct and referral traffic could be increased by up to 92.1% and 92.1% from desktop and 96.6% and 95.5% from mobile usage, correspondingly.
Through simulation and prediction analysis we identified that airline organic traffic is affected by both device usage, with mobile devices having a more significant impact, direct traffic is highly affected by mobile usage and referral traffic affected more by desktop usage. It lies on the airlines’ part to choose whether to develop mobile applications or to keep investing in existing desktop webpages. The more visitors a website has, the more its digital brand name can possibly be enhanced [57]. As a consequence, in order to optimize their SEO strategy and improve their digital brand name, airline firms should examine whether a rise in direct traffic appeals to more customer conversions over conversions of organic and referral traffic rise, where mobile usage has more influence.
Future research aspects of digital marketing strategies should focus more on website users’ behavior, for practical data collection. In this respect, eye tracking and emotion analysis of methodological frameworks can provide those required data. Website visitors seem to produce more delightful emotions and intense facial expressions, when observing emotional contexts [58]. In addition, potential customers’ interest tends to lay on where websites’ highest fixations are gathered [59]. Implication of neuromarketing analysis in digital marketing has major potential for benefits in marketing strategy and brand name promotion. Observation of visitors’ behavior over websites leads to better understanding of web metrics and parameters affecting digital brand name and device usage.
5. Conclusions
5.1. Mobile and Desktop Device Usage Impingement in Digital Brand Name
As has been assumed by Simon and Sullivan [60], a brand name represents a compound of a firm’s most thriving products, opening way for active digital marketing strategies involvement. In websites, a firm’s digital brand name variation can be depicted by web traffic variability, especially organic, direct, and referral traffic. Moreover, firms need to acknowledge whether online consumers and website visitors prefer using desktop or mobile devices for entering their web domains. Firms should bear in mind various factors that affect mobile and desktop devices when aiming to harness device usage in favor of their digital brand name’s interpretation.
Users’ satisfaction and usage over different devices can be affected by frequent use of web analytics tools in advertising campaigns [61] and perceived value [8] in many terms such as visual appearance. Then, higher satisfaction and device usage could trigger customers’ prospective responses [62], unplanned [15], and impulsive purchases [63,64]. Specific types of operations that demand comfort, are better performed at desktop devices [65], while mobile devices’ movability provide multiple benefits. There are considerable differences between desktop and mobile devices in terms of visuals, layout, usability, etc. [64].
In our research, we discerned the role of desktop usage to airlines’ organic and referral traffic, as well as mobile usage to airlines’ organic and direct traffic. Therefore, desktop usage appears to have a greater impact on organic traffic than mobile usage, even though both had significant effects. Apart from organic traffic, we highlighted that referral traffic is significantly affected by desktop usage, with direct traffic also being affected significantly by mobile usage. Thus, airlines’ digital brand name, composed of organic, referral and direct traffic, is affected by both mobile and desktop usages. This paper’s results are consistent with the outcomes of the study by Sakas and Giannakopoulos [66], highlighting the significant effect referral and direct traffic have, apart from organic traffic, on airline firms digital brand name and gross profit, from all types of devices (e.g., desktop, mobile, tablets, etc.).
There is a plethora of benefits from capitalizing our findings to improve a firm’s KPIs. In our research subject, we implemented specific KPIs related to digital brand name and usage metrics. For digital brand name’s performance measurement, organic, direct, and referral traffic were used, while for device usage measurement, total and unique visitors and pages per visit were assembled. We implied a three-staged methodology, which includes precise definition of examined KPIs, web data collection, and proper analysis and, eventually, web metrics intercorrelations estimation. Through this methodological framework, problems of managerial nature, regarding web analytics exploitation and marketing nature, concerning matching KPIs with web metrics [43], may be pared down [67]. Tackling of those hardships may start from using appropriate and precise KPIs for firms’ performance assessment. Next, examining and collecting suitable web metrics defining device usage, as well as their in-depth analysis, can be helpful for marketeers to decide whether to focus on desktop or mobile device (desktop/laptops or mobile devices) development.
5.2. Research Implications
The main focus of this paper was to examine the contribution of devices’ usage to airline firms’ digital brand name empowerment. In order to specify what digital brand name variables will undergo regression analysis, such as organic, referral and direct traffic, we used independent variables of mobile and desktop usage. We found that an airlines’ digital brand name can be significantly affected by mobile and desktop usage, with the latter having greater impact on organic traffic than mobile usage. Regression results show that R2 and model fit statistics fluctuate between 0.824 and 0.999 (Table 5, Table 6, Table 7, Table 8 and Table 9) pointing out the importance of the outcomes [68].
It is suggested that mobile device users consider many benefits from those apps, such as exclusive offers and deals, outweighing their perceived costs and adding value. Given that firms, especially in the airline sector, could develop built-in application functions so as to map consumers’ behavioral and perceptional patterns. In this way, they will be in a place to increase mobile usage, engagement, and repurchase intention [8]. For more accurate customer behavior and needs mapping, both desktop and mobile usages are critical, while maintaining just a mobile responsive website may be proven insufficient [69].
Eventually, we propose further investigation in terms of the proposed methodology, concerning credibility and level of parameters affecting an airlines’ digital brand name. Domains of organic, referral, and direct traffic can provide efficient methodological framework for digital brand name, so further domain research optimizes results. Furthermore, according to devices usage, our framework showed the dominance of mobile devices over desktop, but also the importance of running both versions simultaneously. Likewise, additional research is suggested for optimized results in terms of devices’ usage over digital brand name’s factors, such as organic traffic. Our proposed framework functioned efficiently, providing accurate and handful insights for airline firms’ marketeers. Thus, the paper’s methodological framework could be expanded and generalized to other markets, reflecting website visitors and potential consumers, such as consumer retail sectors (e.g., convenience, drugs, department stores, auto retailers, etc.), the manufacturing sector, passenger transportations, etc., with clear focus on their e-commerce fortification.
Author Contributions
Conceptualization, D.P.S.; data curation, N.T.G.; formal analysis, N.T.G.; investigation, N.T.G.; methodology, D.P.S. and N.T.G.; project administration, N.T.G.; software, N.T.G.; supervision, D.P.S.; validation, N.T.G.; visualization, N.T.G.; writing—original draft, N.T.G. All authors have read and agreed to the published version of the manuscript.
Funding
This research received no external funding.
Institutional Review Board Statement
Not applicable.
Informed Consent Statement
Not applicable.
Data Availability Statement
Not applicable.
Conflicts of Interest
The authors declare no conflict of interest.
Appendix A
Table A1.
JAVA coding route for defining Poisson distribution in potential visitors’ allocation to mobile and desktop users.
Table A1.
JAVA coding route for defining Poisson distribution in potential visitors’ allocation to mobile and desktop users.
| JAVA Coding Route for Defining Poisson Distribution in Potential Visitors’ Allocation to Mobile and Desktop Users |
|---|
| {case potentialVisitors: // (Simple state (not composite)) statechart.setActiveState_xjal( potentialVisitors ); {PotentialVisitorsAirlines = poisson(1000);} transition.start(); transition1.start(); return; case MobileUsage: // (Composite state) transition8.start(); transition12.start(); transition14.start(); transition16.start(); transition25.start(); if ( _destination ) { enterState( visitorsMobile, true ); } return; case bounceRateMobile: // (Simple state (not composite)) statechart.setActiveState_xjal( bounceRateMobile ); transition10.start(); return; case directTraffAirlines: // (Simple state (not composite)) statechart.setActiveState_xjal( directTraffAirlines ); {DirectTrafficAirlines = DirectTrafficAirlines + DesktopUsageAirlines*(0.000326) + MobileUsageAirlines*(0.424);} transition19.start(); return; case referralTraffAirlines: // (Simple state (not composite)) statechart.setActiveState_xjal( referralTraffAirlines ); {ReferralTrafficAirlines = ReferralTrafficAirlines + DesktopUsageAirlines*(0.300) + MobileUsageAirlines*(0.075);} transition20.start(); return; case organicTraffAirlines: // (Simple state (not composite)) statechart.setActiveState_xjal( organicTraffAirlines ); {OrganicTrafficAirlines = OrganicTrafficAirlines + DesktopUsageAirlines*(0.961) + MobileUsageAirlines*(0.416);;} transition18.start(); return; case DesktopUsage: // (Composite state) transition9.start(); transition13.start(); transition15.start(); transition17.start(); transition21.start(); if ( _destination ) {enterState( visitorsDesktop, true );} return; case bounceRateDesktop: // (Simple state (not composite)) statechart.setActiveState_xjal( bounceRateDesktop ); transition11.start(); return; case visitorsDesktop: // (Simple state (not composite)) statechart.setActiveState_xjal( visitorsDesktop ); {VisitorsDesktop = PotentialVisitorsAirlines;} transition5.start(); transition22.start(); transition23.start(); return; case pagesVisitorDesktop: // (Simple state (not composite)) statechart.setActiveState_xjal( pagesVisitorDesktop ); {PagesVisitorDesktop = VisitorsDesktop*(0.837);} transition6.start(); return; case uniqueVisitorsDesktop: // (Simple state (not composite)) statechart.setActiveState_xjal( uniqueVisitorsDesktop ); {UniqueVisitorsDesktop = VisitorsDesktop*(0.897);} transition7.start(); return; case visitorsMobile: // (Simple state (not composite)) statechart.setActiveState_xjal( visitorsMobile ); {VisitorsMobile = PotentialVisitorsAirlines;} transition2.start(); transition24.start(); transition26.start(); return; case uniqueVisitorsMobile: // (Simple state (not composite)) statechart.setActiveState_xjal( uniqueVisitorsMobile ); {UniqueVisitorsMobile = VisitorsMobile*(0.994);} transition3.start(); return; case pagesVisitorMobile: // (Simple state (not composite)) statechart.setActiveState_xjal( pagesVisitorMobile ); {PagesVisitorMobile = VisitorsMobile*(−0.736);} transition4.start(); return; default: super.enterState( _state, _destination ); return;}} |
References
- Wang, C.S.; Jeng, Y.L.; Huang, Y.M. What influences teachers to continue using cloud services? The role of facilitating conditions and social influence. Electron. Libr. 2017, 35, 520–533. [Google Scholar] [CrossRef]
- Faroukhi, A.Z.; El Alaoui, I.; Gahi, Y.; Amine, A. An adaptable Big Data value chain framework for end-to-end Big Data monetization. Big Data Cogn. Comput. 2020, 4, 34. [Google Scholar] [CrossRef]
- Kirsh, I.; Joy, M. Splitting the Web Analytics Atom: From Page Metrics and KPIs to Sub-Page Metrics and KPIs. In Proceedings of the WIMS 2020, 10th International Conference on Web Intelligence, Mining and Semantics, Biarritz, France, 30 June–3 July 2020; pp. 33–43. [Google Scholar] [CrossRef]
- Drivas, I.C.; Sakas, D.P.; Giannakopoulos, G.A.; Kyriaki-Manessi, D. Big data analytics for search engine optimization. Big Data Cognit. Comput. 2020, 4, 5. [Google Scholar] [CrossRef]
- Schubert, D. Influence of mobile-friendly design to search results on Google search. Proc. Soc. Behav. Sci. 2016, 220, 424–433. [Google Scholar] [CrossRef]
- Vankeirsbilck, B.; Deboosere, L.; Simoens, P.; Demeester, P.; Turck, F.D.; Dhoedt, B. User subscription-based resource management for desktop-as-a-service platforms. J. Supercomput. 2014, 69, 412–428. [Google Scholar] [CrossRef][Green Version]
- Kleijnen, M.; De Ruyter, K.; Wetzels, M. An assessment of value creation in mobile service delivery and the moderating role of time consciousness. J. Retail. 2007, 83, 33–46. [Google Scholar] [CrossRef]
- Chopdar, P.K.; Balakrishnan, J. Consumers response towards mobile commerce applications: S-O-R approach. Int. J. Inf. Manag. 2020, 53, 102–106. [Google Scholar] [CrossRef]
- M., S.; Chattu, V.K. A review of artificial intelligence, Big Data, and blockchain technology applications in medicine and global health. Big Data Cogn. Comput. 2021, 5, 41. [Google Scholar] [CrossRef]
- Hasan, L.; Morris, A.; Probets, S. Using Google Analytics to Evaluate the Usability of E-Commerce Sites. In Human Centered Design HCD 2009, Proceedings of the 1st International Conference on Human Centered Design, San Diego, CA, USA, 19–24 July; Kurosu, M., Ed.; Springer: Berlin/Heidelberg, Germany, 2009; pp. 697–706. [Google Scholar] [CrossRef]
- Chaffey, D.; Patron, M. From web analytics to digital marketing optimization: Increasing the commercial value of digital analytics. J. Direct Data Digit. Market. Pract. 2012, 14, 30–45. [Google Scholar] [CrossRef]
- Maurer, M.-E.M.; Hausen, D.; De Luca, A.; Hussman, H. Mobile or Desktop Websites? Website Usage on Multitouch Devices. In Proceedings of the 6th Nordic Conference on Human-Computer Interaction 2010, Reykjavik, Iceland, 16–20 October 2010. [Google Scholar] [CrossRef]
- Racherla, P.; Furner, C.; Babb, J. Conceptualizing the Implications of Mobile App Usage and Stickiness. Res. Agend. 2012. [Google Scholar] [CrossRef]
- Huang, Y.-M. Examining students’ continued use of desktop services: Perspectives from expectation-confirmation and social influence. Comput. Human Behav. 2019, 96, 23–31. [Google Scholar] [CrossRef]
- Law, D.; Wong, C.; Yip, J. How does visual merchandising affect consumer affective response? An intimate apparel experience. Eur. J. Market. 2012, 46, 112–133. [Google Scholar] [CrossRef]
- Lai, F.; Griffin, M.; Babin, B.J. How quality, value, image, and satisfaction create loyalty at a Chinese telecom. J. Bus. Res. 2009, 62, 980–986. [Google Scholar] [CrossRef]
- Kim, Y.H.; Kim, D.J.; Wachter, K. A study of mobile user engagement (MoEN): Engagement motivations, perceived value, satisfaction, and continued engagement intention. Decis. Support Syst. 2013, 56, 361–370. [Google Scholar] [CrossRef]
- Voropanova, E. Conceptualizing smart shopping with a smartphone: Implications of the use of mobile devices for shopping productivity and value. Int. Rev. Retail. Distribut. Consum. Res. 2015, 25, 529–550. [Google Scholar] [CrossRef]
- Zarmpou, T.; Saprikis, V.; Markos, A.; Vlachopoulou, M. Modeling users’ acceptance of mobile services. Electron. Commer. Res. 2012, 12, 225–248. [Google Scholar] [CrossRef]
- Jang, S.; Chong, K.; Yoo, C. The effect of mobile application-driven customer participation on bakery purchase behavior Evidence from a field experiment. Int. J. Hospit. Manag. 2021, 94, 102865. [Google Scholar] [CrossRef]
- Okazaki, S.; Mendez, F. Perceived ubiquity in mobile services. J. Int. Market. 2013, 27, 98–111. [Google Scholar] [CrossRef]
- Lin, Y. 10 Mobile Usage Statistics Every Marketer Should Know in 2021. 2020. Available online: https://www.oberlo.com/blog/mobile-usage-statistics (accessed on 21 April 2021).
- Petrov, C. 57 Mobile vs. Desktop Usage Statistics for 2021 [Mobile’s Overtaking!]. 2021. Available online: https://techjury.net/blog/mobile-vs-desktop-usage/#gref (accessed on 3 May 2021).
- Krohn, S. Organic Traffic and Why It Is Important. 2016. Available online: https://www.linkedin.com/pulse/organic-traffic-why-important-krohn-online-traffic-generation (accessed on 21 April 2021).
- Jeffers, J. Is Direct Traffic an Indicator of Brand Strength? 2019. Available online: https://www.portent.com/blog/analytics/is-direct-traffic-an-indicator-of-brand-strength.htm (accessed on 4 May 2021).
- Chawla, V. Referral Traffic Is Goldmine, Brands Should Use It. 2020. Available online: https://bloncampus.thehindubusinessline.com/columns/going-digital/referral-traffic-is-goldmine-brands-should-use-it/article31118849.ece (accessed on 4 May 2021).
- Shelley, R. What Is Referral Traffic? 2020. Available online: https://www.smamarketing.net/blog/what-is-referral-traffic (accessed on 24 March 2021).
- Omniconvert. What Is...Organic Traffic. 2019. Available online: https://www.omniconvert.com/what-is/organic-traffic/ (accessed on 9 April 2021).
- Gústafsdóttir, G. What do the Different Metrics (Visits, Page Views, Unique Visitors, etc.) Mean in Analytics? 2021. Available online: https://support.siteimprove.com/hc/en-gb/articles/207866996-What-do-the-different-metrics-visits-page-views-unique-visitors-etc-mean-in-Analytics- (accessed on 9 April 2021).
- Clifton, B. Advanced Web Metrics with Google Analytics; John Wiley & Sons: Indianapolis, IN, USA, 2012. [Google Scholar]
- Shang, D.; Wu, W. Understanding mobile shopping consumers’ continuance intention. Ind. Manag. Data Syst. 2017, 117, 213–227. [Google Scholar] [CrossRef]
- McLean, G.; Al-Nabhani, K.; Wilson, A. Developing a mobile applications customer experience model (MACE)-Implications for retailers. J. Bus. Res. 2018, 85, 325–336. [Google Scholar] [CrossRef]
- Marriott, H.R.; Williams, M.D. Exploring consumers perceived risk and trust for mobile shopping: A theoretical framework and empirical study. J. Retail. Consum. Serv. 2018, 42, 133–146. [Google Scholar] [CrossRef]
- Tak, P.; Panwar, S. Using UTAUT 2 model to predict mobile app based shopping: Evidences from India. J. Ind. Bus. Res. 2017, 9, 248–264. [Google Scholar] [CrossRef]
- Kirkpatrick, D. Google: 53% of Mobile Users Abandon Sites that Take over 3 Seconds to Load. 2016. Available online: https://www.marketingdive.com/news/google-53-of-mobile-users-abandon-sites-that-take-over-3-seconds-to-load/426070/ (accessed on 14 April 2021).
- StatCounter. Desktop vs Mobile vs. Tablet Market Share Worldwide. 2020. Available online: https://gs.statcounter.com/platform-market-share/desktop-mobile-tablet (accessed on 14 April 2021).
- Merchant Savvy. Global Mobile eCommerce Statistics, Data & Charts. 2020. Available online: https://www.merchantsavvy.co.uk/mobile-ecommerce-statistics/ (accessed on 14 April 2021).
- Bouchrika, I. Mobile vs. Desktop Usage Statistics for 2020/2021. 2021. Available online: https://www.guide2research.com/research/mobile-vs-desktop-usage (accessed on 14 April 2021).
- Bonnie, E. The Mobile Growth Statistics You Need to Know. 2019. Available online: https://clevertap.com/blog/mobile-growth-statistics/ (accessed on 14 April 2021).
- Mobile Marketing. Mobile App Engagement Rates Soar under Lockdown: Report. 2020. Available online: https://mobilemarketingmagazine.com/mobile-app-engagement-rates-soar-under-lockdown-report (accessed on 14 April 2021).
- Fitz-Gibbon, C. BERA Dialogues: Performance indicators; Multilingual Matters LTD: Philadelphia, PA, USA, 1990. [Google Scholar]
- McFadden, C. Optimizing the Online Business Channel with Web Analytics. 2005. Available online: https://www.slideshare.net/cmcfadden/optimizing-the-online-business-channel-with-web-analytics (accessed on 8 May 2021).
- Saura, J.R.; Palos-Sánchez, P.; Suárez, L.M.C. Understanding the Digital Marketing Environment with KPIs and Web Analytics. Fut. Int. 2017, 9, 76. [Google Scholar] [CrossRef]
- Narang, P. 25 Important Digital Marketing Metrics for Measuring Success in 2021. 2020. Available online: https://www.henryharvin.com/blog/digital-marketing-metrics (accessed on 8 April 2021).
- Prakharevich, A. 9 Essential Metrics to Watch When Doing SEO. 2020. Available online: https://www.link-assistant.com/news/seo-metrics-guide.html (accessed on 9 April 2021).
- McEwen, M. Top 8 Key Performance Indicators to Track on Your Website. 2017. Available online: https://smallbusinessforum.co/top-8-key-performance-indicators-to-track-on-your-website-d574b147c41 (accessed on 9 April 2021).
- Akyildirim, N.A. Common Website KPIs. 2020. Available online: https://medium.com/@anilak1978_94291/common-website-kpis-644e3771850e (accessed on 9 April 2021).
- Salmeron, J.L. Supporting Decision Makers with Fuzzy Cognitive Maps. Res. Technol. Manag. 2015, 52. [Google Scholar] [CrossRef]
- Giabbanelli, P.J.; Gray, S.A.; Aminpour, P. Combining fuzzy cognitive maps with agent-based modelling: Frameworks and pitfalls of a powerful hybrid modelling approach to understand human-environment interactions. Environ. Model. Softw. 2017, 95, 320–325. [Google Scholar] [CrossRef]
- Skytrax. World’s Top 10 Airlines of 2019. Available online: https://www.worldairlineawards.com/worlds-top-10-airlines-2019/ (accessed on 24 April 2021).
- Cronbach, L.J. Coefficient alpha and the internal structure of tests. Psychometrika 1951, 16, 97–334. [Google Scholar] [CrossRef]
- Bartlett, M.S. A note on the multiplying factors for various chi square approximations. J. R. Stat. Soc. 1954, 16, 296–298. [Google Scholar]
- Kosko, B. Fuzzy cognitive maps. Int. J. Man-Mach. Stud. 1986, 24, 65–75. [Google Scholar] [CrossRef]
- An, L. Modeling human decisions in coupled human and natural systems: Review of agent-based models. Ecol. Model. 2012, 229, 25–36. [Google Scholar] [CrossRef]
- Davis, C.W.H.; Giabbanelli, P.J.; Jetter, A.J. The Intersection of Agent Based Models and Fuzzy Cognitive Maps: A Review of an Emerging Hybrid Modeling Practice. In Proceedings of the 2019 Winter Simulation Conference (WSC), National Harbor, MD, USA, 8–11 December 2019; pp. 1292–1303. [Google Scholar]
- Consul, P.C.; Jain, G.C. A generalization of the Poisson distribution. Technometrics 1973, 15, 791–799. [Google Scholar] [CrossRef]
- Mourelatos, E.; Frarakis, N.; Tzagarakis, M. A Study on the Evolution of Crowdsourcing Websites. Eur. J. Soc. Sci. Educ. Res. 2017, 4, 29–40. [Google Scholar] [CrossRef][Green Version]
- Fabio, R.A.; Gullà, J.; Errante, A. Emotions and eye movements: Eye tracker and mnestic parameters. In Memory Consolidation; Sakakibara, M., Ito, E., Eds.; Nova Science: New York, NY, USA, 2015; pp. 235–258. [Google Scholar]
- Zamani, H.; Abas, A.; Amin, M.K.M. Eye tracking application on emotion analysis for marketing strategy. J. Telecommun. Electron. Comput. Eng. 2016, 8, 87–91. [Google Scholar]
- Simon, C.J.; Sullivan, M.W. The measurement and determinants of brand equity: A financial approach. Market. Sci. 1993, 12, 28–52. [Google Scholar] [CrossRef]
- Bekavac, I.; Praničević, D.G. Web analytics tools and web metrics tools: An overview and comparative analysis. Croat. Oper. Res. Rev. 2015, 6, 373–386. [Google Scholar] [CrossRef][Green Version]
- Homburg, C.; Jozić, D.; Kuehnl, C. Customer experience management: Toward implementing an evolving marketing concept. J. Acad. Mark. Sci. 2017, 45, 377–401. [Google Scholar] [CrossRef]
- Liu, Y.; Li, H.; Hu, F. Website attributes in urging online impulse purchase: An empirical investigation on consumer perceptions. Dec. Support Syst. 2013, 55, 829–837. [Google Scholar] [CrossRef]
- Zheng, X.; Men, J.; Yang, F.; Gong, X. Understanding impulse buying in mobile commerce: An investigation into hedonic and utilitarian browsing. Int. J. Inf. Manag. 2019, 48, 151–160. [Google Scholar] [CrossRef]
- Machač, M. Google Upřednostňuje Mobilní Weby v Serp. Je váš Web Připraven? 2015. Available online: https://www.interval.cz/clanky/googleuprednostnuje-mobilni-weby-v-serp/ (accesed on 20 April 2021).
- Sakas, D.P.; Giannakopoulos, N.T. Harvesting Crowdsourcing Platforms’ Traffic in Favour of Air Forwarders’ Brand Name and Sustainability. Sustainability 2021, 13, 8222. [Google Scholar] [CrossRef]
- Järvinen, J.; Karjaluoto, H. The use of Web analytics for digital marketing performance measurement. Ind. Market. Manag. 2015, 50, 117–127. [Google Scholar] [CrossRef]
- Glantz, S.A.; Slinker, B.K. Primer of Applied Regression and Analysis of Variance; McGraw-Hill: New York, NY, USA, 1990. [Google Scholar]
- Strout, A. Mobile vs. desktop: Are You Optimizing Both Experiences? 2016. Available online: https://marketingland.com/mobile-vs-desktop-optimizing-experiences-175380 (accessed on 15 April 2021).
Publisher’s Note: MDPI stays neutral with regard to jurisdictional claims in published maps and institutional affiliations. |
© 2021 by the authors. Licensee MDPI, Basel, Switzerland. This article is an open access article distributed under the terms and conditions of the Creative Commons Attribution (CC BY) license (https://creativecommons.org/licenses/by/4.0/).