1. Introduction
Over the last 10 years, big data analytics has been called “the oil” for optimizing the digital ecosystem and, subsequently, the World Wide Web sphere. Untamed big data with enormous volume and velocity are generated regarding the interactions of users with search engines and websites and how they respectively react to the search results and the content they receive. Search engines, search results, and websites express a cause-and-effect relationship under their main purpose of existence. This purpose is related to the provision of the highest volume of information, in the best time, with the most precise results, according to the users’ search terms.
In the context of the Big Data era, search engine optimization (SEO) plays a crucial role in the potential dissemination of personalized content that reflects quality. This quality is related to the curation of content and proper usability in the Web-based systems in order to cover users’ information needs. SEO’s main purpose is related to the provision of strategic steps to Web developers and content creators to optimize websites for higher rankings in search results and, hence, greater organic traffic that comes from search engines.
Nevertheless, despite the large volume of datasets and analytics that are produced and related to website performance and users’ behavior inside them, the research field for utilizing big data analytics for strategic SEO schemas still remains in infancy. Several reasons are related with this research gap, such as symptoms of data overloading and, hence, difficulties in preprocessing, analysis, visualization, and interpretation of the outcomes. Subsequently, another drawback is related with the reduced managerial capabilities to understand the intercorrelations between the semantic Web analytics metrics and how they are aligned to SEO purposes. Another difficult point is the absence of methodological mechanisms that articulate validity, reliability, and consistency regarding the variables that are taken into consideration, with the purpose to optimize visibility of websites. Against this backdrop, this paper presents a novel methodological approach for utilizing big data analytics related to website performance and how they contribute to the SEO goal, which is an increase in organic search engine traffic percentage. We implement this methodology in the cultural heritage domain.
Cultural heritage institutions (CHIs) and their content in both the physical and digital worlds represent the social desire to preserve and cross-link the legacy of former generations in today’s world, reflecting the ancestral identity of each society. Cultural institutions such as museums, galleries, libraries, and archives support the democratization of cultural heritage. They shape and reinforce the cultural and educational background of the people, while their mission is to combine the fragmented pieces of history depending on the society they belong to and serve. The information communication technologies and the Web expand the opportunities for cultural institutions to attract more stakeholders, both in physical and in online environments. This fact strengthens their scope for providing cultural knowledge to interested parties, global, national, and local communities, educating them in a quite attractive way through websites [
1]. This involves a shift from traditional approaches of
keep and protect to
experience and engage in the era of digital humanities [
2,
3,
4].
From a managerial perspective, the purpose of websites is to improve awareness, increase interest about artifacts, and holistically enhance the online visibility and findability of cultural collections. However, the nature of cultural heritage websites means that they deal with massive amounts of datasets, such as a high volume of internal webpages, links, images, and depth in user exploration and experience. This raises difficulties for managers to handle large-scale collections, increasing uncertainty about the level of visibility that cultural websites have on the Web. In this respect, it is a necessity to propose a SEO framework that utilizes generated big data analytics about CHI websites and their performance. In this way, the decision-makers in CHIs will benefit from a well-informed toolbox supportive of efforts to increase cultural content visibility on the Web.
To this end, this study unfolds in four parts. Firstly, we describe in a detailed manner the SEO factors that we assume impact the organic search engine visit percentage. After that, the methodology unfolds in three different stages. First, we summarize and validate the extracted big data analytics. Subsequently, we proceed into the development of diagnostic exploratory models that estimate the cause-and-effect relationships between the proposed factors. In the third stage of the methodology, we describe the initial steps for predictive model development and simulation for optimizing organic search engine traffic. The paper continues with the presentation and interpretation of results. Lastly, the discussion and conclusions are presented, suggesting practical managerial implications for the optimization of CHI websites in terms of performance, visibility, and findability on the Web.
2. The Nature of Cultural Heritage Websites
According to Wilson [
5], in every cultural heritage institution (CHI), the first main purpose is the management of the cultural material they contain. The second purpose is to make that material accessible to everyone who wants to see it. Indeed, even from prior studies at the infancy phase of the Web, up to recent approaches, CHIs have utilized the opportunities of Web presence via websites in order to expand the visibility and accessibility of their cultural heritage content [
2,
3,
6,
7,
8]. Websites under the paternity of CHIs constitute a vital online channel that improves awareness and expands capacities for visitation [
7]. At the same time, it gives the advantage of presenting cultural information that is able to exceed by far that available at the physical place. Subsequently, research efforts by Voorbij [
9] and Marty [
10] demonstrated that the user experience across websites leads to better-prepared visitors and also to enhanced post-visit experience in terms of the meaning and interpretation they attribute to cultural collections.
However, the utilization of websites for CHIs with the purpose to optimize the visibility of their artifacts on the Web is not a straightforward and easy road. The CHI websites are constituted by massive amounts of datasets related to architectural aspects, such as the high number of webpages they contain, hundreds of images, thousands of internal and external interlinks, and so on. In this respect, prior efforts noted that the growth trend of digitizing artifacts is not sufficient or organized for the accurate retrieval of cultural information in large-scale Web-based collections. More specifically, this challenges visitors to face (a) overloading symptoms of the provided cultural heritage information [
11] and/or (b) lack of cultural information due to low level of findability and visibility [
12,
13].
The two issues referred to above reflect the scarcity of an effective SEO approach that could be measured in a quantifying way to increase the accuracy of information retrieval from CHI websites. This statement has also been supported by a recent report by Krstic and Maslikovic. [
2]. They showed that only one-third of their examined cultural institutions confirmed the utilization of analytics platforms for the evaluation and optimization of user experience during content search and navigation through digital collections. This kind of evaluation, intended to reinforce content that suffers from low levels of findability and visibility, becomes even more complex as CHI websites are characterized by the massive sizes of their content.
2.1. The Size of Cultural Heritage Websites
The size of cultural heritage websites can be set under the context of the Vs of big data. They contain a massive volume of cultural information integrated into unique webpages, images, and hyperlinks. At the same time, a huge number of visitors engage with the content, generating almost real-time behavioral datasets with high velocity. In terms of variety, different kinds of datasets from different smart devices are produced. This kind of data variety is related to web analytics metrics of interaction with the cultural content. Other kinds are related to unstructured datasets, such as images uploaded on social networks and text from reviews, as regards visitor opinion about cultural artifacts and their online representation [
14]. Regarding the value of the produced big cultural analytics data, this is mostly related to the key point indicators that cultural institutions determine for their growth over time. For instance, the behavioral datasets generated from visitor engagement with the e-shop of the museum indicate economic value from data utilization. Similarly, the utilization of the generated datasets regarding the performance of CHI websites and their level of visibility in search engines point out societal and educational value. That is, the higher the visibility and findability, the greater the possibilities for passing on cultural heritage information to stakeholders for the improvement of their educational level.
Regardless of the type of organization, the larger it is, the greater the possibilities to utilize web data analytics strategies for potential evaluation and enhancement of its online presence [
15]. However, big data analytics bring big troubles. It should be noted that the existence of a website with massive content and, thus, high volume of data production does not necessarily mean increased availability of suggestions and solutions for strategic SEO planning.
In the Big Data era, the latter assumption signals a contradictory element against prior efforts stating that “content is king” [
16,
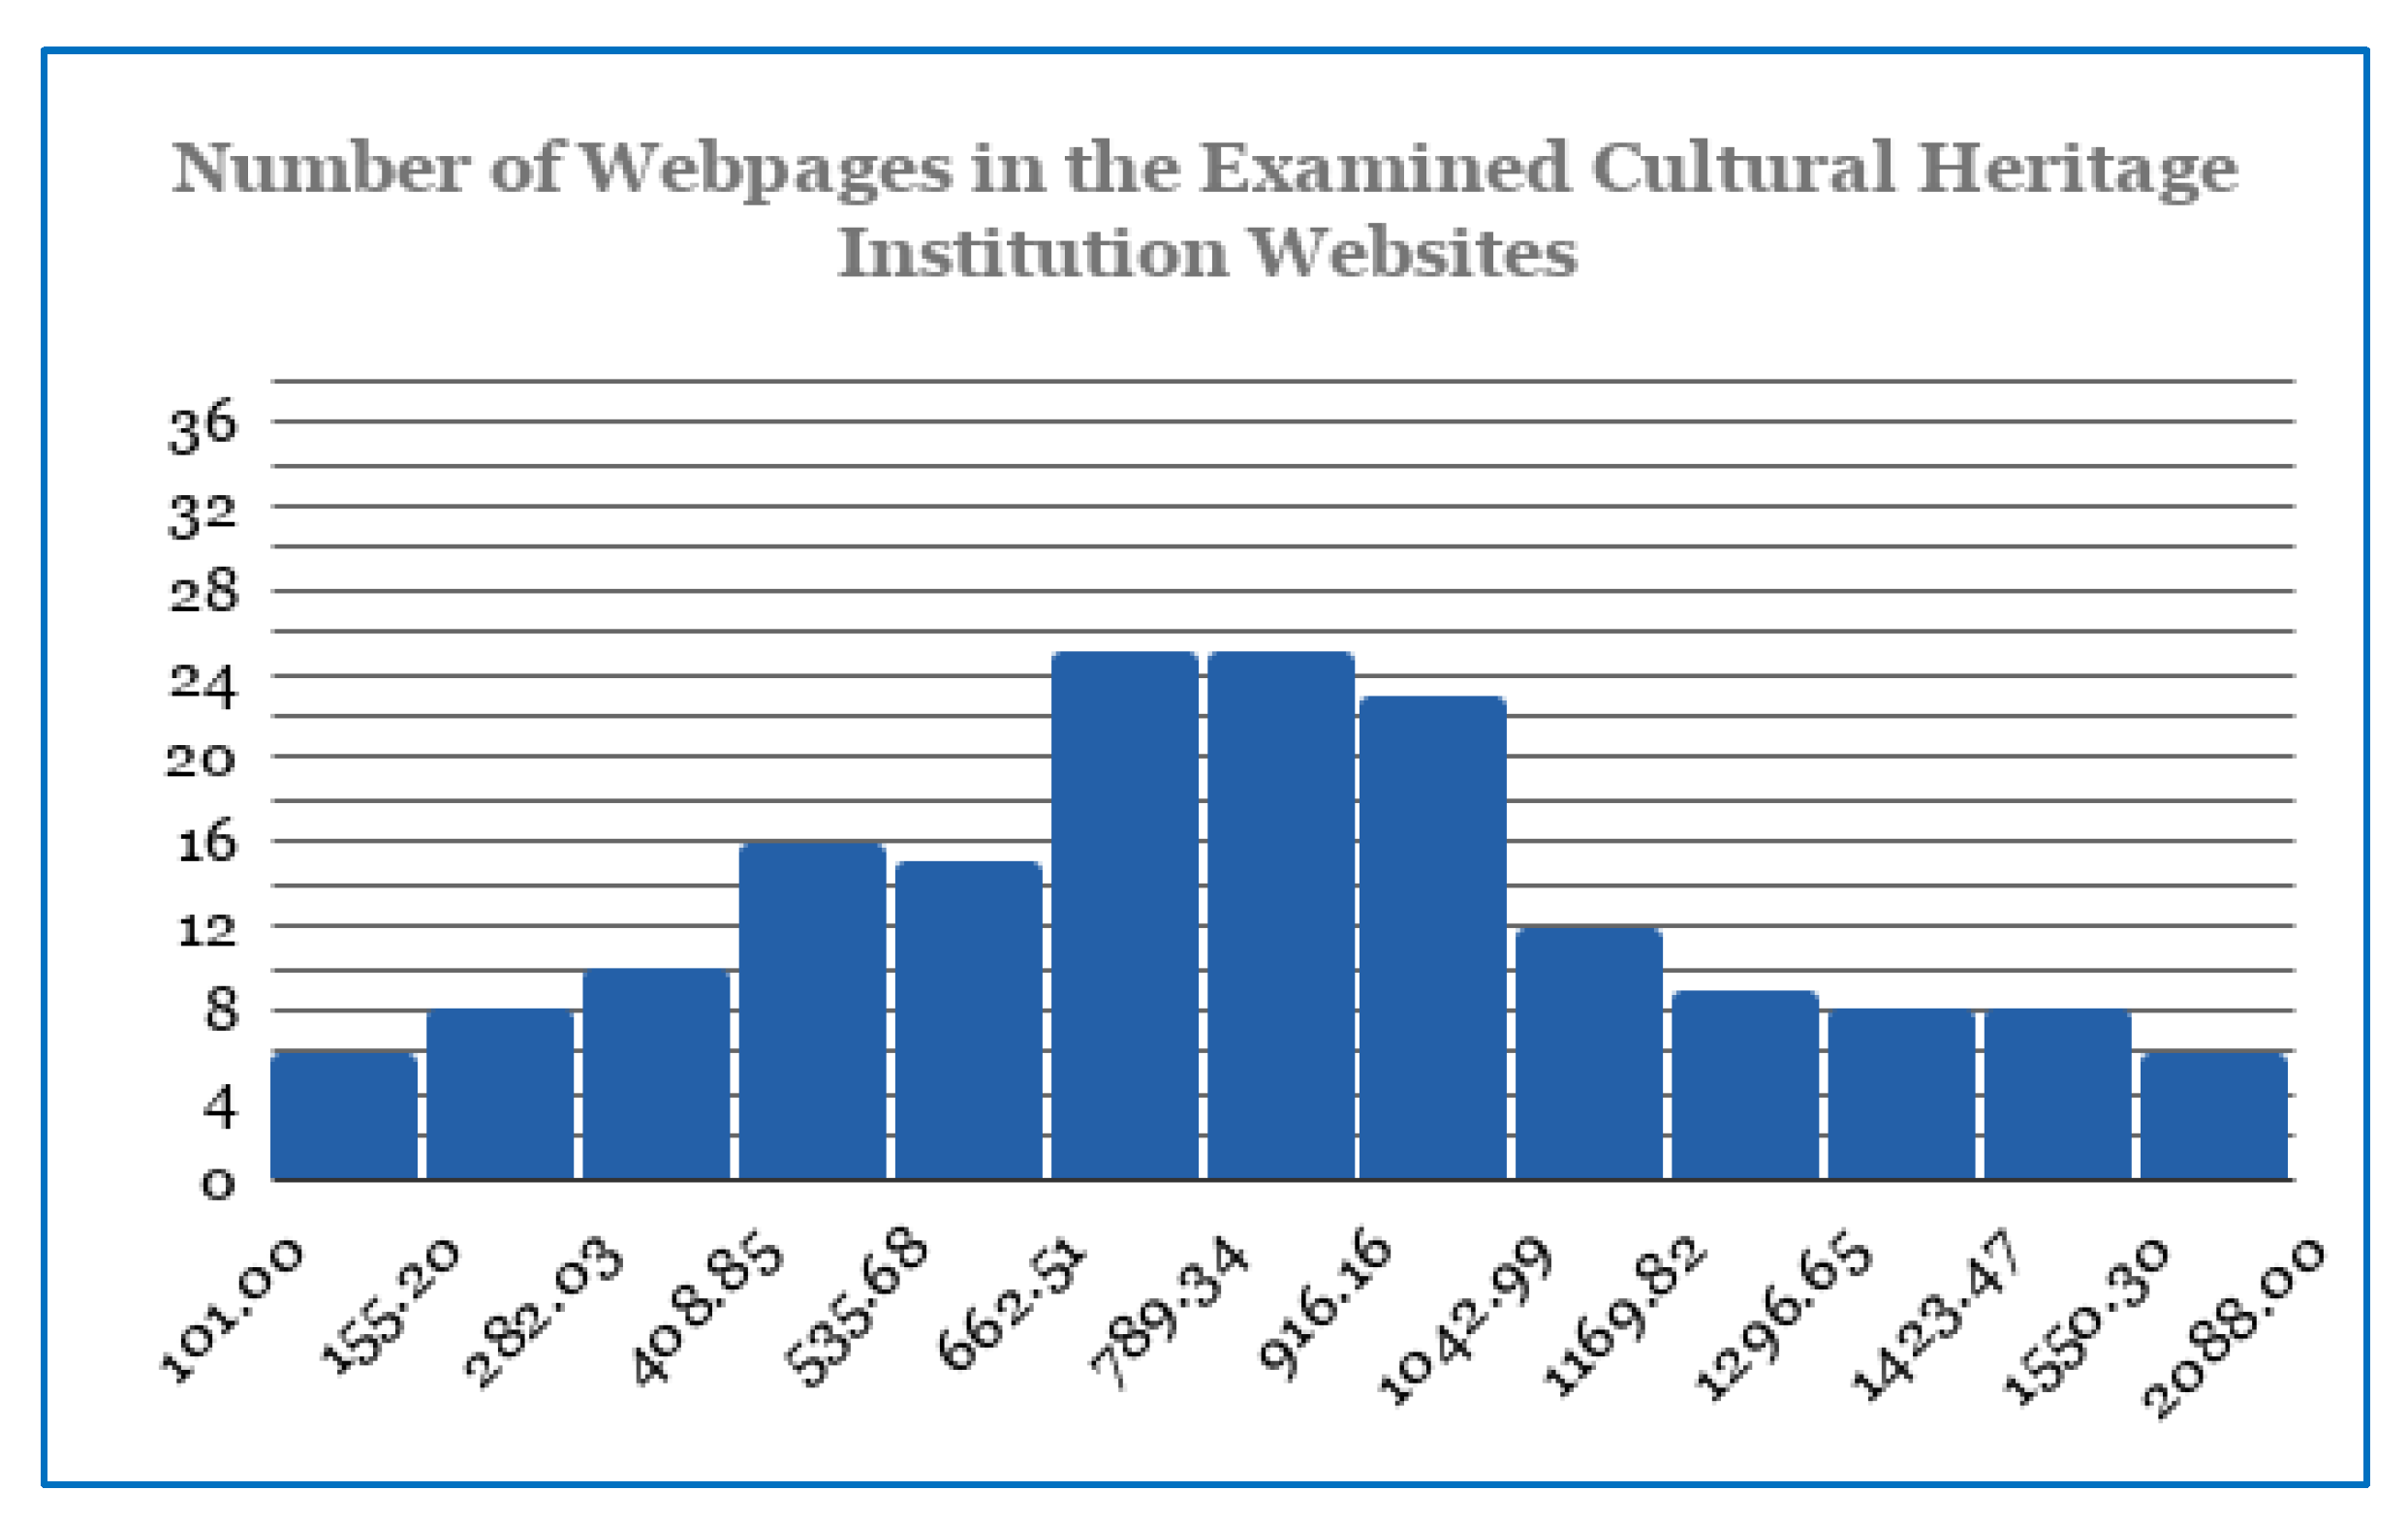
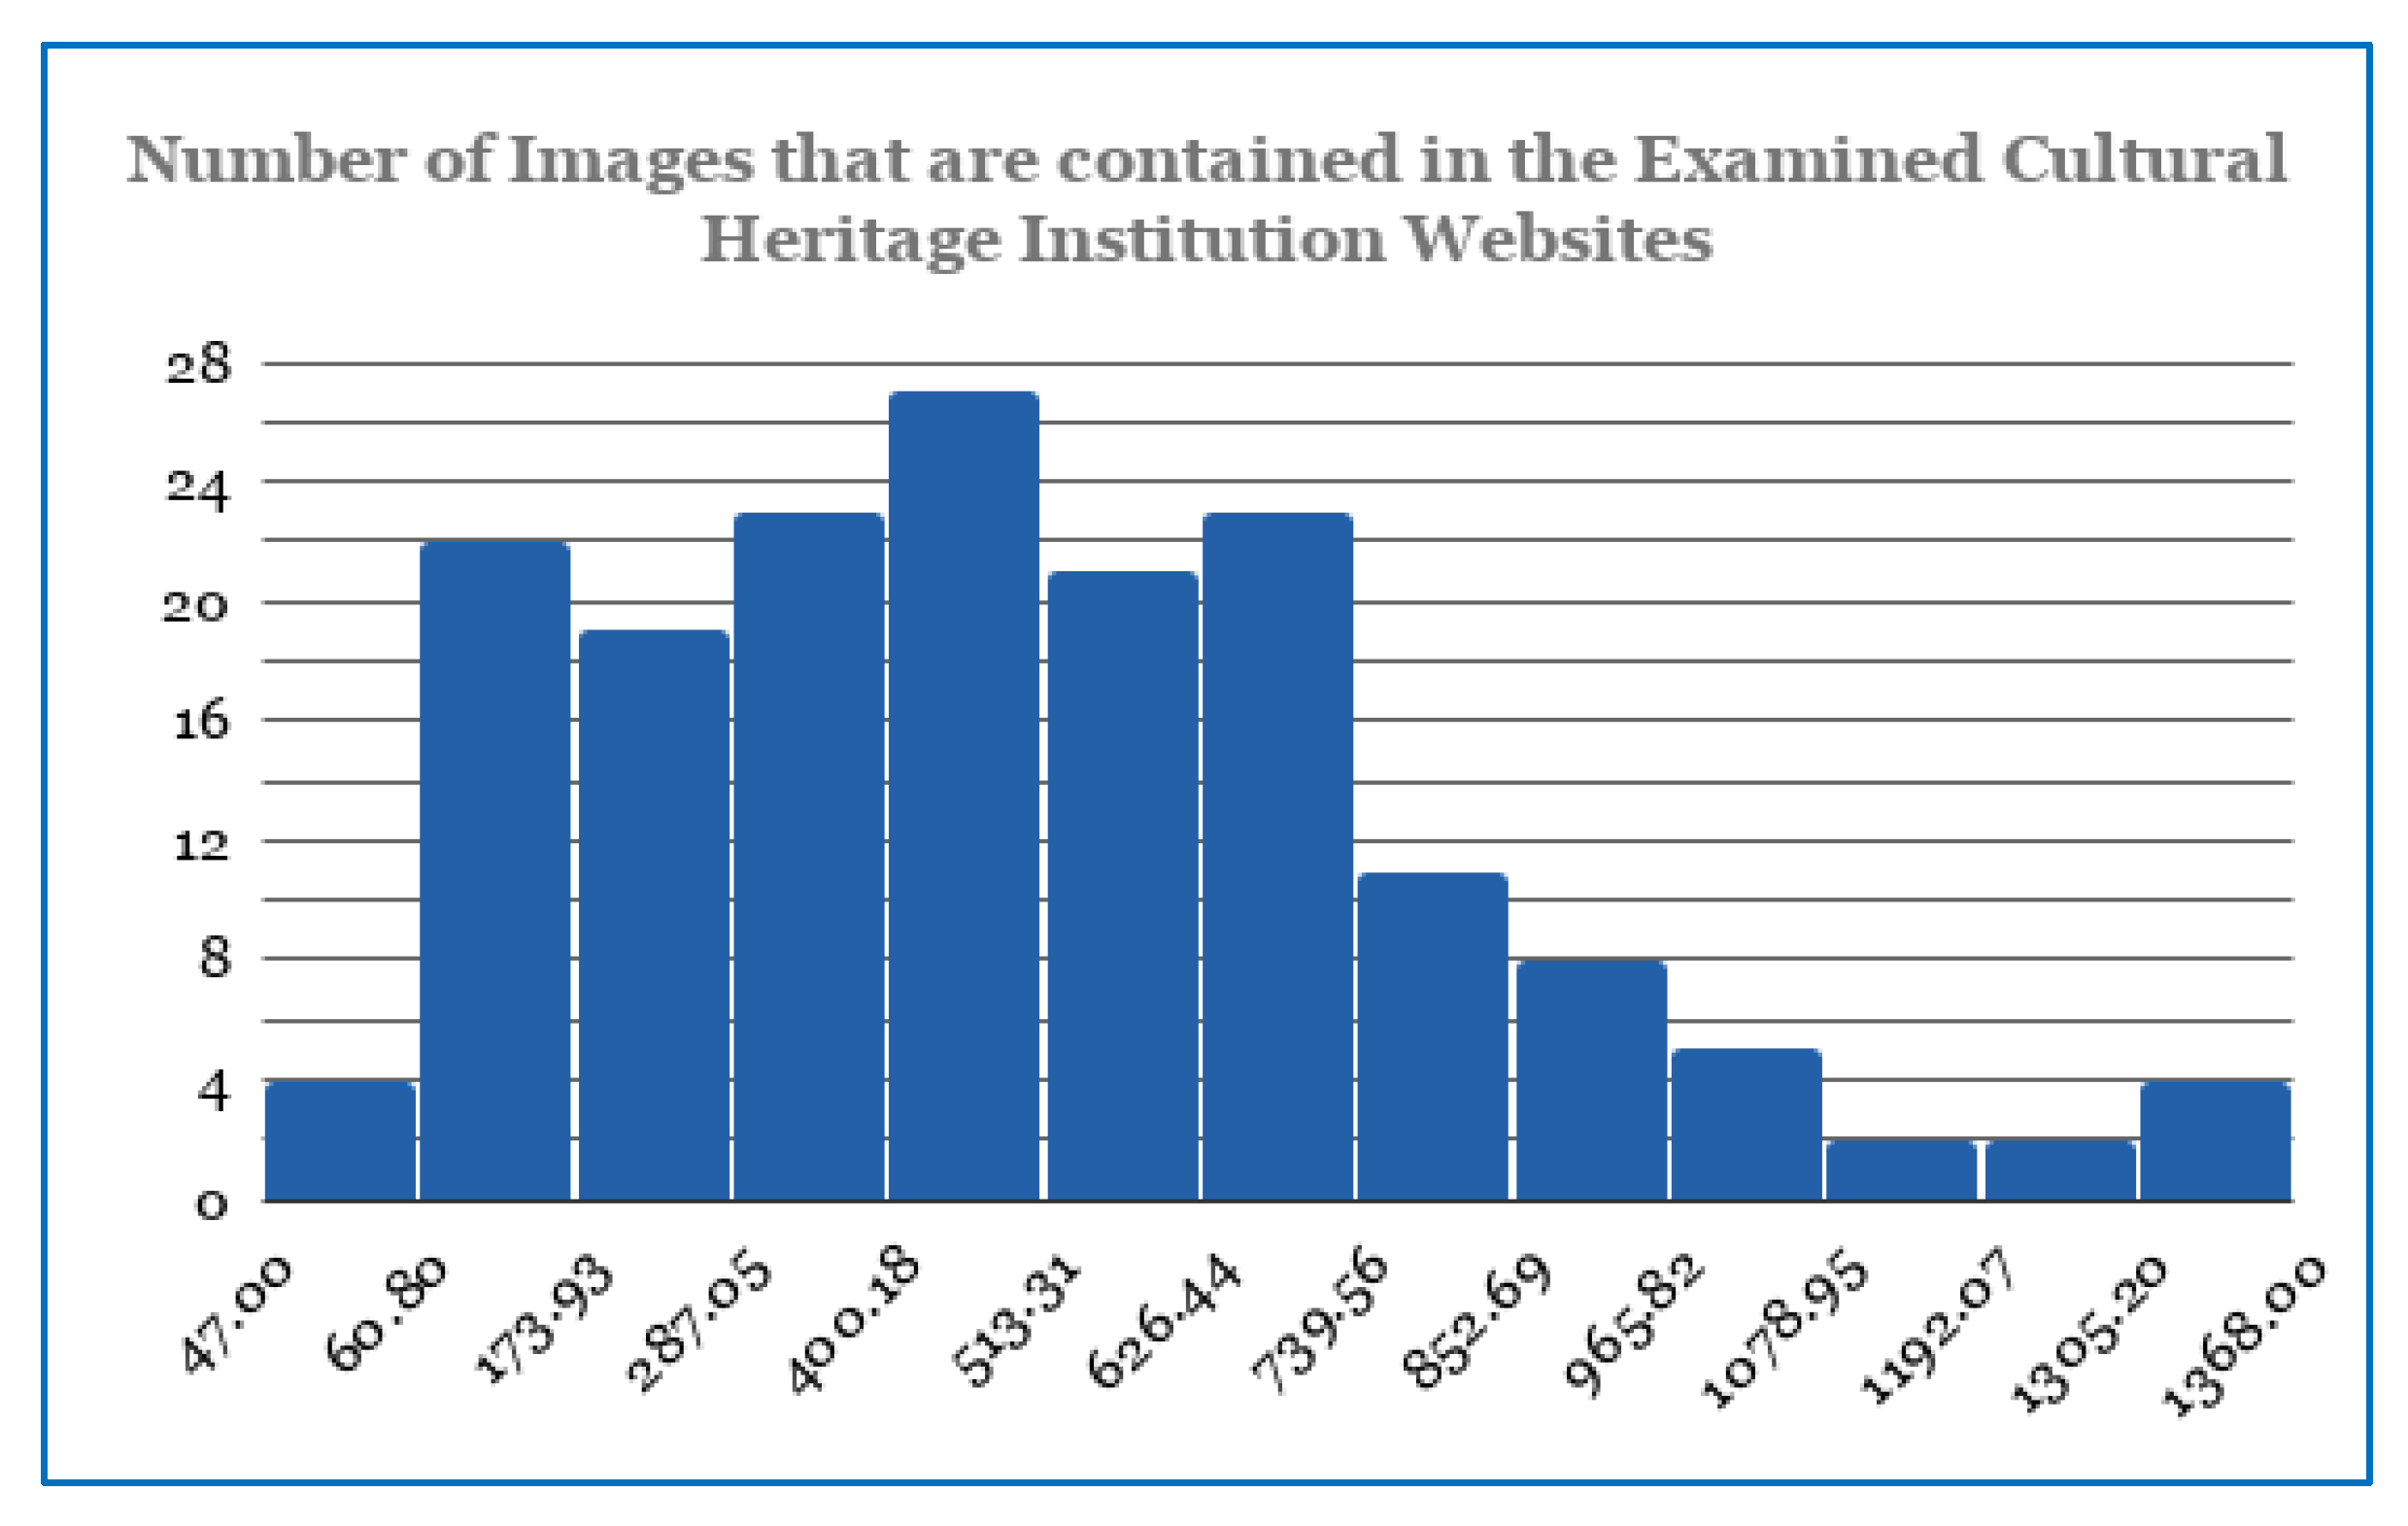
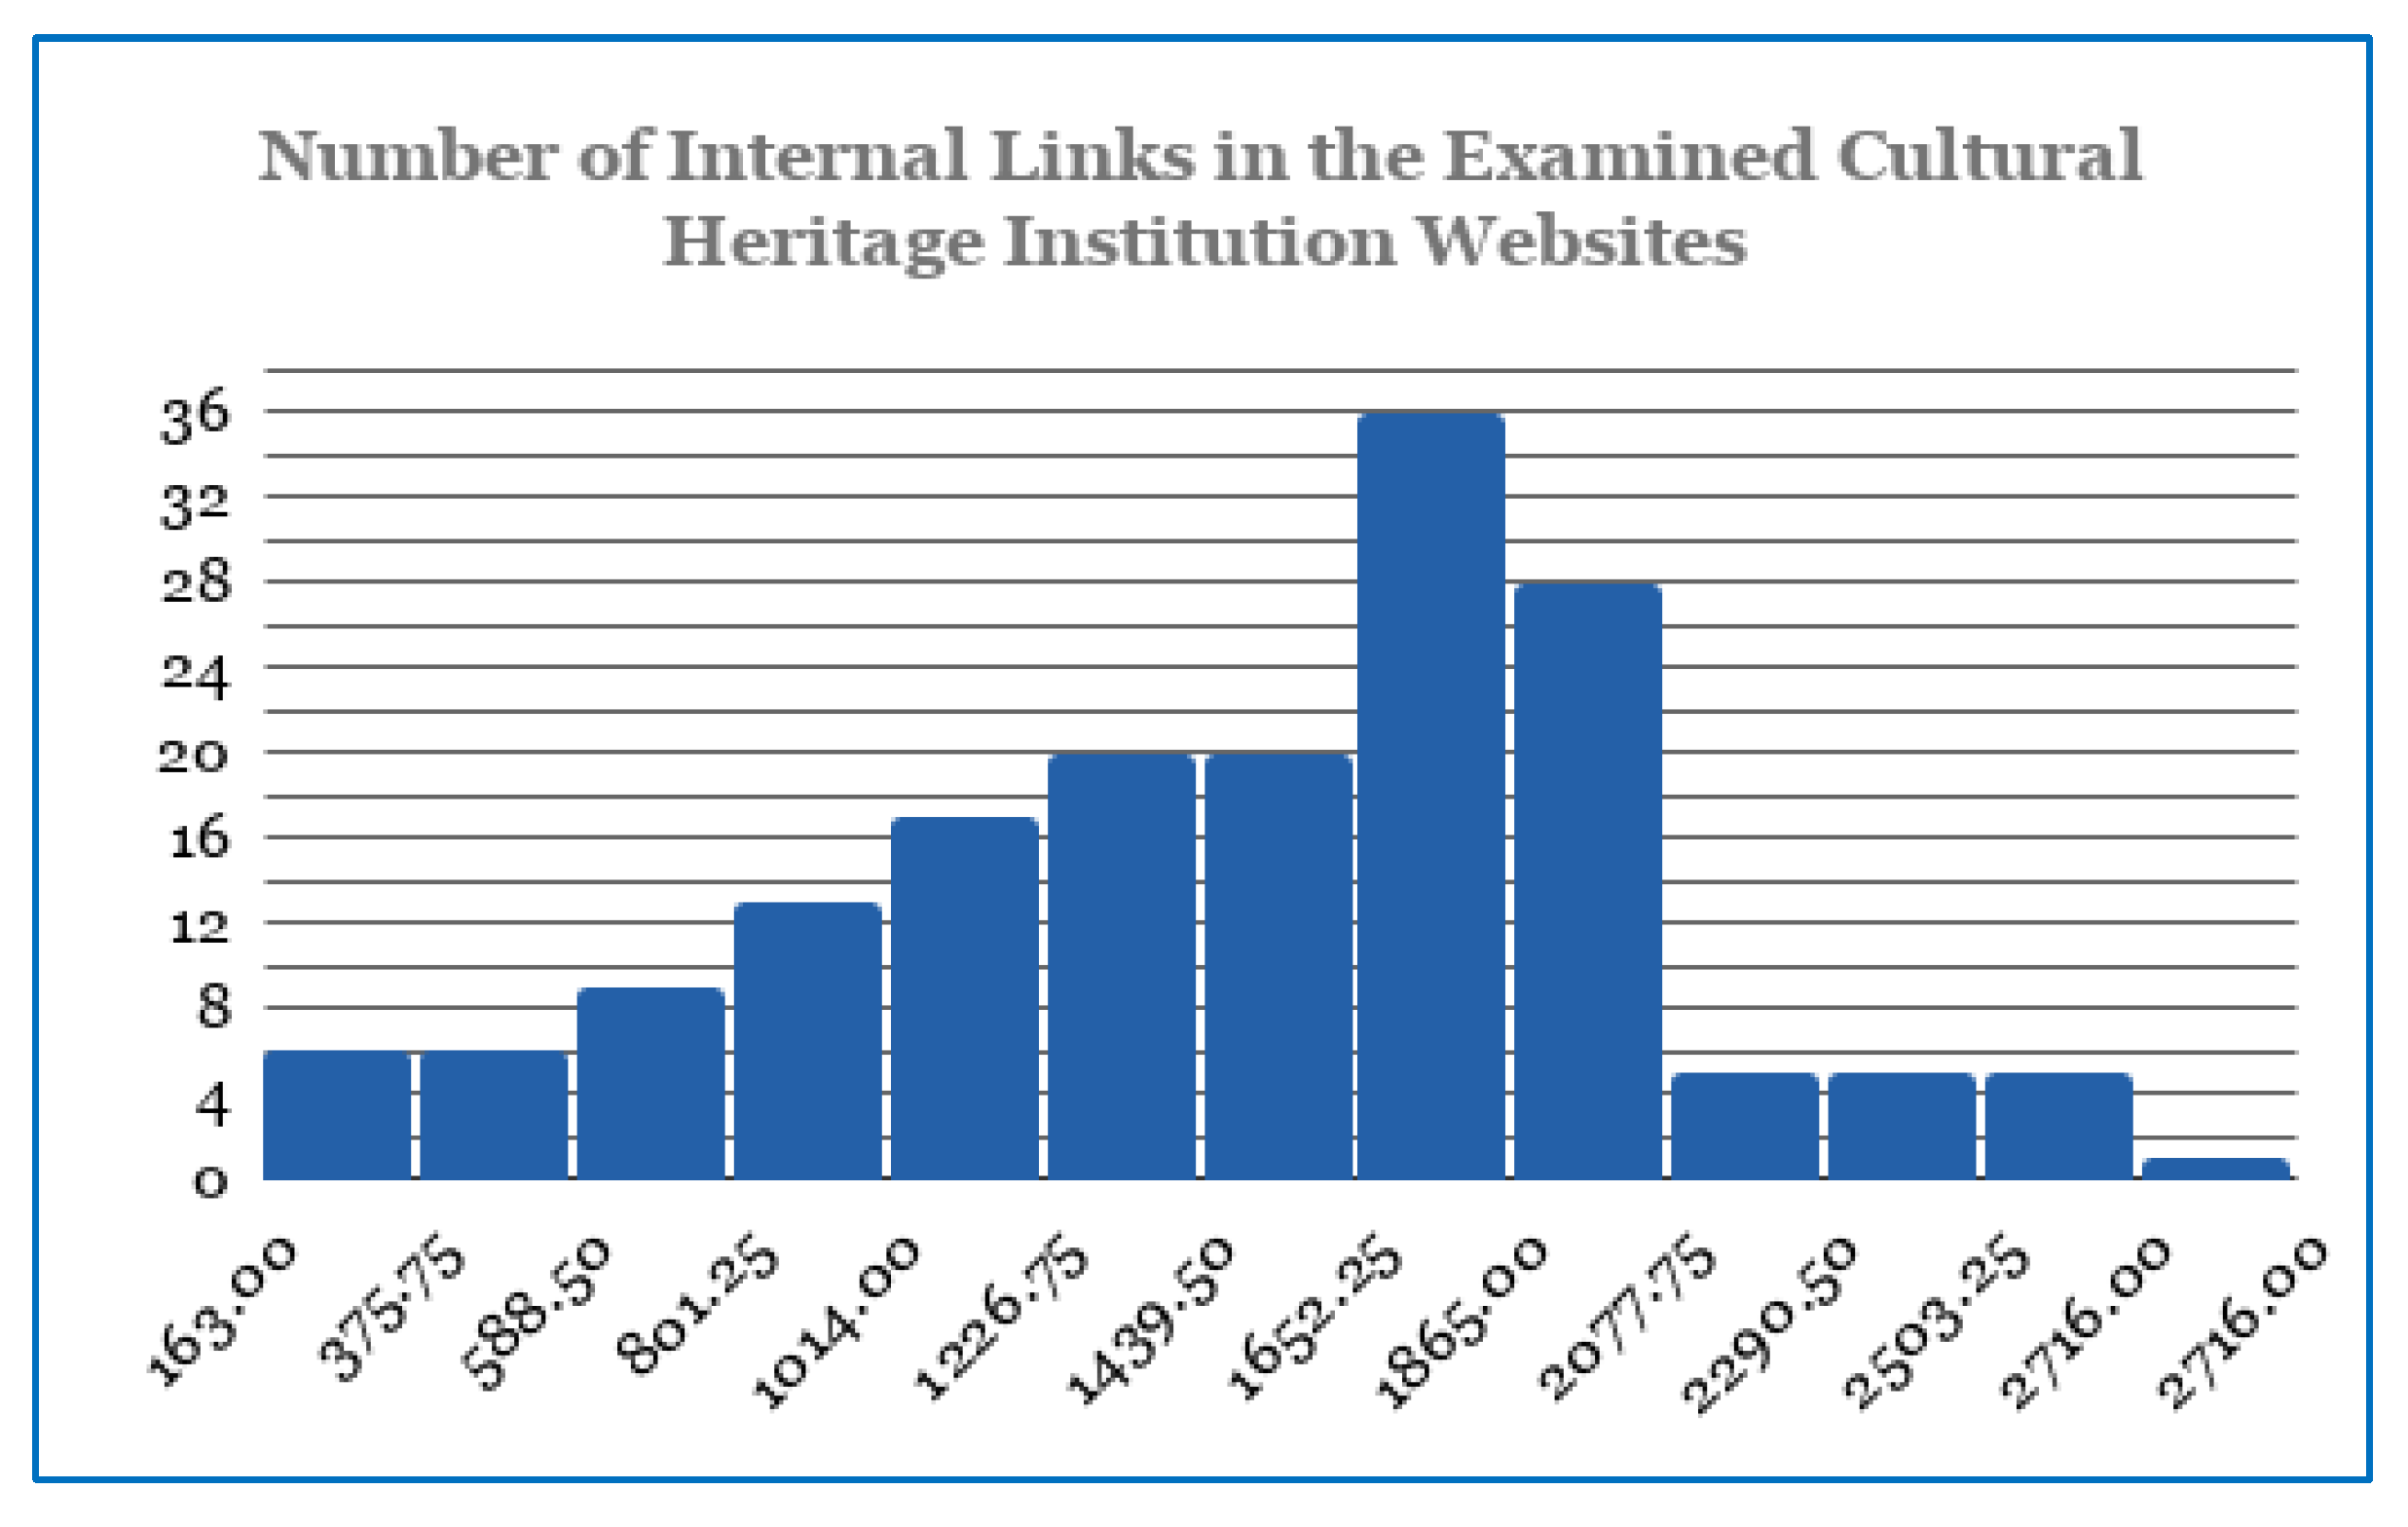
17]. Controversially, the bigger the content, the harder the manipulation and the identification of technical and behavioral factors that probably influence the website’s performance in terms of its visibility and findability in search engine result pages. In fact, it is practically more manageable to optimize a website that contains up to 100 webpages, rather than a website with thousands of webpages, images, and, hence, complexity in link architecture. Preliminary findings of our research indicate that CHI websites are characterized by massive size in terms of webpages, links, and images (
Table 1 and
Figure 1,
Figure 2,
Figure 3 and
Figure 4).
However, although prior studies have shown that the implementation of SEO strategies returns higher rankings and possibly better organic traffic [
16,
18,
19], it remains unclear whether the size of the website affects the organic search traffic percentage, that is, the bigger the content of the website in terms of webpages, images, internal, and external links, the greater the percentage of organic search engine traffic. This implication led us to develop the first hypothesis:
Hypothesis (H1). The size of cultural heritage institutional websites impacts the percentage increase of organic search engine traffic that they receive.
The first hypothesis and the implication that the size of a website leads to higher or lower organic search engine traffic raises a new research question. This is related with SEO technical compatibility factors, whether CHI websites follow them, and to what extent. There are prior approaches indicating that Google employs more than 250 closely guarded secret factors in its ranking algorithm [
18,
20]. However, quite a few studies [
16,
18,
19,
21,
22] have investigated only some of them. This fact is probably linked to the until-that-time managerial inability of the retrieval of large-scale datasets regarding technical and behavioral factors that influence organic search engine traffic percentage.
Against this backdrop, big data analytics offers new opportunities in strategic SEO planning and deployment. The data gathered through application program interface (API) integration and preprocessing, result in a plurality of technical and behavioral SEO variables that probably impact the percentage variance in the organic search engine traffic of CHI websites. Based on principal component analysis, we divided these technical and behavioral variables into four additional factors: SEO Crawling, Website Loading Speed, Website Security Condition, and User Behavior.
2.2. SEO Crawling
Even from the initial approaches to identify SEO technical factors and make them comprehensible [
23,
24] up to the latest research implications [
25,
26,
27], there are multiple de facto variables that are taken into consideration and impact the search engine rankings. These variables are related to the existence of Page Title tags [
2,
16,
19,
24,
25], Meta-Descriptions [
25,
26,
27,
28], or Headings [
2,
23,
28]. Others concentrate on aspects related to Technical Curation of Content. These are the Alt-tags on images, the prevention of duplicated page content, its re-use and repeatability, and a proper mobile scaling setup for better friendliness and adaptiveness to mobile devices [
2,
26,
27].
Other SEO crawling variables focus on URL Diligence and their appropriate structure [
25,
28,
29]. Link Condition, such as avoiding broken pages or setting 404 error pages for redirections [
26,
28], is another aspect. The Code Validity and how friendly it is to the crawlers and their indexing process is another key component. This factor investigates the availability of specific back-end files that make the crawling process more efficient, including robots.txt integration, sitemap locations, and appropriate hypertext markup language (HTML), JavaScript, and cascading style sheets (CSS) architecture [
26,
30,
31,
32]. These prior research efforts have demonstrated the optimization of search ranking positions.
Nevertheless, it is not yet clear whether the aforementioned factors correspond (and to what extent) to the optimization of organic search engine percent of traffic, that is, the higher the SEO technical compatibility of the websites with these variables, the higher the percentage of organic search engine traffic. Therefore, our second hypothesis is the following:
Hypothesis (H2). The SEO Crawling factor impacts the percentage increase of organic search engine traffic in the websites of cultural heritage institutions.
2.3. Website Loading Speed
According to Google [
33], when a website improves its loading time, visitors become more engaged and their interaction with the content is increased. The number of clicks is increased and more conversions come, including sign-up forms, or purchasing products. Controversially, low loading speed could lead to reduced user–content interaction. For instance, the BBC News found that they lost up to 10% of their visitors for every additional second that their website took to load up their content [
34]. On the other hand, the COOK case study as a growing business in food industry showed that, after reducing the average loading time of their website by 850 milliseconds, conversions increased by up to 7%, pages per session increased by up to 10%, and the bounce rate decreased down to 7% [
33]. Indeed, slow loading speed returns almost immediate abandonments from websites, leading users to jump to other ones with better loading speed performance.
Prior studies paid attention to some key technical issues that have significant effects on website loading speed and, therefore, on a pleasant or unpleasant navigational experience for users [
2,
32]. Enge and colleagues indicated the negative impact on user experience as being the longer the loading time, the shorter the visit duration and, hence, the higher the bounce rate. The key technical issues are related mostly with the compression and minification of JavaScript and CSS files and the proper architecture of link redirections inside and outside the websites [
22,
26,
29,
35,
36,
37]. Therefore, it should be examined whether the compatibility of a website with loading speed time variables is associated with an enhanced organic search engine percent of traffic. That is, the higher the percentage rates of the Website Loading Speed factor, the higher the percentage increase of organic search engine traffic. Thus, our third hypothesis unfolded as follows:
Hypothesis (H3). The Website Loading Speed factor impacts the percentage increase of organic search engine traffic in the websites of cultural heritage institutions.
2.4. Website Security Condition
Browsers such as Chrome or Mozilla encourage web developers to follow both fundamental and advanced security policies in their websites [
38,
39]. In more than a few cases, cultural heritage institutions contain online shops inside their websites. This fact demands the establishment of security technologies that foster visitor convenience to explore and buy products. In addition, visitors interact with the online cultural information and sometimes submit their personal information for further services and/or potential news and updates. From a managerial point of view, the compatibility of CHI websites with security factors ensures the reputation of the cultural organizations and prevents malware and cyberattacks that will inevitably cost economic resources for rectification and recovery.
A fundamental aspect regarding the security condition of a website is related to the existence of Hypertext Transfer Protocol Secure (HTTPS) and password and contact forms secured with reCaptcha. Other website security factors are related with the hiding of server version data, avoiding in this way the indication of what software is running on the Web server. Moreover, the use of clickjack and content sniffing protection and the settlement of Multipurpose Internet Mail Extensions (MIME) to help browsers prevent content sniffing exploits are other vital factors in terms of website security condition [
39].
The practical community, such as the Open Web Application Security Project (OWASP), suggests that the aforementioned variables need to be taken into serious consideration for protecting not only websites, but also cloud-based software applications [
40,
41]. Nevertheless, to the best of our knowledge, there is no prior clear substantiation as to whether the website security condition impacts (and to what extent) the organic search engine percent of traffic. Apparently, there are some indications about the importance of security factors in the SEO context [
22,
35]. However, little is known as regards the impact of security factors on the percentage increase of organic search engine traffic. In this respect, our fourth hypothesis is the following:
Hypothesis (H4). The Website Security Condition factor impacts the percentage increase of Organic Search Engine Traffic in the websites of cultural heritage institutions.
2.5. User Behavior
In 2012, Agarwal and colleagues introduced a semantic schema for potential personalization of content to future users based on the behavior and interactions of prior users [
42]. More specifically, they proposed that the higher the engagement with the content in terms of time of interaction and depth of exploration, the greater the content for provision to potential users. Three years later, Mavridis and Symeonidis [
20] argued that search engines try to capture user interactions inside websites in order to provide feedback and optimize ranking algorithms. In the Big Data era, a necessity arises regarding the transformation of behavioral data into semantic schemas aiming at greater personalization and optimization of the World Wide Web by the people, for the people. Indeed, analytics platforms such as Google Analytics transform behavioral patterns into semantic web analytics metrics for better visualization and clear comprehension of the total user experience inside the websites.
These Web analytics metrics were previously mentioned in prior research, including Pages per Visit [
19,
29,
32], Visit Duration [
32,
35,
42], Total Clicks in a specified time period, and percent of immediate abandonment of the websites through the Bounce Rate metric [
2,
26,
34,
42]. All the aforementioned prior studies significantly designated these behavioral metrics as variables that numerically evaluate the interaction and experience of users inside websites. However, clear results are missing to indicate whether User Behavior inside websites impacts any forthcoming increase of the organic search engine percent of visits. That is, the greater the interaction, the higher the percentage of organic search engine traffic. Consequently, our fifth and final hypothesis is the following:
Hypothesis (H5). The User Behavior factor impacts the percentage increase of organic search engine traffic in the websites of cultural heritage institutions.
In
Figure 5, we present our proposed model, depicting in this way the hypothesized relationships among the factors that probably increase the organic search engine visit percent; that is, “the higher the rates of the proposed factors, the higher the percentage of search engine visits will be”. In the next section, the methodology unfolds with the purpose to answer our research questions.
3. Methodology
The purpose of this paper is to present a novel methodology that measures and evaluates the impact of five factors, namely, the Size of Websites, SEO Crawling, Website Loading Speed, Website Security Condition, and User Behavior, on the optimization of the organic search engine percent of traffic. That is, we investigate which of these factors, and to what extent, have an impact on the number of organic visitors to CHI websites that explicitly come from search engines. In order to answer this research question, we deploy a three-stage methodology (
Figure 6) composed of the following:
The summarization, validation, and alignment of the retrieved big data analytics with the organizations’ defined key performance indicators (KPIs);
The development of diagnostic exploratory models that estimate the cause-and-effect relationships between the metrics;
The predictive model development and the process of simulation for optimization purposes.
This methodological approach is able to tackle several issues derived from big data analytics utilization for optimization purposes. The first stage reflects efforts to cover drawbacks regarding managerial difficulties to utilize big data analytics in a more efficient way, while improving their veracity for further exploration. Moreover, the first stage corresponds to the process of aligning analytics metrics with the KPIs of cultural institutions and their Web presence. For example, in this study, the KPI is the increase of organic search engine traffic percent, which is aligned with all the Web metrics that are included in the five factors and probably affect the KPI itself.
The second stage gives the advantage of understanding through a quantified framework of evaluation the performance of a Web-based system and the possible intercorrelations between metrics. This gives the advantage of focusing on the critical ones while neglecting the less important. The third stage—inherited by the two previous stages—expands the opportunities to develop data-driven predictive models and simulations in all modeling steps. These models are composed with higher levels of validity and reliability and, hence, better precision of predictions.
3.1. Summarization, Validation, and Alignment with KPIs
In the context of big data analytics utilization, one of the most common issues is the question of whether more efficient decisions require more data or better models. This assumption returns back to the phenomena of exploring and trying to find hidden valuable gems in big datasets but with unfortunately small stats. As not all datasets are created in an equal way, we argue that neither volume of data nor better models affect the decision-making processes. Controversially, we assume that the testing process of validity, reliability, cohesion, and consistency of the extracted datasets is the first and most important thing. Besides, in the systems world, the quality of the inputs (data) always affects the outputs (models).
3.1.1. Data Sample and Preprocessing
The retrieval of big data analytics was implemented through the integration and parameterization of three different APIs. The Search Console URL API was used to retrieve data about the size of CHI websites, incorporating for exploration the number of webpages, images, and internal and external links for each of the examined 171 domains. Google Arts & Culture Database [
43] was used to capture the number of websites that were investigated. An aggregated volume of 141,851 webpages, 86,788 image path files, and 254,373 internal and 97,626 external links was retrieved from all the websites.
The Checkbot API was used to encapsulate the compatibility of technical factors, namely, SEO Crawling, Website Loading Speed, and Website Security Condition. Further parameterization was applied in the API in order to explore and discover technical patterns in the HTML, JavaScript, and CSS code that were mentioned in previous research studies but not contained in the API’s initial capabilities. A scale from 0 to 100 was implemented for each one of the retrieved variables as a useful managerial approach to tackle complexity in CHI website performance measurement [
2,
32,
44,
45]. In total, 9405 unique instances were retrieved for the 55 examined variables, ranging from 0% to 100%. Additionally, we utilized the Similar Web API for the retrieval of behavioral data analytics as regards Organic Search Clicks per Month, Visit Duration, Pages per Visit, and Bounce Rate for each of the 171 CHI websites that were investigated. This kind of API was also integrated in order to gather statistics about the percentage of organic search engine traffic each website receives.
3.1.2. Validation and Reliability
Consequently, statistical analysis was implemented for validation and to ensure the reliability of the extracted variables included in each factor. This was to give a clear perception of the levels of cohesion and consistency among them. Subsequently, dimension reduction was used with principal component analysis (PCA). Preliminary test analysis was performed on the first 25 percent of all examined websites (43/171) in order to ensure that there was no kind of violation of the assumption of data normality and linearity in their nature [
46,
47]. A second meta-analysis was performed on the full dataset to further ensure its normality and linearity.
Furthermore, Kaiser–Meyer–Olkin (KMO) testing was performed with the purpose to ensure that the retrieved datasets were suitable for principal component analysis and potential categorization [
47]. The closer the value of KMO to 1, the greater the suitability of the extracted data for PCA, and vice versa. In
Table 2, the examined factors are presented with reference to the factor loading for each variable, descriptive statistics, KMO, and percent of total variance explained.
Some variables with loadings below the limit of 0.500 were dropped. These are shown with a strikethrough line. Recognizing the contribution of the statistical tests to information for decision-makers, it is noted that they are applied here with the purpose of evaluating suitability for optimizing CHI website performance and organic search engine traffic percentage.
3.2. Development of Diagnostic Exploratory Models
Linear regression was implemented for the development of diagnostic exploratory models that estimate the cause-and-effect relationship between the five factors and their impact on organic search engine percent of traffic. Through this statistical approach, decision-makers will be able to understand in a clear manner the impact of each one of the proposed factors on the total change in organic search engine traffic percentage. Moreover, it is crucial to present a practical, manageable, and comprehensible methodological framework that dynamically demonstrates the intercorrelations between the factors and the defined KPIs [
44,
45,
48]. This will also prevent the phenomenon of “
more metrics than users” indicated by a plethora of prior approaches inside web-based systems for visualizing performance [
49]. In order to achieve this, we adopted the descriptive modeling method of Fuzzy Cognitive Mapping (FCM).
FCM is used to visualize more intuitively and effectively the relationships between factors through an understandable representation of these correlations. This can be applied through the settlement of numerical weights (of +1 or −1) for each relationship of the proposed descriptive model [
50]. The ease of construction and visualization, and the ease of understanding even by non-technicians, are further advantages of adopting the FCM [
51]. In addition, the deployment of the FCM as a descriptive modeling method is characterized as a prerequisite step for the potential development of data-driven predictive models and simulations [
51].
FCM provides a macro-level view of the examined system by aggregating and articulating the causal influence amongst the included entities [
51,
52]. More specifically, FCM demonstrates the correlations among the included factors and subfactors and how each one contributes to another [
52].
This constitutes a process of feeding back to the administrators of CHI websites for them to understand in a manageable way the impact of each factor on increase or decrease in the organic search engine percent of traffic (
Figure 7). Moreover, it should be noted that ranking algorithms change over time; hence, so do the factors that should be considered to increase or decrease organic search engine traffic. In this respect, FCM imparts flexibility in adding more factors and subfactors into the existed aggregated model, without new modifications that cause holistic restructuring of the descriptive situation within the model itself.
However, it is a commonly known fact that FCM constitutes an aggregated but stable macro-level approach, while missing individual and temporal explicitness at the micro-level without expressing system dynamic changes [
53,
54,
55]. That is, in our case, each of the examined cultural heritage institution websites has its own performance over time relating to the technical factors and how users behave with the provided content. In order to predict and simulate possible optimization of the organic search engine percent of traffic while including temporal dynamic variances, agent-based modeling (ABM) is an appropriate method for predictive model development.
Figure 7 illustrates the cause-and-effect relationships between the five proposed factors and the organic search engine traffic percent through the FCM method and its development via Mental Modeler cloud-based software.
3.3. Predictive Model Development and Simulation for Optimization
For the development of a predictive model and simulation run that forecasts the optimization of organic search engine traffic percent based on the impact of each factor, we proceeded with the agent-based modeling (ABM) approach. In ABM, a system is modeled as a collection of autonomous decision-making entities—the agents—while depicting relationships between them, acting via if–then rules [
54,
56]. The adoption of ABM as a micro-level simulation modeling strategy allows decision-makers to accomplish the following:
Realize the full potential of the data that a cultural organization has about their online visitors and website performance. In our case, this gives a better perception of the utility of the extracted big data analytics about the performance of websites in terms of their Size, SEO Crawling, Loading Speed, and Security compatibilities. At the same time ABM expands the opportunities to utilize behavioral datasets about user engagement with the proposed content in order to provide them with even more personalized cultural information.
Understand the organizations—in this case, each examined CHI website—from the viewpoint of not only the services that they contain, but also activities and how users interact with the services; that is, what visitors actually do inside the cultural websites, as each visitor produces different numerical values regarding time and depth of exploration.
Exploit the flexibility that ABM gives to organizations in terms of model construction. Highlighting its practical contribution, ABM offers the opportunity for decision-makers to construct their own model. In this way, they are able to combine entities based on the prior retrieved big datasets [
56,
57] and their domain knowledge and experience in the management of cultural heritage institutions. This also provides complementary flexibility to the parameterization of the model and sustainability in the entities that it contains. Indeed, as SEO topics and ranking algorithms change rapidly, ABM is more flexible in adding new factors, rather than explaining the relationships of the new factors via structured differential equations [
54,
58].
In the next section we present the results of the study and the integration of both the descriptive and predictive models though FCM and ABM, respectively.
4. Results
As can be seen in
Table 2, most of the variables in every factor resulted in sufficient loadings. This also indicates a sufficient extent of relevance of variables in explaining the construct of each of the proposed factors. However, there were six variables that resulted in factor loadings of less than 0.500. They are depicted in the table with a strikethrough line. We decided to exclude them from the regression analysis and their involvement as independent variables in the impact that they have on the dependent variable, namely, the organic search engine visit percent. Regarding the percent of variance explained in each factor, most of them expressed considerable variability, reaching up to 55%.
Linear regression analysis returned significant indications (
Table 3). Prior preprocessing and analysis was conducted in order to exclude outliers that would possibly influence the outcomes of the prediction. We also note that no changes were observed when we used a hierarchical technique. From the results of the test, all the produced models have clear statistical significance with
p values less than 0.05. Nevertheless, there is a marginal exception in the factor of Website Loading Speed with a
p value of 0.061, greater than 0.05. In terms of R
2 values, the results depict alignment with prior studies stating that ranking algorithms involve a massive number of secret variables in the SEO context [
20,
48]. In fact, Size of Websites explained up to 30.06% of the variability of the response data around its mean; SEO Crawling, up to 17.7%; Website Loading Speed, up to 10.01%; Website Security Condition, up to 17.9%; and User Behavior, up to 29.5%.
Indeed, the more numerous the variables, the higher the model fit and, consequently, the R
2 values [
59]. In other words, we defined some variables in each factor; however, all of them require further research to investigate even more variables that play a crucial role in the increase of the organic search engine traffic percent.
In terms of the first hypothesis, a significant regression equation was found with p = 0.012 and R2 of 0.306. This means that the mean value of the organic search traffic percent is increased by 1.06% for every percentage point increase in each variable of the Size of Websites factor. For the second hypothesis, a significant regression equation was observed with p = 0.021 and R2 of 0.177. This means that the mean value of the organic search traffic percent is increased by 2.14% for every percentage point increase in the percent of the SEO Crawling factor.
For the third hypothesis, a slightly nonsignificant regression equation was found with a marginal value of p = 0.061 and R2 of 0.101. Even by bootstrapping of 1000 additional re-samples, there was no significant change in the p value, R2, or coefficients. Therefore, the mean value of the organic search traffic percent is increased by 1.11% for every percentage point increase in the Website Loading Speed factor. For the fourth hypothesis, Website Security Condition provided a significant regression equation with p = 0.019 and R2 of 0.189. As a result, the mean value of the organic search traffic percentage is increased by 1.36% for every unit increase in the Website Security Condition factor.
For the last hypothesis, User Behavior in the examined cultural websites seems to have the highest impact on the increase in organic search engine traffic percent. More specifically, a significant regression equation was observed with
p = 0.000 and R
2 of 0.295. Thus, the mean value of the organic search traffic percent is increased by 3.14% for every percentage point increase in each variable of the User Behavior factor. This constitutes an important research result. Prior research implied that search engines encapsulate user behavior in order to rank websites in their search engine result pages [
20,
48]. And indeed, the higher the ranking position of a website, the higher the organic search engine traffic percentage that they receive [
18,
19,
60].
Agent-Based Model Development
The extracted outcomes of the regression statistics resulted in significant implications that could be incorporated into a predictive data-driven agent-based model. The purpose of ABM is to compute and represent each case individually at a micro-level view while taking into consideration temporal changes [
53,
54,
55]. This is not possible through the aggregated macro-level approach of Fuzzy Cognitive Mapping.
For instance, in ABM, decision-makers are able to estimate the impact of each change in SEO performance and user behavior individually for each website. This advantage provides precise results regarding the impact that each SEO factor has for every website and also about the percentage variance of organic search traffic that the website receives. As all cultural websites differ in their content and how compatible they are with the SEO factors, it is possible to generate different data analytics, both technical and behavioral. This means that managerial staff need more or less time to rectify SEO issues and, therefore, to improve user behavior and enhance organic search traffic. In this case, ABM as a predictive modeling and simulation method gives risk-free flexibility to decision-makers. They are able to themselves define the time needed to keep up with the SEO compatibility framework and, thereafter, to improve their organic search traffic. This approach combines both managers’ domain knowledge, as each cultural organization differs in its operations, and the practical insights of the data analytics results.
The first main goal of the proposed computational model is verification that the proposed methods and results can be used to optimize the organic search engine traffic percentage. The second goal is decrease of the bounce rate level as a negative indicator of the overall user behavior in the examined cultural heritage websites. In the next figure (
Figure 8), we present the developed ABM, its entities, and its conditions. For model development, AnyLogic ver. 8.5.2 software was used in JAVA source code in order to compute agent behavior. We defined a specific time range of 90 days in order to predict and simulate the percentage increase of organic search engine traffic. No additional days were included as there was no other crucial percentage variance in the organic search engine and bounce rates.
The model starts in its initial stage with the possibility of entrance and visit inside the cultural heritage institution websites, an initial point that depicts fundamental aspects of the agent-based development process [
54,
55,
56]. This is indicated in the first statechart, entitled “Potential Search Engine Users”. The transition of users (as agents) among statecharts is computed based on the prior descriptive statistics of the study, such as min, max, mean, and mode, and the outcomes of the regression analysis. The impact level that users receive from the Size of Websites, the Website Loading Speed, and the Website Security is defined by the conditions of the Size of Websites Impact, Website Loading Speed Impact, and Website Security Impact. These three major factors and their defined conditions impact drastically on user behavior inside cultural heritage websites. However, as the regression results indicated, the Website Loading Speed factor does not impact the organic traffic percentage, so there is no kind of transition between the two statecharts. At the same time, the Size of Websites, Website Security, and SEO Crawling factors are depicted as statecharts that impact both User Behavior and the final goal, which is positive influence of the Organic Search Engine Traffic Percentage.
This kind of impact is computed through Poisson distributions, while setting up the results of the regression as lambda values (λ). The Poisson distribution was selected because our sample
- (a)
highlights predictive optimization in the specific time range of 90 for which the model runs;
- (b)
is generated by a known constant mean rate of values, most of them with the simplicity of a percentage; and,
- (c)
each one of the examined websites and their performance is completely independent and is not affected by the previous performances of the other websites.
Moreover, we define the consequence of low interaction rate and dissatisfied user behavior resulting in immediate abandonments via the bounce rate metric, which is illustrated through the Bounce Rate statechart and computed through the Percent of Bounce Rate condition. That is, users enter the websites, but they find insufficient content (Size of Websites), low speed of navigation (Website Loading Speed), and insufficient security in their exploration, so they leave the websites almost immediately upon their visit. In
Figure 9 we present the outcomes of the predictive agent-based model.
The graph in
Figure 9 represents the potential scenario of improving each of the examined factors based on the outcomes of the regression and their impact on the organic search engine traffic percentage and bounce rate level. Indeed, the model, after the initial days of the run, shows an improvement in organic search engine traffic. At the same time, a decrease and steadiness is observed in the bounce rate level without any significant sign of increase. Furthermore, it is noted that the Organic Search Engine Visit Percent does not show any further optimization after Day 50, following a straight line without any kind of fluctuation or change. This happens for two reasons. First the examined cultural websites are able to receive the rest of their visitors from paid advertising, social networks, direct traffic, email marketing campaigns, and other external websites. Secondly, it is possible for the managerial staff to cover and rectify all the SEO technical compatibility factors that are able to optimize the organic search traffic up to ~75%, as depicted in
Figure 9. Therefore, new data analytics and regression results are needed in order to provide feedback, update the predictive model, and determine the potential extent of the percentage increase in organic search engine traffic.
5. Discussion and Future Implications
The optimization of visibility in cultural heritage websites improves the knowledge that stakeholders receive from them. More specifically, in an open and democratized way, CHI websites increase people’s interest in the past and allow them to recognize how their surrounding societal context has changed over time. In this respect, the SEO strategy must be set within the prism of the overall mission of cultural heritage institutions, rather than assigning these functionalities unilaterally to technical staff. This will enhance the overall importance of SEO strategies from the support personnel to the upper management levels.
In this paper, we proposed a novel methodology that quantifies in a manageable way the impact of several factors on the organic search engine traffic percentage in CHI websites with the purpose of increasing visibility and findability. One step further, this methodology offers to the administrators of CHI websites an opportunity to convert data analytics about SEO performance into useful insights and actions for potential optimization of their visibility on the Web. Otherwise, a big data analytics framework without evaluation, analysis, interpretation, and suggestion for further improvement is completely useless [
61]. Based on that, we believe that this research establishes a new SEO context of communication, as more and more big data analytics can be retrieved and interpreted, while focusing on critical factors and omitting less relevant ones in organic traffic optimization. In this respect, this methodology provides new opportunities both for managers in cultural institutions and for research on this topic.
5.1. Managerial Implications for Cultural Heritage Institutions
5.1.1. Implications for Optimized Website Performance and Visibility
The proposed model shows validity, reliability, and cohesion as regards the variables and factors that it contains for evaluation and, hence, optimization of organic search engine traffic. This works as a solid stepping stone for managers to adopt this methodology, evaluating the importance of each factor and focusing precisely on each one for further improvement. However, although the results of the obtained behavioral data analytics demonstrated that CHI websites receive on average up to 62.76% of their total traffic solely from search engines (
Table 2), the bounce rate level was observed to reach up to 55%. This means that more than one in two visitors immediately abandon the websites after their visit.
Based on that, we suggest to marketing managers and administrators of cultural websites to focus first on usability improvement with the purpose to improve user interaction and behavior. The factor of SEO Crawling includes variables that might have crucial impacts for enhanced usability and user experience in CHI websites. The avoidance of thin or duplicated content, removal of broken links that confuse users, and proper mobile friendliness are some of these user-centered variables. Moreover, this factor includes variables that have a systemic impact on increasing search engine friendliness to crawlers. The appropriate curation of headings, titles, meta-descriptions, robots.txt, and sitemap files are some of the points that managers should focus on with the purpose to develop favorable conditions for the indexing process by search engines.
In this research, regression results show that user behavior has the highest impact among the factors that affect the percentage increase of organic search engine traffic (
Table 3). Indeed, User Behavior can increase by up to 3.14% the total percentage of organic search traffic in the examined websites. Nevertheless, if the administrators do not pay greater attention to aligning their efforts firstly with the optimization of website usability, then the behavior of users and their experience will negatively affect the percentage of search engine traffic. Therefore, the managerial staff of cultural institutions must not focus only on SEO strategies that aim for ranking optimization; it is more important to improve usability for better engagement between users and content [
60,
62]. This will positively increase behavior and, thereafter, provide higher organic traffic percentages.
5.1.2. Utility of the Methodology
The proposed methodology not only supports managerial staff to seek an aggregated evaluation of a CHI website, it is also a flexible approach to focus on the individual performance of specific collections contained in unique webpages which unfortunately suffer from low visibility and findability on the Web. For instance, administrators could evaluate the SEO performance of specific webpages of cultural content while manipulating in a more efficient way the process of optimization in specific
parts rather than the
whole. This approach covers a rigorous and challenging task for cultural heritage institutions, as they have to deal with the large size of their content. Indeed, the larger the size of a web-based system, the more complex its manipulations and rectifications [
12,
19,
45,
54].
In addition, the outcomes of this methodology provide practical and educational implications for cultural institutions to avoid big data frameworks that rely more on data storage and not enough on their analysis. As the reliability of the gathered data constitutes a core value for the quality of a well-informed decision-making process [
61], website analysts of cultural heritage websites should focus more on big data metrics systems that fit the following:
- (a)
Are aligned with their key performance indicators, such as improvement of organic search engine traffic or user engagement with the content [
44,
48]; and
- (b)
Gather reliable and veracious data that can be deployed in predictive model development and calibration [
57,
63].
Therefore, the proposed methodology offers the flexibility to tackle other problematic issues in the online presence of cultural heritage institutions, such as the proper utilization of analytics for social media optimization or cost-effective online paid advertising campaigns. That is, we proceed to the careful delimitation of KPIs; gather, validate, and examine the data analytics that align with the KPIs; and then develop data-driven predictive models for optimization.
5.1.3. Optimized Financing Resource Management
In the EU context, the Eurostat report of 2018 [
64] depicted a low percentage of expenditures in cultural services ranging from 0.4% up to 0.8% of the GDP. Bearing in mind the reduced financial flexibility of cultural institutions and their limited available resources for the management of the cultural material that they contain, the process of search engine optimization could be a cost-effective marketing strategy.
In contrast with other digital marketing strategies that increase website visitor numbers but provide poor content curation and usability, SEO constitutes a sustainable digital marketing strategy that focuses on one of the most fundamental aspects of digital marketing: the effectiveness of the landing page. If users land in webpages that express usability and proper curation of content, then their experience will be better, making any kind of marketing communication strategy more effective. This constitutes a promising approach to reduce paid advertising strategies that do not eventually return the investment, due to the minimal interaction of users after visiting websites.
5.2. Research Implications
The dimension reduction results through principal component analysis indicated that most of these variables are suitable for providing reliable evaluations of website performance and the impact that they have on user behavior and organic search engine traffic. Notwithstanding, even if we include more than 50 variables that impact the organic search engine traffic optimization, the regression R-square values indicate the depth of search engine ranking algorithms and the multidimensionality of the variables they involve. Following the above findings, we have started further research efforts in order to explore and include more variables or factors that probably influence rankings and, hence, percentage variance in organic search engine visits. Based on this assumption, as big data mining and analytics techniques are getting more and more sophisticated and impact organizations’ decision-making process in terms of marketing and promotion strategies [
62], the research topic of SEO reliance in big data analytics will be discussed in a detailed manner in the future.
Regarding the predictive agent-based model development, from the initial research approaches as a computational method to describe the complexity of a system and its entities, to recent characterizations, it is referred to more as an art than as a science [
56,
58,
65]. However, as big data analytics expand the opportunities for integrating more and more data into simulation models, the
art is sidelined. Therefore, new research approaches are developed to overcome a lack of data and combine prior domain knowledge and analytics for logical well-informed and data-driven predictive models.
In this paper, we developed the ABM as a supportive tool that provides feedback to the managers of cultural heritage institutions regarding the impact of several factors on user behavior and organic search engine traffic percent. An abstraction level that describes the impact of each factor was developed. Nevertheless, predictive models are mostly stable in abstraction levels but unstable with larger perturbations when more conditions and entities are included. Therefore, further research is needed to evaluate predictive model efficiency through ABM when expanding the level of abstraction or integrating system dynamics approaches [
66].
Furthermore, the results of the study emphasize the necessity to redefine the SEO topic. Apparently, the higher the compatibility of the SEO factors, the higher the rankings and search engine visit percentage. However, the main aim of search engines is confirmation that they provide the most qualitative content, in the highest volume, in the fastest time to their users, according to their search terms [
67]. In this respect, Web developers and content creators should have practical quantified indicators in order to evaluate and optimize their website performance and content. Thus, we redefine SEO as it is not solely the process of rectification for higher search rankings. It is rather much more a
user-centric strategy that improves the findability and visibility of information in search results and aims for integrated user experience inside websites.

 ,
, 


