Article

Big Data and Energy Poverty Alleviation

by
Hossein Hassani
1,*,
Mohammad Reza Yeganegi
2,
Christina Beneki
3,
Stephan Unger
4 and
Mohammad Moradghaffari
5
1
Research Institute of Energy Management and Planning, University of Tehran, Tehran 1417466191, Iran
2
Department of Accounting, Islamic Azad University, Central Tehran Branch, Tehran 1955847781, Iran
3
Department of Tourism, Faculty of Economic Sciences, Ionian University, Galinos Building, 7 Tsirigoti Square, 49100 Corfu, Greece
4
Department of Economics and Business, Saint Anselm College, 100 Saint Anselm Drive, Manchester, NH 03103, USA
5
Department of International Relations and Energy Policies, Azad University of Tehran, North Branch, Vafadar Blvd., Shahid Sadoughi St. Hakimieh Exit, Shahid Babaee Highway, Tehran 1651153311, Iran
*
Author to whom correspondence should be addressed.
Big Data Cogn. Comput. 2019, 3(4), 50; https://doi.org/10.3390/bdcc3040050
Submission received: 11 June 2019 / Revised: 3 September 2019 / Accepted: 16 September 2019 / Published: 24 September 2019

Abstract

:
The focus of this paper is to bring to light the vital issue of energy poverty alleviation and how big data could improve the data collection quality and mechanism. It also explains the vicious circle of low productivity, health risk, environmental pollution and energy poverty and presents currently used energy poverty measures and alleviation policies and stresses the associated problems in application due to the underlying dynamics.

1. Introduction

Energy poverty is a term widely used to define living conditions under unaffordable and inaccessible energy resources. There are a number of factors that cause energy poverty in a broader sense. On the one hand, local factors such as natural resources, geographical location, local policies, household income or education level play an important role in individual energy accessibility and affordability [1,2]. On the other hand, global factors such as macroeconomic, geopolitical and climatic factors also influence the level of energy poverty [3,4,5,6]. The fight against energy poverty is of increasing relevance as the population on our planet is projected to increase by slightly more than one billion people over the next 13 years, reaching 8.6 billion in 2030 and to increase further to 9.8 billion in 2050 and 11.2 billion by 2100 [7]. The main challenges our society will face will be to provide accessibility and affordability of energy to people. Since economic growth is closely related to energy access and affordability, it is a topic of highest importance since energy access is the foundation of wealth, freedom, health and human dignity [8,9,10].
In this article, we summarize the current discussion on energy poverty, the definitions and measures, as well as the resulting problems in policy implementation and their implications up to now. One key element we stress is the variety of measurement methods of energy poverty, which makes it almost impossible to conduct comparative analyses among countries. Moreover, we highlight the issue that these indicators most often just capture the space dimension and neglect the time dimension. This issue is problematic since policy measures usually do not take into account the dynamics of changing factors that lead to energy poverty and therefore risk maintaining policies that are not efficient and effective over the course of time. As the political decision making process is a tedious one, the flexibility and speed of administrations to react to changes in underlying causal factors is questionable. Therefore, it is important to consider the dynamics of these changes already at the basis of decision making.
The literature on the topic of energy poverty is widely spread among different disciplines, ranging from financial economics, energy economics, biomedical science to humanities, socioeconomic and even philosophical areas [5,10,11,12]. We contribute to the current discussion by considering the potential of big data and usage of AI for the enhancement of socioeconomic data through environmental, political and climatic data for policy decision making.
This paper is structured as follows. We first start by giving a definition of energy poverty, which is followed by summarizing the development of significant legislation in various countries. We then explain the vicious circle of low productivity, health risk, environmental pollution and energy poverty and present thereafter currently used energy poverty measures and alleviation policies and stress their problems in application due to the underlying dynamics. Out of that, we show how big data could improve energy poverty alleviation policies and discuss the challenges that the data collection process would bear.

2. Energy Poverty

Energy poverty has become the main focus in many fields, from social and economic studies to engineering studies and political campaigns. The number of publications dedicated to energy poverty shows the public interest in the issue in both academic and public communities. Figure 1 shows the number of research publications in “Elsevier Science Direct” and “Wiley Online Library” with the keywords “Energy Poverty” or “Fuel Poverty”. As can be seen, the number of publications increased exponentially in recent years.
The study of energy poverty has raised serious challenges in these fields. Even the definition of the subject has been an issue. For instance, in 2013, the UK government (David Cameron’s cabinet) changed the definition of fuel poor households from “households which spend more than 10% of their income on fuel to maintain an adequate level of warmth” to “households which spend above average fuel costs that would leave them with a residual income below the official poverty line” [13]. Social activists, political parties, commons committee and media, accused the government of redefining fuel poverty to bring down the number of households classified as fuel poor [13,14].
The definition of energy poverty will lead to designing energy poverty measures and, consequently, solutions and policies [15]. For instance, defining energy poverty as “households which spend more than 10% of their income on fuel to maintain an adequate level of warmth” would consider “low income low cost”, “high income high cost” and “low income high cost” as energy poor (when the energy cost is considerably higher than the income) and takes into account the financial changes during the time (the definition takes in to account not only energy consumption and price but also a household’s income relative to energy cost). Hence, all policies should consider decreasing energy cost (through decreasing energy price or increasing energy efficiency) for all households in energy poverty (even households with incomes higher than the poverty line). Consequently, energy poverty should not be considered as a part of income poverty. Changing the fuel poverty definition to “households which spend above average fuel costs that would leave them with a residual income below the official poverty line”, energy poverty would only consider “low income high cost” as fuel poor. Moreover, this definition has two conditions for a household to fall into the fuel poor category. The first condition is to “spend above average fuel costs”, which means energy inefficiency and the second is “residual income below the official poverty line”, which means low income. With this definition, fuel poverty would become a subclass of income poverty. Consequently, the policies for fuel poverty reduction would focus only on financially poor households, reducing the poverty threshold and increasing energy efficiency.
There is no universal definition of energy or fuel poverty and in different countries and regions, there are different social, economic and environmental situations. However, in developed countries, energy (fuel) poverty is usually defined based on energy (or fuel) affordability, while in less developed countries, it is defined based on clean or modern energy accessibility [16]. Different countries and institutions have given their own definitions based on the social, economic and environmental situations of their regions. The UK was the first country in the EU that defined and addressed energy poverty (as fuel poverty) officially Schumacher et al. [17]. In the UK, the first definition of fuel poverty was given in “Warm Homes and Energy Conservation Act (WHECA) 2000”: “a person is to be regarded as living “in fuel poverty” if he or she is a member of a household living on a lower income in a home which cannot be kept warm at reasonable cost” [18]. The same definition is used later in the 2010 and 2013 Energy Acts. The definition is imprecise and impractical. The practical meanings of “reasonable cost”, “warm” and “lower income” are unclear in this definition. Moreover, the definition is only based on the warmth of the house, which is the issue in cold seasons and does not take into account issues such as cooking proper meals and access to proper lighting and air conditioning during hot seasons. Recently, scholars and authorities have raised concerns about the fuel poverty definition see References [19,20,21]. The European Commission (EC) has defined energy poverty as a set of conditions where “individuals or households are not able to adequately heat or provide other required energy services in their homes at affordable cost ”Thomson and Bouzarovski [22]. This definition takes into account other energy needs (cooling, lightning and powering the appliances needed for a decent standard of living and health). With this definition, the policies for reducing energy poverty should guarantee a standard level of life with reasonable price. So, energy poverty policies should address low incomes, high energy prices and accessible appliance technologies at the same time. The African Energy Commission (AFREC) uses a definition similar to the UK’s 10% definition, that is, “a household that spends more than 10% of its revenues to meet its energy needs is in energy poverty”. However, the energy poverty indicators are not entirely based on revenue and energy costs since some areas are not well developed and do not have access to clean or modern energy. AFREC uses two additional indicators to measure energy poverty: rate of electrification and access to biomass for cooking [23]. With this definition, energy poverty policies should take into account developing sustainable energy resources too.

2.1. Vicious Circle of Energy Poverty

Energy poverty is one of the central factors in socioeconomic and environmental issues. In some cases, it is the key link in socioeconomic crisis chain. Abundant research in the last two decades has revealed an interactional relation between energy poverty and a number of socioeconomic and environmental issues. For instance, there is a linkage between economic development and energy poverty [2,4]. In the developed countries, social support programs would prevent energy poverty and its consequences [24,25], although it would not solve the problem [26]. On the other hand, in less developed regions, such programs are not well funded and, due to socioeconomic situations, housing poverty is usually greater. Other socioeconomic issues such as migration, education level and employment could make the energy poverty situation worse [27,28].
In a region with energy poverty, there usually is low productivity (due to low access to energy or high energy cost), low surplus and, consequently, low income. Low productivity would result in low cash flow, which means there is not adequate financial resources to develop energy supplies, energy conversion or energy efficiency. This is called the vicious circle of energy poverty [29]. At the household level, the vicious circle exists between energy poverty and housing poverty [30].
Energy poverty affects an individual’s health and well-being. In developed countries such as the U.S., the UK and Australia, households with high levels of energy poverty usually are forced to reduce their food expenditures while cutting other basic needs as well as heating/cooling energy demand [24,25]. Reducing expenditures for basic needs potentially would cause the physical/mental illness [31]. In less developed countries (regions in which households have less access to modern energy), households with high levels of energy poverty usually use biomass and inefficient fuels (such as “firewood”, “dung cake”, “crop residue”, “kerosene” and “coal/charcoal” [32]), which would cause indoor pollution and put households’ well-being at risk. In both situations (developed and less developed regions), as a consequence of energy poverty, a household’s income decreases (due to a decreased ability to offer workforce), while its health costs increases.
At larger scale, as a result of inefficient fuels, regional air pollution will increase. For instance, energy poverty (and using firewood as the main source of energy) is the main cause of air pollution in Southern Chile [33]. Air pollution caused by energy poverty is not just an issue in less developed countries (with low access to modern energy). Between 2010 and 2012, as the result of economic crisis and increased tax rate on heating fuel, a large number of Greek households lost their electricity connections due to unpaid electricity bills [34]. The households had become energy poor and started using firewood as an alternative heating fuel, resulting in a new environmental crisis. In 2013, a high level of winter air pollution was reported, in large Greek cities. Smog worsened through nights, which shows firewood’s role during dark and cold hours [35,36,37]. Chemical analysis of the air pollutants showed high levels of “lead”, “arsenic” and “cadmium” particles, meaning people were burning painted wood (most likely old furniture) [36,38]. Due to indoor and environmental pollution, energy poverty reduces productivity and increases health costs in a region. This is the vicious circle of energy poverty, environmental pollution and health risk (in which energy poverty would increase health risks and increased health risks would worsen the energy poverty situation). Energy poverty takes part in another vicious circle, as it has a synergic relation with local and global climate change [39].

2.2. Energy Poverty Measures and Alleviation Policies

The next step in alleviating energy poverty is to develop a measure that shows all aspects of energy poverty. There are a variety of methods and indices for measuring energy poverty. Each study has developed a method based on socioeconomic and environmental situations of the region at hand. Table 1 and Table 2 show the variety of energy poverty measures and indicators proposed in recent years.
As seen in Table 1 and Table 2, different energy poverty indices are proposed for different environmental situations. Since environmental situations are dynamic over time, the energy poverty index (and consequently the energy poverty alleviation policies) would change not only based on region but over time.
Different policies have been proposed to alleviate energy poverty subsequent to social awareness. One common policy (mostly executed in developed countries) is a series of social supports for energy poor households. Although this approach could prevent the issues caused by energy poverty, it would not solve the energy poverty itself. In addition, there is an ongoing debate about the type of social aid in both academic society (see References Karásek and Pojar [60], Oppenheim [61], Scarpellini et al. [62]) and social/political campaigns (for instance, see References Thomson and Bouzarovski [22], Enet English [37], Daily Mail Press Association [63], Long-Bailey [64]). Three other popular strategies to alleviate energy poverty are to “increase energy efficiency of dwelling” [65,66], “increase energy affordability and demand management” [61,67,68] and “increase access to clean/modern energy” [69,70,71]. The first two strategies are more common in developed regions (regions with high access to clean/modern energy), while the third one is the policy in less developed regions. A comprehensive study of energy poverty alleviation policies is provided by Reference Santamouris [72]. Although there are a variety of policies, the choice of policies is usually local, based on the indicators’ situation in each region. As seen in Table 1 and Table 2, many of the indicators and pressure factors mentioned above are global (such as climate, migration and economic development). The policies however, should be made at the local level [62].

3. Lack of Conventional Data And Methods

3.1. Lack of Data

The largest challenge in finding the proper local policies to alleviate energy poverty is a lack of data at global level [44]. The EU commission launched the “EU Energy Poverty Observatory” (EPOV) (https://www.energypoverty.eu/) in 2018 to overcome the problem in Europe but data from some countries (even in Europe) still are not available. The lack of data for most indicators is worse in years before 2016. Furthermore, the EPOV does not provide all the data related to energy poverty, such as migrations, climate change and many socioeconomic variables.

3.2. Lack of Methods

Conventional methods to alleviate energy poverty include the use of standard key economic data such as GDP growth rates, CPI changes or demographic statistics. The problem with these measures is that they lack of explanatory power when it comes to detect takeaways which help to formulate proper policy measures. Starting with the above mentioned definition problem of energy poverty, it is not possible to reduce the explanatory factors into few dimensions as they are inter-related, where exogenous factors also have to be taken into account. In order to show the problem that arises through the use of ordinary key economic data, we conduct several regressions to analyse if conventional key economic variables such as CPI and population growth are able to explain the rate of energy accessibility. Table 3 shows the rate of electricity accessibility for different regions and periods.
The CPI and population growth data for the corresponding time period are taken from References [73,74]. For areas such as North Africa and Sub-Saharan Africa we aggregate the CPI, resp. the population growth data on a relative basis.
We conduct a multivariate regression for E l e c t r i c i t y A c c e s s i , t for country i at time t, on the CPI C P I i , t of country i:
E l e c t r i c i t y A c c e s s i , t = α + i = 1 N γ j C P I i , t + ϵ i , t .
Then regress E l e c t r i c i t y A c c e s s j , t of country j at time t against population growth P O P j , t of country j:
E l e c t r i c i t y A c c e s s j , t = α + j = 1 N γ j P O P j , t + ϵ j , t .
For all areas, we cannot find any relationship between the changes in CPI levels and energy access rates, as well as between population growth rates and electricity access rates. The results indicate the traditional key economic variables lack of explanatory power when it comes to complex concepts such as energy poverty. This stresses the necessity of considering more complex input data in order to address and explain energy poverty such that proper policy measures can be taken. As proliferation of energy poverty is not necessarily a sign of population density or population growth, other factors must be considered such as substance and condition of buildings, geographical situations, etc. The only way to get this kind of data is by usage of satellite imaging data. Generating and gathering of the necessary data can help to identify potential causes for energy poverty and thus tackle these issues.
In the next section we will explain the importance of the usage of satellite imaging data and how it can be used to explain, predict and thus alleviate energy poverty.

4. Use of Satellite Imaging Data to Predict Energy Poverty

While there are many ways to measure energy poverty, there is still lack of data on energy poverty metrics and supporting indicators in the developing world and in rural areas in the developed world. This lack of information is because the data are typically gathered through surveys, which are time-consuming, expensive and sometimes impossible to carry out in particular regions of countries and are thus less common. Given the difficulties of scaling up survey-based methods, the opportunities that satellite imaging data offer could be a key to assessing the global distribution of poverty.
The satellite-based Earth Observation market is in an emerging state today and is expected to boom over the next decades owing to recent technical breakthroughs regarding data collection and storage. Indeed, there is an increasing offer of high-quality Earth observation data, both in terms of variety of sources and of quality of resolution [75]. The usefulness of satellite images can be examined along several dimensions of satellite design characteristics and acquisition conditions, such as spatial resolution, temporal resolution, spectral range, spectral resolution, cloud coverage, time of capture and off-nadir angle [76].
The large quantity of data that can be captured using satellite technology means that a larger and more accurate picture can be quickly created. By identifying the areas that need better energy efficiency measures with satellite images, scientists will have a more accurate view of how to reduce unnecessary energy consumption and they will be able to precisely assess poverty in remote and rural areas. This technique could help revolutionize the ways in which groups find impoverished areas and eventually provide relief to people living in those specific parts of the world.
In September 2018, the European Space Agency (ESA) in partnership with the gas and electricity supplier E.ON. and Astrosat announced a trial project that uses satellite imaging data from across the UK to identify the communities that are in most need of support [77]. By using orbiting satellites, the project will use near real-time and historical data including optical sources and thermal-infrared for heat mapping, air quality and pollution tracking. The data will be combined with Astrosat’s ThermCERT software to help address issues such as housing conditions, insulation, air quality and even traffic management. This project has the potential to be rolled out across other countries once the UK trial has successfully concluded [78].
Remote sensing data such as high-resolution satellite imagery are therefore becoming increasingly available and inexpensive and can be used as aids in deriving essential conclusions regarding initiatives to tack energy poverty, as has been reported in recent literature. Measuring intra-urban poverty using urban texture and structure metrics and land cover was examined as a means of determining spatial unit analysis for energy poverty in the slum areas of Medellin, Columbia [79]. The authors used very high spatial resolution (VHR) Quickbird satellite images and examined 139 analytical regions, which were broken down from 243 city neighborhoods. They found that these features explain up to 59% of the variability in a measure of poverty known as the Slum Index.
Understanding relationships between poverty and the environment is crucial for sustainable development and ecological conservation. Monitoring annual progress toward the United Nations’ sustainable development goals (SDGs) using household surveys is prohibitively expensive. Watmough et al. [80] explored whether remotely sensed (RS) satellite data could be used to monitor rural poverty in low-income and middle-income countries. The authors analyzed RS land use and land cover data for a cluster of rural villages in Kenya at multiple spatial levels, from individual homesteads to the wider village periphery. Using this approach, the authors identified the poorest households with 62% accuracy, compared with 52% using a single-level approach in which RS data are aggregated over a fixed area. According to the authors, appropriate refinement of such a method, combined with the increasing availability of RS data and volunteered geographic information, could provide a more cost-effective means of monitoring sustainable development than household surveys.
Several studies have explored the correlations between night-time lights (NTL) satellite imagery, economic activity and welfare in a given area [81,82,83,84,85,86,87,88,89,90]. For instance, dark areas of the NTL (Figure 2) show the areas with low access to energy. These are either less populated areas or areas with high energy poverty. NTL appear less useful for distinguishing differences in economic activity between poor, densely populated areas and wealthy, sparsely populated areas [91]. The latest studies looked at daylight images that can help distinguish different levels of economic well-being in developing countries [91,92,93,94].
Even though there is access to satellite imagery for the entire globe, many of these raw data are not in a usable format for machine learning frameworks, making it difficult to extract actionable insights at scale [92,95]. The earliest approach that combined machine learning with satellite imagery and crowdsourced assistance to identify poor villages in Kenya was presented by two NGO Give Directly volunteer researchers in 2014 [76,96]. The authors estimated the ratio of thatched and metal roofs in each village and targeted the villages with large percentages of thatched roofs as poor villages. While the algorithm was not accurate enough, it showed the potential of using satellite imagery and machine learning for leveraging in development work. Next, Xie et al. [92] trained a convolutional neural network (CNN) to predict nighttime light intensities from daytime satellite imagery and then used the learned filters to predict poverty areas by classifying each location as either “in-poverty” or “poverty-free”. In response to the binary classification problem there was the study of Jean et al. [91], who provided more fine-grained poverty data in five countries of Africa by using continuous wealth measures. In particular, the authors established a transfer learning approach to estimate poverty for the countries of Malawi, Nigeria, Rwanda, Tanzania and Uganda by using a set of 4096 unstructured features extracted from the penultimate layer of a CNN that used Google Static Maps (API) to obtain daytime imagery and predict the nighttime light luminosity. Using ridge regression, these features were then used to predict the average per capita consumption, taken from living standard measurement surveys. The resulting model had good predictions and explained 40 to 50% of the variation in village per capita consumption. The analysis of Head et al. [93] replicated and extended results from Jean et al. [91]. The authors confirmed that transfer learning predicts asset index with R 2 of approximately 0.7 in Rwanda and Nigeria. However, when they performed the same technique in Haiti and Nepal, the predictive model lost some of its accuracy (R 2 of Haiti’s predictions for asset index falls to 0.51 and Nepal’s is 0.64), suggesting that NTL step in the transfer learning process may be not suitable for poor, low-density areas.
Engstrom et al. [94] investigated the ability of object and texture features derived from high spatial resolution imagery (HSRI) to estimate and predict poverty rates in a sample of 1291 villages in Sri Lanka. The results indicated that the correlation between indicators from high-resolution daytime imagery and economic well-being was remarkably strong. Simple linear models explained nearly 60 percent of the variation in poverty and average log per capita consumption. In comparison, models built using NTL captured only 15 percent of the variation in poverty or income in the same area. Babenko et al. [97] trained CNNs to estimate poverty directly from high and medium resolution satellite images provided by both Planet and Digital Globe (without using transfer learning or NTL), covering all 2 million km 2 of Mexico. The authors found that in urban areas, the predictive power of Digital Globe was slightly better than for Planet imagery, which explained 61% and 54% of poverty variation, respectively. They concluded that CNNs can be trained end-to-end on satellite imagery to estimate poverty, although there is much work to be done to understand how the training process influences out-of-sample validation.
Zhao et al. [98] used a random forest regression (RFR) model by combining features extracted from multiple data sources, including National Polar-orbiting Partnership Visible Infrared Imaging Radiometer Suite (NPP-VIIRS) Day/Night Band (DNB) nighttime light (NTL) data, Google satellite imagery and land cover map, road map and division headquarter location data to estimate poverty based on household wealth index (WI) at a 10-km spatial resolution. The authors trained the RFR model using data in Bangladesh and applied the model to both Bangladesh and Nepal to evaluate the model’s accuracy. With a relatively high R 2 between estimated and actual WI, the authors concluded that the data that were estimated to measure poverty were relatively accurate and suggested that those countries with no accurate data or that lacked survey data implement the RFR model.
The very high cost of VHR imagery per image or collection of images motivated Perez et al. [99] and Gram-Hansen et al. [95] to carry out their research by using freely available multi-spectral imagery, which is typically of a much lower resolution. In particular, Perez et al. [99] trained CNN models on free and publicly available multispectral daytime satellite images of the African continent from the Landsat 7 satellite, which has collected imagery with global coverage for almost two decades. Although the Landsat images are of lower resolution than the Google Static Maps images used by Jean et al. [91], the authors achieved equivalent or better results than the previous benchmarks. Furthermore, Gram-Hansen et al. [95] introduced a brand new machine learning dataset, purposely developed for informal settlement detection and they showed that it is possible to detect informal settlements using freely available low-resolution (LR) data, in contrast to previous studies that use very-high resolution (VHR) satellite and aerial imagery.

5. Big Data Solutions

Since big/universal databases have been developed in recent decades, the analysis of big data has become an effective solution to many critical problems. In particular, big data solutions are developed in fields affecting energy poverty. For instance, big data analysis is widely used to resolve financial and economic issues. In banking, big data mining is used for risk management, security and fraud detection and strategic planning [100]. Furthermore, the big data technologies are closely related to blockchain technology and cryptocurrencies [101]. The financing strategies and plans (even cryptocurrencies) interact with energy poverty [11]. As another energy poverty pressure factor, big data analytical solutions have been developed to model and forecast climatic and geo-ecological situations. Big data mining techniques are developed to model and forecast climate change based on global observations from earth and satellite information [102,103]. The same models are developed, based on big data, for geo-ecological forecasting [104]. Big data analytics are used in energy industries and energy markets. The applications of big data mining vary from market demand, supply and price forecasting to strategic planning [105,106]. Big data mining techniques are powerful for revealing the relations between socioeconomic, climatic, environmental and financial indicators and forecasting future situations see References [107,108] for more details on big data forecasting and causality.

5.1. Big Data solutions for Energy Accessibility

The development of big data methodologies provides modern ways to evaluate energy accessibility at global and regional levels. Unconventional data sources such as satellite photography and money transfers and those used in mobile telecommunications can assist in predicting demand and assessing creditworthiness of underserved customers and can be combined with climate and weather data to assess competing technologies. These datasets can help describe characteristics of regions targeted for energy access expansion by offering more detailed energy access data from satellite images, deriving alternative creditworthiness scores and customer stickiness indicators from mobile payment history and indicating user mobility and urbanization trends from call detail records; the datasets can also help make predictions about future energy demand that, in turn, will aid in the selection of appropriate energy service alternatives and tailored pricing models for these regions [109].

Oil demand in Africa

Africa has among the highest growth in socioeconomic development as well as energy poverty level. Due to Africa’s great role in energy supply and demand, the socioeconomic development policies in Africa could affect energy plans and policies in other regions. Let us now consider an important issue regarding energy consumption and accessibility in Africa and how big data can assist in obtaining a better estimate of these vital issues.
Africa is one of the world’s most populous continents, with a population of almost 1.2 billion and accelerating growth in both population and economy. Africa also constitutes 20% of the world’s landmass. Due to Africa’s ever-growing population and accelerating economic growth, demand for energy is steadily increasing and solutions to meet this growth have become a major concern among the energy sector leaders within the continent [110]. Since Africa has many cities spread out across the continent, growth in population will result in car purchases and increased demand for transportation, which would lead to massive growth in oil demand [111]. As a consequence of development plans’ consequences, Africa’s growing population is also becoming more urbanized. By 2030, it is expected that six of the world’s megacities will be in Africa: Cairo, Dar es Salam, Johannesburg, Lagos, Luanda and Kinshasa. By 2035, half of the African population will live in urban areas. This situation brings with it energy demand for cooking, heating, communication, transportation and industrial production [112].
Africa has an important role in the global energy market. Africa accounts for approximately 5.8% of gas production and 3.9% of consumption globally. The continent is also the third fastest-growing regional consumer globally, behind the Middle East and Asia Pacific, with consumption having grown by 4.8% per annum between 2005 and 2015 [113]. The overall oil consumption in Africa has grown very quickly. Africa has gone from using 2.5 million barrels of oil a day in 2000 to 4.2 million barrels per day in 2017. Africa’s oil consumption increased by approximately 70% from 2000 to 2017, representing significant growth [114]. Oil production decreased by 7% between 2010 and 2017 due to a lack of development activity and exploratory investment. However, the launch of the Kaombo project is set to contribute to production growth in the coming years, together with other large projects that are expected to commence their activities by the end of 2018. Production of refined products only meets 20% of domestic demand for medium and heavy fuels. Consumption of refined petroleum products has remained subdued over the last few years, decreasing by 10% between 2010 and 2017. Consumption is expected to grow by 26% from 34.2 m bbl in 2017 to 43.22m bbl by 2023 [115]. Table 4 shows growth in Africa’s energy consumption. According to Table 4, Africa’s consumption will steadily grow for all energy sources for the next 20 years, with some energy sources growing more than others.
Growth in Africa’s gas and oil demand is reducing the resources available for export. This trend is emerging from a report on Africa prepared by the International Association of Oil and Gas Producers (IOGP). The region can still export approximately half of its oil production, 8 million barrels a day, which is less than that of a decade ago, when Africa was able to export 70% of its production. For gas, African production stabilized in the last ten years, while demand increased by 5%; exports have now declined to one-third of production [116].
Figure 2 shows that most of Africa is dark at night. Coupling this NTL image with the fact that Africa is the second most populous continent shows the high level of energy poverty in Africa. Alleviating energy poverty and providing access to modern, affordable and clean energy is critical for economic growth. As of mid-2017, 62.5% of the population of sub-Saharan Africa did not have access to electricity [117], which would result in low economic growth in the region. On the other hand, financial resources are needed to alleviate energy poverty and are hard to provide when the region has low economic growth. There are projects aiming for electrification and alleviating energy poverty on the continent, such as the World Economic Forum’s Energy Access Africa project [117] and OPEC Fund for International Development’s (OFID) projects in Africa [118].
Analyzing the oil demand in Africa sets an example of how big data can provide a powerful tool for policy makers to alleviate energy poverty. Due to the complex nature of energy, policy makers should take into account all available socioeconomic, geographic and environmental data. Furthermore, policies in one region, namely Africa, could affect the policies in other regions. For instance, if African policy makers in the energy sector develop their policies in energy poverty alleviation based on hydroelectric and geothermal power plants and increase their oil and gas exports to gain more financial resources, other regions with lower energy resources could rely on oil and gas as inexpensive energy sources. On the other hand, if Africa makes policies to use cars as the main transportation vehicles, developing policies to use electric vehicles and renewable energy resources would become more cost-effective for energy consumers.

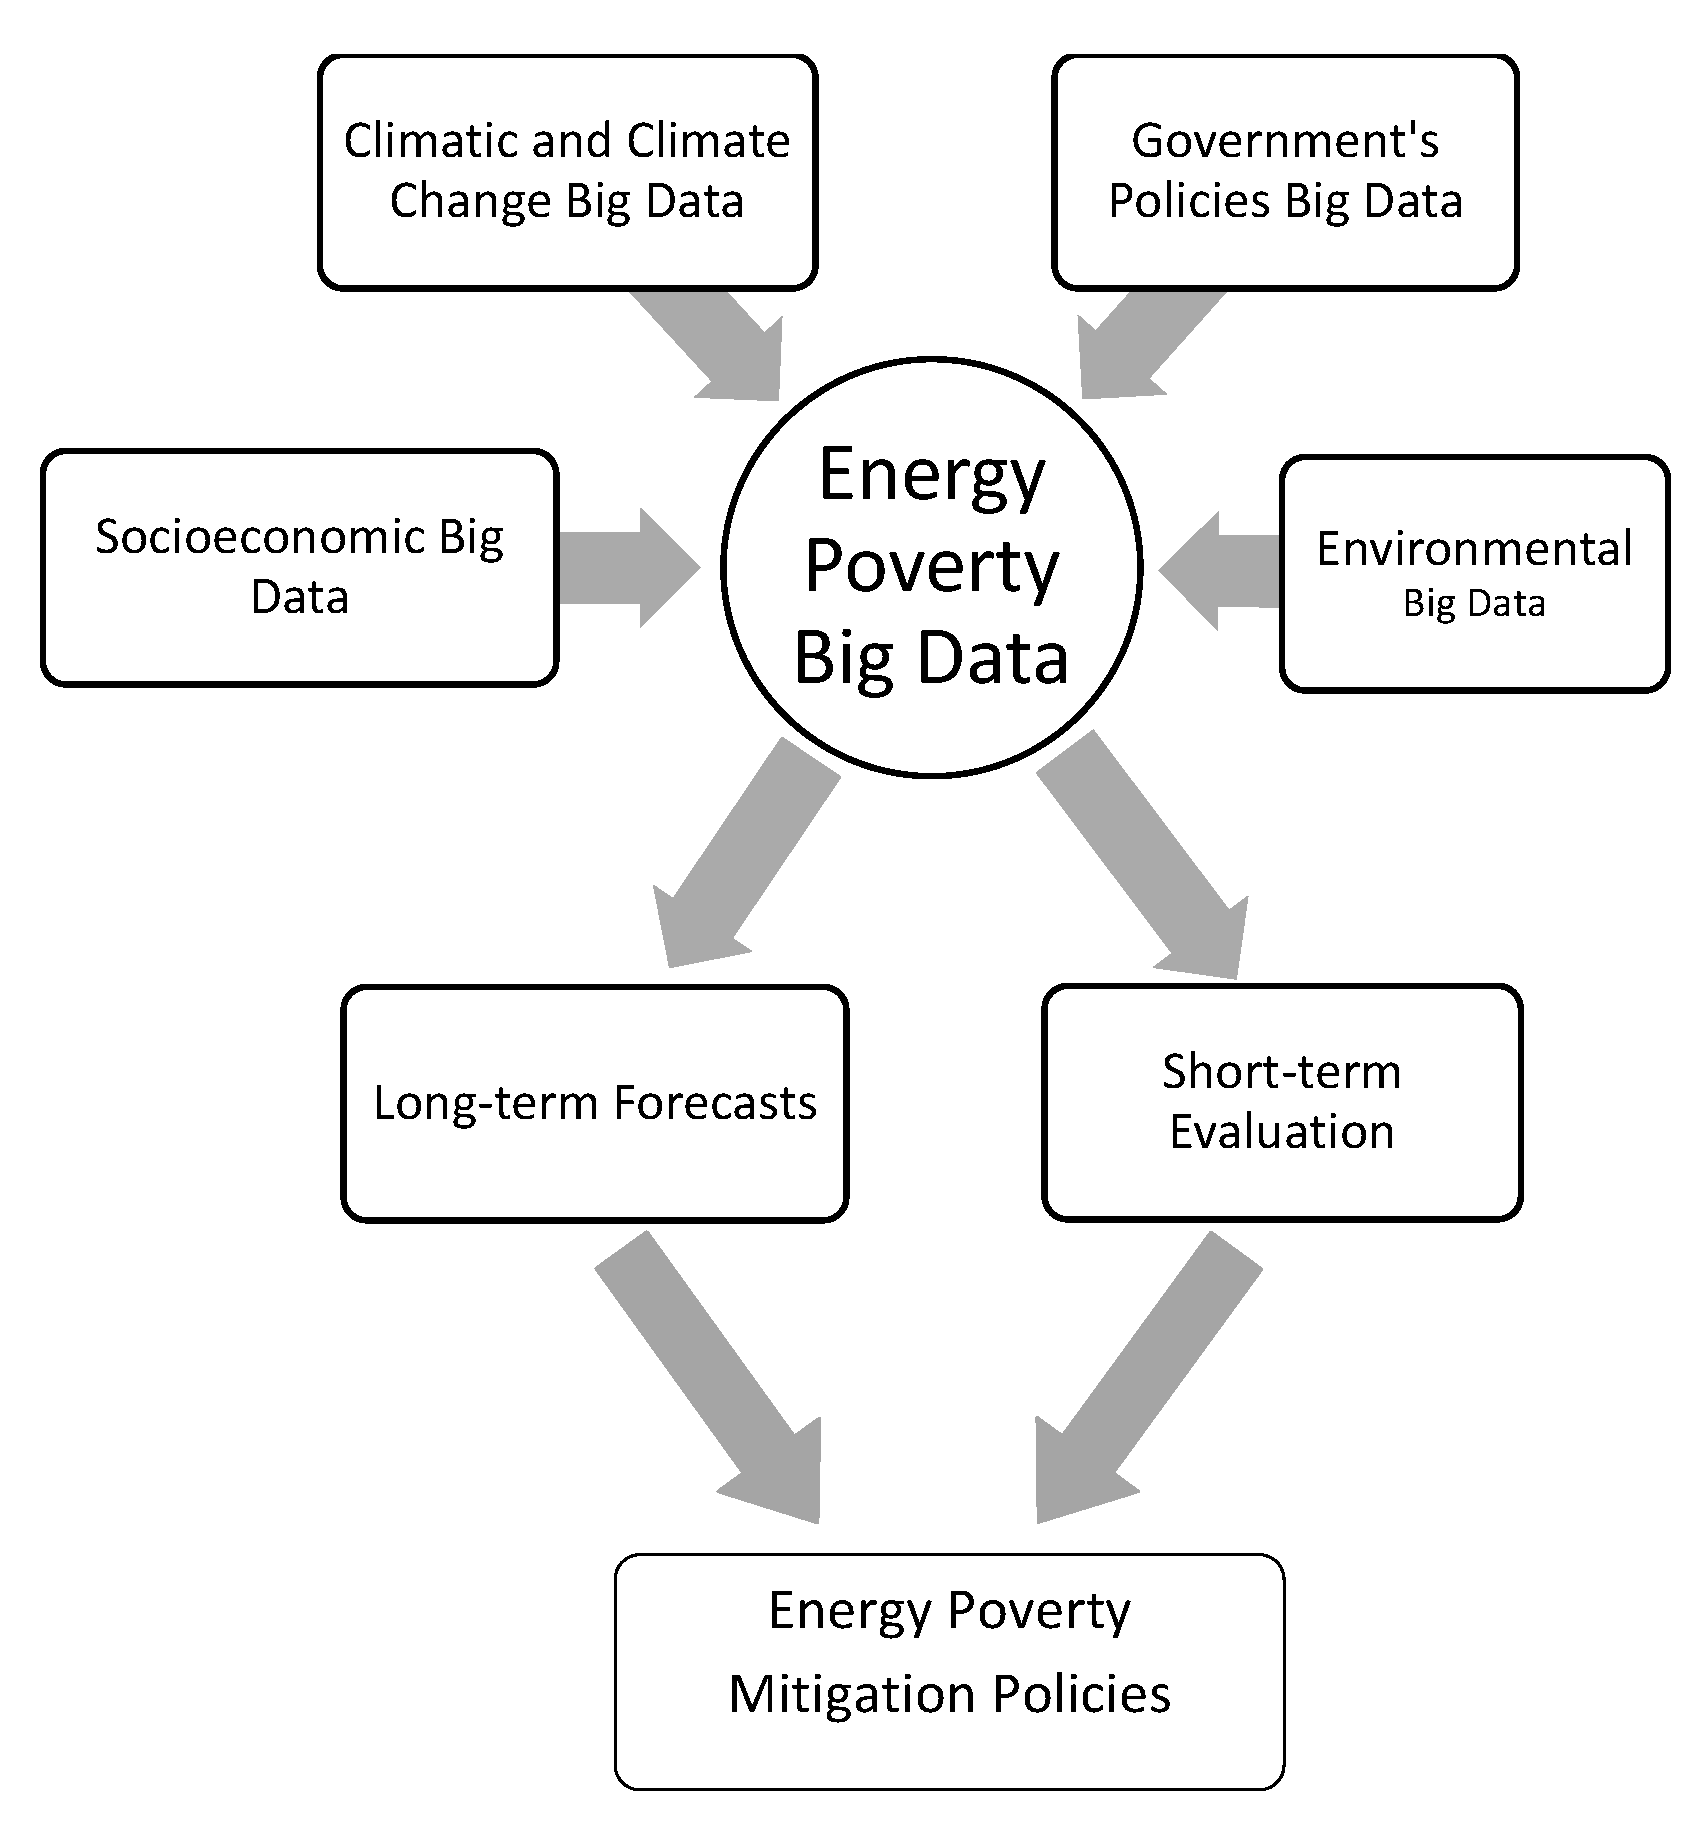
5.2. A Big Data Solution to Energy Poverty Alleviation

Effective policy making needs not only socioeconomic data but also environmental, political and climatic data (due to their relation with energy poverty). Since the nature of energy poverty indicators and factors is dynamic over time, policy makers should take into account the future situations of these factors as well as current conditions. For instance, while the climate is changing, policies based on current climatic characteristics would fail in the long term. Figure 3 shows a proposition for using big data in energy poverty alleviation policy making.

6. Discussion

The consideration of three additional layers to socioeconomic data, namely, environmental, political and climatic data, for policy decision making allows policy makers to capture not only the spatial dimension of the development of energy poverty factors but also the dynamics over time. The collection and consolidation of these datasets would create a new data basis for policy makers and enable them to deduce direct implications of certain policy decisions and conduct scenario and sensitivity analyses. To be able to make use of this powerful big data set, the following obstacles would need to be overcome:
  • Definition of which data to gather: The first requirement would be to agree on a definition and delineation of the required data, determination of the data sources and the dedication of the data, for example, what they should be used for.
  • Data collection: The need of an agenda to ensure a proper collection of datasets. This includes the enforcement of data provision and in some cases the prior provision of measurable equipment to countries that lack sufficient infrastructure and equipment.
  • Standardization: Since the collection of data from various sources will inevitably include inhomogeneities, it is important to agree on measurable and comparable units.
  • Interaction of data: Once the data have been gathered and standardized, it is important to learn about the relationships among the datasets.
  • Definition of target function: After the relationships have been studied, direct conclusions can be drawn and certain scenarios simulated. These scenarios depend on a target function, which would need to be defined, as the desired outcome (minimization of energy poverty) can be reached via a set of solutions.
The challenges for local policy decisions will be smaller than for global policy decisions since the implementation of energy poverty measures will be easier on a local basis, while evaluation of certain energy poverty alleviation policies might be harder to measure on a global scale.
Through the development of the Internet of Things (IoT), data gathering and the implementation and tracking of policy measures will be enabled and allow for frequent evaluation and adaption of these policies. AI will play an important role when it comes to the optimization of energy distribution and utilization since the amount of data in decentralized networks includes so much information that those data can be better, faster and more efficiently processed by AI than by humans. Nevertheless, human oversight will remain crucial.
Considering the evolution of AI, the question arises regarding which fundamental rules would need to be set up in order to ensure a peaceful and welfare-improving set of solutions to reduce energy poverty while not at the expense of energy wealth. Nevertheless, several prerequisites must be met before the implementation of the IoT can evolve at such scale, such as the provision and building of critical infrastructure, education and increased awareness of the importance of energy poverty.

7. Conclusions

This article deals with the problem of energy poverty on a global scale and what necessary measures must be taken in order to provide energy access and affordability. We stress the problem of inhomogeneous data availability and the fundamental lack of a standardized definition and measures for evaluating energy poverty. We summarize the key messages of the current discussion on energy poverty and propose a set of indicators that might be used for energy poverty measurement.
The main insight gained in this article is the necessity of enhancing socioeconomic data by three additional layers in order to make the policy decision making process more efficient: environmental, political and climatic data. By inclusion of these datasets, it can be ensured that energy poverty indicators are tracked not only locally but also dynamically over time, as all of these key influencing factors change constantly over time.
We further explain the problem of maintaining static policy decisions that can become inefficient and ineffective after a certain time. Moreover, we stress the challenges of big data and how big data can be used for mitigating energy poverty. We also discuss the role of the Internet of Things in such a framework and how it can enhance the policy decision-making process using big data in order to reduce energy poverty.

Author Contributions

All authors contributed equally to this manuscript.

Funding

This research received no external funding.

Conflicts of Interest

The authors declare no conflict of interest.

References

  1. Primc, K.; Slabe-Erker, R.; Majcen, B. Constructing energy poverty profiles for an effective energy policy. Energy Policy 2019, 128, 727–734. [Google Scholar] [CrossRef]
  2. Acharya, R.H.; Sadath, A.C. Energy poverty and economic development: Household-level evidence from India. Energy Build. 2019, 183, 785–791. [Google Scholar] [CrossRef]
  3. Chevalier, J.M.; Ouédraogo, N.S. Energy poverty and economic development. In The New Energy Crisis; Chevalier, J.M., Ed.; Palgrave Macmillan: London, UK, 2009; pp. 115–144. [Google Scholar]
  4. Ghodsi, M.; Huang, X. Causality between energy poverty and economic growth in Africa: Evidences from time and frequency domain causality test. Int. J. Energy Stat. 2015, 3, 1550020. [Google Scholar] [CrossRef]
  5. Bouzarovski, S. Understanding energy poverty, vulnerability and justice. In Energy Poverty (Dis)Assembling Europe’s Infrastructural Divide; Bouzarovski, S., Ed.; Palgrave Macmillan: London, UK, 2018; pp. 9–39. [Google Scholar]
  6. Connon, I.L.C. Transcending the triad: Political distrust, local cultural norms and reconceptualising the drivers of domestic energy poverty in the UK. In Energy Poverty and Vulnerability A Global Perspective; Simcock, N., Thomson, H., Petrova, S., Bouzarovski, S., Eds.; Routledge: London, UK, 2017; pp. 48–60. [Google Scholar]
  7. United Nations, Department of Economic and Social Affairs, Population Division. World Population Prospects: The 2017 Revision, Volume II: Demographic Profiles; ST/ESA/SER.A/400; United Nations: New York, NY, USA, 2017; Available online: https://population.un.org/wpp/Publications/Files/WPP2017_Volume-II-Demographic-Profiles.pdf (accessed on 1 June 2019).
  8. Balakrishnan, K.; Chafe, Z.; Kjellstrom, T.; McKone, T.E.; Smith, K.S. Energy poverty and public health assessing the impacts from solid cookfuel. In Energy Poverty: Global Challenges and Local Solutions; Halff, A., Sovacool, B.K., Rozhon, J., Eds.; Oxford University Press: Oxford, UK, 2014; Chapter 6. [Google Scholar] [CrossRef]
  9. Bruce, N.; Ding, C. Health benefits from energy access in LMICs: Mechanisms, impacts, and policy opportunities. In Energy Poverty: Global Challenges and Local Solutions; Halff, A., Sovacool, B.K., Rozhon, J., Eds.; Oxford University Press: Oxford, UK, 2014; Chapter 5. [Google Scholar] [CrossRef]
  10. Day, R.; Walker, G.; Simcock, N. Conceptualising energy use and energy poverty using a capabilities framework. Energy Policy 2016, 93, 255–264. [Google Scholar] [CrossRef]
  11. Zuzhang, X. Unlocking financial resources. In Energy Poverty: Global Challenges and Local Solutions; Halff, A., Sovacool, B.K., Rozhon, J., Eds.; Oxford University Press: Oxford, UK, 2014; Chapter 20. [Google Scholar] [CrossRef]
  12. González-Eguino, M. Energy poverty: An overview. Renew. Sustain. Energy Rev. 2015, 47, 377–385. [Google Scholar] [CrossRef]
  13. The Guardian’s Press Association. Government accused of redefining fuel poverty to bring down figures. The Guardian. 2 December 2013. Available online: https://www.theguardian.com/society/2013/dec/02/government-accused-redefining-fuel-poverty (accessed on 1 June 2019).
  14. Bawden, T. 800,000 people ‘lifted’ out of fuel poverty—By redefining it. Independent. 2 December 2013. Available online: https://www.independent.co.uk/news/uk/politics/800000-people-lifted-out-of-fuel-poverty-by-redefining-it-8976232.html (accessed on 1 June 2019).
  15. Middlemiss, L. A critical analysis of the new politics of fuel poverty in England. Crit. Soc. Policy 2017, 37, 425–443. [Google Scholar] [CrossRef]
  16. Li, K.; Lloyd, B.; Liang, X.J.; Wei, Y.M. Energy poor or fuel poor: What are the differences? Energy Policy 2014, 68, 476–481. [Google Scholar] [CrossRef]
  17. Schumacher, K.; Cludius, J.; Förster, H.; Greiner, B.; Hünecke, K.; Kenkmann, T.; Van-Nuffel, L. How to End Energy Poverty? Scrutiny of Current EU and Member States Instruments. European Parliament. 2015. Available online: http://www.europarl.europa.eu/RegData/etudes/STUD/2015/563472/IPOL_STU(2015)563472_EN.pdf (accessed on 1 June 2019).
  18. Warm Homes and Energy Conservation Act 2000. The Stationery Office Limited 2000. Chapter 31. Available online: https://www.legislation.gov.uk/ukpga/2000/31/pdfs/ukpga_20000031_en.pdf (accessed on 1 June 2019).
  19. The 2017 Scottish Fuel Poverty Definition Review Panel. A New Definition of Fuel Poverty in Scotland, a Review of Recent Evidence; Scottish Goverment: Edinburgh, UK, 2017. Available online: https://www.gov.scot/publications/new-definition-fuel-poverty-scotland-review-recent-evidence/ (accessed on 1 June 2019).
  20. Hinson, S.; Sutherland, N.; Bolton, P.; Kennedy, S. Fuel Poverty; House of Commons Library: London, UK, 2018; Available online: researchbriefings.files.parliament.uk/documents/CDP-2018-0276/CDP-2018-0276.pdf (accessed on 1 June 2019).
  21. Simcock, N.; Walker, G.; Day, R. Fuel poverty in the UK: Beyond heating? People Place Policy 2016, 10, 25–41. [Google Scholar] [CrossRef]
  22. Thomson, H.; Bouzarovski, S. Addressing Energy Poverty in the European Union: State of Play and Action; EU Energy Poverty Observatory, European Commission: Brussels, Belgium, 2018; Available online: https://www.energypoverty.eu/sites/default/files/downloads/publications/18-08/paneureport2018_final_v3.pdf (accessed on 1 June 2019).
  23. Nzobadila, G. A Paper on Energy Poverty in Africa; AFREC: Algiers, Algeria, 2017; Available online: https://afrec-energy.org/Docs/FR/PDF/2017/paper_on_africa_energy_poverty_en.pdf (accessed on 1 June 2019).
  24. Temple, J.B.; Booth, S.; Pollard, C.M. Social assistance payments and food insecurity in Australia: evidence from the household expenditure survey. Int. J. Environ. Res. Public Health 2019, 16, 455. [Google Scholar] [CrossRef]
  25. Poruschi, L.; Ambrey, C.L. Densification, what does it mean for fuel poverty and energy justice? An empirical analysis. Energy Policy 2018, 117, 208–217. [Google Scholar] [CrossRef]
  26. Scarpellini, S.; Hernándezb, M.A.S.; Monevac, J.M.; Portillo-Tarragonac, P.; Rodrı’guez, M.E.L. Measurement of spatial socioeconomic impact of energy poverty. Energy Policy 2019, 124, 320–331. [Google Scholar] [CrossRef]
  27. Bollino, C.A.; Botti, F. Energy poverty in Europe: A multidimensional approach. PSL Q. Rev. 2017, 283, 473–507. [Google Scholar] [CrossRef]
  28. Aristondo, O.; Onainda, E. Inequality of energy poverty between groups in Spain. Energy 2018, 153, 431–442. [Google Scholar] [CrossRef]
  29. Chineyemba, P.U. Energy access in rural areas. In Energy Poverty in Africa, Proceedings of a Workshop held by OFID in Abuja, Nigeria; The OPEC Fund for International Development: Vienna, Austria, 2010; pp. 105–120. Available online: https://invenio.unidep.org/invenio//record/14923/files/ofid_pam39.pdf (accessed on 1 June 2019).
  30. Burlinson, A.; Giulietti, M.; Battisti, G. The elephant in the energy room: Establishing the nexus between housing poverty and fuel poverty. Energy Econ. 2018, 72, 135–144. [Google Scholar] [CrossRef] [Green Version]
  31. Thomson, H.; Snell, C.; Bouzarovski, S. Health, well-being and energy poverty in Europe: a comparative study of 32 European countries. Int. J. Environ. Res. Public Health 2017, 14, 584. [Google Scholar] [CrossRef] [PubMed]
  32. Sadath, A.C.; Acharya, R.H. Assessing the extent and intensity of energy poverty using Multidimensional Energy Poverty Index: Empirical evidence from households in India. Energy Policy 2017, 102, 540–548. [Google Scholar] [CrossRef]
  33. Reyes, R.; Schueftana, A.; Ruiza, C.; Gonzálezb, A.D. Controlling air pollution in a context of high energy poverty levels in southern Chile: Clean air but colder houses? Energy Policy 2019, 124, 301–311. [Google Scholar] [CrossRef]
  34. Dagoumas, A.; Kitsios, F. Assessing the impact of the economic crisis on energy poverty in Greece. Sustain. Cities Soc. 2014, 13, 267–378. [Google Scholar] [CrossRef]
  35. GR Reporter. Smog and high concentrations of particulates in the Greek cities. GR Reporter. 24 December 2013. Available online: http://www.grreporter.info/en/smog_and_high_concentrations_particulates_greek_cities/10467 (accessed on 1 June 2019).
  36. Fuller, G. Air quality worsens in Greece as recession bites. The Guardian. 30 October 2016. Available online: https://www.theguardian.com/environment/2016/oct/30/air-quality-worsens-greece-recession-bites-world-pollutionwatch (accessed on 1 June 2019).
  37. Enet English. Let them eat wood. Enet English. 6 November 2013. Available online: http://www.enetenglish.gr/?i=news.en.article&id=1591 (accessed on 1 June 2019).
  38. Saffari, A.; Daher, N.; Samara, C.; Voutsa, D.; Kouras, A.; Manoli, E.; Karagkiozidou, O.; Vlachokostas, C.; Moussiopoulos, N.; Shafer, M.M.; et al. Increased biomass burning due to the economic crisis in Greece and its adverse impact on wintertime air quality in Thessaloniki. Environ. Sci. Technol. 2013, 47, 13313–13320. [Google Scholar] [CrossRef]
  39. Santamouris, M. Defining the Synergies Between Energy Consumption–Local Climate Change and Energy Poverty. In Minimizing Energy Consumption, Energy Poverty and Global and Local Climate Change in the Built Environment: Innovating to Zero; Santamouris, M., Ed.; Elsevier: Amsterdam, The Netherlands, 2019; pp. 169–194. [Google Scholar]
  40. Price, C.W.; Brazier, K.; Pham, K.; Mathieu, L.; Wang, W. Identifying Fuel Poverty Using Objective and Subjective Measure; CCP Working Paper No. 07–11; Centre for Competition Policy, University of East Anglia: Norwich, UK, 2007. [Google Scholar] [CrossRef]
  41. Meyer, S.; Laurence, H.; Bart, D.; Lucie, M.; Kevin, M. Capturing the multifaceted nature of energy poverty: Lessons from Belgium. Energy Res. Soc. Sci. 2018, 40, 273–283. [Google Scholar] [CrossRef]
  42. Papada, L.; Kaliampakos, D. Measuring energy poverty in Greece. Energy Policy 2016, 94, 157–165. [Google Scholar] [CrossRef]
  43. Aristondo, O.; Onaindiab, E. Counting energy poverty in Spain between 2004 and 2015. Energy Policy 2018, 113, 420–429. [Google Scholar] [CrossRef]
  44. Maxim, A.; Mihai, C.; Apostoaie, C.M.; Popescu, C.; Istrate, C.; Bostan, I. Implications and measurement of energy poverty across the European Union. Sustainability 2016, 8, 483. [Google Scholar] [CrossRef]
  45. Ntaintasisa, E.; Mirasgedisa, S.; Tourkolias, C. Comparing different methodological approaches for measuring energy poverty: Evidence from a survey in the region of Attika, Greece. Energy Policy 2019, 125, 160–169. [Google Scholar] [CrossRef]
  46. Okushima, S. Gauging energy poverty: A multidimensional approach. Energy 2017, 137, 1159–1166. [Google Scholar] [CrossRef] [Green Version]
  47. Gouveia, J.P.; Palma, P.; Simoes, S.G. Energy poverty vulnerability index: A multidimensional tool to identify hotspots for local action. Energy Rep. 2019, 5, 187–201. [Google Scholar] [CrossRef]
  48. Llera-Sastresa, E.; Scarpellini, S.; Rivera-Torres, P.; Aranda, J.; Zabalza-Bribián, I.; Aranda-Usón, A. Energy vulnerability composite index in social housing, from a household energy poverty perspective. Sustainability 2017, 9, 691. [Google Scholar] [CrossRef]
  49. Romero, J.C.; Linares, P.; López, X. The policy implications of energy poverty indicators. Energy Policy 2018, 115, 98–108. [Google Scholar] [CrossRef]
  50. Sànchez, C.S.; Gonzàlez, F.J.N.; Aja, A.H. Energy poverty methodology based on minimal thermal habitability conditions for low income housing in Spain. Energy Build. 2018, 169, 127–140. [Google Scholar] [CrossRef]
  51. Wang, K.; Wang, Y.; Li, K.; Wei, Y. Energy poverty in China: An index based comprehensive evaluation. Renew. Sustain. Energy Rev. 2015, 47, 308–323. [Google Scholar] [CrossRef]
  52. Okushima, S. Measuring energy poverty in Japan, 2004–2013. Energy Policy 2016, 98, 557–564. [Google Scholar] [CrossRef]
  53. Papada, L.; Kaliampakos, D. A Stochastic Model for energy poverty analysis. Energy Policy 2018, 116, 153–164. [Google Scholar] [CrossRef]
  54. Barnes, D.; Khandker, S.R.; Samad, H.A. Energy poverty in rural Bangladesh. Energy Policy 2011, 39, 894–904. [Google Scholar] [CrossRef]
  55. Bonatz, N.; Guo, R.; Wu, W.; Liu, L. A comparative study of the interlinkages between low carbon development and energy poverty in China and Germany by developing an energy poverty index. Energy Build. 2019, 183, 817–831. [Google Scholar] [CrossRef]
  56. Nussbaumer, P.; Bazilian, M.; Modi, V.; Yumkella, K. Measuring energy poverty: Focusing on what matters. Renew. Sustain. Energy Rev. 2012, 16, 231–243. [Google Scholar] [CrossRef] [Green Version]
  57. Nussbaumer, P.; Nerini, F.; Onyeji, I.; Howells, M. Global Insights Based on the Multidimensional Energy Poverty Index (MEPI). Sustainability 2013, 5, 2060–2076. [Google Scholar] [CrossRef] [Green Version]
  58. Olang, T.A.; Esteban, M.; Gasparatos, A. Lighting and cooking fuel choices of households in Kisumu City, Kenya: A multidimensional energy poverty perspective. Energy Sustain. Dev. 2018, 42, 1–13. [Google Scholar] [CrossRef]
  59. Mastrucci, A.; Byers, E.; Pachauri, S.; Rao, N.D. Improving the SDG energy poverty targets: residential cooling needs in the Global South. Energy Build. 2019, 186, 405–415. [Google Scholar] [CrossRef]
  60. Karásek, J.; Pojar, J. Programme to reduce energy poverty in the Czech Republic. Energy Policy 2018, 115, 131–137. [Google Scholar] [CrossRef]
  61. Oppenheim, J. The United States regulatory compact and energy poverty. Energy Res. Soc. Sci. 2016, 18, 96–108. [Google Scholar] [CrossRef]
  62. Scarpellini, S.; Hernández, M.A.S.; Llera-Sastresa, E.; Aranda, J.A.; Rodríguez, M.E.L. The mediating role of social workers in the implementation of regional policies targeting energy poverty. Energy Policy 2017, 106, 367–375. [Google Scholar] [CrossRef]
  63. Daily Mail Press Association. Labour launches Christmas campaign against fuel poverty. Daily Mail. 2 December 2018. Available online: https://www.dailymail.co.uk/wires/pa/article-6453125/Labour-launches-Christmas-campaign-against-fuel-poverty.html (accessed on 1 June 2019).
  64. Long-Bailey, R. Theresa May’s half-baked imitation of Labour’s energy price cap will cost bill payers dearly. The Independent. 13 May 2017. Available online: https://www.independent.co.uk/voices/rebecca-long-bailey-energy-price-caps-manifesto-promises-tory-policies-fuel-poverty-a7733921.html (accessed on 1 June 2019).
  65. Aranda, J.; Zabalza, I.; Conserva, A.; Millán, G. Analysis of energy efficiency measures and retrofitting solutions for social housing buildings in spain as a way to mitigate energy poverty. Sustainability 2017, 9, 1869. [Google Scholar] [CrossRef]
  66. Zhu, Y.; Fan, X.; Wang, C.; Sang, G. Analysis of heat transfer and thermal environment in a rural residential building for addressing energy poverty. Appl. Sci. 2018, 8, 2077. [Google Scholar] [CrossRef]
  67. Sovacool, B.K. Fuel poverty, affordability, and energy justice in England: Policy insights from the Warm Front Program. Energy 2015, 93, 361–371. [Google Scholar] [CrossRef]
  68. Longe, O.M.; Ouahada, K. Mitigating Household Energy Poverty through Energy Expenditure Affordability Algorithm in a Smart Grid. Energies 2018, 11, 947. [Google Scholar] [CrossRef]
  69. Korkovelos, A.; Mentis, D.; Siyal, S.H.; Arderne, C.; Rogner, H.; Bazilian, M.; Howells, M.; Beck, H.; Roo, A.D. A geospatial assessment of small-scale hydropower potential in Sub-Saharan Africa. Energies 2018, 11, 3100. [Google Scholar] [CrossRef]
  70. Zubi, G.; Fracastoro, G.V.; Lujano-Rojas, J.M.; El Bakari, K.; Andrews, D. The unlocked potential of solar home systems; an effective way to overcome domestic energy poverty in developing regions. Renew. Energy 2019, 132, 1425–1435. [Google Scholar] [CrossRef]
  71. Yadav, P.; Malakar, Y.; Davies, P.J. Multi-scalar energy transitions in rural households: Distributed photovoltaics as a circuit breaker to the energy poverty cycle in India. Energy Res. Soc. Sci. 2019, 48, 1–12. [Google Scholar] [CrossRef]
  72. Santamouris, M. Eradicating energy poverty in the developed world. In Minimizing Energy Consumption, Energy Poverty and Global and Local Climate Change in the Built Environment: Innovating to Zero; Santamouris, M., Ed.; Elsevier: Amsterdam, The Netherlands, 2019; pp. 309–326. [Google Scholar] [CrossRef]
  73. Worldbank. Consumer Price Index (2010 = 100). 2019. Available online: https://data.worldbank.org/indicator/FP.CPI.TOTL (accessed on 1 June 2019).
  74. Worldbank. Population Growth (Annual %). 2019. Available online: https://data.worldbank.org/indicator/SP.POP.GROW (accessed on 1 June 2019).
  75. Probst, L.; Pedersen, B.; Dakkak-Arnoux, L. Big Data in Earth Observation (Report for the European Commission, Directorate-General); European Commission-Digital Transformation Monitor, Innovation and Advanced Manufacturing; Unit F/3 KETs, Digital Manufacturing and Interoperability by the Consortium Composed of PwC, CARSA, IDATE and ESN, under the contract Digital Entrepreneurship Monitor (EASME/COSME/2014/004). 2017. Available online: https://ec.europa.eu/growth/tools-databases/dem/monitor/sites/default/files/DTM_Big%20Data%20in%20Earth%20Observation%20v1.pdf (accessed on 1 June 2019).
  76. Varshney, K.R.; Chen, G.H.; Abelson, B.; Nowocin, K.; Sakhrani, V.; Xu, L.; Spatocco, B.L. Targeting villages for rural development using satellite image analysis. Big Data 2015, 3, 41–53. [Google Scholar] [CrossRef]
  77. E.ON. One Giant Leap For Energy Efficiency. E.ON Blog, 2018. Available online: https://www.eonenergy.com/blog/2018/October/satellite-images-technology (accessed on 1 June 2019).
  78. E.ON. One gIant Leap for Energy Efficiency: E.ON Working with Astrosat and the European Space Agency to Tackle Fuel Poverty and Carbon Emissions. E.ON Blog, 2018. Available online: https://www.eonenergy.com/about-eon/media-centre/one-giant-leap-for-energy-efficiency-eon-working-with-astrosat-and-the-european-space-agency-to-tackle-fuel-poverty-and-carbon-emissions/ (accessed on 1 June 2019).
  79. Duque, J.C.; Patino, J.E.; Ruiz, L.A.; Pardo-Pascual, J.E. Measuring intra-urban poverty using land cover and texture metrics derived from remote sensing data. Landsc. Urban Plan. 2015, 135, 11–21. [Google Scholar] [CrossRef]
  80. Watmough, G.R.; Marcinko, C.L.; Sullivan, C.; Tschirhart, K.; Mutuo, P.K.; Palm, C.A.; Svenning, J.C. Socioecologically informed use of remote sensing data to predict rural household poverty. PNAS 2019, 116, 1213–1218. [Google Scholar] [CrossRef] [PubMed] [Green Version]
  81. Sutton, P.C.; Elvidge, C.D.; Ghosh, T. Estimation of gross domestic product at sub- national scales using nighttime satellite imagery. Int. J. Ecol. Econ. Stat. 2007, 8, 5–21. [Google Scholar]
  82. Chen, X.; Nordhaus, W.D. Using luminosity data as a proxy for economic statistics. Proc. Natl. Acad. Sci. USA 2011, 108, 8589–8594. [Google Scholar] [CrossRef] [Green Version]
  83. Henderson, J.V.; Storeygard, A.; Weil, D. Measuring economic activity from outer space. Am. Econ. Rev. 2012, 102, 994–1028. [Google Scholar] [CrossRef] [PubMed]
  84. Mellander, C.; Stolarick, K.; Matheson, A.; Lobo, J. Night-Time Light Data: A Good Proxy Measure for Economic Activity? CESIS Electronic Working Paper Series Number 315; Royal Institute of Technology: Stockholm, Netherland, 2013; Available online: https://static.sys.kth.se/itm/wp/cesis/cesiswp315.pdf (accessed on 1 June 2019).
  85. Michalopoulos, S.; Papaioannou, E. National institutions and subnational development in Africa. Q. J. Econ. 2013, 129, 151–213. [Google Scholar] [CrossRef]
  86. Lee, Y.S. Countering Sanctions: The Unequal Geographic Impact of Economic Sanctions on North Korea; Stanford University FSI Working Paper; Stanford University: Stanford, CA, USA, 2016. [Google Scholar]
  87. World Bank. East Asia’s Changing Urban Landscape: Measuring a Decade of Spatial Growth; World Bank: Washington, DC, USA, 2015. [Google Scholar]
  88. Bundervoet, T.; Maiyo, L.; Sanghi, A. Bright Lights, Big Cities: Measuring National and Subnational Economic Growth in Africa from Outer Space, with an Application to Kenya and Rwanda; World Bank Policy Research Working Paper 7461; World Bank Group: Washington, DC, USA, 2015. [Google Scholar]
  89. Weidmann, N.B.; Schutte, S. Using night light emissions for the prediction of local wealth. J. Peace Res. 2017, 54, 125–140. [Google Scholar] [CrossRef]
  90. Pinkovskiy, M.; Sala-i-Martin, X. Lights, camera … income! Illuminating the national accounts-household surveys debate. Q. J. Econ. 2016, 131, 579–631. [Google Scholar] [CrossRef]
  91. Jean, N.; Burke, M.; Xie, M.; Davis, W.M.; Lobell, D.B.; Emon, S. Combining satellite imagery and machine learning to predict poverty. Science 2016, 353, 790–794. [Google Scholar] [CrossRef] [Green Version]
  92. Xie, M.; Jean, N.; Burke, M.; Lobell, D.; Ermon, S. Transfer Learning from Deep Features for Remote Sensing and Poverty Mapping. arXiv 2015, arXiv:1510.00098. [Google Scholar]
  93. Head, A.; Manguin, M.; Tran, N.; Blumenstock, J.E. Can human development be measured with satellite imagery? In Proceedings of the ICTD’17, Lahore, Pakistan, 16–19 November 2017. [Google Scholar] [CrossRef]
  94. Engstrom, R.; Hersh, J.; Newhouse, D. Poverty from Space; Using High-Resolution Satellite Imagery for Estimating Economic Well-Being. World Bank Group, Poverty and Equity Global Practice Group. December 2017. Available online: http://documents.worldbank.org/curated/en/610771513691888412/pdf/WPS8284.pdf (accessed on 1 June 2019).
  95. Gram-Hansen, B.J.; Helber, P.; Varatharajan, I.; Azam, F.; Coca-Castro, A.; Kopackova, V.; Bilinski, P. Mapping Informal Settlements in Developing Countries using Machine Learning and Low Resolution Multi-spectral Data. In Proceedings of the AIES’ 19, Honolulu, HI, USA, 27–28 January 2019; Available online: https://arxiv.org/pdf/1901.00861.pdf (accessed on 1 June 2019).
  96. Abelson, B.; Varshney, K.R.; Sun, J. Targeting direct cash transfers to the extremely poor. In Proceedings of the 20th ACM SIGKDD International Conference on Knowledge Discovery and Data Mining, New York, NY, USA, 24–27 August 2014; pp. 1563–1572. [Google Scholar] [CrossRef]
  97. Babenko, B.; Hersh, J.; Newhouse, D.; Ramakrishnan, A.; Swartz, T. Poverty mapping using convolutional neural networks trained on high and medium resolution satellite images, with an application in Mexico. In Proceedings of the NIPS 2017: Neural Information Processing Systems Workshop on Machine Learning for the Developing World, Long Beach, CA, USA, 4–9 December 2017. [Google Scholar]
  98. Zhao, X.; Yu, B.; Liu, Y.; Chen, Z.; Li, Q.; Wang, C.; Wu, J. Estimation of poverty using random forest regression with multisource data: A case study in Bangladesh. Remote Sens. 2019, 11, 375. [Google Scholar] [CrossRef]
  99. Perez, A.; Yeh, C.; Azzari, G.; Burke, M.; Lobell, D.; Ermon, S. Poverty Prediction with Public Landsat 7 Satellite Imagery and Machine Learning. In Proceedings of the 31st Conference on Neural Information Processing Systems (NIPS 2017), Long Beach, CA, USA, 10 November 2017. [Google Scholar]
  100. Hassani, H.; Huang, X.; Silva, E. Digitalisation and big data mining in banking. Big Data Cogn. Comput. 2018, 2, 18. [Google Scholar] [CrossRef]
  101. Hassani, H.; Huang, X.; Silva, E. Big-Crypto: Big data, blockchain and cryptocurrency. Big Data Cogn. Comput. 2018, 2, 34. [Google Scholar] [CrossRef]
  102. Guo, H.D.; Zhang, L.; Zhu, L.W. Earth observation big data for climate change research. Adv. Clim. Chang. Res. 2015, 6, 108–117. [Google Scholar] [CrossRef]
  103. Hassani, H.; Huang, X.; Silva, E. Big data and climate change. Big Data Cogn. Comput. 2019, 3, 12. [Google Scholar] [CrossRef]
  104. Varotsos, C.A.; Krapivin, V.F. A new big data approach based on geoecological information-modeling system. Big Earth Data 2017, 1, 47–63. [Google Scholar] [CrossRef] [Green Version]
  105. Ghodsi, M. A brief review of recent data mining applications in the energy industry. Int. J. Energy Stat. 2014, 2, 49–57. [Google Scholar] [CrossRef]
  106. Hassani, H.; Silva, E.S. Big Data: A big opportunity for the petroleum and petrochemical industry. OPEC Energy Rev. 2018, 42, 74–89. [Google Scholar] [CrossRef]
  107. Hassani, H.; Silva, E.S. Forecasting with big data: A review. Ann. Data Sci. 2015, 2, 5–19. [Google Scholar] [CrossRef]
  108. Hassani, H.; Huang, X.; Ghodsi, M. Big data and causality. Ann. Data Sci. 2017, 5, 133–156. [Google Scholar] [CrossRef]
  109. Lerner, A.; Dalphond, Z.V.; Gee, M.; Plagge, T. Energy Analytics for Development: Big Data for Energy Access, Energy Efficiency, and Renewable Energy; ESMAP Knowledge Series, no. 027/17; World Bank Group: Washington, DC, USA, 2017; pp. 4–5. Available online: https://www.esmap.org/node/137965 (accessed on 1 June 2019).
  110. Business Reporter. Africa’s increasing demand for energy. Business Reporter. January 2019. Available online: https://www.iol.co.za/business-report/energy/africas-increasing-demand-for-energy-18756239 (accessed on 1 June 2019).
  111. The Value Portfolio, Africa–Huge Oil Demand. Seekingalpha.com, 12 May 2015. Available online: https://seekingalpha.com/article/3172826-africa-huge-oil-demand (accessed on 1 June 2019).
  112. PWC. Africa Oil and Gas Review, Current Developments and a Look into the Future. PWC.com, November 2018. Available online: https://www.pwc.co.za/en/assets/pdf/africa-oil-and-gas-review-2018.pdf (accessed on 1 June 2019).
  113. Economist Intelligence Unit, Mixed outlook for Africa’s could-be LNG exporters. Economist Intelligence Unit. 25 October 2017. Available online: http://www.eiu.com/industry/article/86024592/mixedoutlook-for-africas-could-be-lng-exporters/2017-10-25 (accessed on 1 June 2019).
  114. OPEC Secretariat. OPEC Annual Statistical Bulletin; OPEC: Vienna, Austria, 2018; p. 48. Available online: www.opec.org (accessed on 1 June 2019).
  115. Botes, A.; Lane, A. Corlenissen, Africa oil and Gas State of Play. Deloitte. November 2018. Available online: https://www2.deloitte.com/za/en/pages/energy-and-resources/articles/africa-oil-gas-state-of-play.html (accessed on 1 June 2019).
  116. Editorial Staff Aboutenergy, The African Economy Grows and Demand for Oil and Gas Increases. Aboutenergy.com, 16 May 2018. Available online: https://www.aboutenergy.com/en_IT/briefs/african-economy-grows-demand-for-oil-and-gas-increases.shtml# (accessed on 1 June 2019).
  117. World Economic Forum, Energy Access Africa. weforum.org. Available online: https://www.weforum.org/projects/energy-access-africa (accessed on 29 May 2019).
  118. OPEC Fund for International Development. ofid.org. Available online: http://www.ofid.org/FOCUS-AREAS/Energy (accessed on 29 May 2019).
Figure 1. Number of publications by “Elsevier Science Direct” and “Wiley Online Library” with the keywords “Energy Poverty” or “Fuel Poverty”.
Bdcc 03 00050 g001
Figure 2. The satellite image of earth at night. The dark places show low access to energy and potential of high energy poverty (image downloaded from geology.com).
Bdcc 03 00050 g002
Figure 3. Using big data for energy poverty alleviation.
Bdcc 03 00050 g003
Table 1. Indicators proposed for energy poverty measurement.
CategoryIndicatorCountry/Region Applied to
Household’s feelingFeeling Fuel Poor [40,41]UK, Belgium
(self-reported)Inability to keep homeGreece, Spain, EU
adequately warm/cool/bright [27,41,42,43,44,45]Attika(Greece), Belgium
Restriction of otherGreece, Attika(Greece)
essential needs [41,42,45]Belgium
Health problems linked withGreece, Attika(Greece)
poor heating conditions [42,45]
Household’sHousehold’s size (Number of adultsUK, Japan, Portugal
characteristicsand children) [40,46,47,48]Zaragoza(Spain)
Income [41,46,47,48,49]Japan, Portugal,
Zaragoza(Spain), Belgium
Social service aid [48]Zaragoza(Spain)
Education level [47]Portugal
Spatial/climatic zone and altitude [42,47,48,50,51]Greece, Portugal, Spain,
Zaragoza(Spain), China
Ownership, Residence type, dwelling size [42,45,48]Greece, Attika(Greece),
Zaragoza(Spain)
Fuel/Energy costExpenditure Fuel Poverty (Energy costsUK, Japan, Greece,
more than 10% of income) [40,45,46,49,50,52,53]Attika(Greece), Spain
Ratio of energy cost toBangladesh, Greece,
income/Low Income High Cost [41,45,49,50,51,53,54,55]Attika(Greece), Spain,
China, Germany, Belgium
Energy expense/Energy tariff [41,48,55]Zaragoza(Spain), China,
Germany, Belgium
Arrears on energy/utilitiesGreece, Spain,
bills [27,42,43,44,45]Portugal, EU, Attika(Greece)
Access to modern/Access to electricity,Bangladesh, India, Africa,
clean energynatural gas, biogas [32,51,54,55,56,57]All countries (with available
data), China, Germany
Cooking/lighting energy [32,51,56,57,58]Kisumu City(Kenya), India,
Africa, All countries
(with available data), China
Indoor pollution [56,57,58]Kisumu City(Kenya),
Africa, All countries
(with available data)
Household appliance ownership [51,56,57,58]Kisumu City(Kenya),
Africa, All countries
(with available data), China
Entertainment or educationKisumu City(Kenya),
appliance ownership [56,57,58]Africa, All countries
(with available data)
Telecommunication means [56,57,58]Kisumu City(Kenya),
Africa, All countries
(with available data)
Table 2. Indicators proposed for energy poverty measurement (Continuation).
CategoryIndicatorCountry/Region Applied to
Energy efficiencyRatio of end-use energy toBangladesh, China, Germany
total energy [54,55]
Energy gap (difference betweenPortugal, Global South,
building’s energy demandAttika(Greece), China, Germany
and consumption) [45,47,55,59]
Type of heating/cooling system [42,45,48,50,55,59]Greece, Global South,
Attika(Greece), Spain,
Zaragoza(Spain), China, Germany
dwelling insulation againstEU, Global South
the cold/warm [27,41,59]Belgium
Year of house constructionGreece, Japan, Portugal,
(housing’s age) [42,45,46,47,48,59]Global South, Attika(Greece),
Zaragoza(Spain)
Leakage, damp walls, mold,Greece, Spain, EU,
rotten windows [27,42,43,44,45,47,55,59]Portugal, Global South,
Attika(Greece), China, Germany
Table 3. Rate of Electricity Access, Summary by Region, Source: International Energy Agency (IEA), World Energy Outlook-2018.
2000200520102017
WORLD73%76%80%87%
Developing Countries64%69%74%83%
Africa35%39%43%52%
North Africa90%96%99%100%
Sub-Saharan Africa23%28%32%43%
Developing Asia67%74%79%91%
China99%99%99%100%
India43%58%66%87%
Indonesia53%56%67%95%
Other Southeast Asia68%76%84%88%
Other Developing Asia38%45%58%76%
Central and South America86%90%94%96%
Middle East91%80%91%92%
Table 4. Primary energy consumption in Africa (units in Mtoe unless otherwise noted)/BP Energy Outlook 2019.
LevelSharesChange (abs.)Change (%)Change (Annual)
2017204020172040199520171995201719952017
−2017−2040−2017−2040−2017−2040
Oil(Mb/d) *4744%34%2385%77%2.8%2.5%
Gas(Bcm)14233627%28%96195207%137%5.2%3.8%
Coal9313621%13%144317%46%0.7%1.7%
Nuclear481%1%1539%126%1.5%3.6%
Hydro29806%8%1651115%174%3.5%4.5%
Renewables61611%16%5156>1000%>1000%>10%>10%
Transport **12623428%23%67108115%85%3.5%2.7%
Industry **17842540%42%6724760%139%2.2%3.9%
Noncombusted **20474%5%62840%139%1.6%3.9%
Buildings **12531228%31%66187111%149%3.4%4.1%
Power18550241%49%8731790%171%2.9%4.4%
Total4491019 20656985%127%2.8%3.6%
* Oil demand includes consumption of all liquid hydrocarbons but excluded biofuels. ** Includes electricity and the associated conversion losses in power generation. Mtoe: Million tones of oil equivalent, Mb/d: Millions of barrels per day, Bcm: Billion cubic metres.

