1. Introduction and Related Research
Over the last decade, the notion of Big Data has been used to describe the nature and complexity of data across different sectors, notably in banking, government, business, healthcare and telecommunications [
1]. Despite the exponential growth of research on Big Data in many areas, there is a limited body of research in the use of Big Data in higher education [
2]. It has been indicated that within the higher education sector, Big Data has enormous potential for transforming the sector, primarily, through the utilisation of analytics, data visualisation and security [
3].
The use of Big Data in Higher Education will inspire teacher inquiry, provide opportunities to systematically investigate teaching activities, to discover techniques for outlining better learning contexts [
4] and provide insights for teachers to reflect on their teaching practice and how that might affect learning outcomes [
5]. According to a research report by OECD [
6], using a data-driven approach is among the primary concerns of international education policies for consistently monitoring and advancing teaching and learning circumstances. Data-driven teacher evaluation is concerned with the development of a teacher self-guided improvement cycle, from a formative perspective [
7]. Despite increased demand for teachers to engage in inquiry, some limitations can hinder the adoption of Big Data in educational settings. For example, higher education larks the required infrastructure capable of managing the vast number of links required to couple scattered institutional data points [
2,
8], which in turn hinders the retrospective analysis of data as well as having real-time access to continuous stream of data. Many teachers need adequate skills and knowledge required for the analysis and interpretation of educational data [
9]. Demand for real-time or near real-time data collection, analysis and visualisation [
10]. Greer and Mark [
11], recommend the utilisation of visual techniques to identify valuable patterns in educational data that may not be apparent to many teachers working with ordinary statistical methods. Visualisation dashboards will help teachers with limited numerical knowledge to effortlessly understand and utilise teaching data [
12,
13]. There are also challenges associated with the use of Big Data such as privacy and access to educational data [
2,
8,
14,
15]. To address these challenges, educational data-driven approaches such as educational data mining and learning analytics have been proposed.
Daniel [
16], proposed Data Science as the fourth research methodology tradition, which appeals to new ways of conducting educational research within the parameters of Big Data in Higher Education. It is suggested that Big Data in education, presents teachers and researchers with powerful methods for discovering hidden patterns which might not be achievable with small data [
17].
In this research, we propose a Data Science approach to educational data focused on teaching analytics. Our approach is novel in many ways. First, we show that educational researchers can experiment and work with Big Data to inspire and improve teaching, as well as change the way teachers measure what is considered a successful teaching outcome. Due to many privacy concerns, we simulated student evaluation data on teaching and used it to show how teachers can monitor their teaching performance. We used Splunk as a platform for the acquisition, analysis and presentation of visualisation dashboards. The motivation for this research is to assist the teachers to engage in self-evaluation and inquiry to improve there teaching practices.
2. Big Data and Analytics in Educational Research
Digital data collection and storage is accelerating at exponential rates (gigabits:
, terabytes:
, petabytes:
, exabyte:
, zettabyte:
and yottabyte:
). The progress in collecting, storing, analysing, visualising and acting on this massive number of datasets accumulating at diverse levels and different rates is triggering increasing interest in Big Data research. Siemens and Long [
18] stated that Big Data could offer many benefits to the future of higher education. Also, Wagner and Ice [
19], traced how technological advancements have triggered the development of analytics in higher education.
Big Data in higher education refers to the conceptualisation of data collection processes within both operational and administrative activities which can be directed towards performance measurement; to recognise problems and solutions that are likely to occur. Big Data is described as a framework to predict future problems, future performance outcomes and prescribe solutions about academic programs, teaching, learning and research [
8,
20,
21]. The growing research into Big Data in higher education has led to renewed interests in the use of analytics, virtual reality, augmented reality and other related fields [
22,
23,
24,
25].
Russom [
26], defined Big Data as an application of business intelligence or analytics characterised by a set of advanced technologies, processes and tools that rely on data (human, entity or machine data) as the backbone to both inform and predict knowledge. Big Data is also considered as a computational approach that can be used to arrive at a clear, precise, and consistent understanding of data, and to transform data into insights. As a paradigm, analytics is a continuously emerging process that has changed significantly over the years and is progressing quickly today.
Evans and Lindner [
27] broadly grouped analytics into three categories; descriptive, predictive and prescriptive. These different forms of analytics are used to empower decision-makers in higher education to make evidence-based decisions. For example, the University of Nevada, Las Vegas used analytics to enhance the student experience, by collecting student learning and navigational patterns using learning devices and environments to analyse current and historical data. This was achieved with the implementation of a Big Data enterprise system, that automatically predicted the population of at-risk students and prescribed real solutions that triggered alerts to students at risk [
28].
Descriptive analytics is used to answer the what/why question (e.g., what happened? why did it happen?). It attempts to gain insight from modelling the behaviour of both past and present data by applying simple statistical techniques such as mean, median, mode, standard deviation, variance, and frequency to model past behaviour [
29,
30]. For example, the teacher’s dashboard showing teachers a single performance score on a course within a specified period.
Predictive analytics attempts to answer the what/when question (e.g., what will happen tomorrow? When will it happen, and perhaps how would it happen?). Predictive analytics use data from the past, through applying statistical and machine learning techniques such as regression, supervised, unsupervised, re-enforcement, and deep learning techniques to predict future events [
31,
32,
33].
Prescriptive analytics attempts to answer the what/how question (e.g., what can be done to make it better? How can it be made better?). It thus combines results from both descriptive and predictive analytics to determine the optimal action needed to enhance the business processes as well as the cause-effect relationship [
30,
34]. For example, prescriptive analytics could be applied to determine students pathways based on their performance and interests.
Application of analytics to educational data could help identify useful hidden patterns and trends [
11]. Educational analytics refers to the process of extracting insight from large amount of educational data utilising the power of analytics broadly understood within Educational Data Mining, Academic Analytics, Learning Analytics and Teaching Analytics [
2,
35].
2.1. Educational Data Mining (EDM)
EDM is concerned with the application of data mining techniques on educational data with the goal of addressing educational challenges and discovering hidden insights in data [
35]. Data may include mining student demographic data and navigation behaviour within a learning environment, learning activities data such as quizzes, interactive class exercises/activities, as well as data from a group of students working together in an exercise, text chat forum, teacher data, administrative data, demographic data, and emotional data. EDM can be employed to access student-learning outcomes, enhance learning processes and supervise student learning to give feedback. Data can also be used to offer recommendations to suit the learning behaviour of students based on individuals, evaluation of learning design as well as the discovery of irregular learning behaviours [
36]. For instance, Ayesha, et al. [
37] reported on how the learning activities of students were predicted with the application of k-means clustering algorithm. Pal [
38] employed machine-learning algorithm to determine fresh engineering undergraduates that were anticipated to drop out in their initial year. Parack, et al. [
39] applied various data mining algorithms to carry out student profiling to categorise them given their academic records that include practical test scores, quiz scores, exam scores and assessment grades.
2.2. Academic Analytics
Academic Analytics is concerned with the collection, analysis, and visualisation of academic program activities such as courses, degree programs; research, revenue of students’ fees, course evaluation, resource allocation and management to generate institutional insight. Daniel [
2], suggested that academic analytics could be used to address issues of program performance at an institutional level. These forms of analytics can also be used to provide meaningful summarised data to help the higher education principal officers, executives and administrators in making informed decisions. Gupta and Choudhary [
40], view academic analytics as a means of providing some level of awareness to improve the quality of higher education. Academic analytics is also used to address the desire for accountability for the various institutional stakeholders who care about student success rates, given the widespread interest over the cost of education and the challenging budgetary and economic limitations predominating worldwide [
41]. Academic analytics can be used to support those with the responsibility of strategic planning in higher education to collect, analyse, report, measure, interpret and share data that relates academic program operational activities efficiently; such that the strengths, weaknesses, opportunities and threats of students can be easily identified to facilitate adequate reforms [
8].
2.3. Learning Analytics (LA)
According to Daniel [
16], LA has become a phenomenon in higher education due to the massive digital footprints generated by students in this digital age. Research into learning analytics originated from student retention concerns as well as brought about the invention of the Course Signal System [
42]. Siemens and Long [
18] said LA is interested in the collection, analysis, and visualisation of students’ data to gain meaningful insights capable of improving learning environments.
On a broader view, LA techniques measures educational data and aim at improving educational effectiveness. Siemens and Long [
18], developed a LA Cycle Model composed of five elements; Course Level (learning trails, social network analysis), Educational Data Mining (predictive model, clustering, pattern mining), Intelligent Curriculum (sentimental defined curriculum), Adaptive Content (content adapts to learning behaviours) and Adaptive Learning (changes to learning processes such as social interactions and learning activities). Finally, LA focuses primarily on the learner; how to analyse learners’ activities to improve the learning outcome.
2.4. Teaching Analytics (TA)
TA refers to the analysis of teaching activities and performance data as well as the design, development and evaluation of teaching activities. The outcome of TA is the development of a teaching outcome model (TOM). Teaching analytics uses visual analytics tools and methods for the teachers to provide them with useful insights for enhancing teaching practice and further enrich student learning [
43]. TA can be used to enhance teaching practice and learning outcomes [
44]. Visualisation dashboards can be explored to facilitate useful dialogue and encourage a culture of data-informed decision making in higher education. TA supports the creation of personalised teaching dashboards that can help teachers monitor their own activities, measure performance, and generally reflect on their teaching practice and learning outcomes [
12,
13].
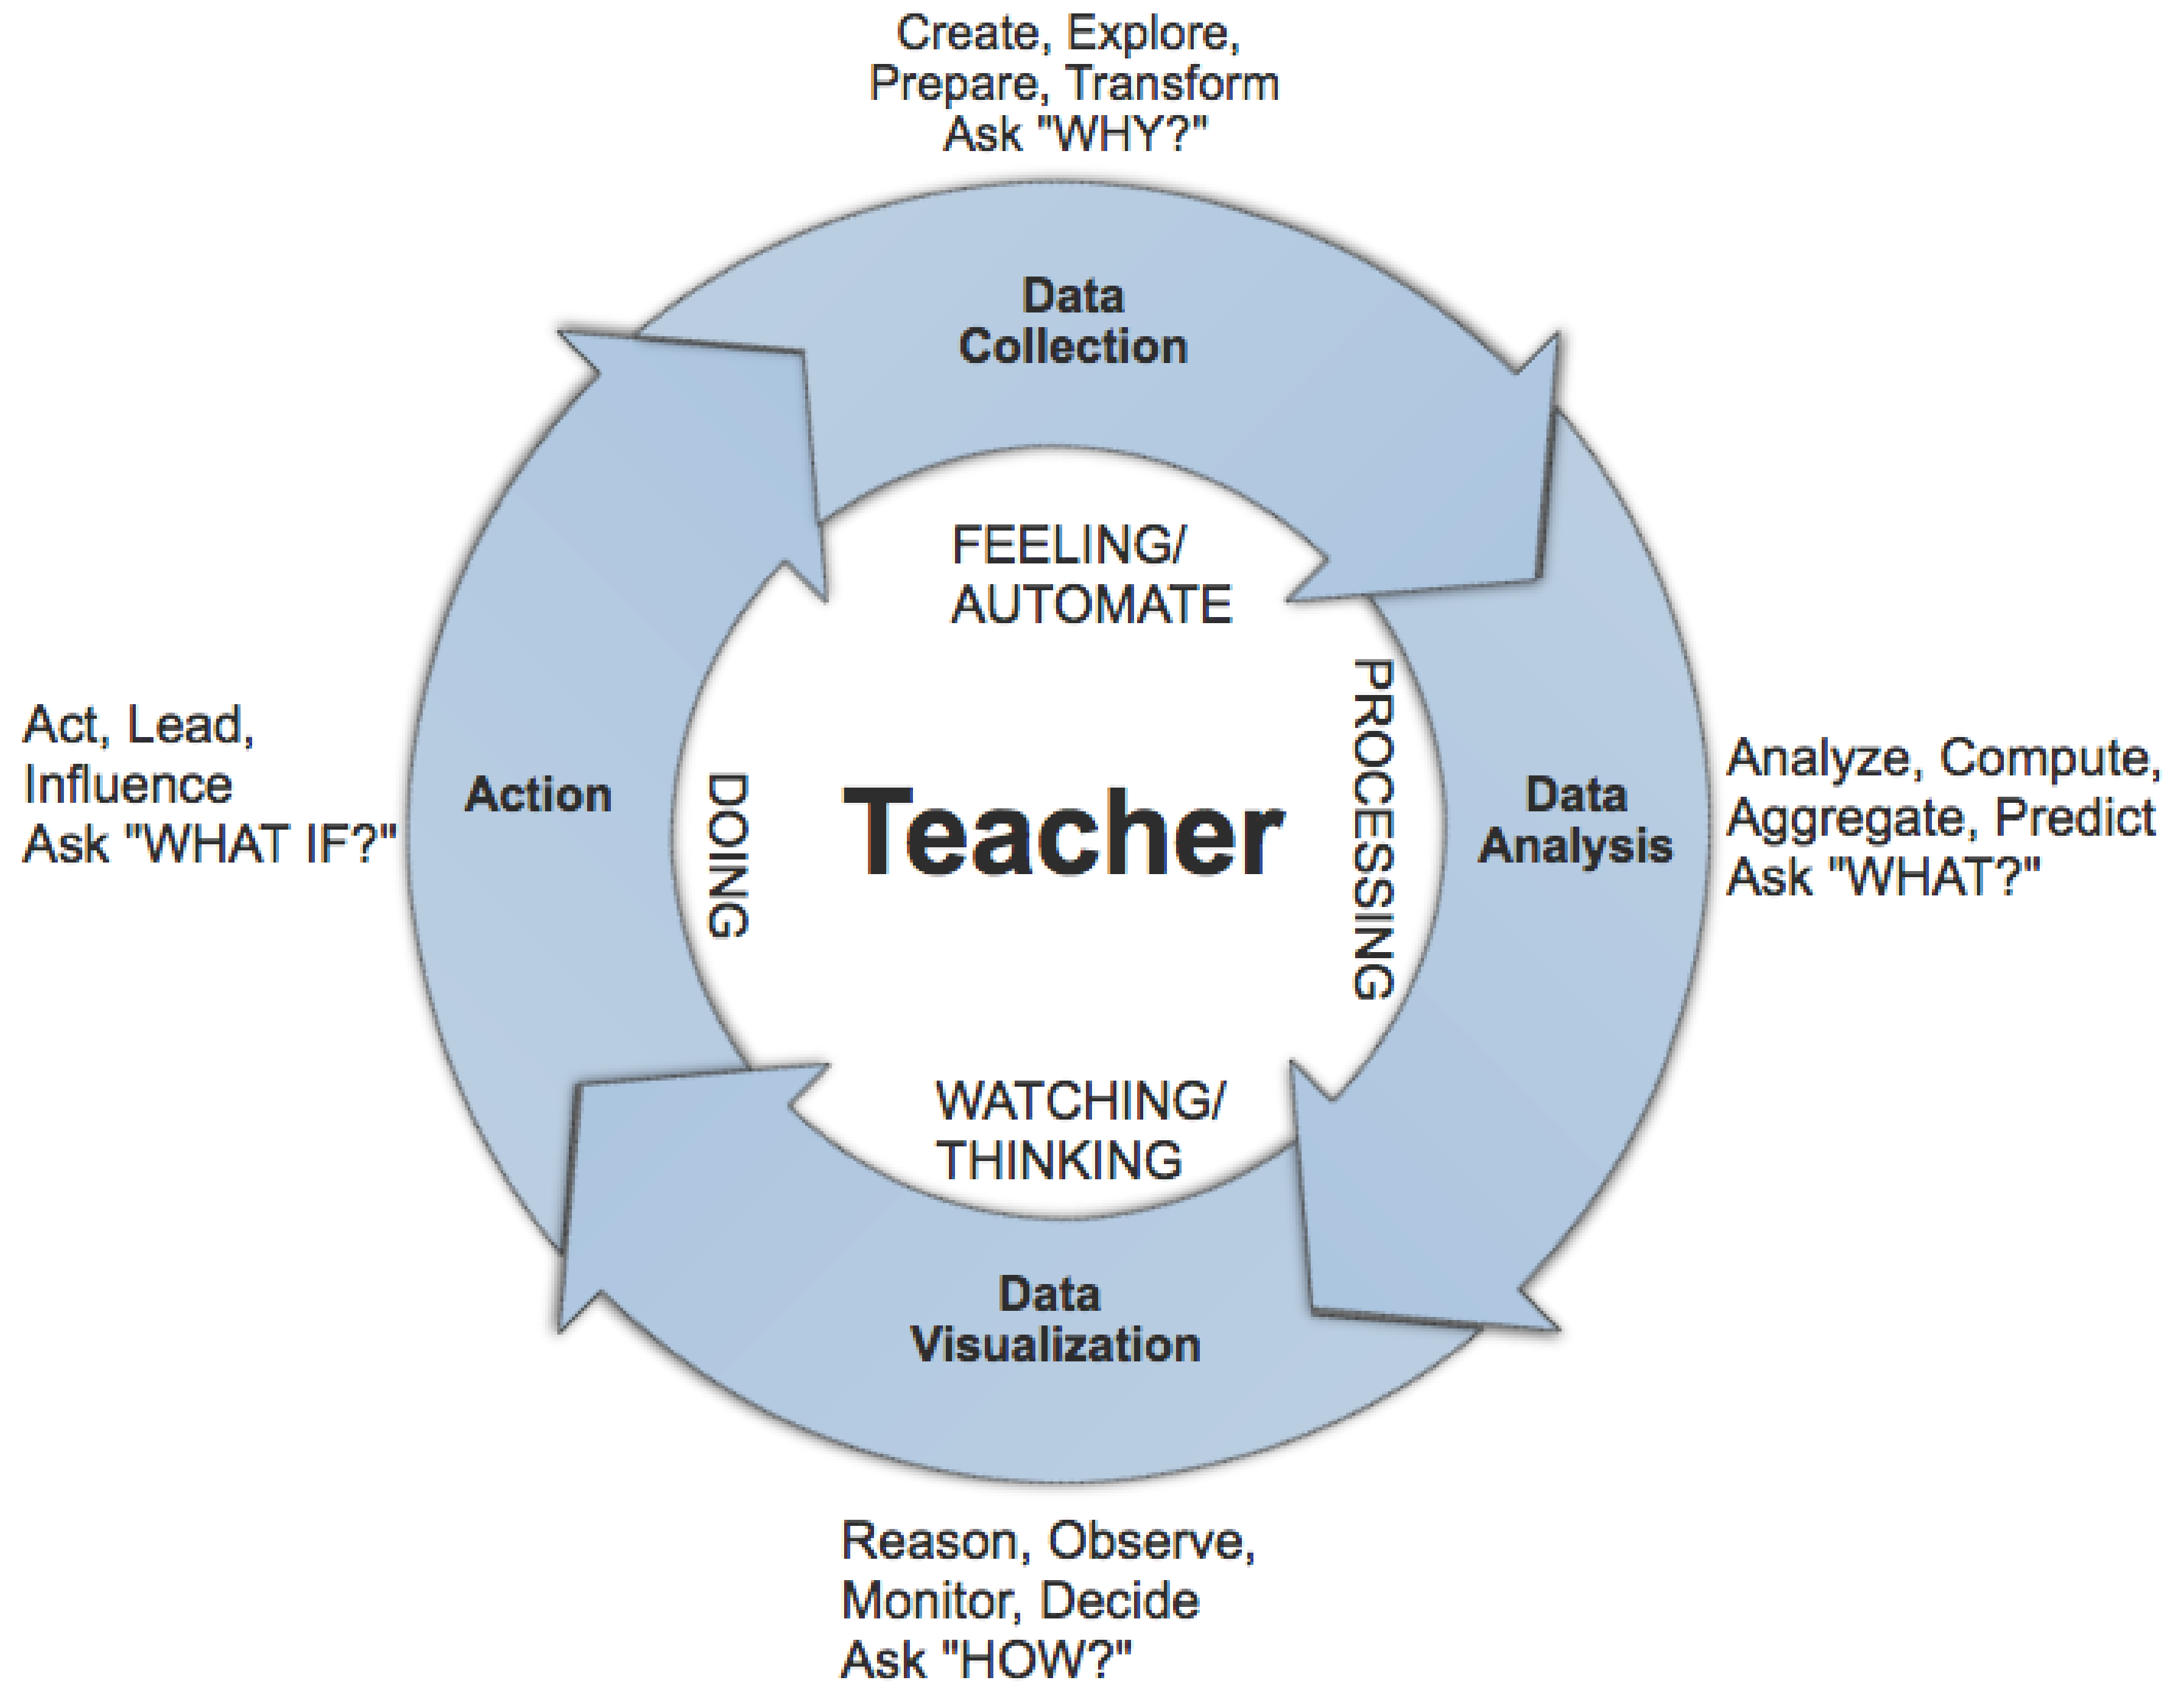
In this article, we propose the teaching outcome model (TOM) as a theoretical model to assist teachers in engaging with teaching analytics. TOM follows a cycle of four steps to provide useful insights to the teacher. The steps involve the collection, analysis, visualisation of teaching data and action based on the outcome (see
Figure 1). We believe that providing teachers with personalised teaching dashboards would support self-awareness of the quality of their teaching and in turn enable them to improve teaching practices and learning outcomes.
The TOM TA Cycle begins with the information gathering stage where data related to teaching, students’ feelings (sentiments), e.g., students’ opinion are collected. The teacher primarily collects data based on feelings (how the students experienced the subject). During this stage, teachers ask the “why” question with the aim of discerning the purpose of data collection. For instance, the teacher might be interested in exploring how the teaching outcomes provide students with the meaningful learning experience.
The data analysis stage in TOM also involves aggregation and prediction of possible outcomes of teaching outcome. At this stage, the teacher asks the “what” question. For example, the teacher may be interested to know what kinds of analytical models, tools, approaches, methods or techniques achieve appropriate teaching outcomes. Teachers try to solve fundamental data problems, they will consider applying various forms of algorithmic, computational and machine learning techniques on the teaching data acquired for investigation.
The data visualisation stage provides profound reflections for teachers. It is where the teacher would consider the time to reason, observe and think through the teaching outcome. They would ask the “how” question. They want to know how the analysis of the teaching outcome can influence teaching practice. The use of both inductive and deductive reasoning can be necessary at this level to draw reasonable conclusions based on the visualisation of teaching outcomes that would lead to making appropriate decisions.
Finally, during this stage; the teacher asks the “what if” question. The teacher at this point might take action based on inspiration or interpretation derived from the visualisation of the teaching outcome. This inspirational insight will assist the teacher solve the problem they have identified, then develop and carry out plans to improve or tackle new teaching challenges. This final stage closes the loop; however, the teacher’s findings can also initiate another investigation, consequently the loop starts all over again.
3. Critical Challenges in Utilising Big Data in Educational Research
3.1. Ethical Issues
Daniel [
45], identified collaboration and access as the most significant issues associated with the effective utilisation of Big Data in education. Educational institutions needed broader collaboration and increased access to data to create opportunities for educational research.
The field of Big Data raises far-reaching ethical questions with significant implications for the use of Big Data to support effective decision-making. Current discourses on the use of Big Data are awash with concerns over data governance and ethical matters such as; shared data standards, roles, rules, policies, obtaining proper consent, data management, security, and user privacy [
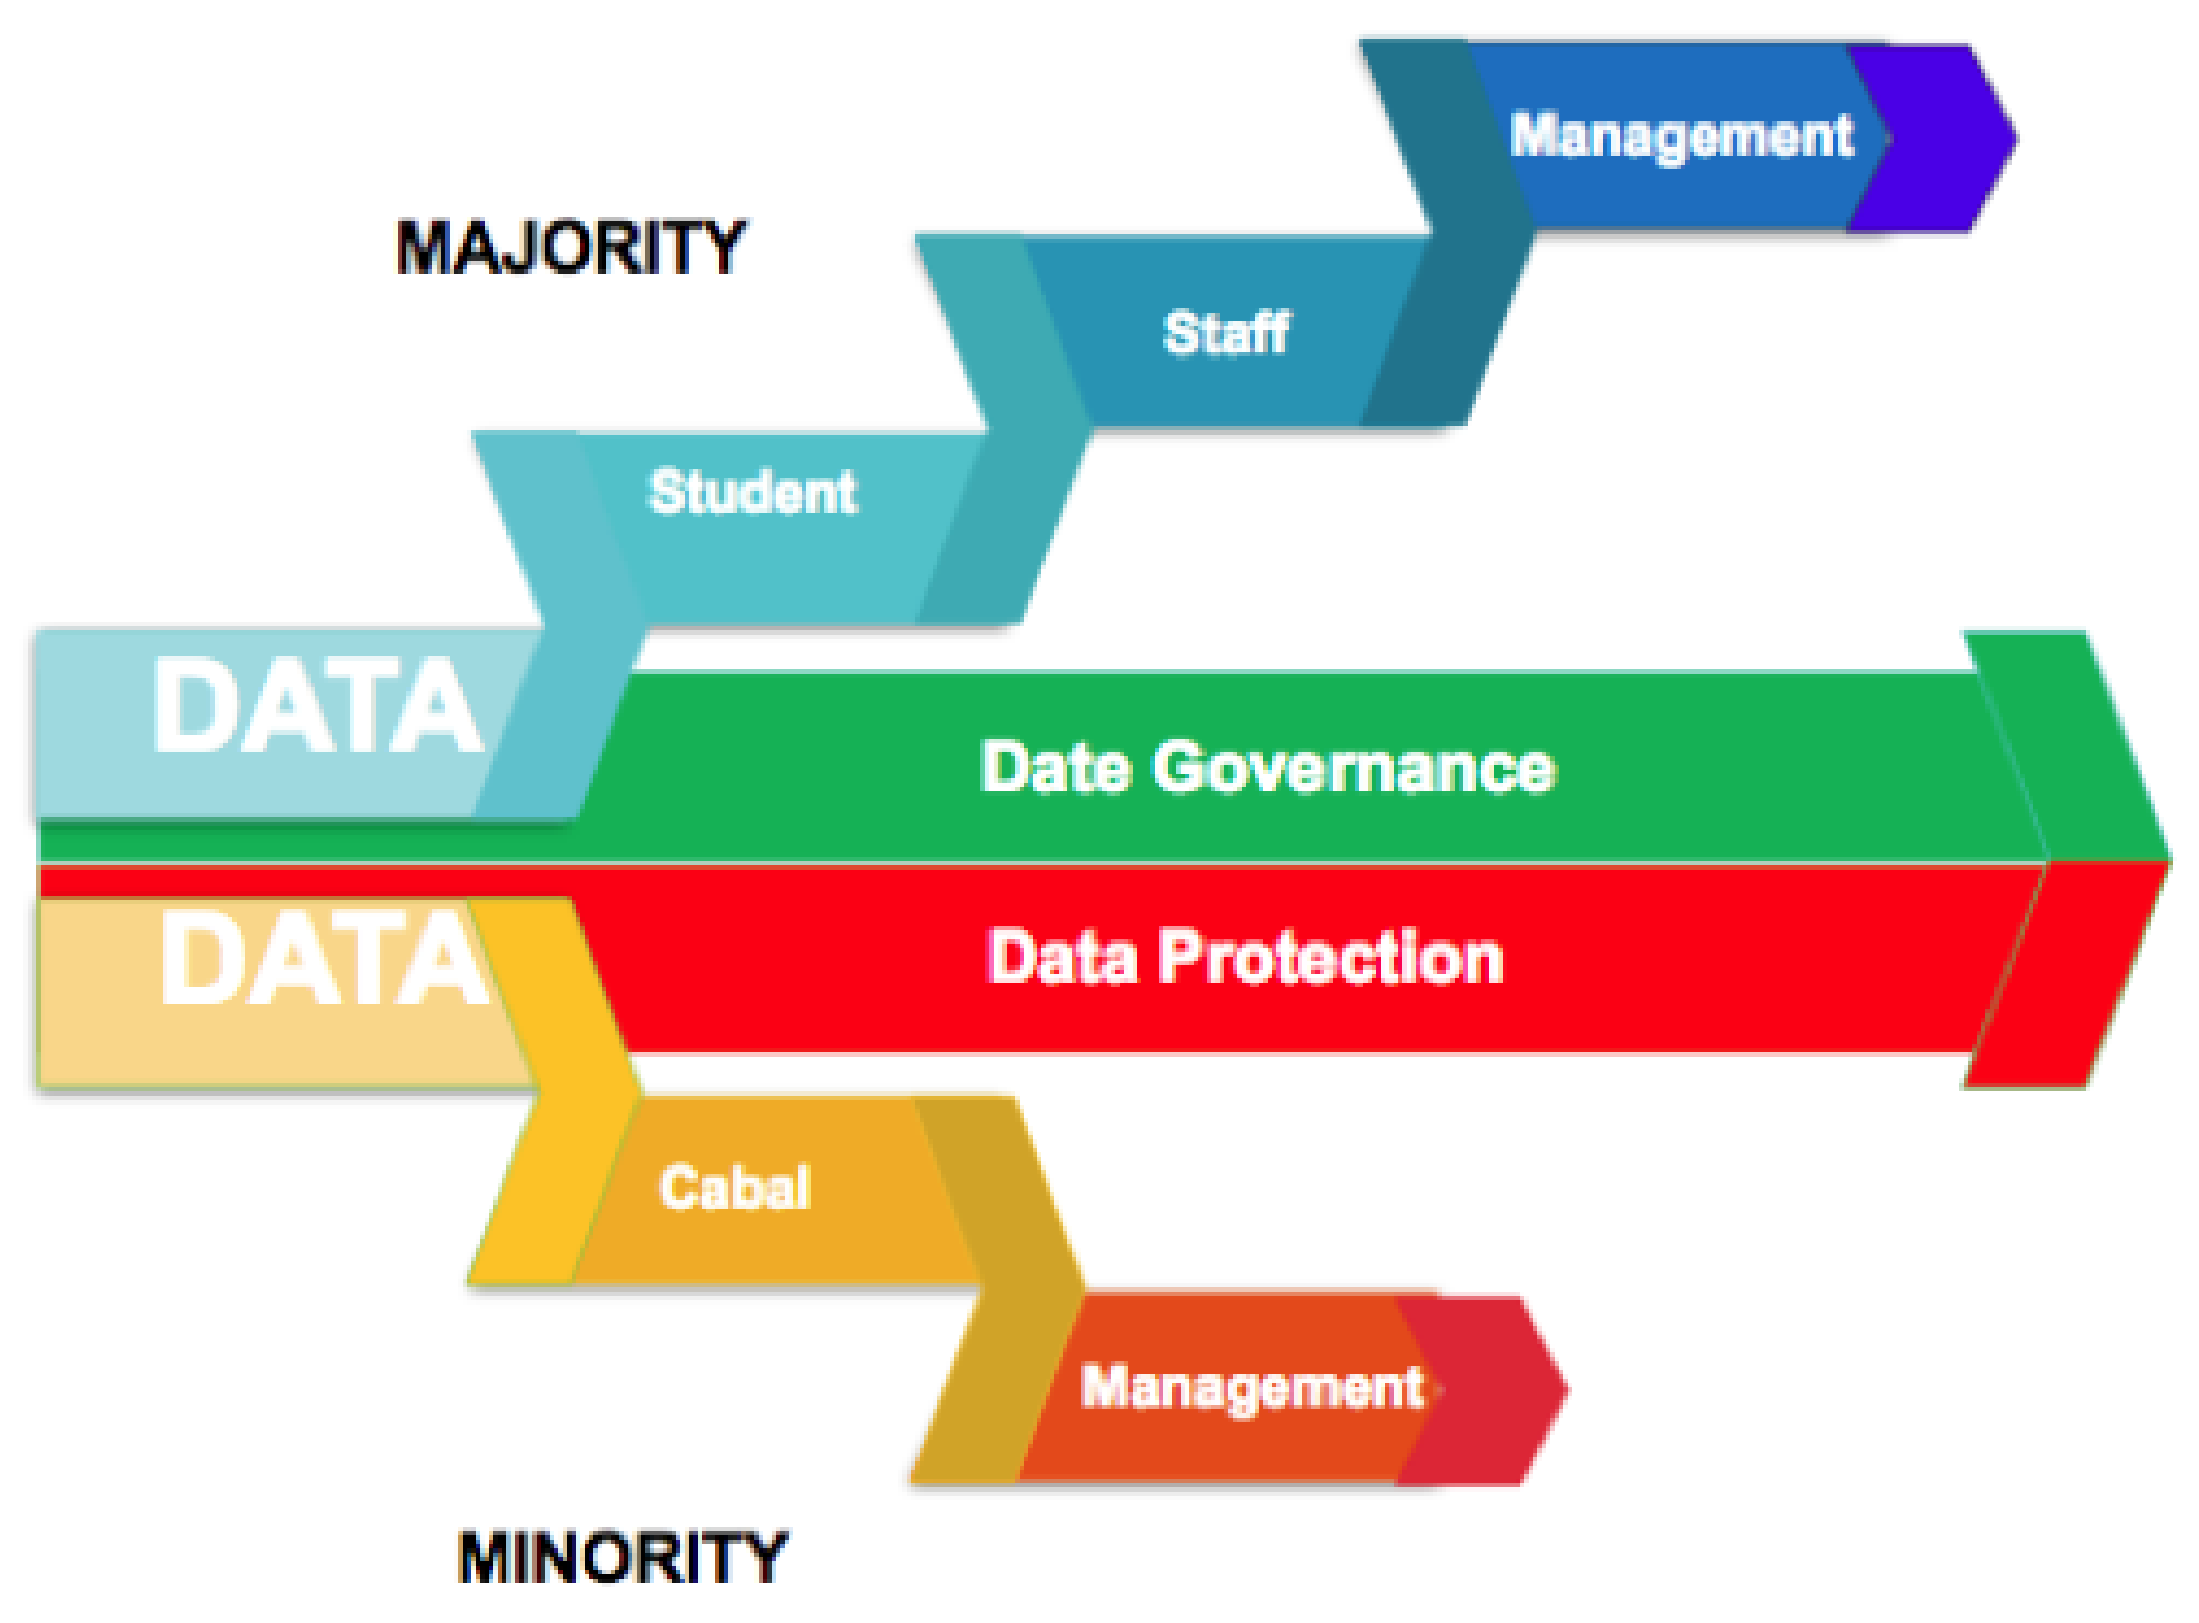
46]. With the rise of Big Data in education, similar anxieties are being raised regarding; what is being collected, by whom and for what purposes? While these are legitimate questions, many institutions, struggling to reply, are adopting a data protection rather than a data governance response. Institutions that adopted data protection tend to lock down access to data through regulatory policies aimed at protecting these data sources [
47]. This approach raises serious questions for researchers and practitioners wishing to capitalise on the benefits of Big Data to progress pedagogical improvement (see
Figure 2).
Equipping the higher education with proper data governance framework will provide better rules and regulations around data access and usage, preventing the risks of data fraud or loss, as well as manage data flow holistically and adequately across the stakeholders [
48]. Successful implementation of Big Data in the education system depends highly on the level of transparency and strength of the data governing structures that provide progressive strategic policies for data utilisation, transparency and accessibility [
23,
49,
50].
3.2. Educational Issues
Big Data in education is generally perceived as generating a positive impact that might not impact the critical stakeholders in the same way [
51]. Arnold and Pistilli [
42], published results on a survey administered to first-year undergraduates at Purdue University about their experiences with the learning analytics system that uses the traffic light system metaphor. The result of this study showed a positive outcome, with more than half of the students supporting the use of analytics in learning. However, the flip side was that some under-performing students saw regular email reminders on their performance as a threat. The information appeared as though prophetic statements were already taking effect and impacting negatively on their results. Consequently, the need to research further on more appropriate and practical approaches to reach out to students at risk. Another challenging issue is that the application of machine learning approach on educational data can lead to stigmatisation [
46]. For example, if the result of analytics categorises people from a region as terrorists, this may have an adverse effect on the various stakeholders in the educational system.
Griffiths [
52], reported LA could result in pedagogical issues when used to foster and focus on student retention and completion rates. It could undermine teaching as a profession and draw more attention to teaching accountability. We believe that TA can be used to cushion this effect. For example, a teacher may want to use results from TOM to validate the design of a learning environment [
44]. Leveraging Big Data in the educational system will inevitably create more opportunities and open doors to research and development in new ways.
3.3. Technical Issues
The digital age has created new ways to collect, access, analyse and utilise data. However, emerging technologies, such as the Internet of Things (IoT), Wearable Devices, and Artificial Intelligence are creating new challenges with regards to both the gathering and use of Big Data in Higher Education. For example; data collection and storage cost, complexity and time consumed in building data mining algorithms, difficulty in performing analytics with educational data due to unlinked databases. There is a need for the educational system to further respond to the new developments in this area. Increased diversity in the sources of data increases the likelihood of noise in the data. Although consolidating data from different sources is troublesome, it offers better extensive experiences and outcomes for both modelling and prediction. Dringus [
49] suggested transparency is critical when showing that analytics can assist in effectively solving problems institutions face. Although Big Data can encourage students to perceive early cautioning signs [
19], broad institutional recognition of analytics demands a reasonable institutional approach that helps various stakeholders within the higher education to collaborate [
53]. Mining [
54] released recommendations that for Big Data to be utilised effectively in higher education, there would have to be collaborative leadership among the different departments in a given institution. Implementing an enterprise system such as Splunk can overcome some of these challenges; linking databases together, increasing collaboration among the various departments and securing institutional data.
4. Splunk—Big Data in Educational Research
Splunk is a Big Data platform that performs three basic functions; data input, data indexing and search management. Data transformation occurs when raw data is piped through in such a way that these three basic functions act upon it, transforming data from its original format into valuable knowledge; this process is called the data pipeline. The pipeline divides into four segments; input, parsing, indexing and searching. At the input stage, raw data is ingested into the IDX via the UF (see
Table 1 for further description of Splunk components). Then data is further broken into blocks of 64 KB each which subsequently annotates each block with some meta-data keys. In the next stage, data is moved into the indexer, were parsing and indexing occurs. During parsing, data is broken down into individual events which are then assigned timestamps and unique identifiers. Parsed events are then moved into the indexing stage, where raw data and the corresponding index file is both compressed. At this stage, events are written to the index file stored on the computer disk. Searching is the final stage of the data pipeline. The search indexes all the data as well as manages all aspects of how users access and view data [
55,
56,
57].
4.1. Proposed Architecture for Higher Education Using Splunk Platform
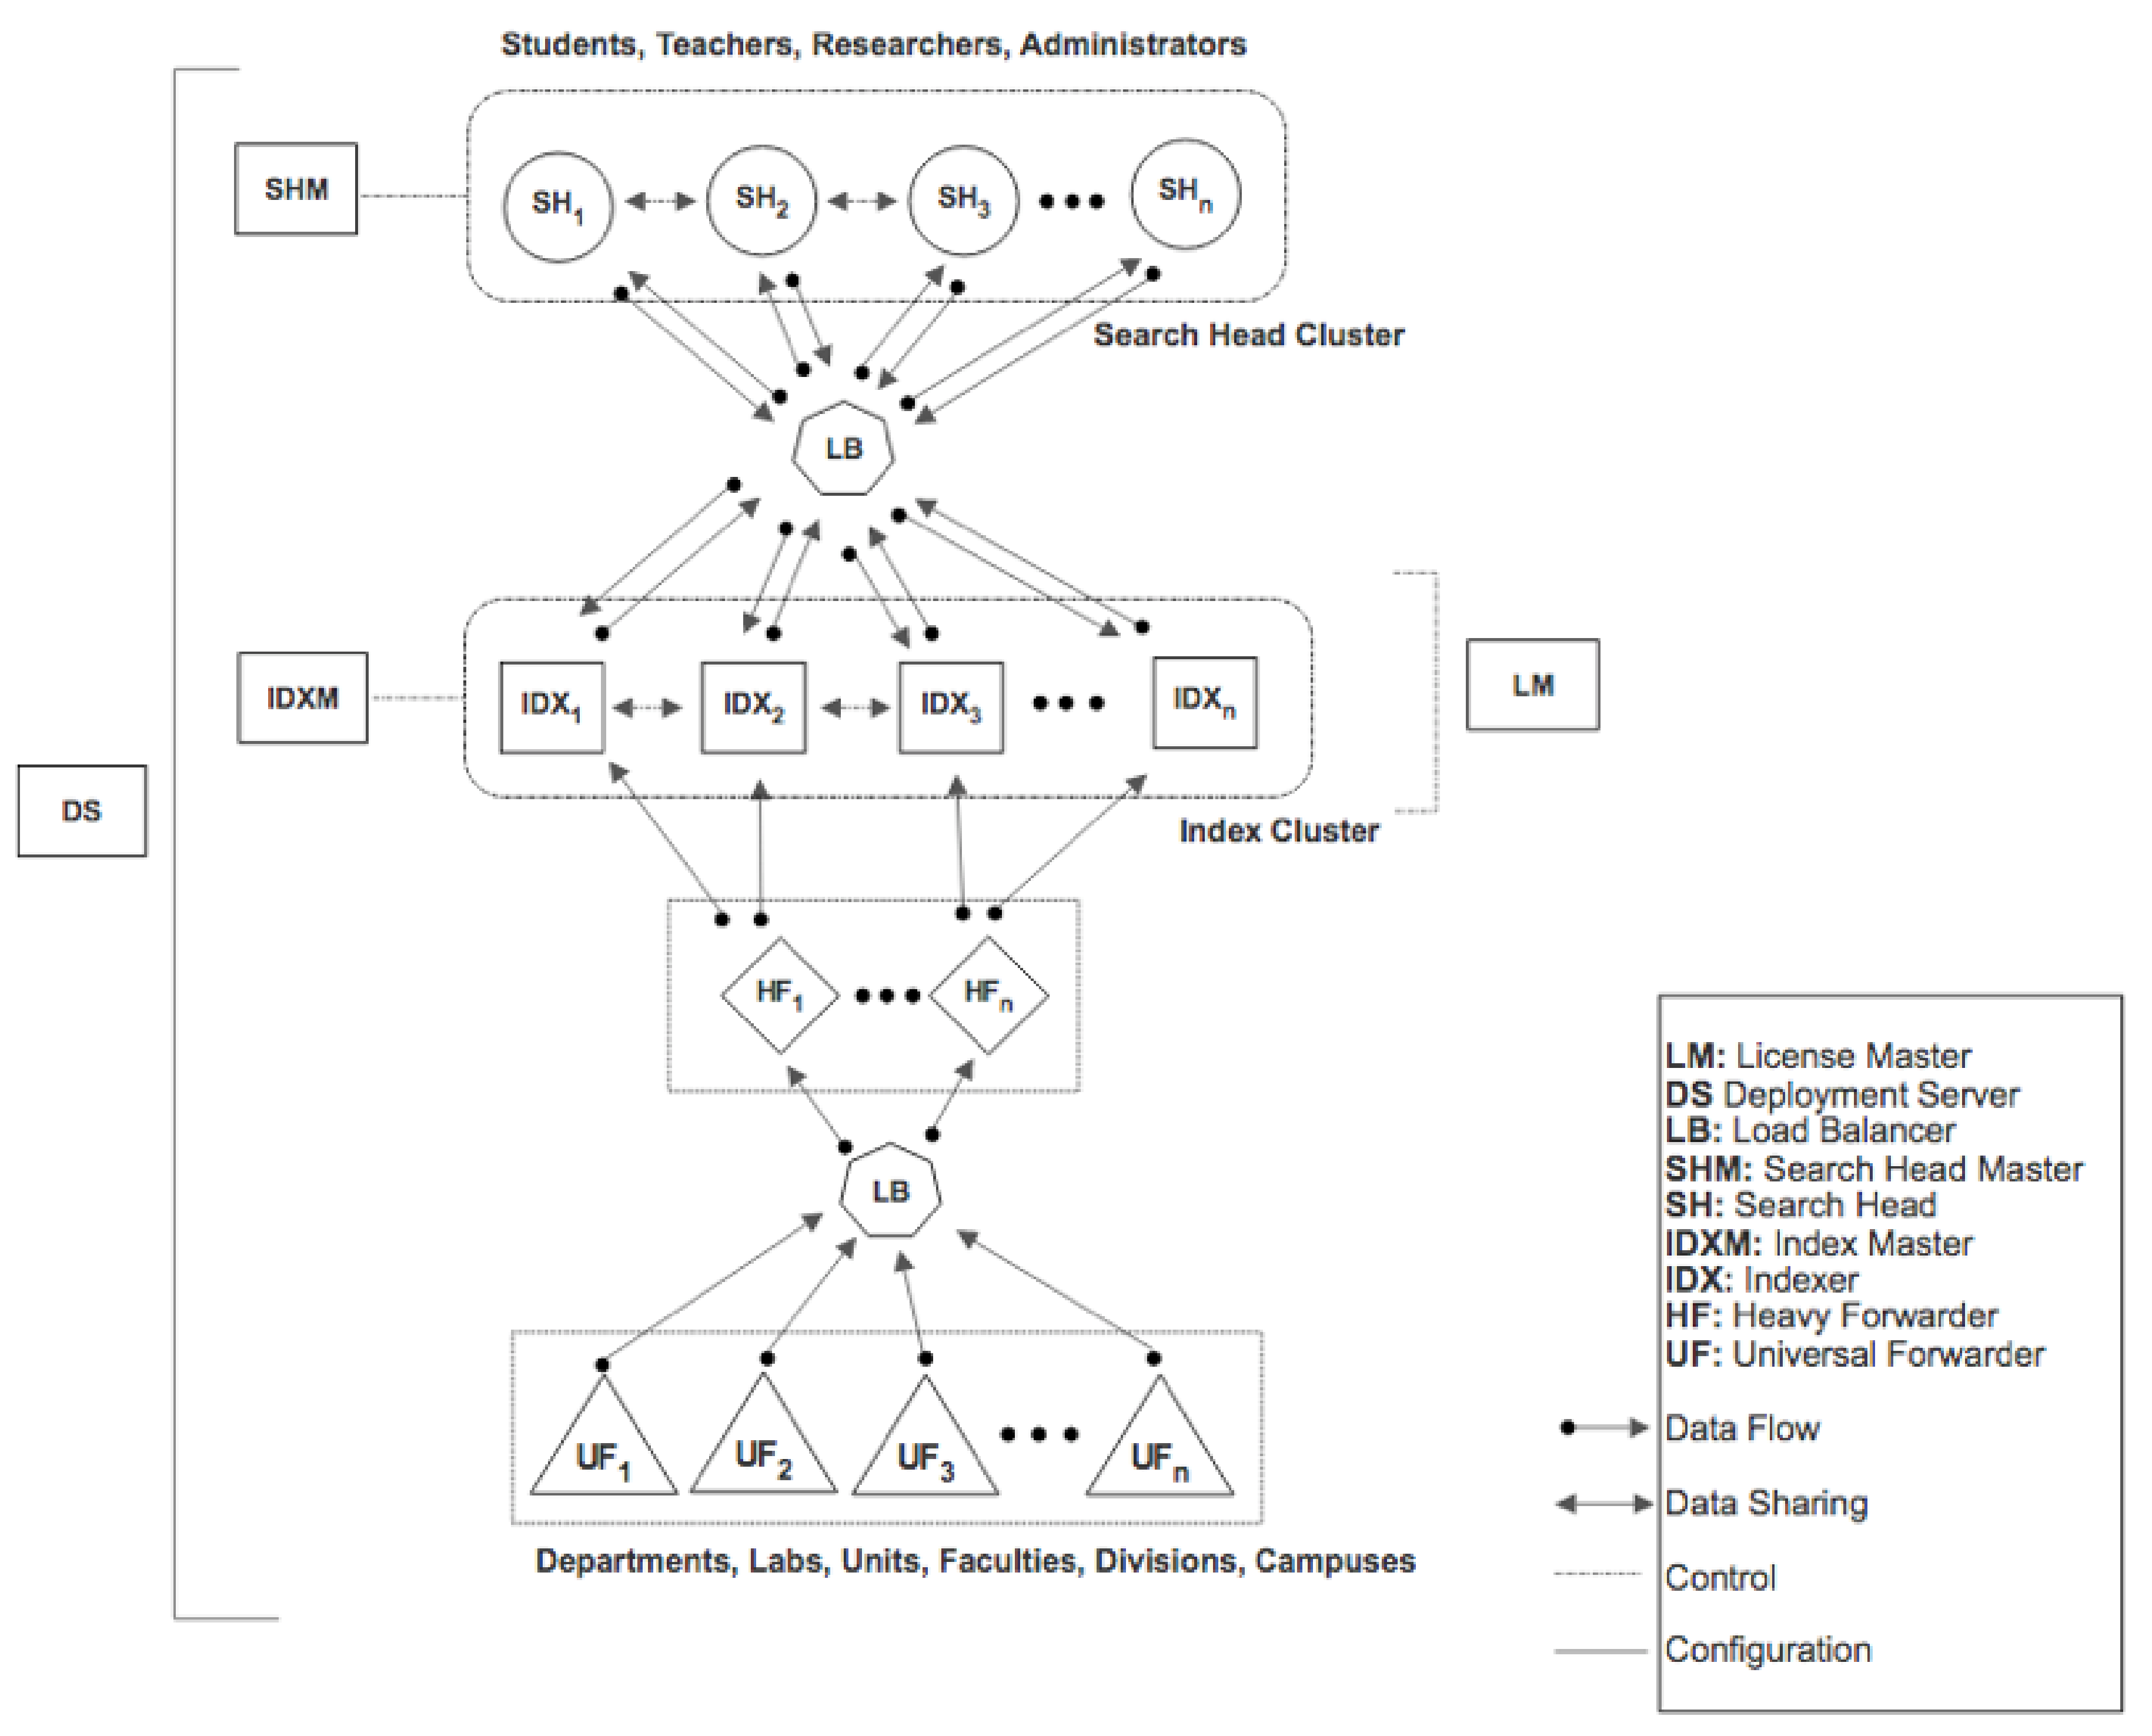
Splunk provides a Master/Slave distribution that offers a significant level of scalability. The benefit of deploying this for Higher Education (see
Figure 3) is that the UF will be a useful component that will link all the disparate databases. The UF will function as a data collector to all forms of educational data located at different points within the institution, such as; departments, units, divisions. These data points can also come from outside the geographical location of the institution such as; satellite campuses and cooperative campuses.
Different forms of data (structured, unstructured and semi-structured) collected by the UF sources will then be forwarded and ingested into IDX destinations. The IDX can be located either on a single site or at multiple sites in the institution, its main function will be to process the influx data by transforming, compressing, indexing and finally storing transformed data in the IDX.
The deployment of an HF constituting an integral part will minimise both the cost and quantity of data ingested per day. The HF basically acts as filters that will filter out unwanted data, allowing only relevant data belonging to the institution to be parsed to the IDX for indexing and storage. For example, if an average of 15 GB of data is ingested daily into the institutional servers and assuming; due to financial constraint, a license of 10 GB data limit per day was purchased, then the HF will function as a filter to refine and filter out unnecessary data, allowing only the needed data to be parsed.
The HF can also separate institutional data into different logical index partitions in the IDX. For example, student data can be logically separated from teacher data as well as administration data. Also, data belonging to units, departments, faculties and division can also be logically separated in the IDX by the HF. This separation allows users to search and query only the data that concerns them, at this point data access varies depending on the level of access.
The SH provides the interface for analytics for the various stakeholders of the institution; this is where the Teacher Dashboards are developed for the teachers.
4.2. Scalability
This system manages various component instances with horizontal and vertical scales [
55]. Hence will be of great benefit to Higher Education regarding growth; multiple instances can be added instantly, without requiring multiple configuration changes. Various data sources are linked with the help of the UF in such a way that performance is optimised across all available server instances. When redundancy features are activated, points of failure are minimised while providing high availability and preventing data loss. This replication factor refers to the number of data replicas that will be managed by a cluster to determine the necessary level of failure tolerance [
58]. Given the formula;
N =
M − 1 where
N is the number of peer node failures a cluster can tolerate, and M is the replication factor. For example, assuming one cluster can tolerate the failure of
N peer nodes, then it must have a replication factor of
N + 1. This means that the cluster will have
N + 1 identical copies of data stored on each cluster node to endure the failures. In other words, if
N nodes fail, then the
node will still be available. Hence, we can also say that the replication factor is directly proportional to tolerance; the higher the replication factor, the more peer nodes failures each cluster can tolerate.
4.3. Security
Equipped with built-in capabilities such as supervised and unsupervised machine learning; provide the capacity to tackle security challenges, including insider-attacks. This infrastructure limits the abuse of privileges from remote locations reducing the high potential for users to take advantage of institutional freedom and openness. Minimising the constant state of security threat institutions face, partly due to the volume of clients and varying level of complexities involved [
16,
59]. Immediate reporting and continuous real-time monitoring of occurrences and attacks prompt security groups to be proactive rather than receptive. Higher education establishments need to meet many regulatory and governing standards and requirements such as; Sarbanes-Oxley, PCI, HIPAA and FERPA. This security adequately underpins data gathering, storage, auditing, and visibility prerequisites of these regulations guaranteeing a system that is efficient, cost-effective, consistent and compliant with best practices in risk management [
16].
4.4. Usability
With significant amounts of data that can be collected from higher education, this deployment will enable teachers to effectively investigate their data, measure their teaching performance and improve the quality of teaching and learning. Teachers will be able to continuously monitor both short and long-term student evaluations of teaching, easily conduct investigative research on student and cohorts data without depending on complex methods. Machine Learning and Deep Learning can also be easily implemented on teaching and learning data. Institutions will find it easy to leverage Big Data and related analytics to start understanding their data, identifying critical issues and measuring trends and patterns over their applications and infrastructure as well as tracking end-to-end transactions across every system that generates digital traces from faculty, staff and students.
5. Research Context
Institutions of higher education are engaged in collecting vast amounts of data on students, staff and their learning and teaching environments. The analysis of this data can inform the development of useful computational models for identifying learning and teaching opportunities, as well help decision-makers effectively address challenges associated with teaching and learning.
Work reported in this article is part of an institutional research project at a research-intensive university in New Zealand. The goal of the research is to explore ways in which the institution can utilise various forms of analytics to improve the quality of decision making, particularly in the aspect of teaching and learning. However, like many other institutions in the country, the institution has been engaged in collecting student evaluation data for some years. The collected data are often used by teachers to look at ways to improve their own teaching in each course. University teachers also use the student evaluation data for promotional and career development. Due to the volume and quality of these data, the institution has been exploring ways to use this data for quality improvement of results.
6. Experimental Setup
6.1. Procedures
Splunk Enterprise 7.1.0 version and a two months free trial with indexing capacity of 500 MB per day was used to run this experiment. A Java program was written to simulate student evaluation data on teaching performance; then the data was uploaded into Splunk for analysis. Using the Splunk Processing Language (SPL), queries were written to produce different reports about students such as; reports concerning students average performance on each paper, reports containing student performance on each question, reports containing total participants from a particular program per year and so on. The collection of these reports were then used to create a teachers’ dashboard that tells a complete story of how the students perceived a particular paper over a time period.
6.2. Simulated Data
For this study, we simulated student evaluation data on teaching performance. We simulated this data because of the ethical concerns of the institution. We were not able to get access to real data. A program was written in Java to combine randomly generated ’N’ number of students with ’M’ number of papers to produce ’X’ random number of student evaluations, within a time period.
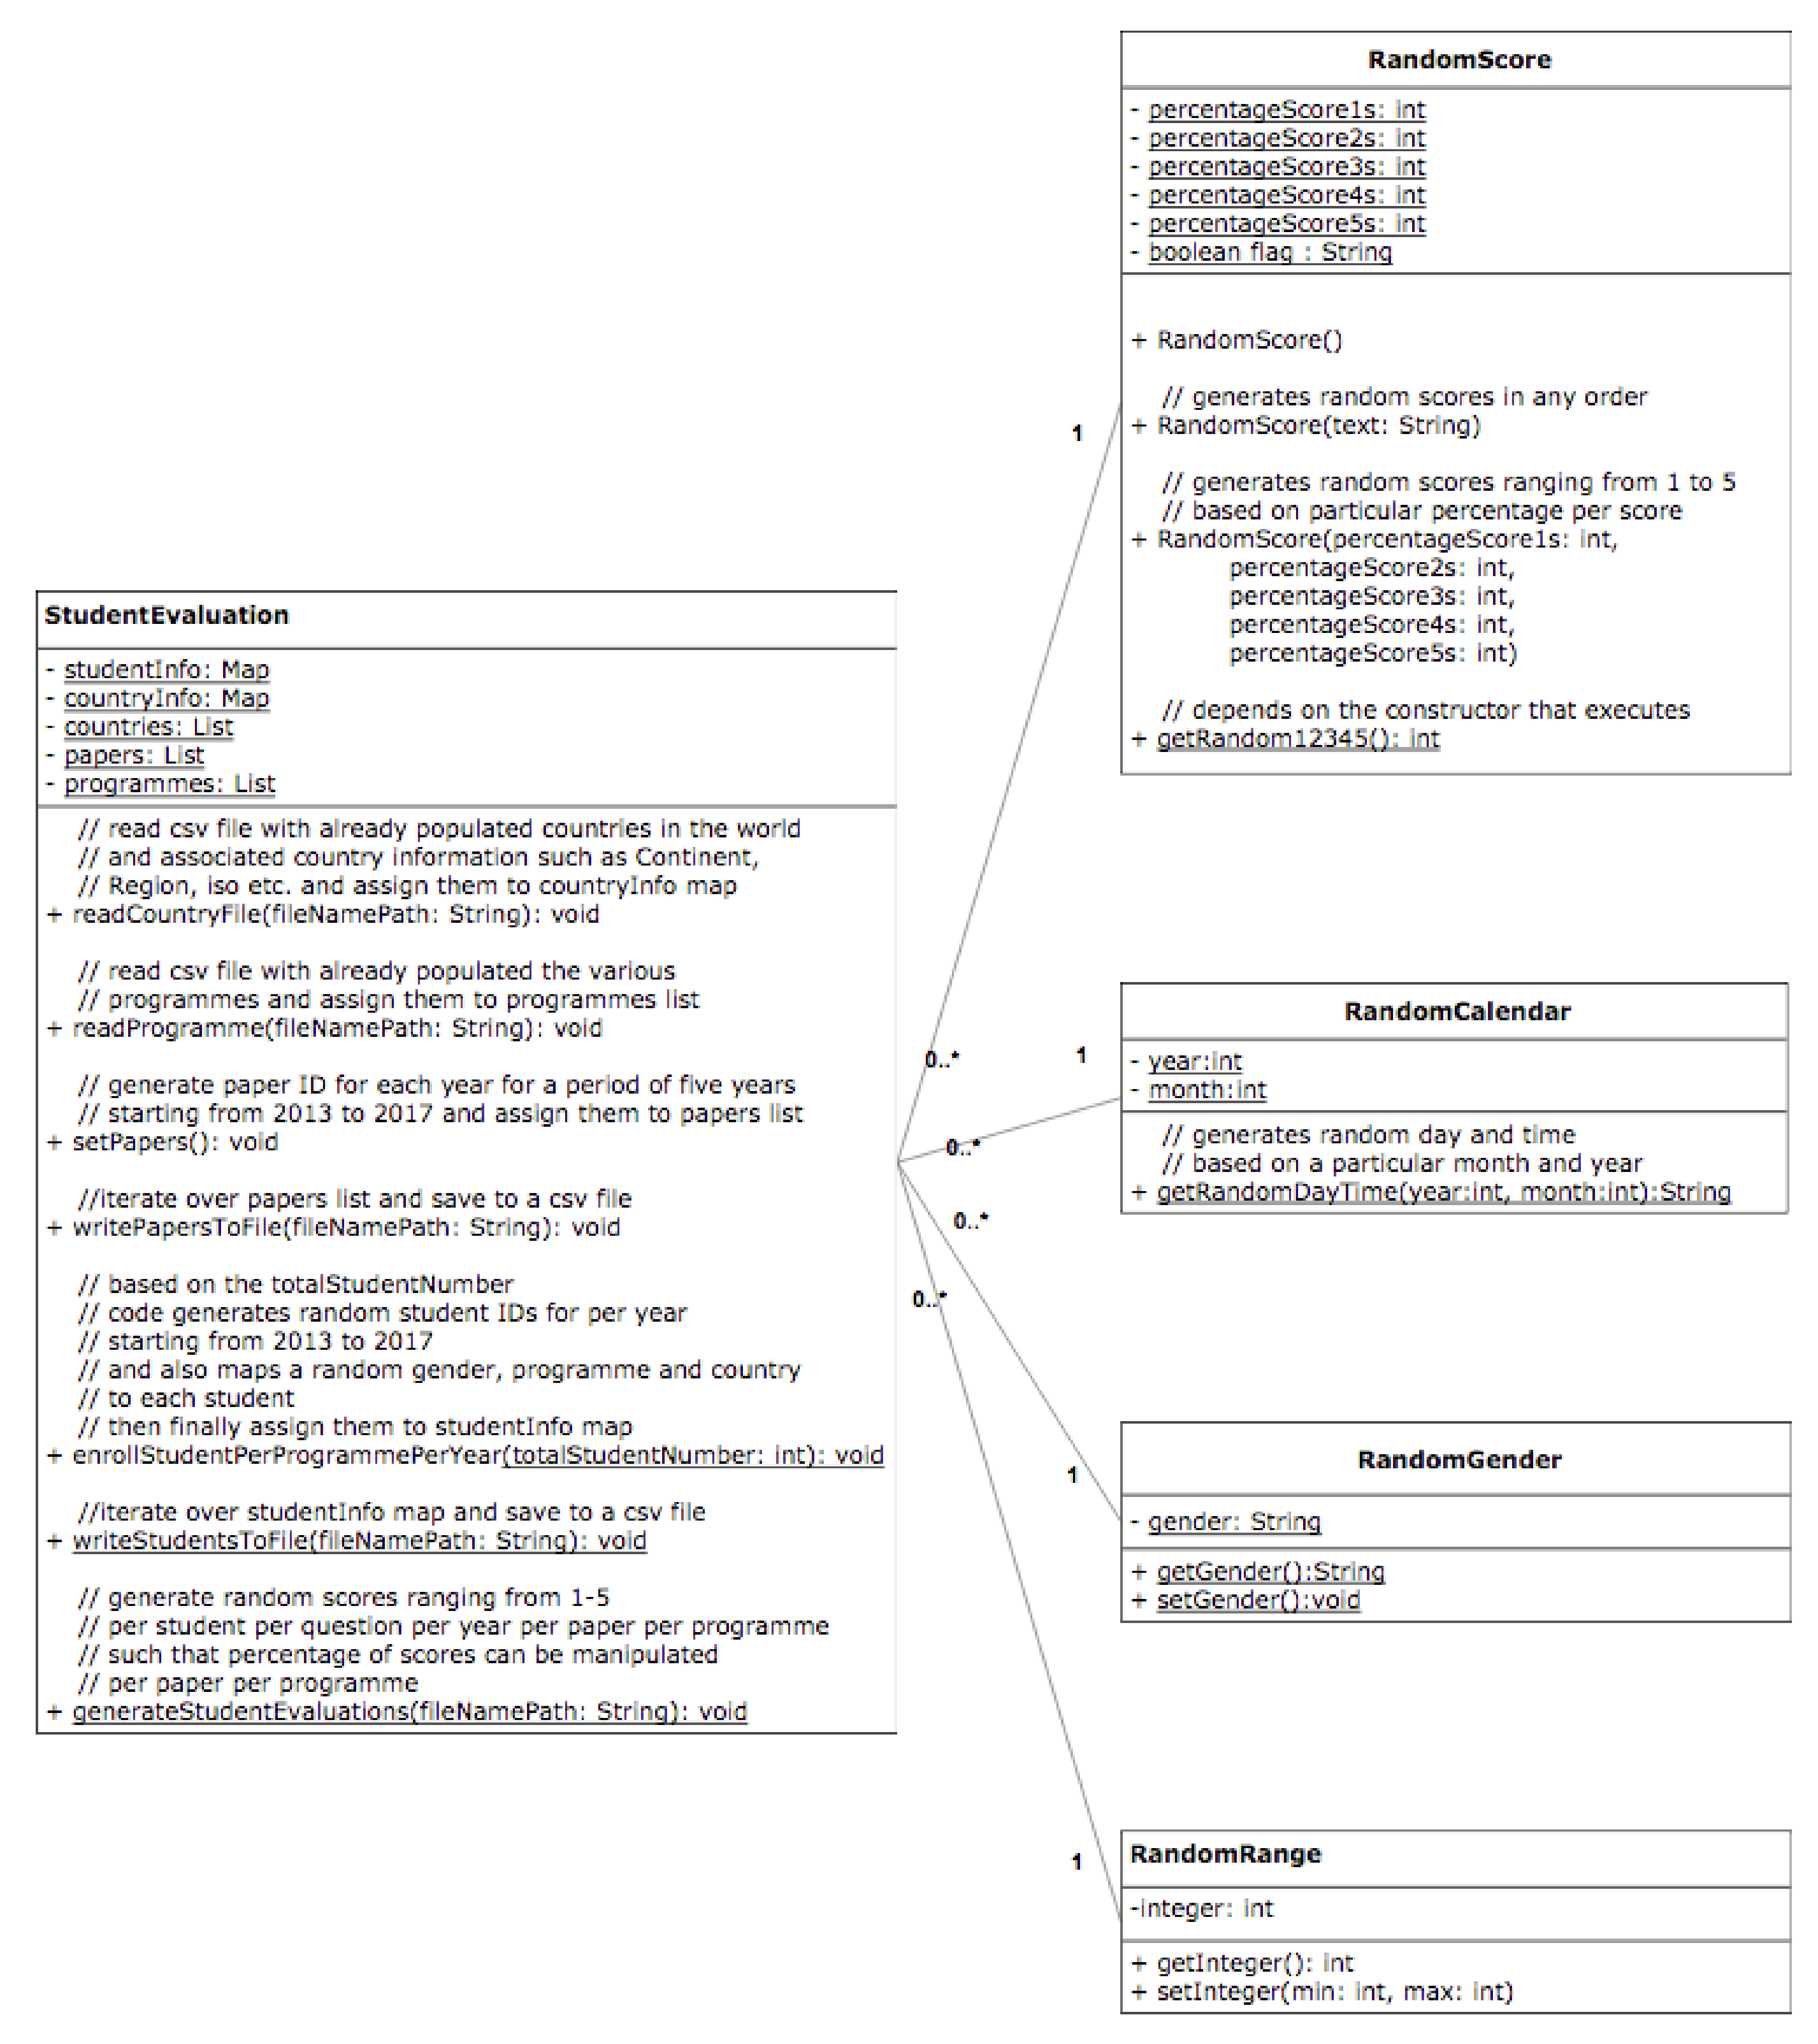
The UML diagram (see
Figure 4) describes a method named enrollStudentPerProgramPerYear(). This method generates any number of unique student IDs depending on the demand; during this process, it randomly assigns each student a gender, country, and programme. For this experiment, 1000 unique student IDs were generated for each year, starting from the year 2013 to 2017.
Then the setPapers() function generates a total of 30 different papers from six papers; (BIO101, CHM101, CSC101, GEO101, MAT101 and PHY101), each paper per year for five years. A paper is identified by appending a session at the end. For example, CSC101 for the year 2013 is identified and named CSC101_2013_2014.
The function generateStudentEvaluations() generates a simulated student evaluation on teaching performance. It assigns a random score ranging from 1 to 5 to each randomly selected student per paper per question. Ten questions; (Q1, Q2 … Q10) were used for this experiment. This function randomly takes as input at any given range (for this experiment, the input range of 1000 to 5000 was used; meaning that any number within this range was randomly selected to represent the number of participating students for each paper, and students were also randomly pulled from all the available programmes). However, it is important to note that this function can generate as many records as you want, but for this experiment, a total number of 224,881 student evaluations on teaching performance records were generated and loaded into Splunk for analysis.
7. Analysis and Results
This section talks about analysis of the simulated data as well as a discussion of the results, presented in a dashboard that tells the story to the teacher of how students’ perceive the teacher’s teaching effectiveness over a period of time.
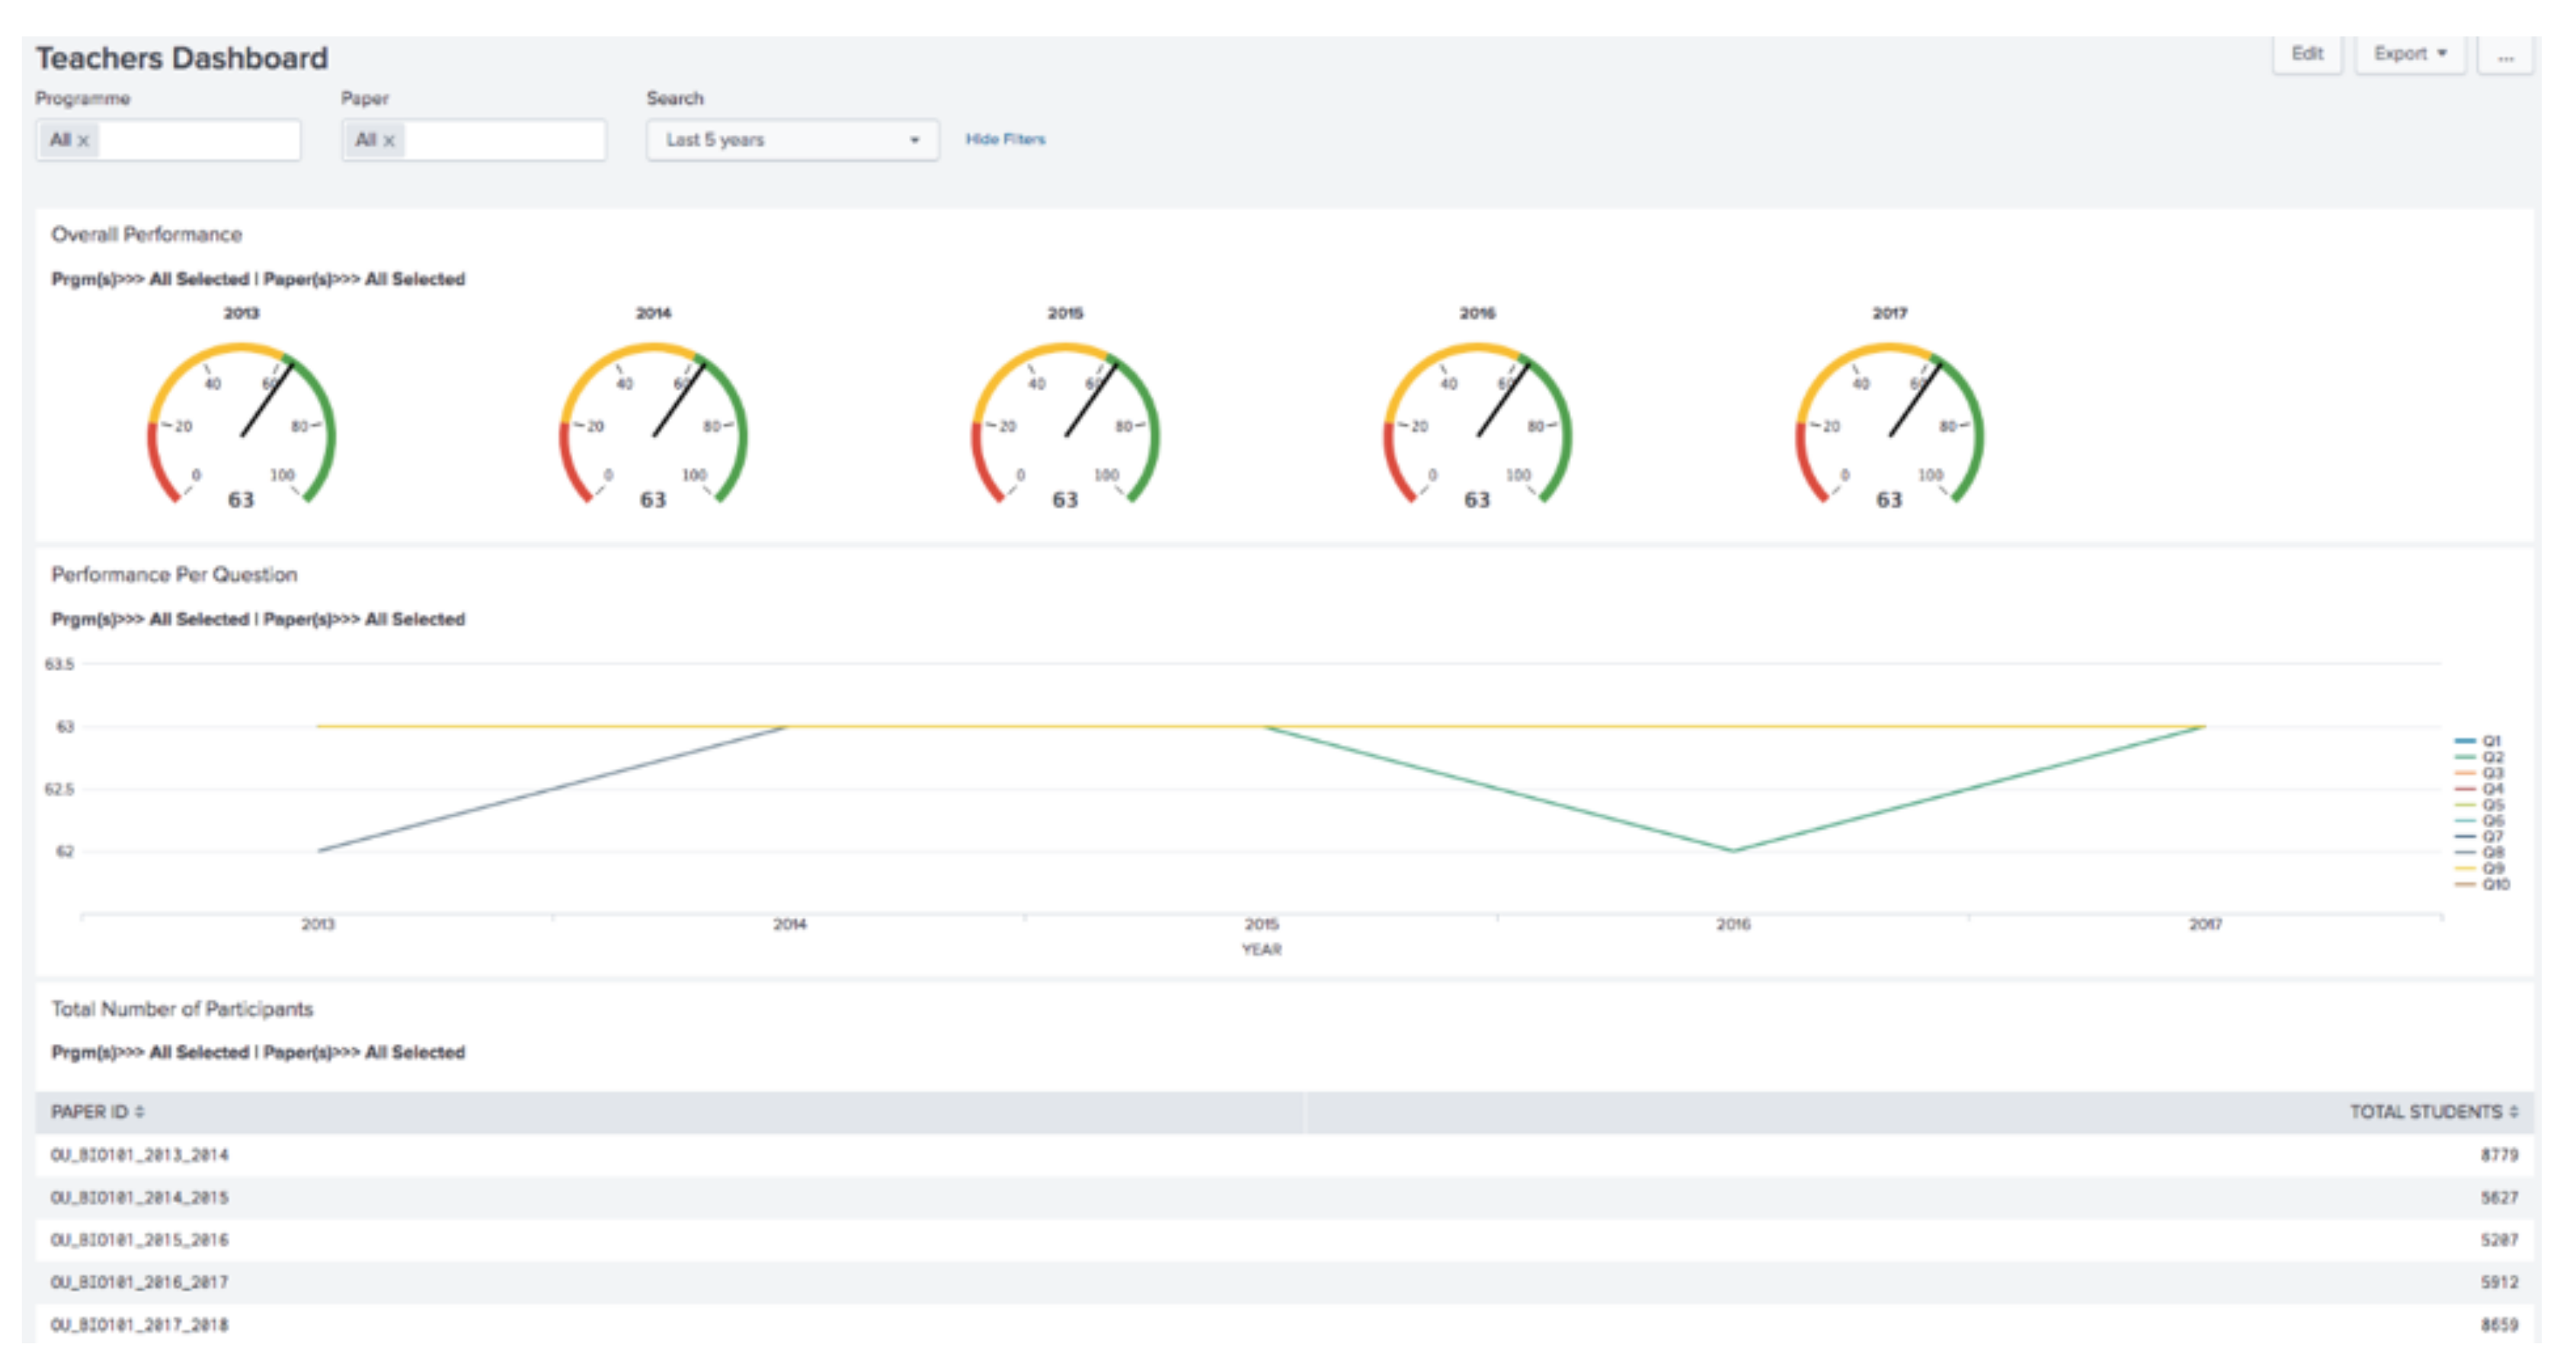
The Teachers Dashboard (see
Figure 5) has a control menu with three input fields and two buttons. The first input field is a multiple-selection input type, titled “Programme”, used to search for students’ on the programme. The second input field is also a multiple-selection input type, titled “Paper”, used to search for students’ based on the paper(s) they participated in. The third input field is a drop-down-selection titled “Search”, it is used to select the time range for a particular search. The buttons reside at the top right corner of the dashboard. The first button labelled “Export” is used to export the results displayed on the dashboard into a pdf format. While the second button (with the three dots) contains a list of options such as; edit permissions, convert to HTML, clone, set as home dashboard and delete.
Next are the panels which are labelled as follows: Overall Performance, Performance Per Question and Total Number of Participants. The “Overall Performance” panel uses a radial gauge representation to present the overall teaching performance for that period of time. This radial gauge is partitioned into three colours; red, yellow and green. Different colours represent a different level of teaching performance. The red colour contains teaching scores ranging from 0 to 19, and it indicates low student opinion of teaching performance. The yellow colour indicates average performance and contains teaching scores ranging from 20 to 59. Finally, the green colour contains teaching scores ranging from 60 to 100 indicates high teaching performance.
Then the “Performance Per Question” panel uses a line graph representation to present the average performance per question. The central teaching evaluation questions used by the institution are; Q1: To what extent did this module help you develop new skills? Q2: To what extent has this module improved your ability to solve real problems in this area? Q3: How much effort did you put into this module? Q4: To what extent did you keep up with the work in this module? Q5: To what extent has this module increased your interest in this area? Q6: Were expectations communicated clearly to students? Q7: To what extent has the teaching in this module stimulated your interest in the area? Q8: Was the module well organised? Q9: Were the time and effort required by assignments reasonable? Q10: To what extent did you find the assessments in this module worthwhile?
Then, the last panel, labelled “Total Number of Participants”, uses a table representation; the first column is named “PAPER ID” which represents each unique paper and the second column is named “TOTAL STUDENTS” which represents the total number of students that participated in each paper.
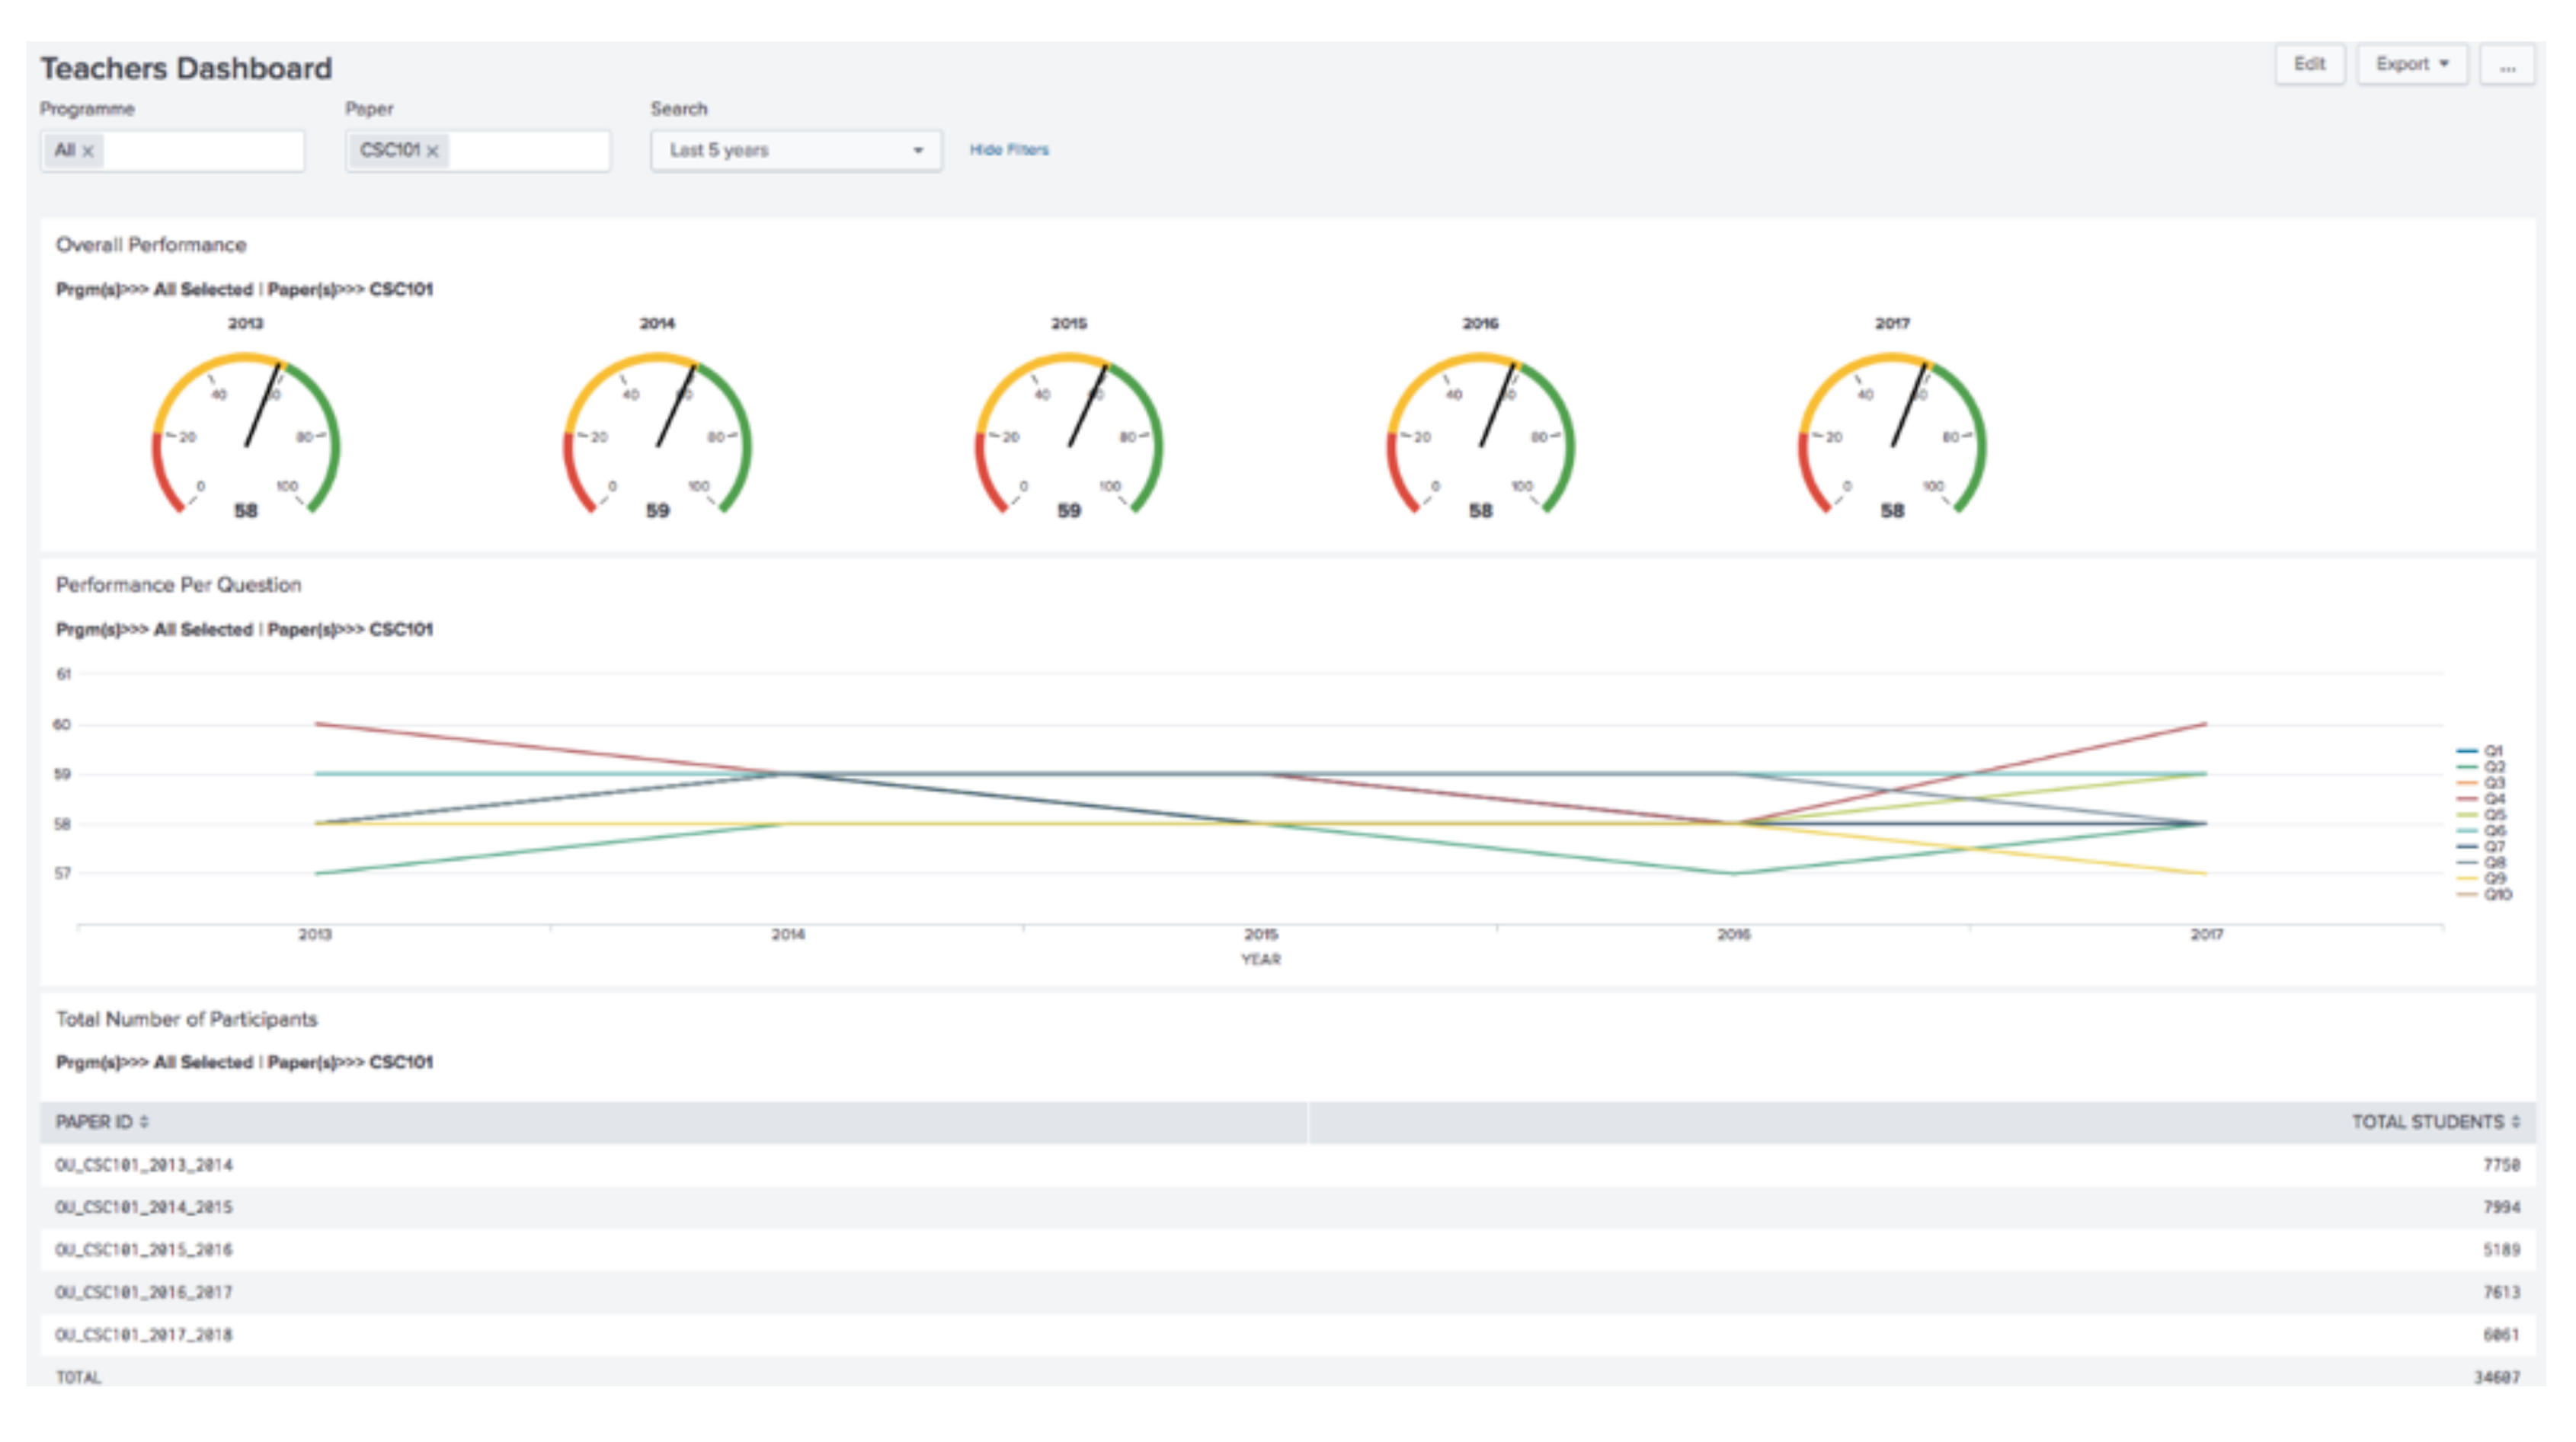
The “Overall Performance” panel in the dashboard above (see
Figure 6) illustrates the average overall performance of CSC101 from 2013 to 2017 fall within 58% and 59% which falls within the range of the average score of 20–59. Since this pattern has been consistently reoccurring for five years; this could suggest that student participants from all programmes are on average satisfied with the CSC101 paper. However, based on this outcome, the teacher may want to make further inquiries. For example, a teacher may want to compare various levels of satisfaction based on student programme categories.
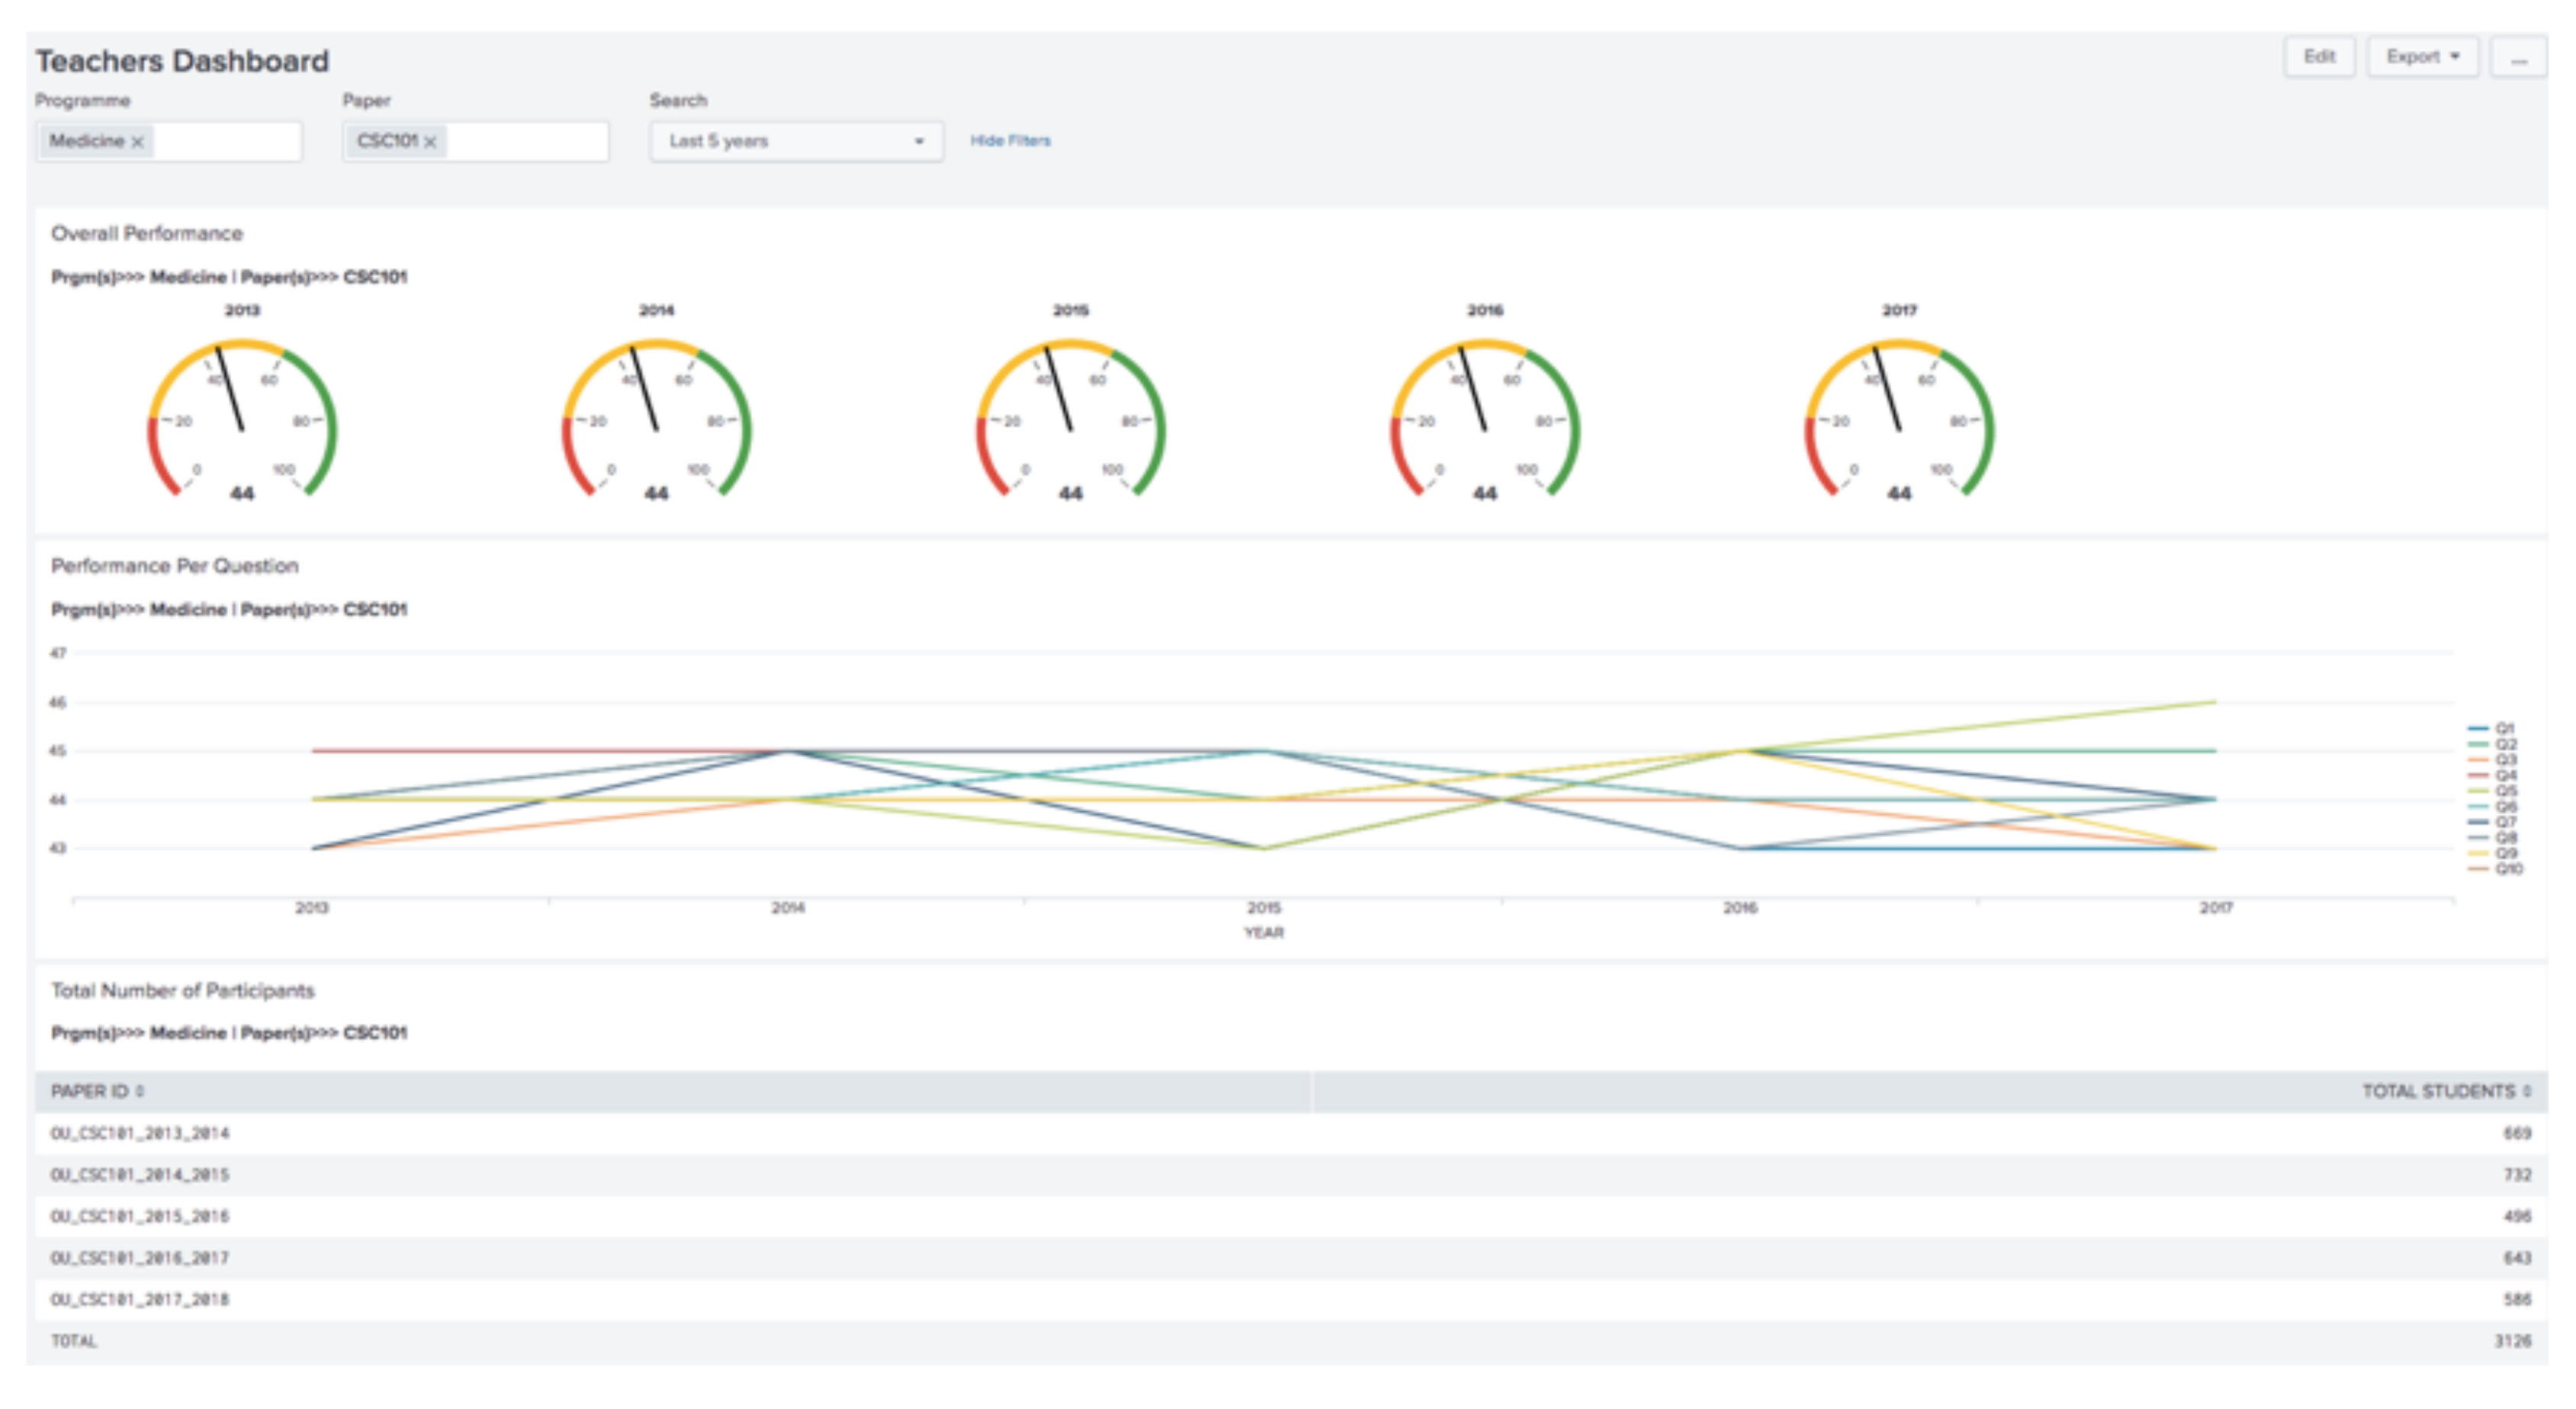
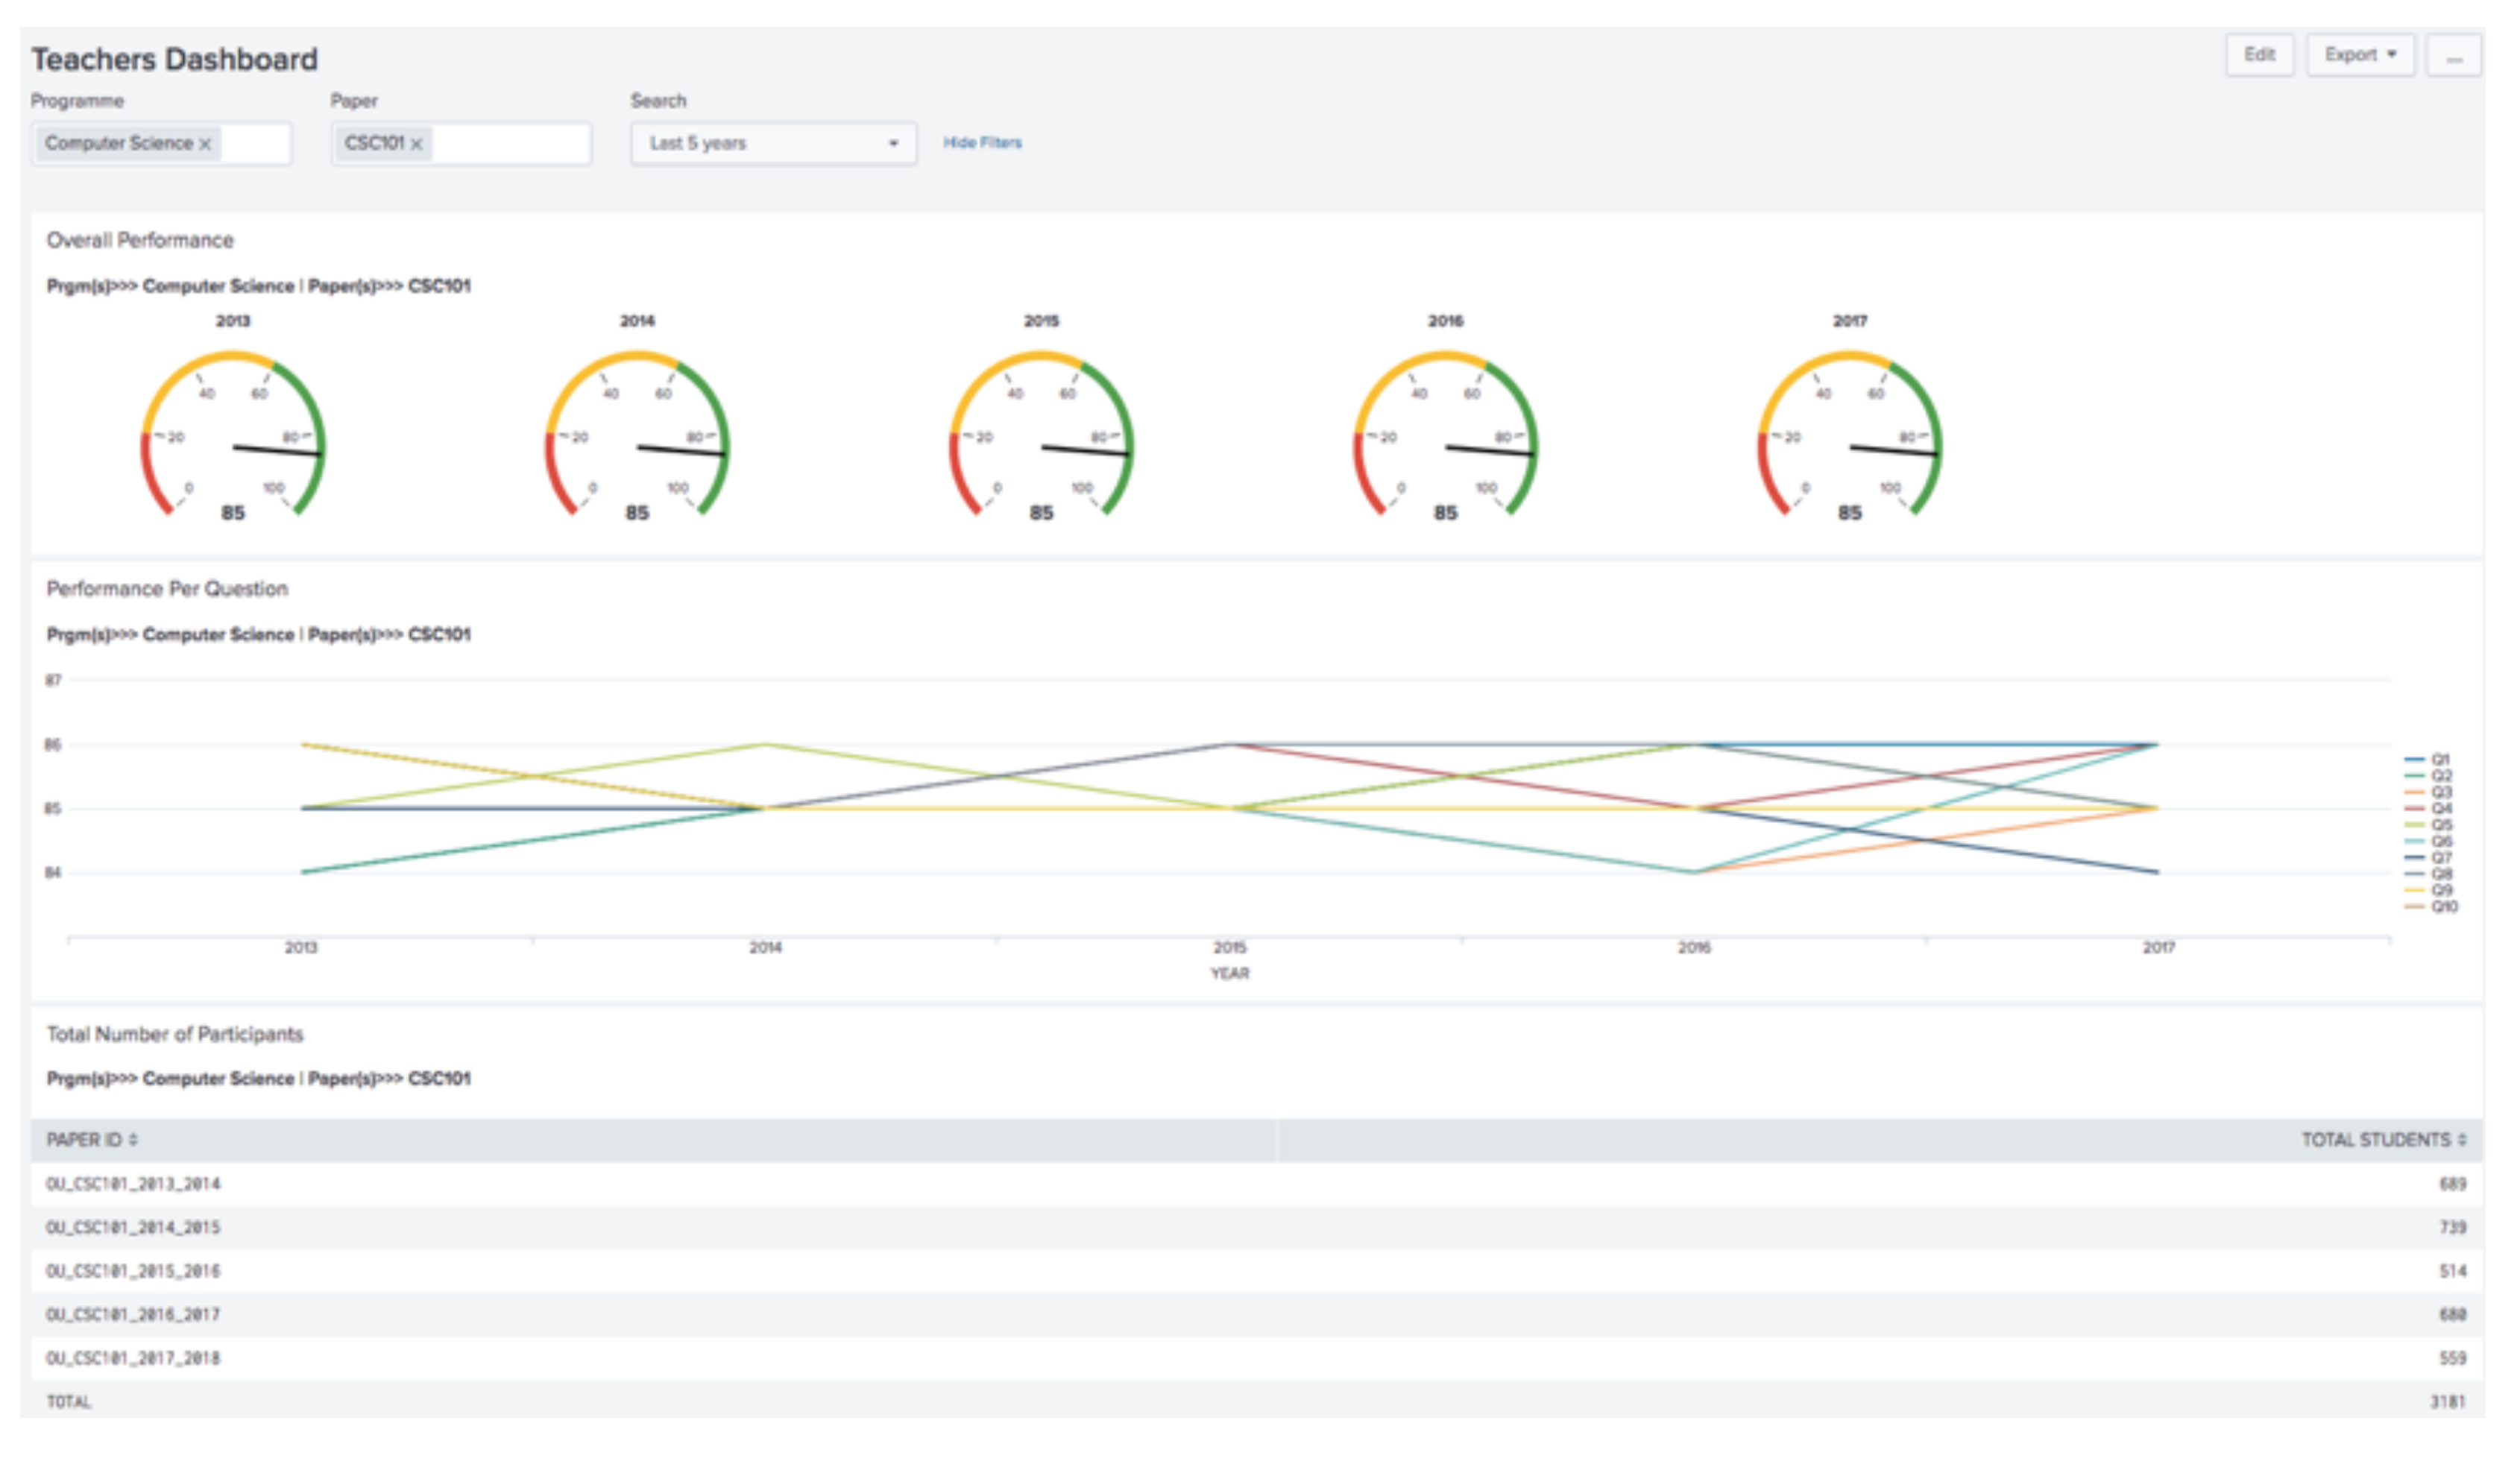
Comparing the “Overall Performance” panels of the two dashboards (see
Figure 7 and
Figure 8). The picture starts getting clearer; the teacher can now easily infer that the students that belonged to the Computer Science programme find CSC101 more satisfying than those that belonged to Medicine programme. This is because students from Computer Science scored this paper very highly (60–100) while students from Medicine scored the same paper averagely (20–59). These two performance outcomes can be interpreted as; students from the medical background find CSC101 more difficult than those from Computer Science background. This outcome might also suggest to the teacher that the design of CSC101 paper is not appealing to the Medical students as much as it is to the Computer Science Students. Hence the teacher may want to take appropriate action. For example, the paper might need to be redesigned to suit the Medical students motivations.
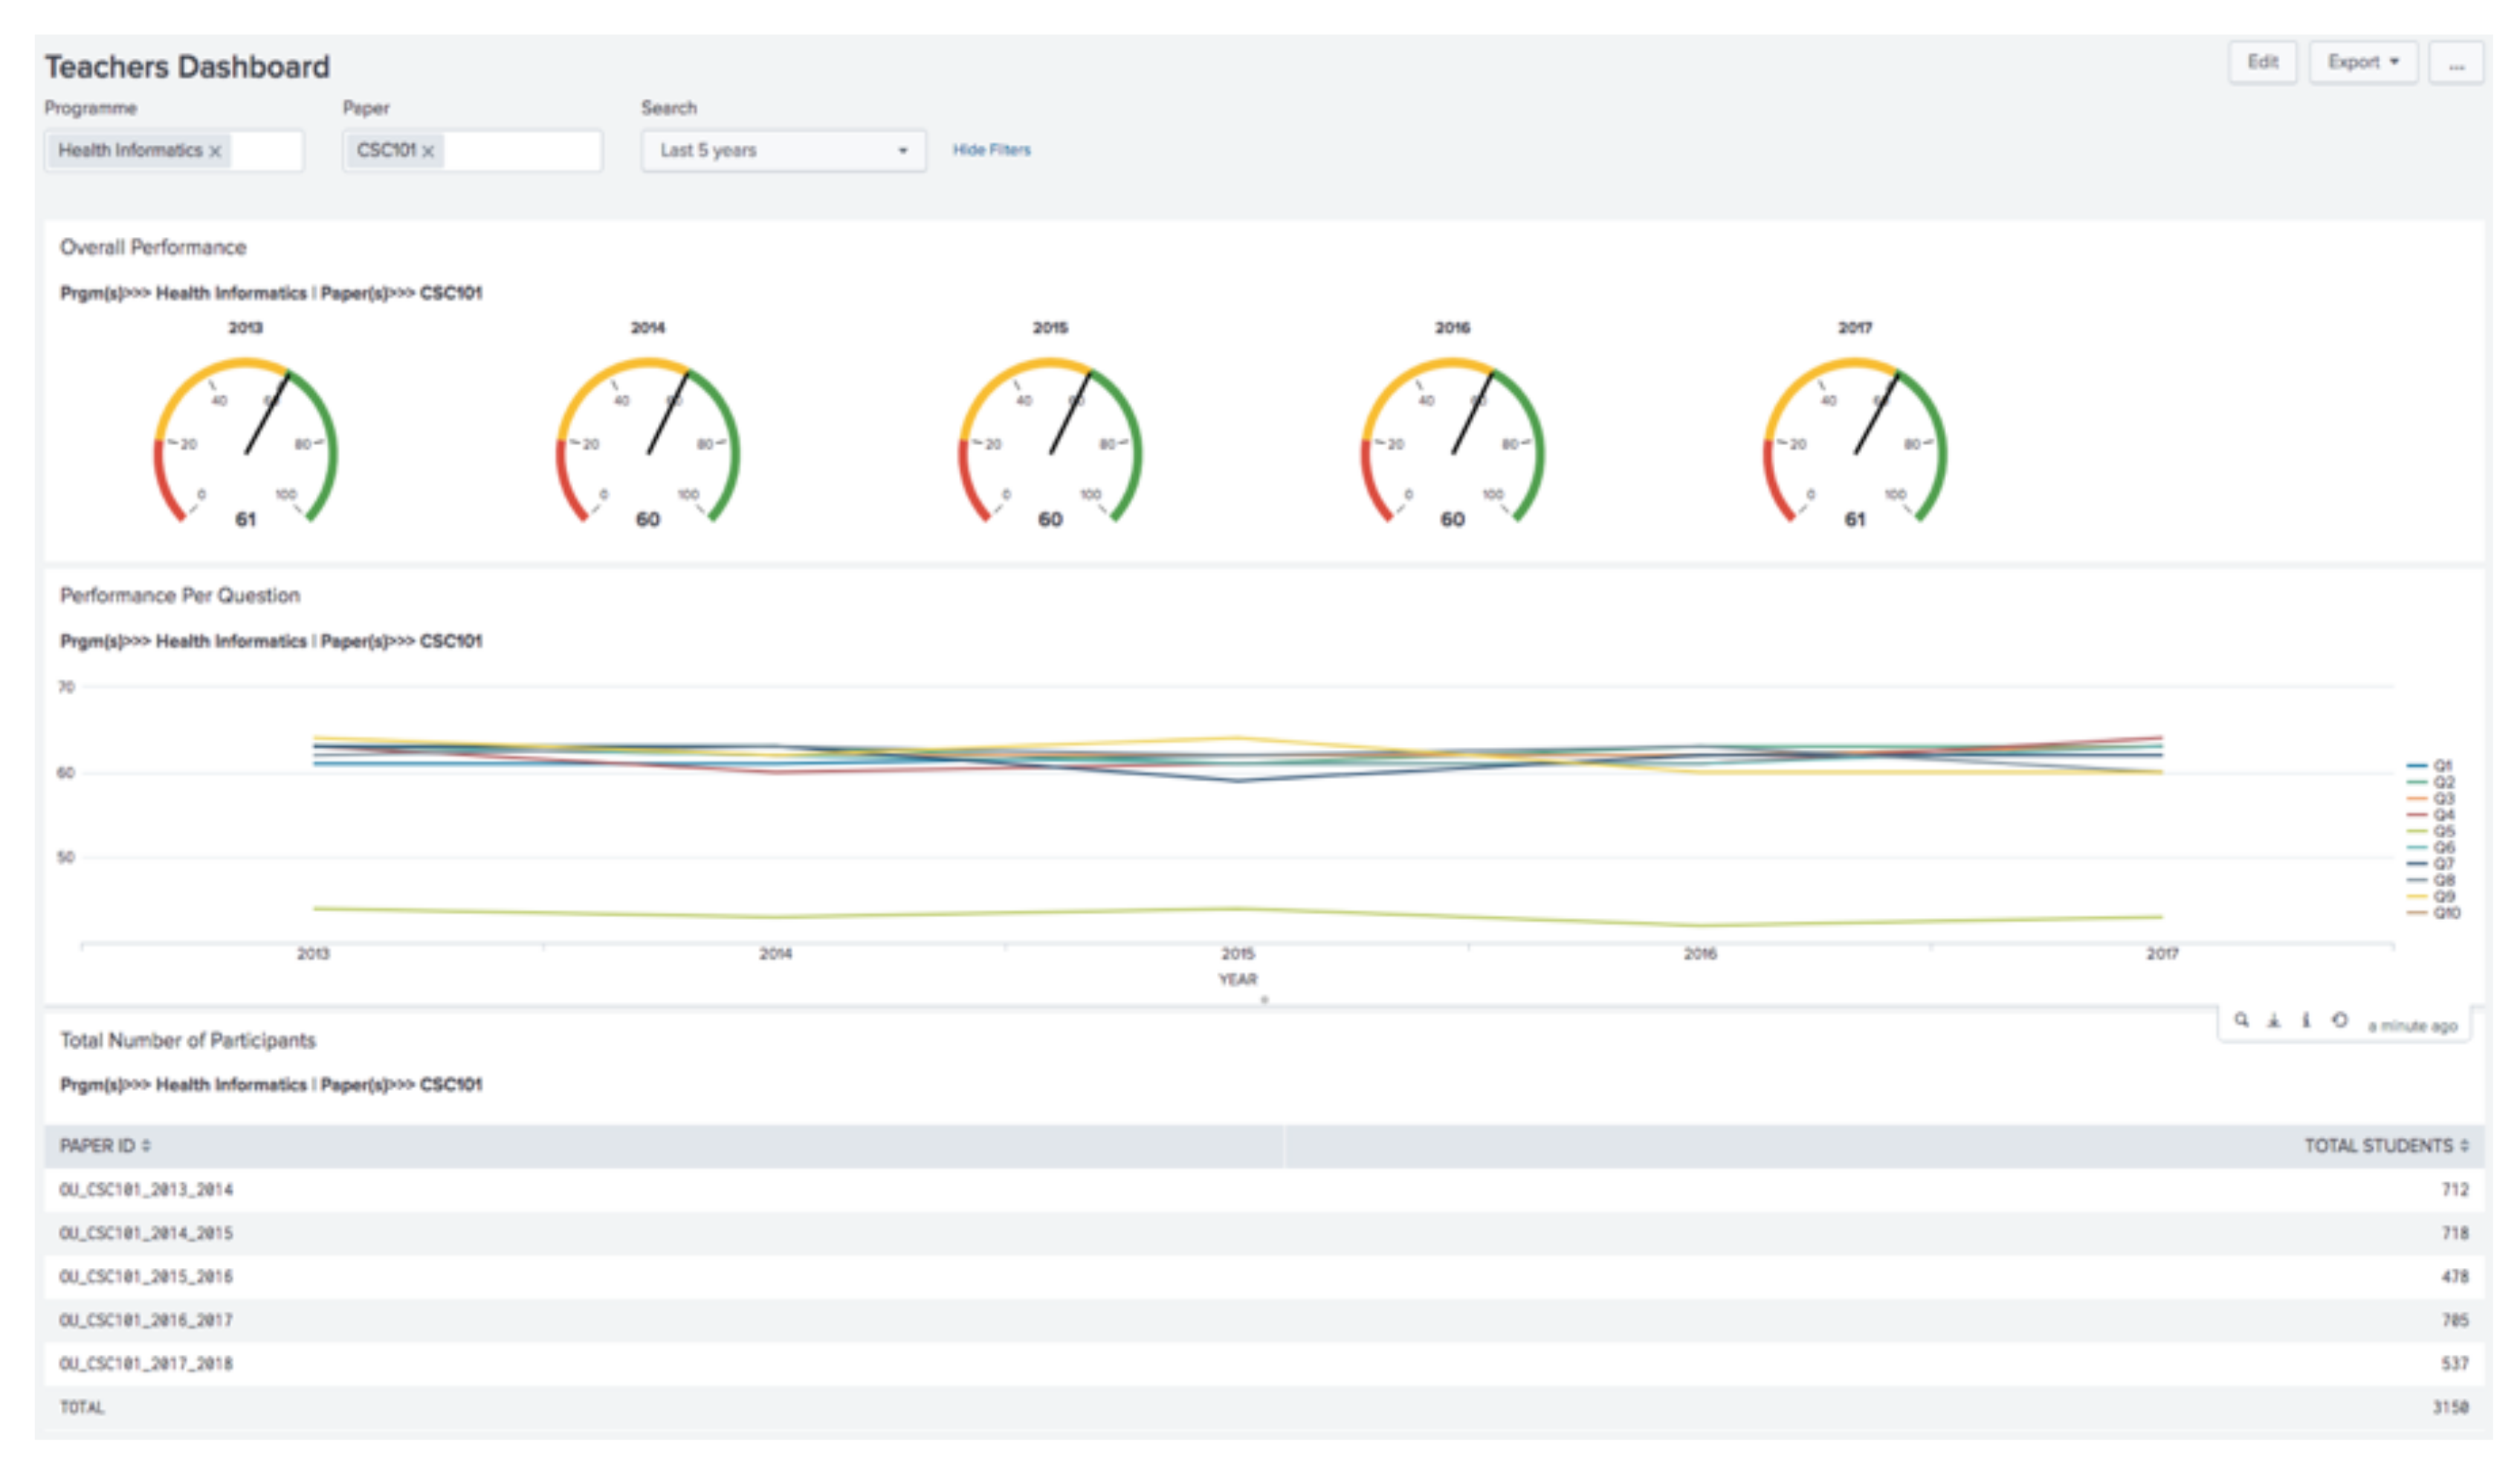
The “Overall Performance” panel in the dashboard (see
Figure 9), suggests that students from the Health Informatics programme who participated in the CSC101 paper scored an average of 60% for the five-year period. This can be interpreted as a high score because it appears to fall into the range of 60–100. On the other hand, looking at the “Performance Per Question” panel, it reveals that only Q5 (To what extent has this module increased your interest in this area?) consistently appears below 50% on the line chart for the entire five years period. This kind of performance outcome may suggest to the teacher that even though students generally, seem to be satisfied with this paper, the result also reveals that concerns with regards to Q5 need to be addressed. The teacher may need to carry out a further investigation on what Q5 is trying to address; perhaps to find out more about what will interest this category of students in this paper. Hence, the TOM TA Cycle may then start again and investigate Q5 further to improve teaching practices and student learning outcome.
8. Discussion and Conclusions
Advancements in technology has made it possible for the Higher Education to keep generating more data than ever before, such data includes; Administrative, Departmental, Research, Student, Teaching, Curriculum, IT, and Security Data. Hence there is a need for more computational and analytical capacity to transform these vast sums of both structured and unstructured data into meaningful insights.
Learning analytics has already become an integral part of the educational system, which now extends further to teaching analytics [
44,
60]. Hence, putting analytics into the hands of administrators and educators is likely to advance this cause, encouraging teachers to reflect on and improve their teaching to improve on their own teaching outcome and experience. Issues of privacy and ethical concerns have often prevented researchers from accessing data for research purposes. Implementing a big data system such as Splunk Enterprise would help mitigate institutional data challenges such as; security and privacy concerns, linking institutional data, promoting the culture of analytics in higher education, etc.
Our research aims to support a culture of data-informed decision making in higher education, which also has a broader implication to Big Data research in education. In this article, we proposed a teaching outcome model (TOM) which follows a data science approach that incorporates the collection, analysis and delivery of data-driven evidence to inform teaching analytics. Furthermore, we simulated student evaluation of teaching with the purpose of developing, an example of a teachers’ dashboards.
In this line of research we believe that institutions that utilise Big Data to collect, analyse and visualise their data will gain a competitive advantage over their peers. We also suggest a data governance framework as key to making institutional data more accessible to researchers to enhance institutional reputation, research and development.
Work presented in this article has some limitations. First, the data used in the analysis and the generation of teachers’ dashboard though demonstrated a proof-of-concept, the results are not based on authentic settings. Secondly, the data used are quantitative, not qualitative. Thirdly, the dashboards have not been shared and discussed with teachers, and hence, the value of this approach is yet to be examined. We hope to test TOM on real-data to gain better insights and develop more uses cases that would ultimately improve teaching practices and student’s learning experiences.
References
Author Contributions
Conceptualization, B.K.D. and I.G.N.; Methodology, B.K.D. and I.G.N.; Software, I.G.N.; Validation, B.K.D. and R.J.B.; Formal Analysis, I.G.N.; Investigation, I.G.N.; Data Curation, I.G.N.; Writing—Original Draft Preparation, I.G.N.; Visualization, I.G.N.; Supervision, B.K.D. and R.J.B.; Project Administration, B.K.D.
Funding
The research was funded through the University of Otago Doctoral Scholarship provided to Ifeanyi Glory Ndukwe.
Acknowledgments
The research reported here is part of an ongoing institutional project on Technology Enhanced Analytics (TEA). We thank members of the Technology Enhanced Learning and Teaching (TELT) Committee of the University of Otago, New Zealand for support and for providing constructive feedback. We also recognise Splunk Training + Certification for making training available.
Conflicts of Interest
The authors declare no conflict of interest.
References
- Henke, N.; Libarikian, A.; Wiseman, B. Straight talk about big data. In McKinsey Quarterly; McKinsey & Company: New York, NY, USA, 2016; Available online: https://www.mckinsey.com/business-functions/digital.../straight-talk-about-big-data (accessed on 12 January 2018).
- Daniel, B. Big Data and analytics in higher education: Opportunities and challenges. Br. J. Educ. Technol. 2015, 46, 904–920. [Google Scholar] [CrossRef]
- Chaurasia, S.S.; Frieda Rosin, A. From Big Data to Big Impact: Analytics for teaching and learning in higher education. Ind. Commer. Train. 2017, 49, 321–328. [Google Scholar] [CrossRef]
- Mor, Y.; Ferguson, R.; Wasson, B. Learning design, teacher inquiry into student learning and learning analytics: A call for action. Br. J. Educ. Technol. 2015, 46, 221–229. [Google Scholar] [CrossRef]
- Avramides, K.; Hunter, J.; Oliver, M.; Luckin, R. A method for teacher inquiry in cross-curricular projects: Lessons from a case study. Br. J. Educ. Technol. 2015, 46, 249–264. [Google Scholar] [CrossRef]
- OECD. Teachers for the 21st Century: Using Evaluation to Improve Teaching; OECD Publishing Organisation for Economic Co-Operation Development: Paris, France, 2013. [Google Scholar]
- Santiago, P.; Benavides, F. Teacher evaluation: A conceptual framework and examples of country practices. In Proceedings of the Paper for Presentation at the OECD Mexico, Mexico City, Mexico, 1–2 December 2009; pp. 1–2. [Google Scholar]
- Daniel, B.K.; Butson, R. Technology Enhanced Analytics (TEA) in Higher Education. In Proceedings of the International Association for Development of the Information Society, Fort Worth, TX, USA, 22–24 October 2013. [Google Scholar]
- Marsh, J.A.; Farrell, C.C. How leaders can support teachers with data-driven decision making: A framework for understanding capacity building. Educ. Manag. Adm. Lead. 2015, 43, 269–289. [Google Scholar] [CrossRef]
- Kaufman, T.E.; Graham, C.R.; Picciano, A.G.; Popham, J.A.; Wiley, D. Data-driven decision making in the K-12 classroom. In Handbook of Research on Educational Communications and Technology; Springer: Berlin/Heidelberg, Germany, 2014; pp. 337–346. [Google Scholar]
- Greer, J.; Mark, M. Evaluation methods for intelligent tutoring systems revisited. Int. J. Artif. Intell. Educ. 2016, 26, 387–392. [Google Scholar] [CrossRef]
- Bueckle, M.G.N.S.A.; Börner, K. Empowering instructors in learning management systems: Interactive heat map analytics dashboard. Retrieved Nov. 2017, 2, 2017. [Google Scholar]
- Ong, V.K. Big data and its research implications for higher education: Cases from UK higher education institutions. In Proceedings of the 2015 IIAI 4th International Congress on Advanced Applied Informatics, Okayama, Japan, 12–16 July 2015; pp. 487–491. [Google Scholar]
- Mandinach, E.B. A perfect time for data use: Using data-driven decision making to inform practice. Educ. Psychol. 2012, 47, 71–85. [Google Scholar] [CrossRef]
- Prinsloo, P.; Slade, S. An evaluation of policy frameworks for addressing ethical considerations in learning analytics. In Proceedings of the Third International Conference on Learning Analytics and Knowledge, Leuven, Belgium, 8–12 April 2013; pp. 240–244. [Google Scholar]
- Daniel, B. Big Data and data science: A critical review of issues for educational research. Br. J. Educ. Technol. 2017. [Google Scholar] [CrossRef]
- Fan, J.; Han, F.; Liu, H. Challenges of big data analysis. Natl. Sci. Rev. 2014, 1, 293–314. [Google Scholar] [CrossRef] [PubMed]
- Siemens, G.; Long, P. Penetrating the fog: Analytics in learning and education. EDUCAUSE Rev. 2011, 46, 30. [Google Scholar]
- Wagner, E.; Ice, P. Data changes everything: Delivering on the promise of learning analytics in higher education. EDUCAUSE Rev. 2012, 47, 32. [Google Scholar]
- Hrabowski, F.A., III; Suess, J. Reclaiming the lead: Higher education’s future and implications for technology. EDUCAUSE Rev. 2010, 45, 6. [Google Scholar]
- Picciano, A.G. The evolution of big data and learning analytics in American higher education. J. Asynchronous Learn. Netw. 2012, 16, 9–20. [Google Scholar] [CrossRef]
- Borgman, C.L.; Abelson, H.; Dirks, L.; Johnson, R.; Koedinger, K.R.; Linn, M.C.; Lynch, C.A.; Oblinger, D.G.; Pea, R.D.; Salen, K. Fostering Learning in the Networked World: The Cyberlearning Opportunity and Challenge; A 21st-Century Agenda for the National Science Foundation; National Science Foundation: Alexandria, VA, USA, 2008. [Google Scholar]
- Butson, R.; Daniel, B. The Rise of Big Data and Analytics in Higher Education. In The Analytics Process; Auerbach Publications: Boca Raton, FL, USA, 2017; pp. 127–140. [Google Scholar]
- Choudhury, S.; Hobbs, B.; Lorie, M.; Flores, N. A framework for evaluating digital library services. D-Lib Mag. 2002, 8, 1082–9873. [Google Scholar] [CrossRef]
- Xu, B.; Recker, M. Teaching Analytics: A Clustering and Triangulation Study of Digital Library User Data. Educ. Technol. Soc. 2012, 15, 103–115. [Google Scholar]
- Russom, P. Big data analytics. TDWI Best Practices Rep. 2011, 19, 1–34. [Google Scholar]
- Evans, J.R.; Lindner, C.H. Business analytics: The next frontier for decision sciences. Decis. Line 2012, 43, 4–6. [Google Scholar]
- Hong, W.; Bernacki, M.L. A Prediction and Early Alert Model Using Learning Management System Data and Grounded in Learning Science Theory. In Proceedings of the 10th International Conference on Educational Data Mining, Raleigh, NC, USA, 29 June–2 July 2016. [Google Scholar]
- Assunção, M.D.; Calheiros, R.N.; Bianchi, S.; Netto, M.A.; Buyya, R. Big Data computing and clouds: Trends and future directions. J. Parallel Distrib. Comput. 2015, 79, 3–15. [Google Scholar] [CrossRef]
- ur Rehman, M.H.; Chang, V.; Batool, A.; Wah, T.Y. Big data reduction framework for value creation in sustainable enterprises. Int. J. Inf. Manag. 2016, 36, 917–928. [Google Scholar] [CrossRef]
- Gandomi, A.; Haider, M. Beyond the hype: Big data concepts, methods, and analytics. Int. J. Inf. Manag. 2015, 35, 137–144. [Google Scholar] [CrossRef]
- Joseph, R.C.; Johnson, N.A. Big data and transformational government. IT Prof. 2013, 15, 43–48. [Google Scholar] [CrossRef]
- Waller, M.A.; Fawcett, S.E. Data science, predictive analytics, and big data: A revolution that will transform supply chain design and management. J. Bus. Logist. 2013, 34, 77–84. [Google Scholar] [CrossRef]
- Bihani, P.; Patil, S. A comparative study of data analysis techniques. Int. J. Emerg. Trends Technol. Comput. Sci. 2014, 3, 95–101. [Google Scholar]
- Bousbia, N.; Belamri, I. Which contribution does EDM provide to computer-based learning environments. In Educational Data Mining; Springer: Berlin/Heidelberg, Germany, 2014; pp. 3–28. [Google Scholar]
- He, W. Examining students’ online interaction in a live video streaming environment using data mining and text mining. Comput. Hum. Behav. 2013, 29, 90–102. [Google Scholar] [CrossRef]
- Ayesha, S.; Mustafa, T.; Sattar, A.R.; Khan, M.I. Data mining model for higher education system. Eur. J. Sci. Res. 2010, 43, 24–29. [Google Scholar]
- Pal, S. Mining educational data to reduce dropout rates of engineering students. Int. J. Inf. Eng. Electron. Bus. 2012, 4, 1. [Google Scholar] [CrossRef]
- Parack, S.; Zahid, Z.; Merchant, F. Application of data mining in educational databases for predicting academic trends and patterns. In Proceedings of the 2012 IEEE International Conference on Technology Enhanced Education (ICTEE), Kerala, India, 3–5 January 2012; pp. 1–4. [Google Scholar]
- Gupta, S.; Choudhary, J. Academic Analytics: Actionable Intelligence in Teaching and Learning for Higher Education in Indian Institutions. In Proceedings of the International Conference on Skill Development & Technological Innovations for Economic Growth (ICST-2015), Ghaziabad, India, 28 November 2015. [Google Scholar] [CrossRef]
- Arnold, K.E. Signals: Applying academic analytics. Educ. Q. 2010, 33, n1. [Google Scholar]
- Arnold, K.E.; Pistilli, M.D. Course signals at Purdue: Using learning analytics to increase student success. In Proceedings of the 2nd International Conference on Learning Analytics and Knowledge, Vancouver, BC, Canada, 29 April–2 May 2012; pp. 267–270. [Google Scholar]
- Pantazos, K.; Vatrapu, R. Enhancing the Professional Vision of Teachers: A Physiological Study of Teaching Analytics Dashboards of Students’ Repertory Grid Exercises in Business Education. In Proceedings of the 49th Hawaii International Conference on System Sciences (HICSS), Grand Hyatt, Kauai, HI, USA, 5–8 January 2016. [Google Scholar]
- Rienties, B.; Boroowa, A.; Cross, S.; Kubiak, C.; Mayles, K.; Murphy, S. Analytics4Action evaluation framework: A review of evidence-based learning analytics interventions at the Open University UK. J. Interact. Media Educ. 2016, 2016. [Google Scholar] [CrossRef]
- Daniel, B. Big Data and Learning Analytics in Higher Education: Current Theory and Practice; Springer: Berlin/Heidelberg, Germany, 2016. [Google Scholar]
- Martin, K.E. Ethical issues in the big data industry. MIS Q. Executive 2015, 14, 2. [Google Scholar]
- Prinsloo, P.; Slade, S. Big data, higher education and learning analytics: Beyond justice, towards an ethics of care. In Big Data and Learning Analytics in Higher Education; Springer: Berlin/Heidelberg, Germany, 2017; pp. 109–124. [Google Scholar]
- Marks, A.; Maytha, A.A. Higher Education Analytics: New Trends in Program Assessments. In World Conference on Information Systems and Technologies; Springer: Berlin/Heidelberg, Germany, 2018; pp. 722–731. [Google Scholar]
- Dringus, L.P. Learning analytics considered harmful. J. Asynchronous Learn. Netw. 2012, 16, 87–100. [Google Scholar] [CrossRef]
- Dyckhoff, A.L.; Zielke, D.; Bültmann, M.; Chatti, M.A.; Schroeder, U. Design and implementation of a learning analytics toolkit for teachers. J. Educ. Technol. Soc. 2012, 15, 58–76. [Google Scholar]
- Roberts, L.D.; Chang, V.; Gibson, D. Ethical considerations in adopting a university-and system-wide approach to data and learning analytics. In Big Data and Learning Analytics in Higher Education; Springer: Berlin/Heidelberg, Germany, 2017; pp. 89–108. [Google Scholar]
- Griffiths, D. The implications of analytics for teaching practice in higher education. CETIS Anal. Ser. 2012, 1, 1–23. [Google Scholar]
- Ali, L.; Asadi, M.; Gašević, D.; Jovanović, J.; Hatala, M. Factors influencing beliefs for adoption of a learning analytics tool: An empirical study. Comput. Educ. 2013, 62, 130–148. [Google Scholar] [CrossRef]
- U.S. Department Education. Enhancing Teaching and Learning through Educational Data Mining and Learning Analytics: An Issue Brief. Available online: https://tech.ed.gov/wp-content/uploads/2014/03/edm-la-brief.pdf (accessed on 9 August 2018).
- Bitincka, L.; Ganapathi, A.; Sorkin, S.; Zhang, S. Optimizing Data Analysis with a Semi-structured Time Series Database. SLAML 2010, 10, 7. [Google Scholar]
- Van Loggerenberg, F.; Vorovchenko, T.; Amirian, P. Introduction—Improving Healthcare with Big Data. In Big Data in Healthcare; Springer: Berlin/Heidelberg, Germany, 2017; pp. 1–13. [Google Scholar]
- Zadrozny, P.; Kodali, R. Big Data Analytics Using Splunk: Deriving Operational Intelligence from Social Media, Machine Data, Existing Data Warehouses, and Other Real-Time Streaming Sources; Apress: New York, NY, USA, 2013. [Google Scholar]
- Carasso, D. Exploring Splunk; Published by CITO Research: New York, NY, USA, 2012. [Google Scholar]
- Emery, S. Factors for consideration when developing a bring your own device (BYOD) strategy in higher education. In Applied Information Management Master’s Capstone Projects and Papers; University of Oregon: Eugene, OR, USA, 2012. [Google Scholar]
- Lodge, J.M.; Corrin, L. What data and analytics can and do say about effective learning. Sci. Learn. 2017, 2, 5. [Google Scholar] [CrossRef]
© 2018 by the authors. Licensee MDPI, Basel, Switzerland. This article is an open access article distributed under the terms and conditions of the Creative Commons Attribution (CC BY) license (http://creativecommons.org/licenses/by/4.0/).
