Article

DEPART: Multi-Task Interpretable Depression and Parkinson’s Disease Detection from In-the-Wild Video Data


St. Petersburg Federal Research Center of the Russian Academy of Sciences (SPC RAS), 199178 St. Petersburg, Russia
*
Author to whom correspondence should be addressed.
Big Data Cogn. Comput. 2026, 10(3), 89; https://doi.org/10.3390/bdcc10030089
Submission received: 3 February 2026 / Revised: 2 March 2026 / Accepted: 14 March 2026 / Published: 16 March 2026

Abstract

Automated video-based detection of cognitive disorders can enable a scalable non-invasive health monitoring. However, existing methods focus on a single disease and provide limited interpretability, whereas real-world videos often contain co-occurring conditions. We propose a novel unified multi-task method to detect depression and Parkinson’s disease (PD) from in-the-wild video data called DEPART (DEpression and PArkinson’s Recognition Technique). It performs body region extraction, Contrastive Language-Image Pre-training (CLIP)-based visual encoding, Transformer-based temporal modeling, and prototype-aware classification with a gated fusion technique. Gradient-based attention maps are used to visualize task-specific regions that drive predictions. Experiments on the In-the-Wild Speech Medical (WSM) corpus demonstrate competitive performance: the multi-task model achieves Recall of 82.39% for depression and 78.20% for PD, compared with 87.76% and 78.20%, for the best single-task models. The multi-task learning initially increases false positives for healthy persons in the PD subset, mainly due to annotation–modality mismatches, static visual content misinterpreted as motor impairments, and occasional body detection failures. After cleaning the test data, Recall for healthy individuals becomes comparable across models; the multi-task model improves Recall for both depression (from 82.39% to 87.50%) and PD (from 78.20% to 86.14%), suggesting better robustness for real-life clinical applications.

1. Introduction

Over the past decade, there has been an increase in the number of technical and medical publications dedicated to an automated or automatic detection of diseases such as dementia, depression, Parkinson’s disease (PD), and others using visual modality. Although these diseases are highly prevalent and are among the leading causes of mortality, their successful detection and consequently the timely initiation of treatment can be difficult. In this regard, early non-invasive detection of symptoms and their alleviation are of significant interest to researchers. Modern research focuses on development of automated systems based on quantitative objective and neural network-based methods using different modalities and their fusion techniques, as well as interpretable artificial intelligence methods. However, research relying on the visual modality in the wild is significantly limited, since many clinical corpora either do not contain visual data or rely on strict protocols that restrict possible diversity and representativeness.
Potential risk factors for the development of cognitive impairment and dementia include PD, depression, post-traumatic stress disorder, chronic stress, anxiety, and others [1]. According to the WHO (https://www.who.int/news-room/fact-sheets/detail/depression, accessed 26 January 2026), depression is one of the most common cognitive disorders worldwide. At the same time, it is also considered one of the important non-motor symptoms of Parkinson’s and Alzheimer’s diseases, and its early detection and timely treatment can significantly improve patients’ quality of life [2,3,4].
In recent years, video-based systems demonstrate high accuracy in detecting affective states and depression in the general population by analyzing facial features [5,6,7]. Significant progress has also been made in using motor symptoms such as facial expressions, action units, eye, and gait movement for the automatic prediction of PD using artificial intelligence [8,9]. However, despite the demonstrated potential, many of these works are based on small corpora and lack diversity.
Recent studies on the automatic detection of depression and PD sometimes consider multi-task disease detection. These include binary detection of healthy/sick and multiclass detection of disease severity [10], as well as the detection of both gender and disease [11], among others. However, the simultaneous detection of multiple diseases using the video modality has hardly been explored. The closest work to this task is presented in [12], where the prediction of various indicators of psychological well-being and cognitive health was considered using the same data, but training and inference were carried out independently.
Despite recent advances, methods for an automated prediction of multiple diseases based on video remain significantly underexplored. The challenges in this field are associated both with the lack of representative and accessible video data and with the increased complexity of disease detection in the presence of comorbid conditions. However, the use of open source data and deep neural networks capable of detecting subtle deviations in facial expressions and gestures suggest a robust method for detecting multiple diseases. Furthermore, interpretation methods for attention mechanisms [13] will enable medical specialists to understand the logic of the proposed method.
The main contributions of this article are as follows:
  • We propose a unified multi-task method for the simultaneous video-based detection of depression and PD from in-the-wild recordings called DEPART (DEpression and PArkinson’s Recognition Technique).
  • We introduce a prototype-aware temporal architecture with gated fusion that combines discriminative classification and exemplar-based reasoning for robust disease prediction.
  • We adapt gradient-based attention visualization to Contrastive Language-Image Pre-training (CLIP) and Transformer-based video encoders, enabling the interpretation of task-specific spatial regions of interest.
  • We provide a comprehensive experimental study analyzing multi-task vs. single-task learning, architectural depth, prototype learning, and loss design.
  • We demonstrate a competitive quantitative performance against State-of-the-Art (SOTA) methods on the In-the-Wild Speech Medical (WSM) corpus and analyze computational efficiency and inference characteristics.
The remainder of this article is structured as follows. Section 2 reviews the SOTA methods for the detection of depression and PD. Section 3 presents a comprehensive description of the proposed method. Experimental results are reported in Section 4. Section 6 provides a qualitative visualization of task-specific regions of interest and an interpretability analysis of the model prediction. Section 7 discusses the results obtained, computational complexity, and model limitations. Finally, Section 8 summarizes the main findings and outlines directions for future research.

2. Related Work

This section provides a brief review of the SOTA methods used for automated detection of depression and PD. Summary information about the existing video-based methods is presented in Table 1.
Depression detection based on video features is generally considered in the literature more often and in greater detail than the detection of PD or other disorders [26].
The classical corpora include AVEC 2013 [27] and AVEC 2014 [28] (both known as the AViD corpus), which contain audiovisual features from video recordings of healthy individuals and those with depression. These corpora were recorded in German and follow a strict protocol under uniform conditions, which may limit the representativeness of the samples. These corpora are available upon a request.
Some frequently used multimodal corpora also include the Distress Analysis Interview Corpus (DAIC), DAIC-WOZ [29], and the Extended DAIC (E-DAIC) [30], which are multimodal collections of clinical interviews with patients with a depression and a post-traumatic stress disorder. Despite the large number of studies on these corpora [17], they contain only prepared video modality features extracted with OpenFACE [31] such as three-dimensional FL, FAU, GT, and head PL, rather than a raw video itself, which limits the possibilities for exploring other aspects of the video modality.
Another, the WSM corpus [32], is an open audiovisual corpus of vlogs from healthy individuals, those with depression and with PD. The video recordings were collected from YouTube and manually verified using crowd-sourcing. The depression sub-corpus contains 267 videos of different speakers reporting depression and 276 videos from a control group. All videos are balanced by recording duration, speaker age and gender, as well as divided into Train, Development, and Test subsets. All videos contain speech in English, although not all the speakers are native ones. The video quality also varies greatly, making thorough pre-processing necessary before using this corpus. The entire corpus is published for non-commercial use (https://www.dropbox.com/scl/fo/jp3kc9pgjyuazmcfhjyup/ABSxzJIpfeybFHEL3p8sjWM?rlkey=4gedeh8kcpkiuoa90rexodcfy&e=1&dl=0, accessed 26 January 2026). In the original work, the authors of the WSM corpus considered only the audio modality, whereas our previous work [23] considered additional modalities, including text and video. The best video-based performance was achieved using an ensemble of classifiers. Nevertheless, the results obtained with individual classifiers also demonstrated the potential for leveraging this highly variable and noisy data for cognitive disease prediction.
Another similar vlog corpus for the depression detection task is D-Vlog [22], which also contains YouTube vlogs. In total, the corpus includes nearly 1000 vlogs of different individuals, balanced across diagnostic labels and carefully validated. This corpus is available upon request (https://sites.google.com/view/jeewoo-yoon/dataset, accessed 26 January 2026). Although the best result in the work was achieved using an audiovisual deep neural network, the authors also present unimodal results. Moreover, the authors note significant variability in model performance depending on the gender distribution across the corpus samples.
For depression detection from video, various methods have been studied. However, due to the limitations of the available feature-based corpora, combinations of CNNs and Long Short-Term Memory (LSTM) models have become the most common solution for analyzing video features [14,15,16]. More recent studies apply Transformer-based architectures to already extracted features, as in [17], where the authors’ own Transformer is compared with the Perceiver architecture [18] and other SOTA methods on DAIC/E-DAIC and D-Vlog. In raw video data analysis, Transformer-based architectures leveraging attention mechanisms are also applied for latent feature extraction and classification, as in the visual block of the multimodal system presented in [19].
Few studies explore depressive symptoms in the presence of other cognitive diseases. For example, Kyprakis et al. [20] investigated the prediction of depressive symptoms and their severity from short medical video recordings of PD patients. The study used a proprietary corpus including short emotional video clips of 183 PD patients, along with annotations of depressive states. The best results were achieved with a ViT-based model using SWIN [21].
Also noteworthy is the method that investigated the visual modality in a comprehensive well-being and cognitive assessment of older adults, presented in [12]. The authors considered various multimodal features derived from the clinical corpus I-CONECT [33], which includes diverse annotations of older adults’ health. In the context of the visual modality, the following features were considered, namely DINOv2 embeddings [34], FE, FL, FAU, and cardiovascular features extracted from video using the pyVHR tool [35]. To integrate features from different modalities and account for temporal sequences of frames, a Hidden Markov Model (HMM) was used, after which video features were fed into simple classifiers or logistic regressors, depending on the task. Compared to audio and text modalities, facial and cardiovascular features or their combinations were only slightly above random chance levels (AUROC > 0.5) for the cognitive ability assessment. However, they almost always demonstrated the best results in the psychological well-being assessment, highlighting a potential of video-based for psychological health evaluation.
There is also a substantial number of works on multi-task detection of violations/issues related to depression and cognitive disorders. For example, Teng et al. [36] proposed using multi-task classification of depression and sentiment, using the latter as an auxiliary component when training deep neural network models. Similarly, Yang et al. [37] used multi-task learning with a BERT-based model to incorporate time-perspective cues for suicidal ideation detection. Also, Hu et al. [38] considered, in a multi-task manner, predicting depression severity jointly with a suicide risk via a multimodal fusion of audio and text embeddings. However, a joint consideration of video modality and multi-task learning in in-the-wild conditions is not encountered in the literature.
The use of video-based methods in the detection of cognitive disorders in spontaneous communication remains relatively uncommon compared to the use of other modalities and under stricter conditions, such as methods that include analysis of handwriting [39] or images of gait [9,40].
One of the main reasons why machine learning methods to the PD detection lag those for depression is the limited availability of video data and the absence of a clear corpora. The PD sub-corpus of WSM [32] includes 209 videos of individuals who reported having PD and 204 videos of control individuals. The entire corpus was published for non-commercial use, although some links have since expired because access to the videos may have been restricted over time. This subset was examined in our previous study [23], but the results for PD detection were inferior to those for depression detection. Nevertheless, the visual modality proved quite promising, despite the high level of noise in the corpus.
The YouTubePD corpus [24] offers another relevant multimodal resource for PD, containing more than 200 videos of healthy individuals and those with PD gathered from YouTube. The authors are among the first to propose the use of deep visual and multimodal methods for the disease detection in real-world contexts. As baselines, they explored FE extracted from the pre-trained ResNet50 model and FL obtained from the pre-trained region encoders with spatial-temporal attention and a multi-task hierarchy-guided loss. However, the corpus includes various types of videos such as TV shows and film clips, making pre-processing and consistent analysis challenging. The entire corpus was published for non-commercial use (https://github.com/samwli/YouTubePD-data, accessed 26 January 2026).
One of the earliest comprehensive studies in this area is presented in ref. [41], where interpretable acoustic, prosodic, and visual features were integrated after sequential forward feature selection, achieving high accuracy in the PD detection, even though the authors did not specifically consider visual-only methods. Calvo-Ariza et al. [25] focus on automatic PD identification from clinical video data, with a detailed analysis of automatically extracted FE and FAU feature sets from multi-frame sequences. Lv et al. [42] introduce a novel audiovisual corpus for the PD detection in Mandarin and proposes a multimodal diagnostic method based on a deep neural network.
It is worth noting the study Junaid et al. [43], which proposes creating an integrated framework for a multi-task detection of depression and PD based on time-series data from the Parkinson’s Progression Markers Initiative and magnetic resonance imaging. Although this work demonstrates effective joint detection of these diseases, it does not consider video data.
In reviewing existing research on automated detection of depression and PD from video, it is important to note that many studies have not thoroughly examined modern neural network-based features (e.g., CLIP). Even fewer studies rely on publicly available corpora recorded under diverse conditions, thereby limiting the potential for applying such methods in real-world settings. Moreover, despite active research in this area, there is still limited consideration of data where multiple related disorders can co-occur. This highlights a relevance of our study, which proposes a novel method for the multi-task depression and PD detection using visual neural network models and open, in-the-wild YouTube vlog data from the WSM corpus.

3. Proposed Method

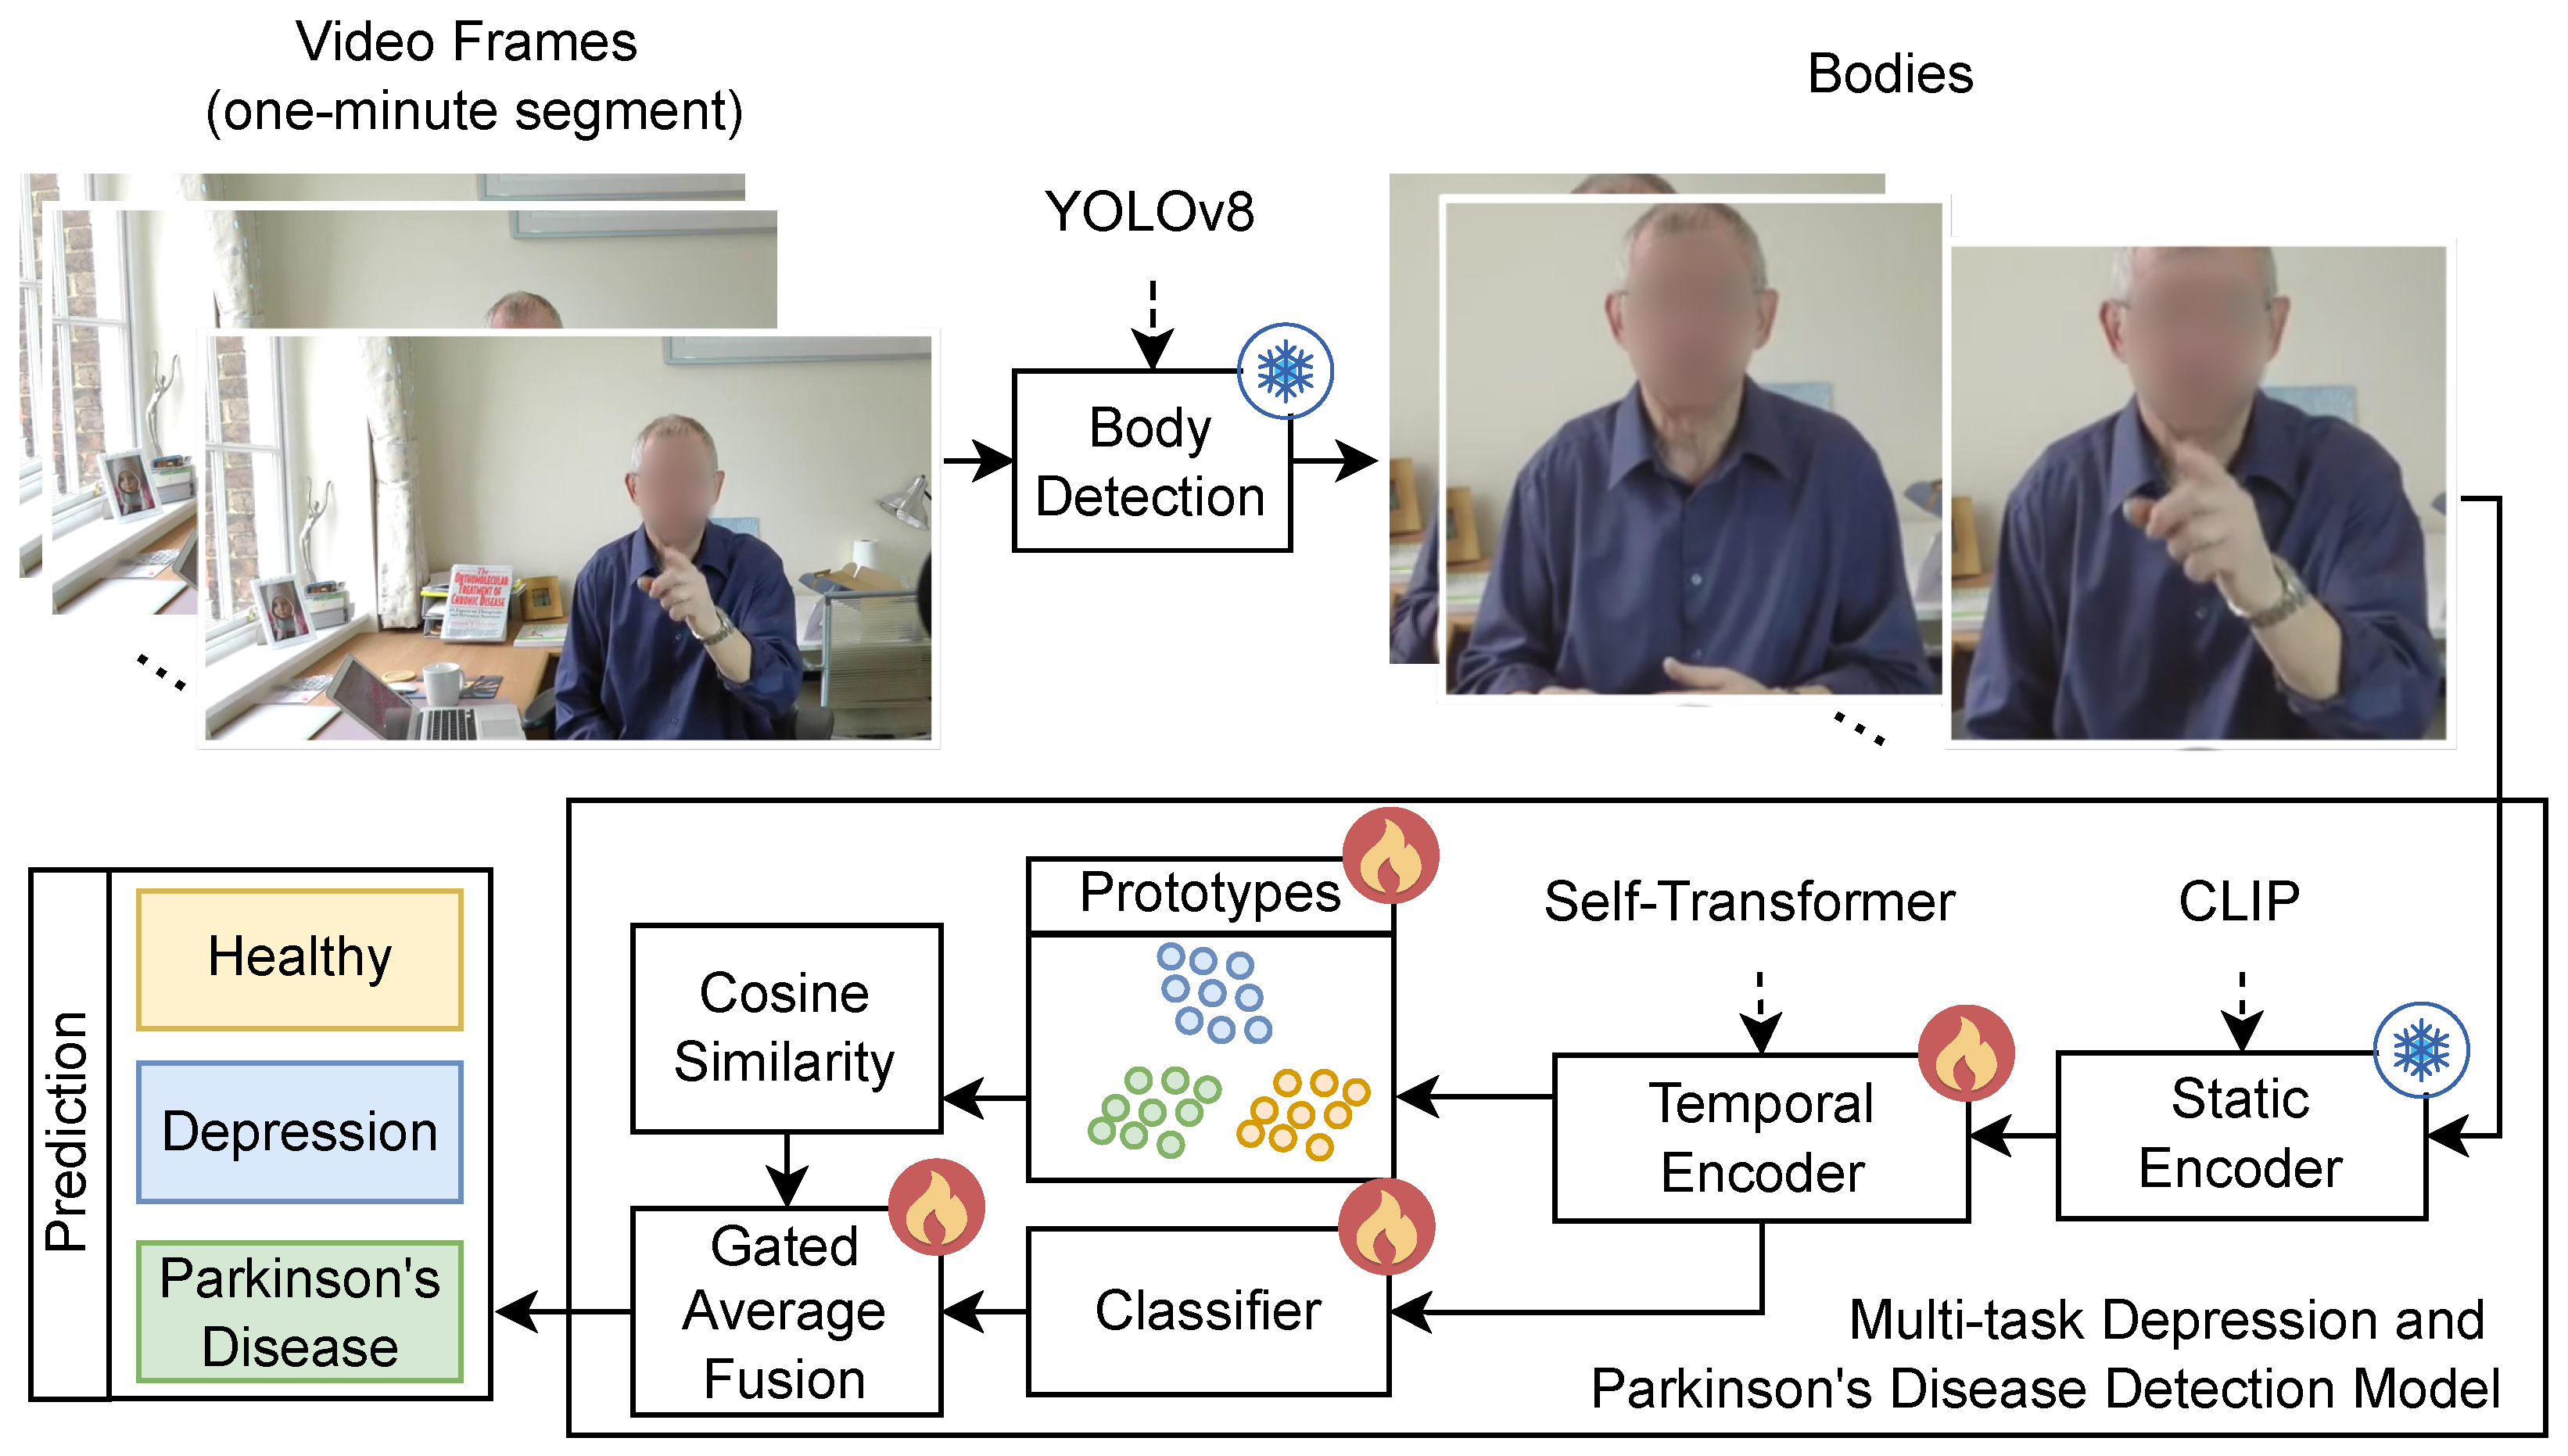
DEPART is a novel method for the video-based detection of neurological and cognitive disorders, specifically depression and PD. The method addresses three core challenges: computational scalability for long clinical videos, robust spatio-temporal feature encoding, and improved generalization through prototype-guided reasoning and post hoc refinement. The overall pipeline of the DEPART method, presented in Figure 1, comprises two stages: region of interest detection and multi-task depression and PD detection. Each stage is guided by domain-specific considerations and optimized for both prediction accuracy and computational efficiency.
The input data for DEPART are frames from a one-minute segment. For each frame, a region of interest is detected, corresponding to the human body. This eliminates any redundant information from the frame. The frames are then passed through a static encoder, which extracts frame-level features. These features are combined into a sequence and passed to a temporal encoder. The temporal encoder models task-specific features based on the input sequence. These features are then fed into a classifier that produces a vector of class probabilities. Additionally, these features are compared to prototype representations for each class to form a new class probability vector. Both the probability vectors from the classifier and the prototype are averaged using a gating attention mechanism.

3.1. Data Pre-Processing

Raw videos last for several minutes, placing significant demands on memory and computational cost for deep learning models. To address this challenge, each video is divided into non-overlapping one-minute segments, providing a sufficient temporal context. Each segment was additionally pre-processed automatically as follows: segments for which the MediaPipe toolkit (https://ai.google.dev/edge/mediapipe/solutions/guide, accessed 26 January 2026) failed to detect a face region were removed, thereby filtering out segments without a person present in the frame. The speech is then transcribed from the audio track of each segment using Whisper toolkit (https://github.com/openai/whisper, accessed 26 January 2026), after which segments without detected speech were discarded. This further eliminated segments that did not contain explicit communicative interaction.
In addition, the frame rate is reduced to f Frames Per Second (FPS) (equivalently, N = 60 f uniformly spaced frames per one-minute segment), ensuring an even distribution of frames throughout the video. The optimal value of N is determined empirically during the model training process. This subsampling pre-processing is justified by the finding that high-frequency visual changes contribute a little to the detection of motor impairments in PD or affective cues for depression while significantly reducing the input sequence length.
Formally, given an input video V with duration T seconds, originally sampled at f orig FPS, the pre-processing stage generates M non-overlapping segments, { C 1 , C 2 , , C M } , where M = T / 60 . Each segment C i is uniformly downsampled to contain exactly N frames. The resulting sequence of frames per segment C i is denoted as { F i , 1 , F i , 2 , , F i , N } . Subsequent processing, including body detection, feature extraction, and temporal modeling, is performed independently on each segment.

3.2. Body Region Detection

To focus computational cost on diagnostically relevant visual content, namely human body motion, a specialized body detection model is employed. Specifically, YOLOv8 (https://github.com/J3lly-Been/YOLOv8-HumanDetection, accessed 26 January 2026), trained exclusively for body localization and excluding all other classes from the COCO corpus [44] (such as car, dog, chair, etc.), is applied to each frame. YOLOv8 is selected as a stable and efficient detection tool for frame-based body localization, while in our pipeline, a robustness of a single-class human body detection is more critical than adopting the most recent generic detector version. This design choice is primarily motivated by the need for a high detection accuracy: by limiting the model to a single semantic category, a inter-class confusion is eliminated, significantly reducing false positives and improving bounding box consistency.
The YOLOv8 human body detector is used with the default inference settings for the adopted implementation. These settings include a confidence threshold of 0.5 and an intersection over union threshold of 0.5. The input image size is set to 640 × 640 pixels. Only the weights of the detector are replaced with a pre-trained single-class checkpoint for humans’ bodies that is used in our pipeline.
For each frame F i , n , a bounding box B i , n is obtained, and the corresponding region is cropped and resized to a canonical resolution (e.g., 224 × 224 ) for encoding. This ensures consistent spatial input to the static feature extractor.

3.3. Multi-Task Depression and Parkinson’s Disease Detection Model

The proposed model consists of several components: static and temporal feature encoders, a gated residual connection, and a prototype-aware classification.

3.3.1. Static and Temporal Feature Encoding

Each one-minute segment C i is represented as a sequence of N frames that undergoes a two-stage encoding process.
Static Encoder. Frame-level visual representations are extracted using two distinct ViT architectures. The first model is CLIP [45] (https://huggingface.co/openai/clip-vit-base-patch32, accessed 26 January 2026), a ViT-B/32 variant trained on 400 million image-text pairs scraped from publicly available internet sources. The second model is a standard ViT-B/16 model (https://huggingface.co/google/vit-base-patch16-224, accessed 26 January 2026), pre-trained on ImageNet-21k and fine-tuned on ImageNet-1K [46]. Both models produce a D in -dimensional embedding f R D in , corresponding to the [CLS] token representation, where [CLS] is a special classification token prepended to the input sequence [47]. In our setup, D in = 768 for both encoders. We apply CLIP and ViT as static visual encoders, as they provide strong, transferable frame-level representations thanks to the large-scale pre-training, and have shown a robust performance on various medical recognition tasks [48,49].
To match the temporal encoder dimensionality, each frame-level embedding f i , n R D in is projected into the temporal hidden space by a projection block ( Proj ( · ) ), which consists of a linear layer, LayerNorm, and dropout. This yields h i , n ( 0 ) = Proj ( f i , n ) R D h .
Temporal Encoder. The sequence of projected frame-level embeddings { h i , 1 ( 0 ) , , h i , N ( 0 ) } for segment C i is passed to a temporal encoder to model dynamic patterns relevant to depression and PD. Two architectures are evaluated: a Transformer-based encoder [50] and a Mamba state-space model [51]. In both cases, the encoder consists of H stacked identical temporal layers, where H is a hyperparameter selected during the training process.
These temporal encoders are selected because they explicitly model contextual dependencies across frame sequences, in contrast to simpler classical temporal models [52]. Transformer layers apply multi-head self-attention, followed by a position-wise feed-forward network. In order to preserve temporal order, absolute sinusoidal positional encodings are added to the input sequence [50]. In contrast, the Mamba layers employ structured state-space operations, enabling linear-time complexity with respect to sequence length. This makes them especially efficient for modeling longer temporal sequences without sacrificing representational capacity [51]. In Section 4.2, we compare the performance of both static and temporal encoders.
The projected sequence { h i , 1 ( 0 ) , , h i , N ( 0 ) } is then processed by the temporal encoder (Transformer or Mamba), producing contextualized frame representations after H stacked blocks. Let h ˜ i , n R D h denote the output representation of the nth frame after the final temporal encoder block (the Hth block, where H is the number of stacked blocks), where D h is the hidden dimension of the temporal encoder (selected via hyperparameter tuning). The resulting sequence { h ˜ i , 1 , , h ˜ i , N } is then temporally pooled to obtain segment-level embeddings:
x i = 1 | N i | n N i h ˜ i , n ,
where N i { 1 , , N } denotes the indices of valid (non-padded) frames in segment C i .
This pooled representation x i R D h serves as an input to both the prototype-aware classifier and the contrastive alignment module described in Section 3.3.3.

3.3.2. Gated Residual Connections

The temporal encoder employs residual connections between successive layers. Let H i ( l ) = [ h i , 1 ( l ) , , h i , N ( l ) ] R N × D h denote the sequence of frame embeddings at the input of the lth temporal layer for segment C i , where h i , n ( l ) R D h is the feature vector of the nth frame. A temporal layer acts on the whole sequence and produces an updated sequence, TemporalLayer ( l ) ( H i ( l ) ) R N × D h . The standard residual update is:
h ˜ i , n ( l ) = h i , n ( l ) + TemporalLayer ( l ) ( H i ( l ) ) n , n = 1 , , N ,
where ( · ) n denotes the nth row (frame) of the output sequence.
In order to enable flexible control over the information flow, three gating strategies are investigated:
1.
Fixed Gating Coefficient (FGC). A single global scalar λ [ 0 , 1 ] is shared across all layers, frames, and feature dimensions. The update becomes:
h ˜ i , n ( l ) = λ h i , n ( l ) + ( 1 λ ) TemporalLayer ( l ) ( H i ( l ) ) n , i , n .
The scalar λ is selected as a hyperparameter.
2.
Time-Wise Gating (TWG). A learnable vector w TWG ( l ) R N is maintained per layer. After the softmax normalization, it yields frame-specific mixing weights:
λ n ( l ) = exp w TWG , n ( l ) n = 1 N exp w TWG , n ( l ) , n = 1 , , N .
This assigns a single weight per frame, applied uniformly across all feature dimensions.
3.
Feature-Wise Gating (FWG). A learnable vector w FWG ( l ) R D h is maintained per layer. After the softmax normalization:
λ d ( l ) = exp w FWG , d ( l ) d = 1 D h exp w FWG , d ( l ) , d = 1 , , D h .
This assigns a single weight per feature dimension, applied uniformly across all the frames.
In the gated cases (Items 2 and 3), the update rules are:
h ˜ i , n ( l ) = ( 1 λ n ( l ) ) h i , n ( l ) + λ n ( l ) TemporalLayer ( l ) ( H i ( l ) ) n , n = 1 , , N ,
h ˜ i , n , d ( l ) = ( 1 λ d ( l ) ) h i , n , d ( l ) + λ d ( l ) TemporalLayer ( l ) ( H i ( l ) ) n , d , d = 1 , , D h ,
where h i , n , d ( l ) denotes the dth component of h i , n ( l ) and TemporalLayer ( l ) ( H i ( l ) ) n , d is the ( n , d ) element of the layer output. All gating parameters ( λ d , λ n , w TWG ( l ) , and w FWG ( l ) ) are initialized randomly and optimized end-to-end. Parameters λ , λ d , and λ n regulate the extent to which the original feature matrix is altered by the temporally transformed representation. These mechanisms allow the model to learn whether to preserve or revise information at different granularities: globally (FGC), per frame (time-wise), or per feature (feature-wise).

3.3.3. Prototype-Aware Classification

The proposed model incorporates class-specific prototype vectors in the classification head. Each prototype serves as a representative of a class in the embedding space. This enables similarity-based classification in the spirit of prototypical metric learning [53]. The model maintains two parallel pathways: a standard feed-forward classifier and a prototype-based similarity module.
Let x i R D h denote the segment-level embedding obtained by the temporal pooling of the output sequence { h ˜ i , 1 , , h ˜ i , N } from the temporal encoder (see Section 3.3.1). This embedding serves as an input to both classification heads.
Prototype Logits. For K classes and N p prototypes per class, a total of P = K · N p prototype vectors { p j } j = 1 P R D h are defined as learnable parameters of the model. These prototypes are initialized from a normal distribution and optimized end-to-end during training.
For a given segment embedding x i , cosine similarities are computed with all prototypes. The similarities are grouped by a class, and the maximum similarity within each class is used as the prototype logits. Formally, let P k { 1 , , P } denote the set of indices corresponding to prototypes of class k. The prototype logit for class k is:
ψ i , k = 1 τ max j P k x i p j x i · p j ,
where τ > 0 is a temperature hyperparameter. This formulation emphasizes the most representative prototype per class, enhancing robustness to intra-class variability.
Classifier Logits. A standard Multi-Layer Perceptron (MLP) produces complementary logits:
ϕ i , k = MLP ( x i ) k , k = 1 , , K .
The MLP classifier head consists of two linear layers. The first layer maps the input segment embedding from D h to D cls , and the second layer maps the intermediate representation from D cls to K class logits. Between these two linear layers, LayerNorm, a smooth non-linear Gaussian Error Linear Unit (GELU) activation, and a dropout are applied. Here, D cls denotes the number of output features of the first linear layer in the classifier head (selected as a hyperparameter), and K is the number of classes.
Gated Average Fusion. A final prediction combines two logits using learnable, class-specific mixing weights. Let β R K be a vector of trainable parameters, initialized to log ( 1 ) so that σ ( β k ) = 0.5 initially, where σ ( · ) is the sigmoid function. The fused logit for class k is:
ζ i , k = σ ( β k ) · ϕ i , k + 1 σ ( β k ) · ψ i , k .
This design allows the model to adaptively balance between discriminative feature learning (classifier logits) and exemplar-based reasoning (prototype logits) separately for each class, based on the training data.
The output of the model is the fused logit vector ζ i = ( ζ i , 1 , , ζ i , K ) , which is used for both inference and loss computation (Section 3.4).

3.4. Loss Function

The training objective combines supervised classification with a contrastive alignment between segment embeddings and class-specific prototypes.
Classification-based Losses. The weighted cross-entropy loss is employed to mitigate a class imbalance:
L fusion = 1 B i = 1 B k = 1 K w k · y i , k · log p ^ i , k ,
where L fusion loss is calculated for class-wise logit fusion outputs, B is the number of segments in a batch, y i { 1 , , K } denotes the ground-truth class index of segment i, p ^ i , k = exp ( ζ i , k ) k = 1 K exp ( ζ i , k ) is the predicted probability derived from the fused logits ζ i (see Section 3.3.3), and w k is a class weight inversely proportional to the empirical frequency of class k in the training set. The losses L c l s and L p r o t o , for classification logits and prototype logits, respectively, are calculated in a similar way to the L fusion loss.
Contrastive Prototype Loss. To encourage alignment between segment embeddings and their corresponding class prototypes, a contrastive loss is applied directly to the pooled embeddings x i R D h :
L cont = 1 B i = 1 B log j P y i exp x i p j / τ j = 1 P exp x i p j / τ ,
where y i is the true class of segment i, P y i is the set of prototype indices for that class, P = K · N p is the total number of prototypes. This loss pulls x i closer to the prototypes of its ground-truth class while pushing it away from those of others.
Total Loss. The composite objective is formulated as:
L total = L fusion + L cls + L proto + α · L cont ,
where α [ 0 , 1 ] is a hyperparameter that serves as the contrastive weight, balancing the contribution of the contrastive prototype loss as a regularizer. The first three terms are the primary classification losses and are therefore combined with unit weights, whereas L cont is used as an auxiliary regularization term and scaled by α .

4. Experiments

4.1. Research Corpus

In our study, we use the WSM corpus, annotated for gender and age via crowd-sourcing, and self-annotated for two speech-affecting disorders: depression and PD. Unlike existing corpora, this corpus contains YouTube recordings made in conditions comfortable for the speakers, which may reduce a stress and other factors affecting a natural behavior. The corpus includes 777 recordings in total: 412 for the binary task of the depression detection, as well as 365 for the binary task of the PD detection. Recording duration varies by health condition: on average, videos last 14 min for depressed speakers (38 h total, 157 recordings), 13 min for those with PD (38 h total, 182 recordings), and 10 min for healthy speakers (117 h total, 438 recordings). Recordings are split into speaker-independent Train, Development, and Test subsets. To address a duration imbalance and reduce model bias, all the recordings are segmented into one-minute clips. For both sub-corpora, segments from healthy speakers predominate. We group the data into three classes: healthy, depression, and PD. Importantly, the annotation protocol [32] used provides only binary labels (disorder or healthy) within each sub-corpus and does not include any comorbidity (e.g., both depression and PD, or PD and Alzheimer’s disease) as an explicit category. Therefore, our study does not model or estimate multi-label combinations, and the outputs should be interpreted only with respect to the single-disease labels available in the corpus.
Table 2 summarizes demographic distribution of segments and individuals by disease group and subset after segmentation and pre-processing. It should be pointed out that individuals with longer recordings contribute more segments. Moreover, since our pipeline retains only speech- and face-containing clips, the effective class balance and gender distribution of our segment-level composition is different from the individual-level one. However, these differences are minor and mainly affect the Development and Test subsets, and thus they do not add substantial distortions to the Train subset. In general, the distribution between classes is not balanced, with the fewest segments represented for individuals with PD. To mitigate the class imbalance, we apply a class weighting that is inversely proportional to class frequencies.
WSM is the publicly available multimodal corpus collected and released by Correia et al. [32]. The corpus is disseminated by its authors for research purposes; therefore, our work constitutes a secondary analysis of existing resources. We adhere to the corpus’s terms of use and apply a privacy-preserving pre-processing to minimize ethical and confidentiality risks.

4.2. Experimental Results

To evaluate the performance of the trained models, we use classic measures that take into account a class imbalance, including per-class Recall and Precision, Unweighted Average Recall (UAR), and Macro F1-score (MF1), as well as Weighted F1-score (WF1) for comparison with SOTA. Since multiple performance measures are used, we additionally report an average rank of each model computed by the Friedman’s test [54]. Let M refer to the number of compared models and Q to the number of performance measures. For each measure q { 1 , , Q } , all models are ranked based on their performances, r m ( q ) = 1 is assigned to the best-performing model, and rank r m ( q ) = M is assigned to the worst-performing one. The final average rank of model m is then computed as:
r ¯ m = 1 Q q = 1 Q r m ( q ) .
Lower values of r ¯ m indicate a better overall performance across the considered performance measures. All performance measures are reported for the Test subset, while the Train subset is used for model training and the Development subset is used to optimize the models. This experimental setup follows the predefined protocol of the corpus and ensures a clear separation between model fitting, hyperparameter selection, and final evaluation on an unseen Test subset. We therefore do not use any cross-validation setup, as the fixed split into three subsets provides a standardized and reproducible benchmark protocol for a fair model comparison with SOTA while reducing the risk of a model overfitting to the Test data.
Table 3 presents experimental results comparing various combinations of static (CLIP vs. ViT) and temporal (Mamba vs. Transformer) visual encoders across different sequence lengths. CLIP-based models outperformed their ViT counterparts in terms of UAR and MF1 across nearly all sequence lengths and temporal encoders. This suggests that the rich, semantically grounded representations learned by CLIP are better suited for the target task than the more general features extracted by ViT. The best overall performance was achieved by CLIP + Transformer with a sequence length of 60 frames, achieving the highest UAR of 73.01% and the best average rank of 4.4. The performance of the Transformer model is due to its ability to effectively capture long-range dependencies and to the efficient attention mechanism.
Per-class Recall shows that the models are generally more sensitive to depression and, in some configurations, the PD class than to the healthy class. In contrast, the per-class Precision is highest for the healthy class and lowest for the PD one. This suggests that predictions for the healthy class are relatively reliable (with fewer false positive errors), while PD detection often achieves higher sensitivity at the expense of more false positive errors. Overall, this pattern shows that the balance between Recall and Precision values differs across the classes, with PD being the most difficult one. This pattern also holds for all subsequent experiments.
Table 4 summarizes experimental results of the hyperparameter grid search for the Transformer and Mamba models. Both models converged to similar settings for most hyperparameters: a hidden dimension of 128, an output feature size of 512, a dropout rate of 0.25, and a learning rate of 10 5 without a scheduler. The key difference between the models is their depth: 5 layers for Transformer versus 7 layers for Mamba. This suggests that Mamba may require more layers due to its local recurrence, while the Transformer uses fewer layers. The Transformer model also uses only two attention heads, whereas Mamba achieves its best performance with the state dimension of 16 and the convolution kernel size of 7.
Table 5 presents the results for the best model configuration (CLIP + Transformer + a sequence length of 60 frames) across different gating strategies (FGC, TWG, FWG) as well as for the use of prototypes. The prototype-based model outperforms all other gating-based models, achieving the highest UAR (74.62%) and MF1 (65.40%), as well as the best average rank (2.0). This superior performance can be attributed to the dual-path architecture of the model, which combines discriminative feature learning with exemplar-based reasoning through class-specific prototypes. By focusing on the most representative similarities within each class and combining them with standard classifier outputs, the model becomes more robust to intra-class variations.
In contrast, FGC, which applies a uniform scalar blend between residual and transformed features, yields only modest gains over the CLIP + Transformer (60) model. This suggests that global modulation offers limited adaptability. Both TWG (time-wise gating) and FWG (feature-wise gating) underperform, despite their capacity for the input-dependent weighting. Their lower UAR indicates that learned per-frame or per-feature gating may introduce a noise or lead to an overfitting, when temporal dynamics or feature importance are not sufficiently disentangled. Additionally, these mechanisms lack explicit semantic guidance, potentially leading to a suboptimal information routing in complex multimodal sequences, unlike prototypes.
Table 5 shows the results for the optimal configuration of the CLIP + Transformer (60) model, which combines the final loss ( L fusion ) with the contrastive prototype loss ( L cont ), using 9 prototypes and an alpha value of 0.05. Details of the ablation study for different loss combinations are provided in Table 6.
Table 6 demonstrates that using only the prototype-based loss ( L proto ) results in the lowest performance (UAR = 67.93%, MF1 = 62.73%). Adding the contrastive loss ( L cont ) alone improves results slightly; nonetheless, it still underperforms compared to other configurations. It is noteworthy that combining L proto and L cont decreases performance compared to using either loss individually, suggesting that the optimization objectives conflict or that supervision signals are redundant. In contrast, the best overall performance (UAR = 74.62%, MF1 = 65.40%) is achieved by the fused-logit loss ( L fusion ) in combination with the contrastive loss ( L cont ), without explicit L cls or L proto terms. This indicates that L fusion already subsumes roles of classification and prototype-based supervision through its adaptive gating mechanism. Moreover, adding L cont to most configurations provides a moderate improvement. However, including all four loss functions simultaneously leads to suboptimal results, suggesting diminishing returns, when combining multiple supervisory signals.
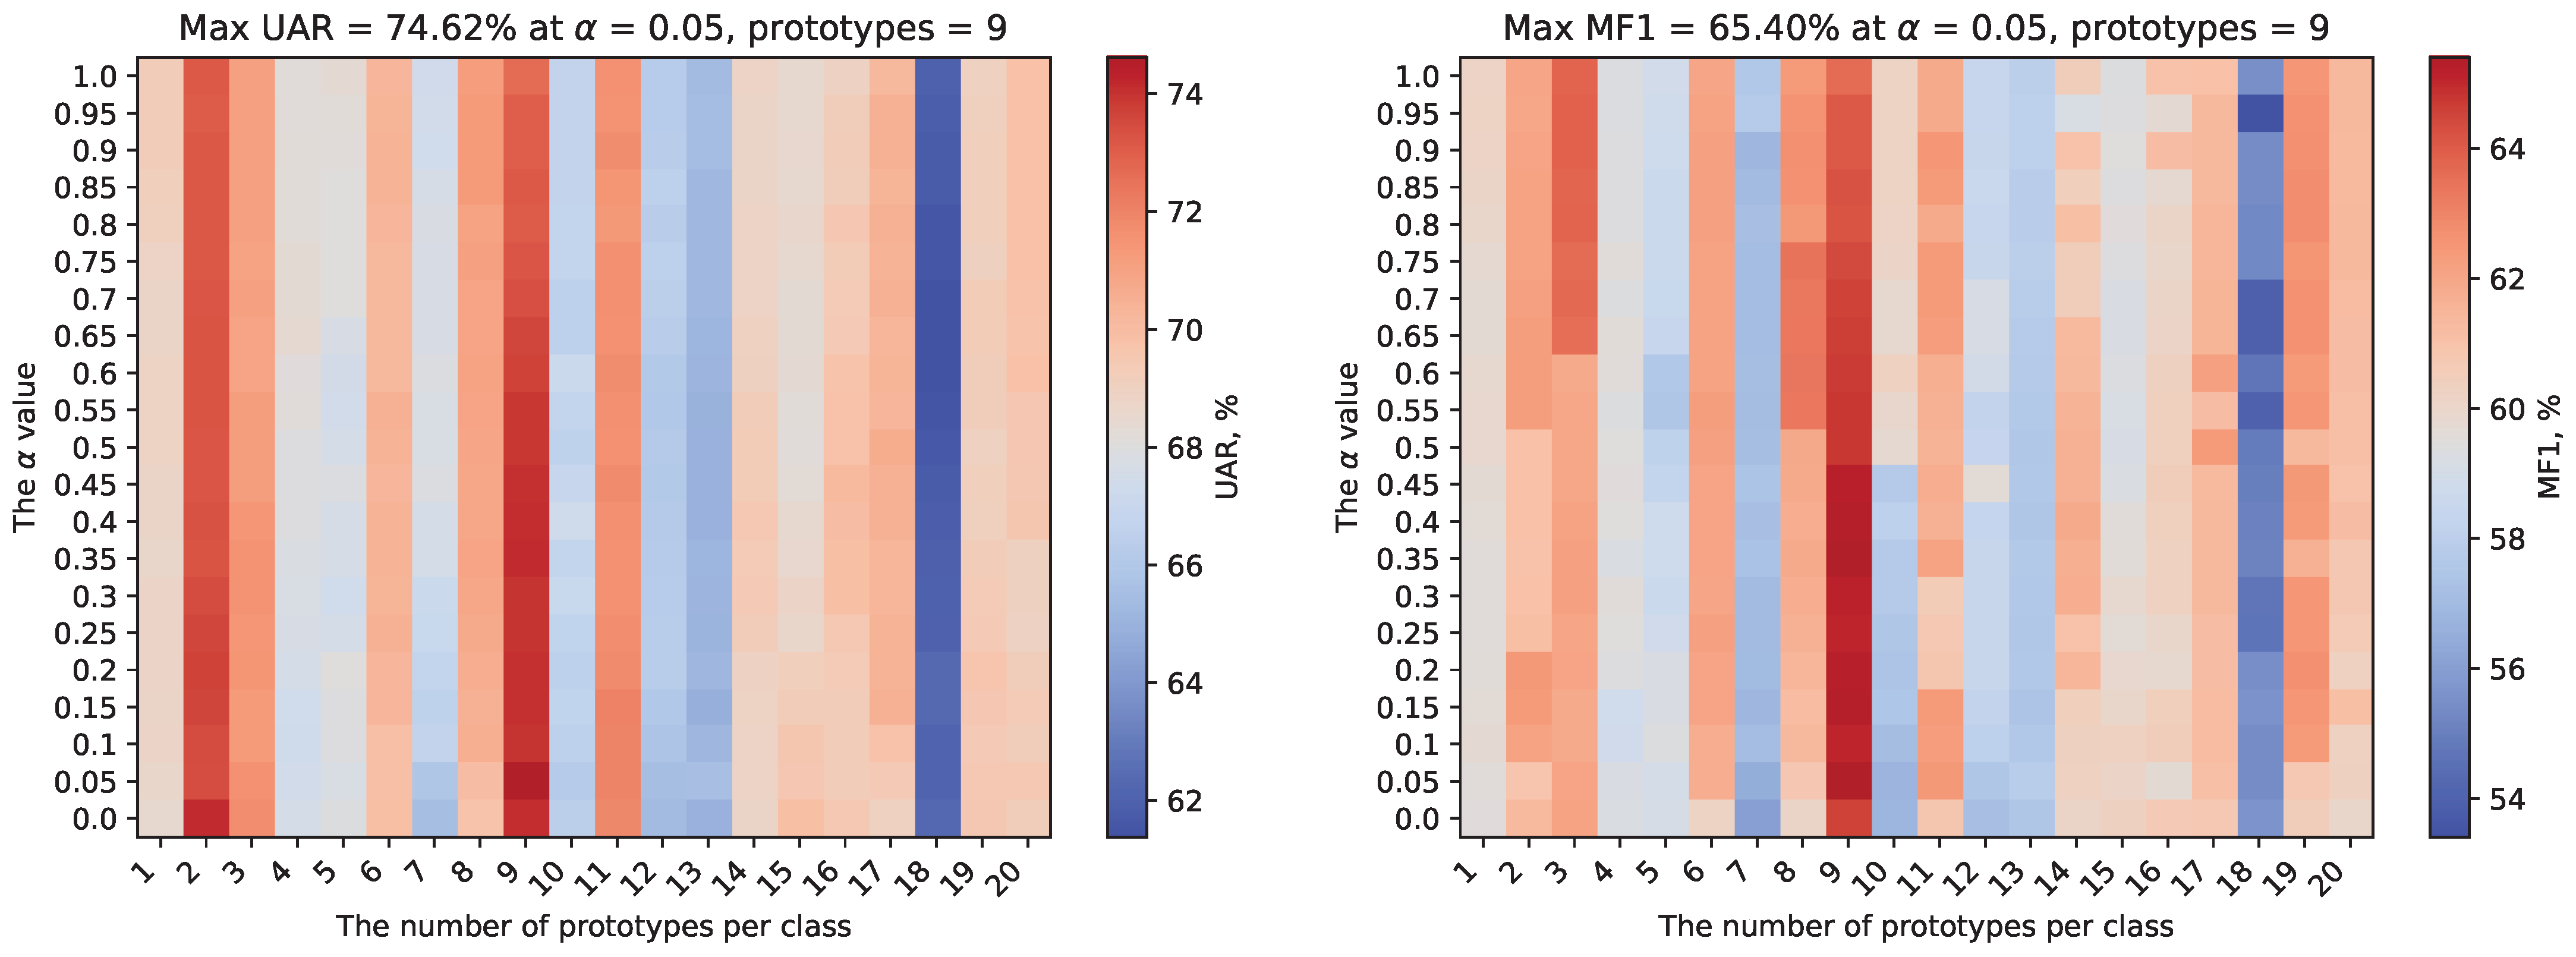
Figure 2 shows the results of the ablation study on the UAR and MF1 measures, exploring different α values and the number of prototypes. The best performance was achieved with the α value of 0.05 and 9 prototypes per class. Both measures decrease with increasing α value or an excessive number of prototypes, indicating an optimal balance between regularization strength and model complexity.
In Table 7, the performance of our proposed method with different model configurations is compared to SOTA methods for the depression and PD detection tasks. The backbone model was trained in a three-class setting (healthy, depression, PD), so binary evaluation was performed by converting predictions when the model outputs the absent class. In these cases, the prediction was reassigned to the class with the higher probability between the two target classes. This allows for a fair comparison with the binary single-task models while preserving the intrinsic confidence structure of the model.
For single-task learning, we examined three configurations: (i) a CLIP + Transformer (60) + Prototype model with hyperparameters fixed as in Table 4; (ii) a CLIP + Transformer (60) model without prototypes, using the same hyperparameters; (iii) a CLIP + Transformer (60) model with the task-specific hyperparameter tuning. This separation allows isolating the effect of the prototypes from that of the architectural capacity.
The results show that joint three-class learning achieves disease Recall comparable to that of the high-performing single-task models. For the depression class, the prototype-aware multi-task model achieves a Recall of 82.39%, compared to 87.76% for the high-performing single-task model. For PD, both the multi-task and single-task models achieve the Recall of 78.20%. This indicates that joint learning does not introduce significant task interference at the level of disease detection, and shared representations can benefit the detection of both disorders. The main limitation of the multi-task model lies in the separation of healthy subjects from patients, particularly in the PD task, where the Recall for healthy individuals drops to 55.45%. Such low performance is primarily due to data quality issues in the healthy subset of the PD sub-corpus. Although automatic pre-processing was applied, such as removing segments without visible faces or speech (see Section 3.1), this was insufficient to ensure consistently high-quality video inputs. We consider error analysis in Section 5.
Single-task results also support additional conclusions. Although prototype learning improves the performance in the multi-task setting, it reduces performance results in the single-task setting. Without a cross-task regularization, the use of prototypes is likely to over-constrain the embedding space, limiting the flexibility of the decision boundary. Nevertheless, removing the prototypes and adjusting the network depth leads to better single-task performance. The optimal depth differs across tasks, with 3 layers for depression and 4 layers for PD. This reflects the task-dependent complexity of the representations rather than the amount of training data (the depression subset contains 1431 samples versus 1058 for PD). Visual signs of the depression, such as persistent sadness or reduced facial expressivity, are more pronounced and consistently observable across video frames, making it easier for a shallow architecture to capture distinguishing patterns. In contrast, PD manifests through subtler motor symptoms (e.g., micro-tremors, bradykinesia) that are transient and harder to detect in individual frames, thus requiring a deeper architecture to model their temporal dynamics and extract weak diagnostic patterns.
Compared to the audio-based SOTA [32], all proposed models outperform this SOTA model in the depression detection. However, the opposite trend is observed for the PD detection. This indicates a modality-specific symptom expression: the depression state manifests more distinctly in visual channels (reduced facial expressivity, diminished eye contact, and slowed motor behavior) while PD produces stronger acoustic markers, including hypophonia, imprecise articulation, and vocal tremor. Visual motor symptoms of PD (subtle hand tremor) are less reliably captured in video recordings than speech-related dysfunctions, explaining the advantage of the audio modality for this task. Compared to the video-based method [23], the proposed method achieves more balanced Recall and higher overall effectiveness, demonstrating that deep neural architectures remain superior to quantitative objective models even under limited data conditions. A comparison with contemporary visual and multimodal SOTA models [17,22,24] trained on other representative single-task datasets sourced from YouTube (e.g., D-Vlog and YouTubePD) indicates that our proposed model achieves results comparable to these methods and, in many cases, surpasses them.

5. Error Analysis

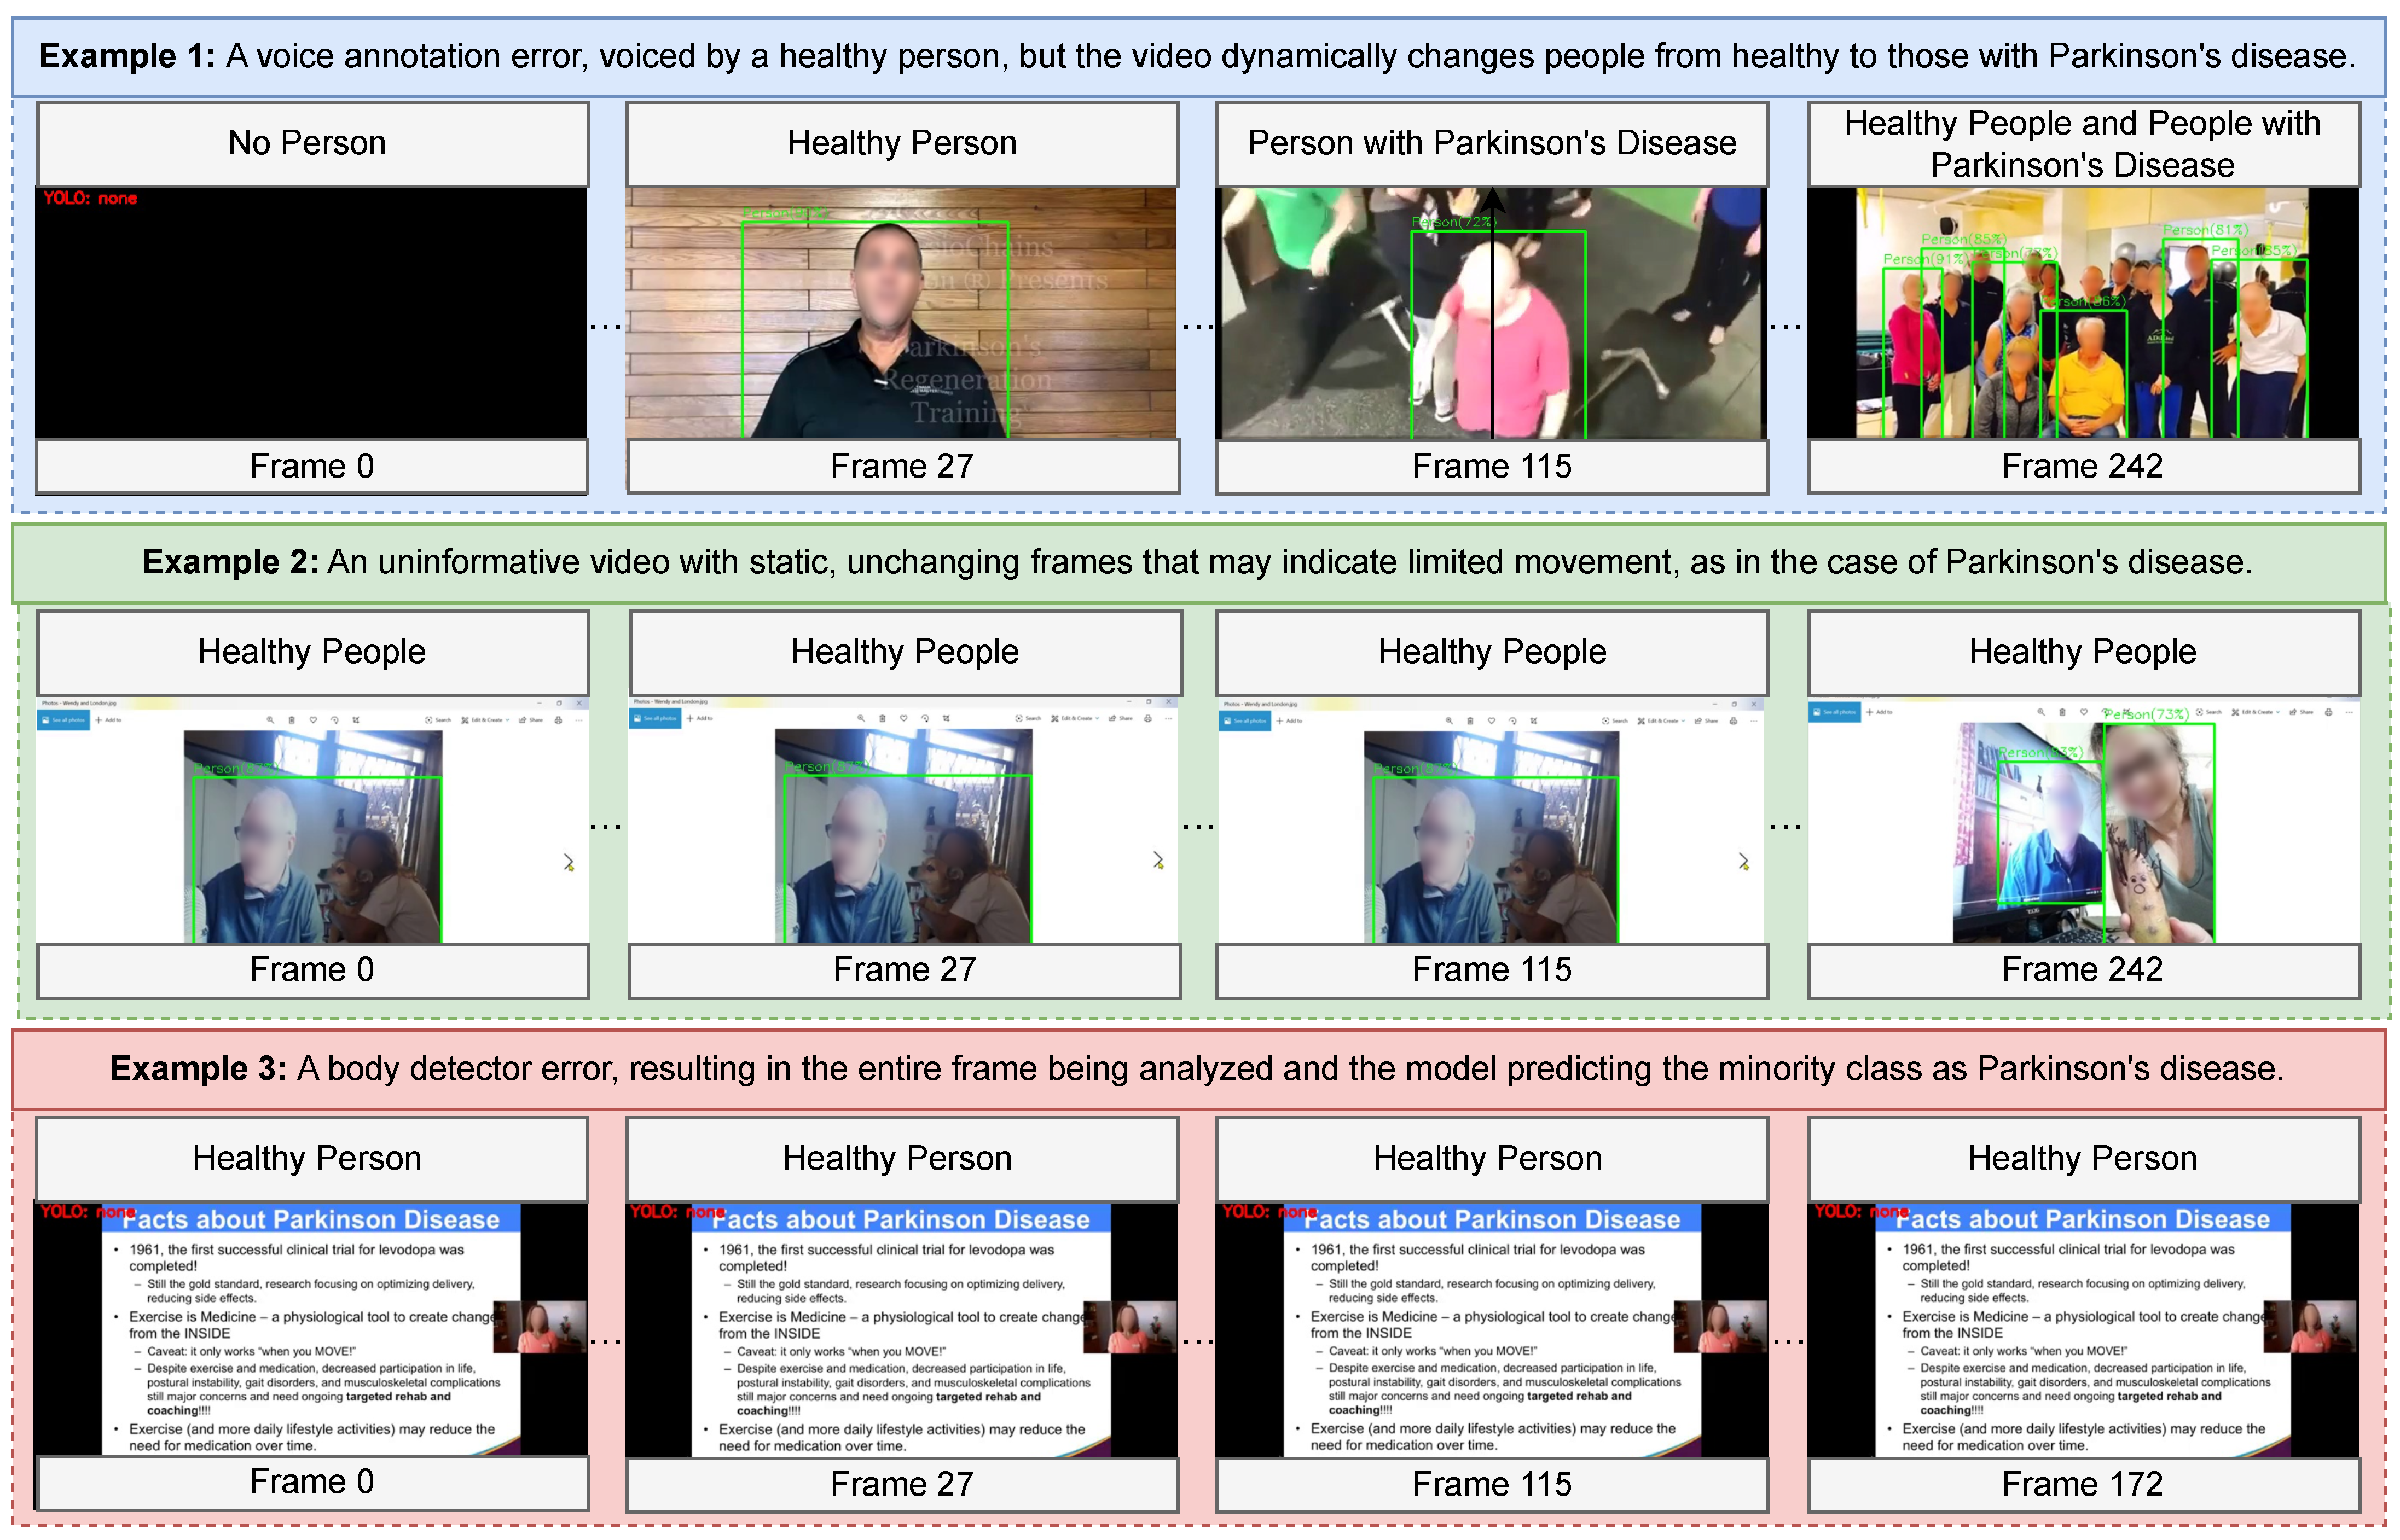
To better understand the causes of incorrect classification of healthy individuals in the PD sub-corpus, we conducted an expert error analysis of misclassified healthy samples and identified three recurring failure modes (see Figure 3):
1.
Annotation-modality mismatch: In some segments, the audio is spoken by a healthy person, but the video shows alternating appearances of both healthy individuals and those with PD. Since the annotations in both sub-corpora are derived solely from the audio modality, they label these segments as “healthy”. However, the presence of PD patients in the visual modality makes a conflict. The model correctly detects visual cues related to PD and predicts the PD class, highlighting a genuine annotation inconsistency rather than a model failure.
2.
Misleading static visual content: Some videos of healthy individuals contain prolonged static frames without any movement. Given that motor impairment is a hallmark of PD, the model interprets this lack of movement as a pathological signal. This leads to false positive predictions despite the healthy person.
3.
Body detection failures: In some cases, the YOLO-based body detector fails to locate any person in a frame. As a result, the entire frame, including background noise and irrelevant text overlays, is used as an input to the proposed model. Due to our model’s tendency to favor minority classes in order to counteract class imbalance, it is prone to predicting PD (the least frequent class) when presented with ambiguous or noisy input.
These issues are mainly confined to the healthy subset of the PD sub-corpus, which shows a significant contamination (“noisiness”) compared to the depression sub-corpus. In single-task settings (see Table 7), this problem is mitigated because the healthy samples from the two sub-corpora are kept separate during the training, preventing cross-contamination of representations. In contrast, joint learning forces the model to reconcile these inconsistent healthy samples within a shared representation, thereby degrading the healthy-class performance in the PD task.
Additionally, we calculated the performance measures for multi-task and single-task models on the cleaned Test data, after eliminating the errors mentioned above. The results of the evaluation are presented in Table 8.
The multi-task model demonstrates some improvements in both tasks: the Recall of individuals with depression increases from 82.39% to 87.50%, while the Recall of individuals with PD increases from 78.20% to 86.14%. A similar situation is observed for single-task models: the Recall of individuals with PD increases from 78.20% to 82.18%, whereas the Recall of individuals with depression increases from 87.76% to 94.49%. However, the Recall of healthy individuals in the PD sub-corpus increases in the multi-task model from 55.45% to 75.29%, while in the single-task model it decreases from 78.96% to 73.75%. On the other hand, the Recall of healthy individuals in the depression sub-corpus decreases in both multi-task (82.11% vs. 79.84%) and single-task (83.33% vs. 81.68%) models.
Precision shows a more nuanced pattern. In the depression sub-corpus, cleaning the Test data leads to a noticeable increase in the Precision for healthy individuals in both models (87.26% vs. 89.97% for the multi-task and 90.91% vs. 95.41% for the single-task setup), while the Precision for depression remaining nearly stable in both cases (75.82% vs. 75.56% for the multi-task and 78.19% vs. 78.59% for the single-task). In the PD sub-corpus, the Precision improvements are higher for the pathological class: the Precision for PD increases substantially in the multi-task model (from 36.62% to 57.62%) and remains nearly unchanged in the single-task model (55.03% vs. 54.97%). At the same time, the Precision for healthy individuals increases in the multi-task setting (from 88.54% to 93.30%) and changes marginally in the single-task model (from 91.67% to 91.39%).
These results suggest that the multi-task learning can effectively enhance the PD detection by leveraging pathological features shared between PD and depression. However, for the depression, the use of task coupling may lead to interference, resulting in superior performance for single-task models. Therefore, single-task models are susceptible to noisy in-the-wild data and to overfitting to spurious patterns, thereby hindering their generalization to clean data. The multi-task model is also influenced by noisy in-the-wild data, but it unlocks its full potential when the data are clean. This suggests that the multi-task learning does not inherently suppress noise, but rather more effectively leverages task correlations when data quality is assured, making it advantageous in real-life clinical applications. We make the cleaned test data publicly available at https://gofile.me/6UX1J/fq1NM6ShJ (accessed 26 January 2026).

6. Visualization of Task-Specific Regions of Interest

In order to interpret the spatial evidence guiding model predictions, we employ a gradient-based attention visualization mechanism [55] adapted to the CLIP used as the static encoder. Each frame F i , n is represented by a sequence of patch-level token embeddings produced by the final Transformer layer:
A i , n = { a i , n ( 0 ) , a i , n ( 1 ) , , a i , n ( P patch ) } ,
where a i , n ( 0 ) R D in corresponds to the [CLS] token and the remaining P patch tokens correspond to image patches, D in is the token embedding dimensionality of the static encoder. The sequence of [CLS] embeddings is projected and then passed to the temporal encoder, yielding segment-level representations and final fused class logits ζ i , k , as defined in Section 3.3.3.
For a given segment C i , let k ^ = arg max k ζ i , k be the predicted class. To identify task-specific spatial regions contributing to the decision, we compute the gradients of the predicted score with respect to the patch embeddings:
G i , n ( p ) = ζ i , k ^ a i , n ( p patch ) , p patch = 1 , , P patch ,
where G i , n ( p patch ) R D in is the gradient vector of the class score with respect to the patch embedding.
Following the Grad-CAM formulation [55], a raw attention map for each frame is obtained as:
M i , n ( p ) = ReLU a i , n ( p patch ) , G i , n ( p patch ) ,
where · , · denotes the inner product over the feature dimension and ReLU ( · ) denotes the Rectified Linear Unit activation, applied here to retain only positive relevance scores. The resulting vector M i , n R P patch is reshaped into the spatial patch grid and bilinearly upsampled to the original frame resolution to produce a continuous heatmap H i , n . Finally, H i , n is normalized and overlaid on the corresponding frame F i , n for the visualization.
This procedure yields frame-wise spatial-temporal explanations indicating which body regions contribute most to the final prediction, without modifying model parameters or inference flow.
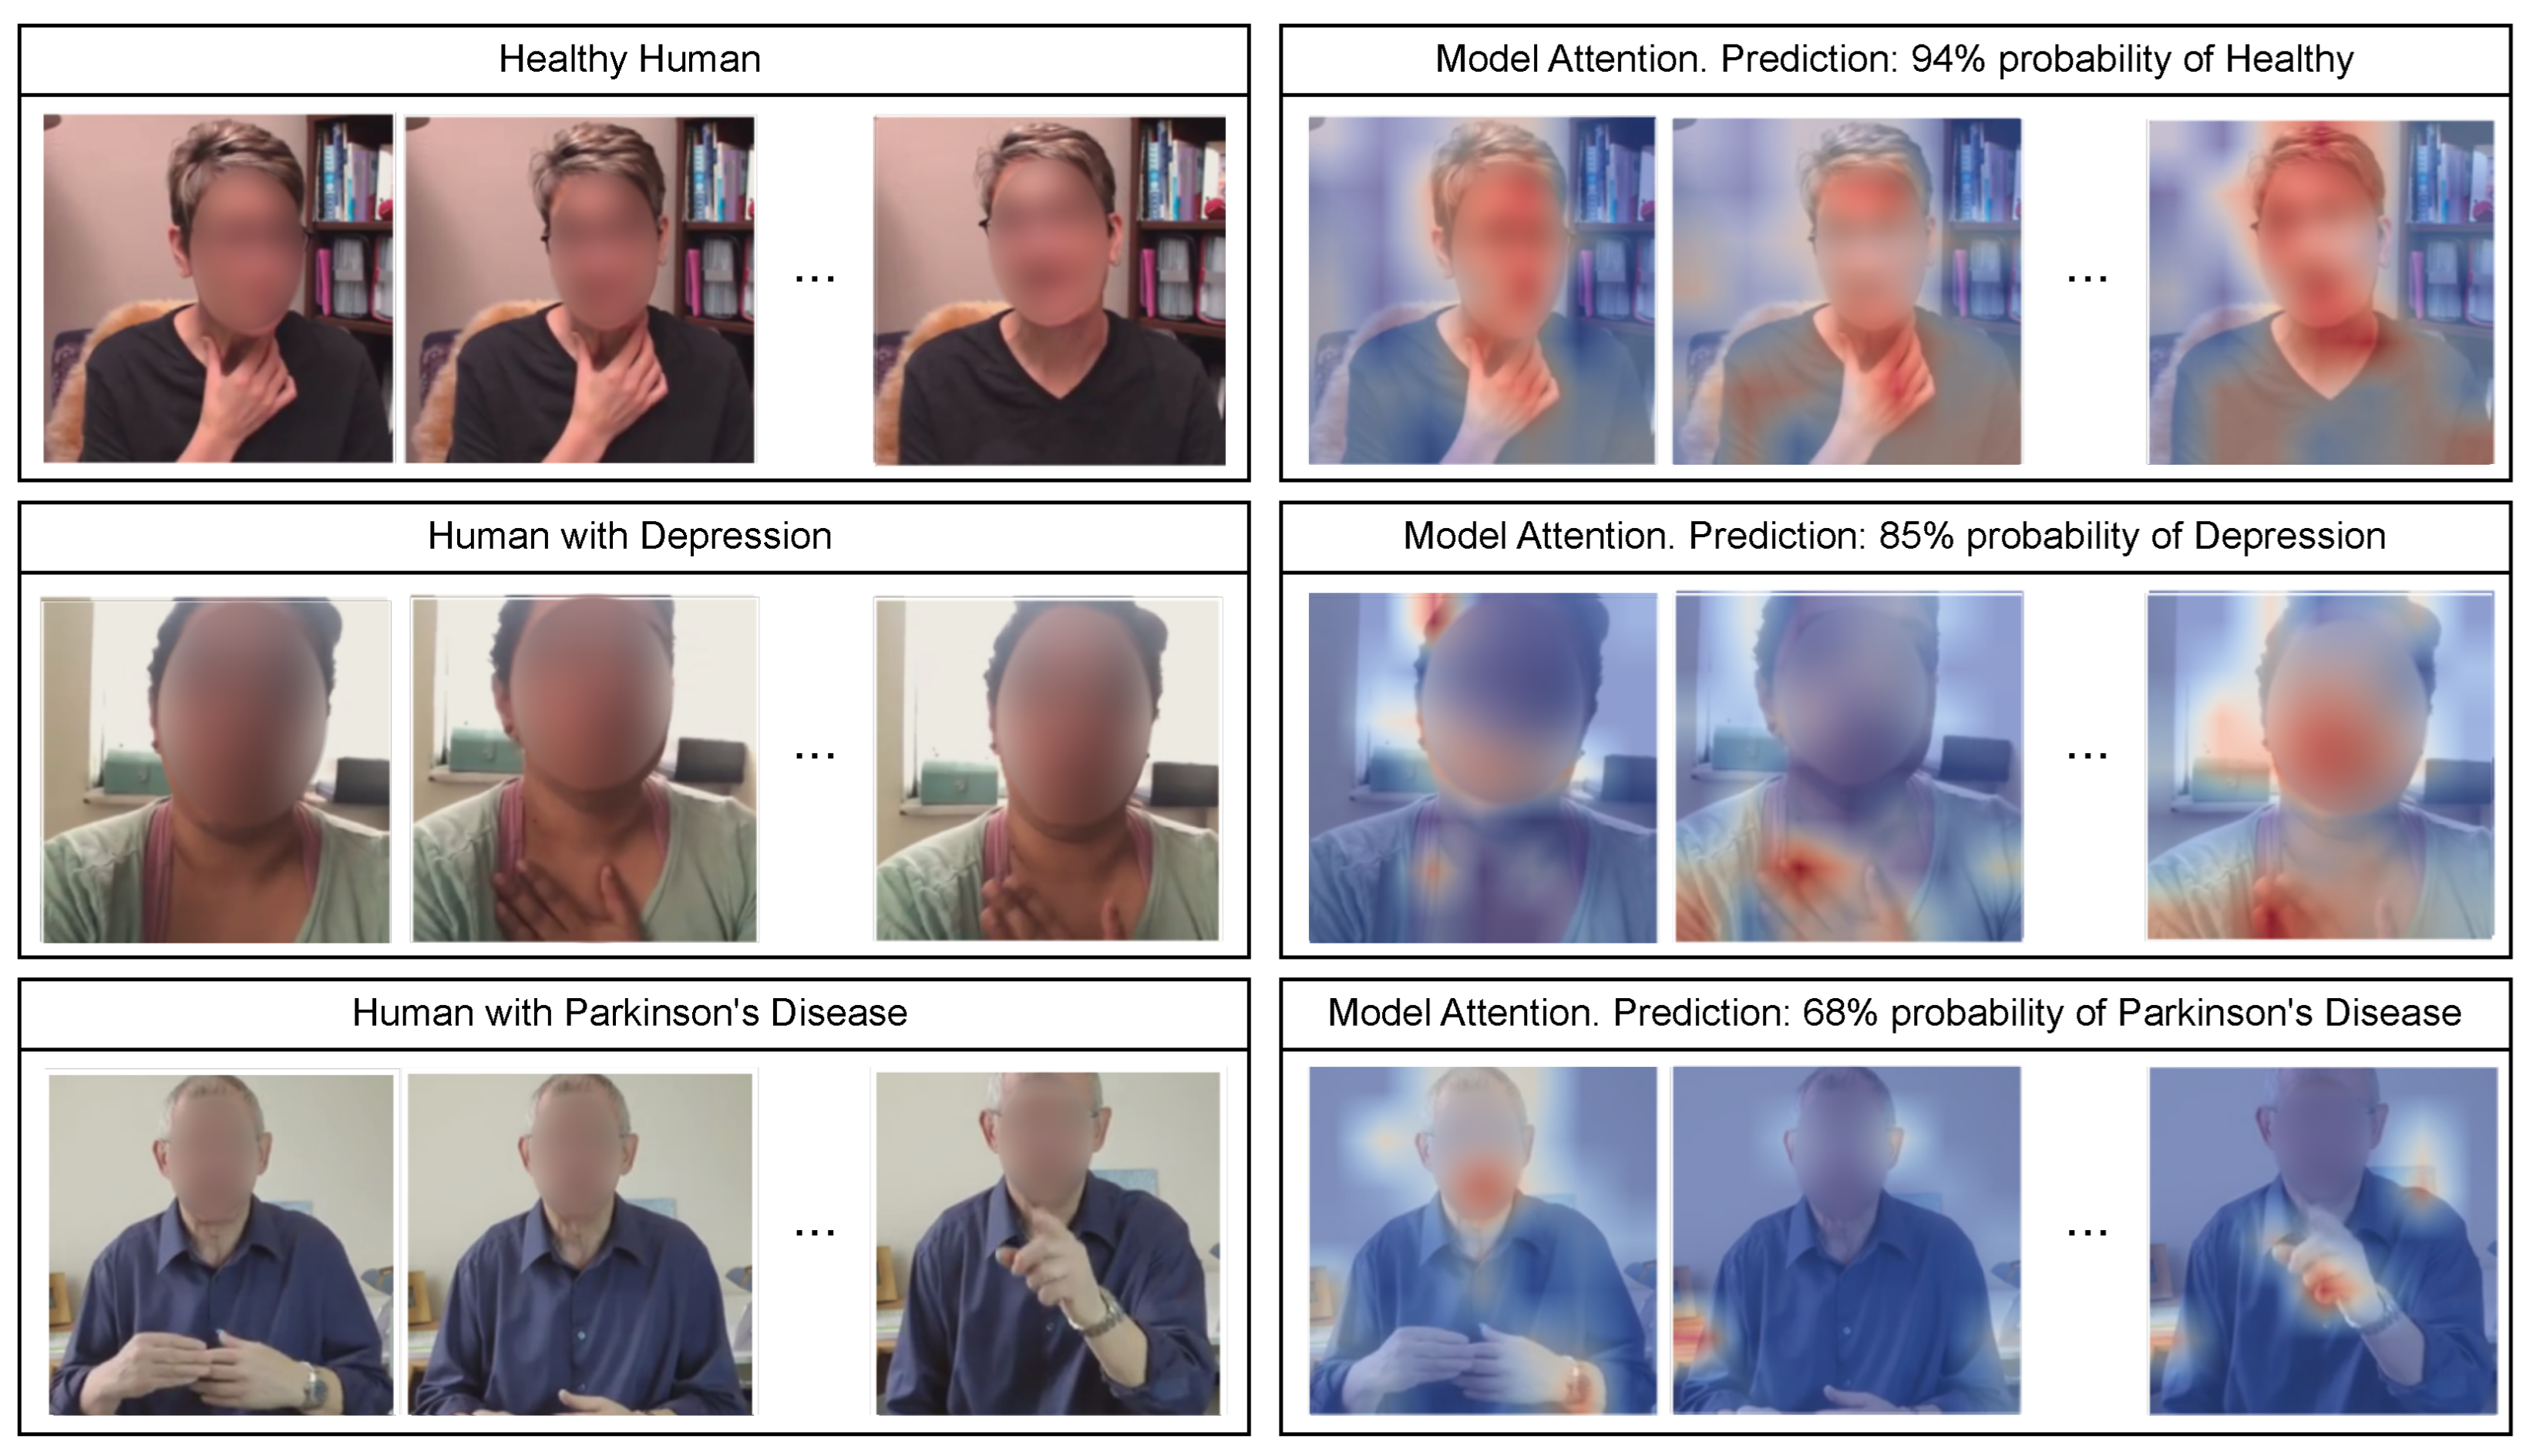
Visualization results (Figure 4) show consistent and semantically meaningful attention patterns that are specific to the task. For healthy individuals, the attention maps mainly highlight stable facial regions and the upper torso, with a minimal emphasis on the extremities, reflecting the absence of abnormal motion patterns. For the depression state, the model focuses on the face, particularly around the mouth and eyes, and on upper body posture, consistent with reduced expressiveness and typical affective cues associated with this condition.
For PD, the attention concentrates on the hands and forearms, capturing micro-movements related to a tremor and irregular hand gestures, which align with known motor symptoms of this disorder.
Notably, in misclassified samples, attention maps often show diffuse or ambiguous activation patterns. This indicates that the model has difficulty localizing discriminative regions, when there is an overlap between visual cues from healthy and pathological cases. These findings support the observation that most errors arise from a confusion between healthy individuals and patients with subtle or early-stage symptoms.
Overall, attention visualizations show that the model learns clinically relevant spatial cues for each cognitive disorder. However, they also highlight that residual detection errors are due to overlapping visual manifestations rather than an arbitrary or spurious attention.

7. Discussion

We introduced the efficient multi-task method DEPART for both depression and PD detection that is able to simultaneously recognize multiple cognitive disorders from unconstrained video recordings. Overall, our experimental results indicate that: (i) multi-task three-class learning does not inherently reduce disease Recall and can be competitive with task-specific training; (ii) the primary limitation of the multi-task setting is the healthy-versus-disease separation, particularly for PD; (iii) prototype learning is advantageous in the multi-task regime, but may be detrimental in the single-task training due to over-regularization; and (iv) task-specific architectural tuning (notably depth) is essential, with the optimal number of layers differing between Depression and PD. These findings also suggest that, despite the limited corpus size, deep neural methods remain more effective than quantitative objective models reported in prior works, as the former can exploit complex latent patterns that are difficult to capture with hand-crafted or purely statistical descriptors.
Prototype-based learning improves robustness in the multi-task setting by constraining class manifolds and reducing intra-class variability. In contrast, during the single-task training, the same constraint limits the flexibility of the decision boundary, leading to a suboptimal performance. This suggests that prototype regularization is the most effective when multiple related tasks share a common latent space.
From a representational perspective, joint training encourages the temporal encoder to learn shared motion and facial expression features that are beneficial for both disorders. However, healthy samples from the PD sub-corpus often exhibit visual artifacts, such as annotation-modality mismatches, static frames misinterpreted as motor impairments, and body detection failures, which push their representations towards pathological regions of the embedding space. This explains the reduced Recall for healthy individuals in the multi-task configuration. After the Test data cleaning, the Recall for healthy individuals becomes comparable across models, while the multi-task model improves disease detection for both disorders (Depression Recall: 82.39% vs. 87.50%, PD Recall: 78.20% vs. 86.14%). In contrast, the best single-task models improve on depression (87.76% vs. 94.49%) but show a smaller gain on PD (82.18% on the cleaned split). Overall, these results suggest that the multi-task model is less prone to overfitting spurious visual artifacts and better exploits shared pathological cues when data quality is controlled, making it more reliable for clinical screening under realistic conditions.
In terms of the computational complexity, the dominant cost of the proposed pipeline arises from the static CLIP visual encoder and the temporal Transformer. The overall inference complexity per segment scales as O ( N 2 · D ) for the temporal self-attention layers, where N is the number of frames per segment and D is the hidden dimension. In practice, with N = 60 and D = 128 , the proposed model achieves an average inference time of 2.74 s per one-minute segment on a single NVIDIA RTX 3090 Ti GPU with an Intel Core i7 CPU and 64 GB RAM. The temporal detection module contains 0.669 M trainable parameters, corresponding to a model size of 2.58 MB. The static CLIP visual encoder and YOLO-based body detector contain 87.456 M and 3.011 M parameters, respectively, and require 605 MB and 5.97 MB of memory. Overall, the full pipeline contains 91.136 M parameters. In terms of the computational cost, YOLO, CLIP and the temporal detection module require 485.03, 523.76, and 0.08 GFLOPs/sample, respectively. This totals to 1,008.87 GFLOPs for each sample. The additional prototype similarity branch introduces a negligible computational overhead, as it involves only cosine similarity operations with a small fixed set of prototypes.
Despite these promising results, several limitations remain: (i) the model relies on the quality of body detection; inaccurate bounding boxes in low-resolution or occluded frames can degrade feature extraction; (ii) WSM, while diverse, remains relatively small for deep video models, which may limit a generalizability to broader populations; (iii) only the visual modality is considered, whereas audio and linguistic cues could further disambiguate subtle cases.
Nevertheless, compared to quantitative objective models, the proposed deep architecture of the DEPART technique demonstrates a superior capacity to exploit latent spatio-temporal patterns while retaining interpretability by the attention visualization. This balance between accuracy, transparency, and computational feasibility makes the method suitable for a large-scale video-based screening.

8. Conclusions

We presented the unified video-based method for the multi-task depression and PD detection by in-the-wild recordings called DEPART (DEpression and PArkinson’s Recognition Technique). It combines the body region extraction, CLIP-based visual encoding, Transformer-based temporal modeling, and prototype-aware classification with gated fusion to enable an accurate and interpretable disease detection within a single model. Experimental evaluation on WSM demonstrates that the joint three-class learning achieves the competitive performance in the disease detection, with UAR of 82.25% for the depression and 66.82% for PD. However, task-specific optimization yields the higher peak performance in the single-task setting. The best single-task models achieve UAR of 85.55% for the depression and 78.58% for PD.
The study further revealed that prototype learning effectively regularizes shared representations in the multi-task regime, but may over-constrain single-task models. Moreover, most detection errors arise from data quality issues in the healthy subset of the PD sub-corpus, including annotation-modality mismatches, misinterpretation of static visual content as motor impairments, and failures in the body detection, rather than from an arbitrary model behavior. After the Test data cleaning, the multi-task model achieves UAR of 83.67% for the depression and 80.71% for PD. However, the best single-task models achieve UAR of 88.08% for the depression and 77.96% for PD. This highlights that multi-task learning is an effective solution for improving the detection performance of PD, while improvements are also observed for the depression detection. The source code is available online (https://github.com/SMIL-SPCRAS/DEPART, accessed 2 February 2026).
Future work will focus on four main research directions. Firstly, we will integrate audio and linguistic data to better differentiate between healthy and early-stage disease patterns. Secondly, we will extend DEPART to larger and more diverse clinical corpora to improve a generalization ability. Thirdly, we will explore more efficient temporal encoding techniques to further reduce inference times and enable real-time deployment. Fourthly, since the current study does not evaluate comorbid conditions due to the lack of explicit annotations, in future work we plan to investigate multi-disease settings by leveraging corpora with annotated comorbidity cases.

Author Contributions

Conceptualization, E.R. and A.K.; methodology, E.R. and A.A.; software, A.A.; validation, E.R. and A.A.; formal analysis, M.D. and D.R.; investigation, E.R. and A.A.; resources, M.D. and D.R.; data curation, M.D. and A.A.; writing—original draft preparation, E.R. and M.D.; writing—review and editing, E.R., M.D. and D.R.; visualization, E.R. and A.A.; supervision, A.K.; project administration, E.R.; funding acquisition, A.K. All authors have read and agreed to the published version of the manuscript.

Funding

This research was funded by the Russian Science Foundation grant number 25-11-00319 (https://rscf.ru/project/25-11-00319/, accessed 2 February 2026).

Institutional Review Board Statement

This study was conducted according to the guidelines of the Declaration of Helsinki considered and approved by the Reviewers’ Board (Scientific Council) of St. Petersburg Federal Research Center of the Russian Academy of Sciences (as codified in Protocol No. 7, 26 June 2025).

Informed Consent Statement

Not applicable.

Data Availability Statement

We used the publicly available corpus In-the-Wild Speech Medical—WSM (https://www.dropbox.com/scl/fo/jp3kc9pgjyuazmcfhjyup/ABSxzJIpfeybFHEL3p8sjWM?rlkey=4gedeh8kcpkiuoa90rexodcfy&e=1&dl=0, accessed 26 January 2026). We also provide the segmented and cleaned WSM data (https://gofile.me/6UX1J/fq1NM6ShJ, accessed 26 January 2026) for general access.

Conflicts of Interest

The authors declare no conflicts of interest.

Abbreviations

The following abbreviations are used in this manuscript:
CLIPContrastive Language-Image Pre-training
CNNConvolutional Neural Network
DAICDistress Analysis Interview Corpus
DEPARTDEpression and PArkinson’s Recognition Technique
DTDecision Tree
E-DAICExtended DAIC
FAUFacial Action Units
FEFacial Expressions
FGCFixed Gating Coefficient
FLFacial Landmarks
FPSFrames Per Second
FWGFeature-Wise Gating
GELUGaussian Error Linear Unit
GTGaze Tracking
HMMHidden Markov Model
LSTMLong Short-Term Memory
MF1Macro F1-score
MLPMulti-Layer Perceptron
PDParkinson’s disease
PLPose Landmarks
ReLURectified Linear Unit
SOTAState-of-the-Art
SVMSupport Vector Machine
SWINShifted WINdow
TWGTime-Wise Gating
UARUnweighted Average Recall
ViTVision Transformer
WF1Weighted F1-score
WSMIn-the-Wild Speech Medical

References

  1. Wallensten, J.; Ljunggren, G.; Nager, A.; Wachtler, C.; Bogdanovic, N.; Petrovic, P.; Carlsson, A.C. Stress, depression, and risk of dementia—A cohort study in the total population between 18 and 65 years old in Region Stockholm. Alzheimer’s Res. Ther. 2023, 15, 161. [Google Scholar] [CrossRef]
  2. Lokshina, A.; Grishina, D. Treatment of noncognitive neuropsychiatric disorders in Alzheimer’s disease. Neurol. Neuropsychiatry Psychosom. 2021, 13, 132–138. [Google Scholar] [CrossRef]
  3. Byers, A.L.; Yaffe, K. Depression and risk of developing dementia. Nat. Rev. Neurol. 2011, 7, 323–331. [Google Scholar] [CrossRef]
  4. Sharma, D.; Singh, J.; Sehra, S.S.; Sehra, S.K. Demystifying Mental Health by Decoding Facial Action Unit Sequences. Big Data Cogn. Comput. 2024, 8, 78. [Google Scholar] [CrossRef]
  5. Markitantov, M.; Ryumina, E.; Kaya, H.; Karpov, A. Multi-Modal Multi-Task Affective States Recognition Based on Label Encoder Fusion. In Proceedings of the Interspeech; ISCA Archive: Rotterdam, The Netherlands, 2025; pp. 3010–3014. [Google Scholar]
  6. Parikh, A.; Sadeghi, M.; Eskofier, B. Exploring facial biomarkers for depression through temporal analysis of action units. arXiv 2024, arXiv:2407.13753. [Google Scholar] [CrossRef]
  7. Shangguan, Z.; Liu, Z.; Li, G.; Chen, Q.; Ding, Z.; Hu, B. Dual-stream multiple instance learning for depression detection with facial expression videos. IEEE Trans. Neural Syst. Rehabil. Eng. 2022, 31, 554–563. [Google Scholar] [CrossRef] [PubMed]
  8. Yang, N.; Liu, J.; Sun, D.; Ding, J.; Sun, L.; Qi, X.; Yan, W. Motor Symptoms of Parkinson’s Disease: Critical Markers for Early AI-assisted Diagnosis. Front. Aging Neurosci. 2025, 17, 1602426. [Google Scholar] [CrossRef] [PubMed]
  9. Rangel-Cascajosa, C.; Luna-Perejón, F.; Vicente-Diaz, S.; Domínguez-Morales, M. Gait-Based Parkinson’s Disease Detection Using Recurrent Neural Networks for Wearable Systems. Big Data Cogn. Comput. 2025, 9, 183. [Google Scholar] [CrossRef]
  10. Brien, D.C.; Riek, H.C.; Yep, R.; Huang, J.; Coe, B.; Areshenkoff, C.; Grimes, D.; Jog, M.; Lang, A.; Marras, C.; et al. Classification and staging of Parkinson’s disease using video-based eye tracking. Park. Relat. Disord. 2023, 110, 105316. [Google Scholar] [CrossRef] [PubMed]
  11. Maddage, N.C.; Senaratne, R.; Low, L.S.A.; Lech, M.; Allen, N. Video-based detection of the clinical depression in adolescents. In Proceedings of the Annual International Conference of the IEEE Engineering in Medicine and Biology Society; IEEE: New York, NY, USA, 2009; pp. 3723–3726. [Google Scholar]
  12. Mu, X.; Seyedi, S.; Zheng, I.; Jiang, Z.; Chen, L.; Omofojoye, B.; Hershenberg, R.; Levey, A.I.; Clifford, G.D.; Dodge, H.H.; et al. Detecting Cognitive Impairment and Psychological Well-being among Older Adults Using Facial, Acoustic, Linguistic, and Cardiovascular Patterns Derived from Remote Conversations. arXiv 2024, arXiv:2412.14194. [Google Scholar] [CrossRef] [PubMed]
  13. Escalante, H.J.; Kaya, H.; Salah, A.A.; Escalera, S.; Güçlütürk, Y.; Güçlü, U.; Baró, X.; Guyon, I.; Junior, J.C.J.; Madadi, M.; et al. Modeling, recognizing, and explaining apparent personality from videos. IEEE Trans. Affect. Comput. 2020, 13, 894–911. [Google Scholar] [CrossRef]
  14. Williamson, J.R.; Godoy, E.; Cha, M.; Schwarzentruber, A.; Khorrami, P.; Gwon, Y.; Kung, H.T.; Dagli, C.; Quatieri, T.F. Detecting depression using vocal, facial and semantic communication cues. In Proceedings of the International Workshop on Audio/Visual Emotion Challenge; ACM: New York, NY, USA, 2016; pp. 11–18. [Google Scholar]
  15. Song, S.; Shen, L.; Valstar, M. Human behaviour-based automatic depression analysis using hand-crafted statistics and deep learned spectral features. In Proceedings of the IEEE International Conference on Automatic Face & Gesture Recognition (FG 2018); IEEE: New York, NY, USA, 2018; pp. 158–165. [Google Scholar]
  16. Wei, P.C.; Peng, K.; Roitberg, A.; Yang, K.; Zhang, J.; Stiefelhagen, R. Multi-modal depression estimation based on sub-attentional fusion. In Proceedings of the European Conference on Computer Vision (ECCV); Springer: Berlin/Heidelberg, Germany, 2022; pp. 623–639. [Google Scholar]
  17. Gimeno-Gómez, D.; Bucur, A.M.; Cosma, A.; Martínez-Hinarejos, C.D.; Rosso, P. Reading between the frames: Multi-modal depression detection in videos from non-verbal cues. In Proceedings of the European Conference on Information Retrieval; Springer: Berlin/Heidelberg, Germany, 2024; pp. 191–209. [Google Scholar]
  18. Jaegle, A.; Gimeno, F.; Brock, A.; Vinyals, O.; Zisserman, A.; Carreira, J. Perceiver: General perception with iterative attention. In Proceedings of the International Conference on Machine Learning; PMLR: New York, NY, USA, 2021; pp. 4651–4664. [Google Scholar]
  19. Zhang, Z.; Zhang, S.; Ni, D.; Wei, Z.; Yang, K.; Jin, S.; Huang, G.; Liang, Z.; Zhang, L.; Li, L.; et al. Multimodal sensing for depression risk detection: Integrating audio, video, and text data. Sensors 2024, 24, 3714. [Google Scholar] [CrossRef]
  20. Kyprakis, I.; Skaramagkas, V.; Boura, I.; Karamanis, G.; Fotiadis, D.I.; Kefalopoulou, Z.; Spanaki, C.; Tsiknakis, M. A Deep Learning approach for Depressive Symptoms assessment in Parkinson’s disease patients using facial videos. arXiv 2025, arXiv:2505.03845. [Google Scholar]
  21. Liu, Z.; Ning, J.; Cao, Y.; Wei, Y.; Zhang, Z.; Lin, S.; Hu, H. Video swin transformer. In Proceedings of the IEEE/CVF Conference on Computer Vision and Pattern Recognition (CVPR); IEEE: New York, NY, USA, 2022; pp. 3202–3211. [Google Scholar]
  22. Yoon, J.; Kang, C.; Kim, S.; Han, J. D-vlog: Multimodal vlog dataset for depression detection. In Proceedings of the AAAI Conference on Artificial Intelligence; AAAI Press: Palo Alto, CA, USA, 2022; Volume 36, pp. 12226–12234. [Google Scholar] [CrossRef]
  23. Dolgushin, M.; Guseva, D.; Karpov, A. Investigation of Explainable Multimodal Methods for Detecting Mental Disorders. In Proceedings of the International Conference on Speech and Computer (SPECOM); Springer: Berlin/Heidelberg, Germany, 2025; pp. 173–187. [Google Scholar]
  24. Zhou, A.; Li, S.; Sriram, P.; Li, X.; Dong, J.; Sharma, A.; Zhong, Y.; Luo, S.; Kindratenko, V.; Heintz, G.; et al. Youtubepd: A multimodal benchmark for Parkinson’s disease analysis. Adv. Neural Inf. Process. Syst. 2023, 36, 55140–55159. [Google Scholar]
  25. Calvo-Ariza, N.R.; Gómez-Gómez, L.F.; Orozco-Arroyave, J.R. Classical FE Analysis to Classify Parkinson’s Disease Patients. Electronics 2022, 11, 3533. [Google Scholar] [CrossRef]
  26. Rabie, H.; Akhloufi, M.A. A review of machine learning and deep learning for Parkinson’s disease detection. Discov. Artif. Intell. 2025, 5, 24. [Google Scholar] [CrossRef] [PubMed]
  27. Valstar, M.; Schuller, B.; Smith, K.; Eyben, F.; Jiang, B.; Bilakhia, S.; Schnieder, S.; Cowie, R.; Pantic, M. AVEC 2013: The continuous audio/visual emotion and depression recognition challenge. In Proceedings of the ACM International Workshop on Audio/Visual Emotion Challenge; ACM: New York, NY, USA, 2013; pp. 3–10. [Google Scholar]
  28. Valstar, M.; Schuller, B.; Smith, K.; Almaev, T.; Eyben, F.; Krajewski, J.; Cowie, R.; Pantic, M. AVEC 2014: 3D Dimensional Affect and Depression Recognition Challenge. In Proceedings of the International Workshop on Audio/Visual Emotion Challenge; Association for Computing Machinery: New York, NY, USA, 2014; pp. 3–10. [Google Scholar]
  29. Gratch, J.; Artstein, R.; Lucas, G.M.; Stratou, G.; Scherer, S.; Nazarian, A.; Wood, R.; Boberg, J.; DeVault, D.; Marsella, S.; et al. The distress analysis interview corpus of human and computer interviews. In Proceedings of the International Conference on Language Resources and Evaluation (LREC), Reykjavik, Iceland, 26–31 May 2014; Volume 14, pp. 3123–3128. [Google Scholar]
  30. DeVault, D.; Artstein, R.; Benn, G.; Dey, T.; Fast, E.; Gainer, A.; Georgila, K.; Gratch, J.; Hartholt, A.; Lhommet, M.; et al. SimSensei Kiosk: A virtual human interviewer for healthcare decision support. In Proceedings of the International Conference on Autonomous Agents and Multi-Agent Systems; ACM: New York, NY, USA, 2014; pp. 1061–1068. [Google Scholar]
  31. Baltrušaitis, T.; Robinson, P.; Morency, L.P. OpenFace: An open source facial behavior analysis toolkit. In Proceedings of the 2016 IEEE Winter Conference on Applications of Computer Vision (WACV); IEEE: New York, NY, USA, 2016; pp. 1–10. [Google Scholar]
  32. Correia, J.; Teixeira, F.; Botelho, C.; Trancoso, I.; Raj, B. The in-the-wild speech medical corpus. In Proceedings of the IEEE International Conference on Acoustics, Speech and Signal Processing (ICASSP); IEEE: New York, NY, USA, 2021; pp. 6973–6977. [Google Scholar]
  33. Dodge, H.H.; Yu, K.; Wu, C.Y.; Pruitt, P.J.; Asgari, M.; Kaye, J.A.; Hampstead, B.M.; Struble, L.; Potempa, K.; Lichtenberg, P.; et al. Internet-based conversational engagement randomized controlled clinical trial (I-CONECT) among socially isolated adults 75+ years old with normal cognition or mild cognitive impairment: Topline results. Gerontol. 2024, 64, gnad147. [Google Scholar] [CrossRef] [PubMed]
  34. Oquab, M.; Darcet, T.; Moutakanni, T.; Vo, H.; Szafraniec, M.; Khalidov, V.; Fernandez, P.; Haziza, D.; Massa, F.; El-Nouby, A.; et al. Dinov2: Learning robust visual features without supervision. arXiv 2023, arXiv:2304.07193. [Google Scholar]
  35. Boccignone, G.; Conte, D.; Cuculo, V.; D’Amelio, A.; Grossi, G.; Lanzarotti, R.; Mortara, E. pyVHR: A Python framework for remote photoplethysmography. PeerJ Comput. Sci. 2022, 8, e929. [Google Scholar] [CrossRef]
  36. Teng, S.; Chai, S.; Liu, J.; Tateyama, T.; Lin, L.; Chen, Y.W. Multi-Modal and Multi-Task Depression Detection with Sentiment Assistance. In Proceedings of the 2024 IEEE International Conference on Consumer Electronics (ICCE); IEEE: New York, NY, USA, 2024; pp. 1–5. [Google Scholar]
  37. Yang, Q.; Zhou, J.; Wei, Z. Time Perspective-Enhanced Suicidal Ideation Detection Using Multi-Task Learning. Int. J. Netw. Dyn. Intell. 2024, 3, 100011. [Google Scholar] [CrossRef]
  38. Hu, Y.H.; Wu, R.Y.; Su, M.Y.; Lin, I.L.; Shen, C.C. Multimodal Multitask Learning for Predicting Depression Severity and Suicide Risk Using Pretrained Audio and Text Embeddings: Methodology Development and Application. JMIR Med Inf. 2025, 13, e66907. [Google Scholar] [CrossRef]
  39. Białek, K.; Potulska-Chromik, A.; Jakubowski, J.; Nojszewska, M.; Kostera-Pruszczyk, A. Analysis of handwriting for recognition of Parkinson’s disease: Current state and new study. Electronics 2024, 13, 3962. [Google Scholar] [CrossRef]
  40. Markovic, F.; Jovanovic, L.; Spalevic, P.; Kaljevic, J.; Zivkovic, M.; Simic, V.; Shaker, H.; Bacanin, N. Parkinsons detection from gait time series classification using modified metaheuristic optimized long short term memory. Neural Process. Lett. 2025, 57, 14. [Google Scholar] [CrossRef]
  41. Lim, W.S.; Chiu, S.I.; Wu, M.C.; Tsai, S.F.; Wang, P.H.; Lin, K.P.; Chen, Y.M.; Peng, P.L.; Chen, Y.Y.; Jang, J.S.R.; et al. An integrated biometric voice and facial features for early detection of Parkinson’s disease. NPJ Park. Dis. 2022, 8, 145. [Google Scholar] [CrossRef] [PubMed]
  42. Lv, C.; Fan, L.; Li, H.; Ma, J.; Jiang, W.; Ma, X. Leveraging multimodal deep learning framework and a comprehensive audio-visual dataset to advance Parkinson’s detection. Biomed. Signal Process. Control 2024, 95, 106480. [Google Scholar] [CrossRef]
  43. Junaid, M.; Ghergherehchi, M.; Lee, S. Multitask Deep Learning for Predicting Parkinson’s Progression and Depression From Multimodal Time Series Data. IEEE Access 2025, 13, 147818–147841. [Google Scholar] [CrossRef]
  44. Lin, T.Y.; Maire, M.; Belongie, S.; Hays, J.; Perona, P.; Ramanan, D.; Dollár, P.; Zitnick, C.L. Microsoft COCO: Common objects in context. In Proceedings of the European Conference on Computer Vision (ECCV); Springer: Berlin/Heidelberg, Germany, 2014; pp. 740–755. [Google Scholar]
  45. Radford, A.; Kim, J.W.; Hallacy, C.; Ramesh, A.; Goh, G.; Agarwal, S.; Sastry, G.; Askell, A.; Mishkin, P.; Clark, J.; et al. Learning transferable visual models from natural language supervision. In Proceedings of the International Conference on Machine Learning (ICML); PmLR: New York, NY, USA, 2021; pp. 8748–8763. [Google Scholar]
  46. Deng, J.; Dong, W.; Socher, R.; Li, L.J.; Li, K.; Fei-Fei, L. Imagenet: A large-scale hierarchical image database. In Proceedings of the IEEE/CVF Conference on Computer Vision and Pattern Recognition (CVPR); IEEE: New York, NY, USA, 2009; pp. 248–255. [Google Scholar]
  47. Zou, Y.; Yi, S.; Li, Y.; Li, R. A closer look at the cls token for cross-domain few-shot learning. Adv. Neural Inf. Process. Syst. 2024, 37, 85523–85545. [Google Scholar]
  48. Zhao, Z.; Liu, Y.; Wu, H.; Wang, M.; Li, Y.; Wang, S.; Teng, L.; Liu, D.; Cui, Z.; Wang, Q.; et al. CLIP in medical imaging: A survey. Med Image Anal. 2025, 102, 103551. [Google Scholar] [CrossRef] [PubMed]
  49. Oh, S.; Kim, N.; Ryu, J. Analyzing to discover origins of CNNs and ViT architectures in medical images. Sci. Rep. 2024, 14, 8755. [Google Scholar] [CrossRef]
  50. Vaswani, A.; Shazeer, N.; Parmar, N.; Uszkoreit, J.; Jones, L.; Gomez, A.N.; Kaiser, Ł.; Polosukhin, I. Attention is all you need. In Proceedings of the Annual Conference on Neural Information Processing Systems (NeurIPS), Long Beach, CA, USA, 4–9 December 2017; pp. 1–11. [Google Scholar]
  51. Gu, A.; Dao, T. Mamba: Linear-time sequence modeling with selective state spaces. In Proceedings of the International Conference on Learning Representations (ICLR), Vienna, Austria, 7–11 May 2024; pp. 1–27. [Google Scholar]
  52. Alomar, K.; Aysel, H.I.; Cai, X. CNNs, RNNs and Transformers in human action recognition: A survey and a hybrid model. Artif. Intell. Rev. 2025, 58, 387. [Google Scholar] [CrossRef]
  53. Snell, J.; Swersky, K.; Zemel, R. Prototypical networks for few-shot learning. In Proceedings of the International Conference on Neural Information Processing Systems; Curran Associates Inc.: Red Hook, NY, USA, 2017; pp. 4080–4090. [Google Scholar]
  54. Demšar, J. Statistical comparisons of classifiers over multiple data sets. J. Mach. Learn. Res. 2006, 7, 1–30. [Google Scholar]
  55. Selvaraju, R.R.; Cogswell, M.; Das, A.; Vedantam, R.; Parikh, D.; Batra, D. Grad-cam: Visual explanations from deep networks via gradient-based localization. In Proceedings of the IEEE/CVF International Conference on Computer Vision (ICCV); IEEE: New York, NY, USA, 2017; pp. 618–626. [Google Scholar]
Figure 1. General pipeline of the proposed DEPART technique. The flame icon represents the use of trained models. The snowflake icon represents the use of frozen pre-trained models. The arrows correspond to the data flow in the pipeline. YouTube ID of an individual: ZvBft_FBnXk.
Bdcc 10 00089 g001
Figure 2. Ablation study for different α values and the number of prototypes.
Bdcc 10 00089 g002
Figure 3. Analysis of typical model errors for video instances of healthy individuals predicted to have PD. YouTube IDs of the individuals: XjDvaq0S71Q, JhJipbWKmoA, and P5Ie6bvtFNU.
Bdcc 10 00089 g003
Figure 4. Visualization of the model’s attention to task-specific regions of interest. The color overlay indicates attention intensity, with warmer colors corresponding to stronger model attention. YouTube IDs of the individuals: Srr1rn6-rl0, _8P29K_7ptc, and ZvBft_FBnXk.
Bdcc 10 00089 g004
Table 1. Comprehensive review of video-based SOTA methods for depression and PD detection. The best results are highlighted in bold.
MethodCorpusModelFeatures
Depression
Williamson et al. [14]DAIC-WOZGaussian staircase regressorFAU
Song et al. [15]DAIC-WOZCNNFAU, GT, Head PL
Wei et al. [16]DAIC-WOZConvBiLSTMFAU, GT, Head PL
Gimeno-Gómez et al. [17]DAIC-WOZPerceiver [18]FL, FAU, GT, Head PL
Transformer with Modality and Position Condition
Zhang et al. [19]OwnResNet34 Swin-Transformer with BiLSTM and Multi-Head AttentionNeural Face Embeddings
Kyprakis et al. [20]OwnViT based on SWIN [21]Neural Face Embeddings
Yoon et al. [22]D-VlogTransformerFAU
Dolgushin et al. [23]WSMMajority voting of classifiers SVM, CNN, Random ForestResNet50, FL, PL
PD
Zhou et al. [24]YouTubePDFE ResNet50 and FL Region Encoders with Spatial-Temporal AttentionFrame and Region embeddings
Calvo-Ariza et al. [25]OwnResNet50 for FAU prediction and SVMFAU
Dolgushin et al. [23]WSMMajority voting of classifiers CNN, DT, MLPPL, FL
Table 2. Distribution of segments and individual demographics by diagnose group and subset. Per-segment values are shown first and per-individual values are shown in parentheses.
ClassSubsetNumber of SamplesWomen, %Mean Age, Years
HealthyTrain3962 (353)58.2 (52.4)36.7 (35.5)
Development514 (63)57.2 (52.4)35.6 (34.3)
Test896 (63)69.2 (54.0)36.2 (34.9)
DepressionTrain1431 (191)57.4 (55.0)29.3 (29.9)
Development317 (38)63.1 (52.6)29.9 (29.5)
Test335 (37)60.6 (51.4)28.0 (28.9)
PDTrain1058 (157)52.3 (49.7)42.5 (45.1)
Development105 (24)55.2 (50.0)43.0 (44.6)
Test133 (28)26.3 (50.0)48.3 (45.0)
Table 3. Experimental results for various static (CLIP/ViT) and temporal (Mamba/Transformer) encoders and sequence lengths. Depr. means depression. The best results are highlighted in bold.
MethodSeq. Length,Recall/Precision, %UAR, %MF1, %Rank
FramesHealthyDepr.PD
CLIP + Mamba1055.02/90.9681.49/57.8471.43/27.1469.3158.529.4
CLIP + Mamba2067.52/86.9367.76/59.5875.19/34.8470.1662.346.6
CLIP + Mamba3053.68/86.3682.39/56.5660.90/25.3965.6656.3712.5
CLIP + Mamba6063.73/90.7877.61/67.0176.69/29.3972.6863.105.0
CLIP + Mamba9062.50/92.8780.90/61.1772.93/30.5072.1162.475.5
CLIP + Transformer1059.04/88.3572.84/58.3776.69/29.5769.5259.368.0
CLIP + Transformer2061.27/86.0568.96/64.3573.68/26.9867.9759.1010.2
CLIP + Transformer3054.24/90.4579.10/55.6774.44/27.9769.2658.0310.0
CLIP + Transformer6061.61/91.6982.99/59.0274.44/34.0273.0163.134.4
CLIP + Transformer9058.48/86.2678.81/55.3565.41/31.1067.5758.9910.5
ViT + Mamba1074.67/83.9465.07/60.0649.62/32.3560.2263.129.0
ViT + Mamba2063.62/81.6662.09/54.7449.62/23.0858.4453.7317.6
ViT + Mamba3066.96/83.4562.99/51.2148.87/27.9059.6155.4416.2
ViT + Mamba6073.44/83.6165.07/53.6936.09/28.0758.2056.2015.1
ViT + Mamba9069.87/83.5862.69/54.8346.62/26.7259.7256.1915.8
ViT + Transformer1065.07/86.2468.66/51.4554.14/29.8862.6257.1712.6
ViT + Transformer2069.42/88.8670.45/56.5947.37/25.5162.4157.9612.0
ViT + Transformer3072.99/82.9964.18/56.1441.35/28.5059.5157.1214.5
ViT + Transformer6071.43/88.7776.12/61.3560.90/36.2469.4864.065.1
ViT + Transformer9073.77/84.5571.64/58.1944.36/34.8863.2660.729.2
Table 4. Grid search results for hyperparameters.
HyperparameterSearch ValuesTransformerMamba
Hidden dimension ( D h ){64, 128, 256, 512, 1024}128128
Output features ( D cls ){64, 128, 256, 512, 1024}512512
Number of layers (H){2, 3, 4, 5, 6, 7, 8, 9}57
Number of attention heads{2, 4, 8, 16}2
State dimension{4, 8, 16, 32}16
Kernel size{3, 4, 5, 6, 7, 8, 9}7
Global scalar ( λ ){0, 0.05, 0.10, …, 1}0.750.75
Prototype-based model hyperparameters
Temperature ( τ ){0.05, 0.1, 0.2, …, 10}0.1
Contrastive weight ( α ){0, 0.05, 0.10, …, 1}0.05
Number of prototypes per class ( N p ){1, 2, …, 20}9
Training parameters
Scheduler type{none, plateau, cosine}nonenone
Learning rate{ 10 3 , 10 4 , 10 5 , 10 6 } 10 5 10 5
Optimizer{adam, adamw, lion, sgd}adamwadamw
Dropout rate{0.1, 0.15, 0.2, 0.25, 0.3}0.250.25
Table 5. Experimental results for CLIP + Transformer with various modifications. The sequence length is set to 60 frames. The best results are highlighted in bold.
ModificationRecall/Precision, %UAR, %MF1, %Rank
HealthyDepr.PD
CLIP + Transformer (60) ( λ = 1.0 )61.61/91.6982.99/59.0274.44/34.0273.0163.133.2
+ FGC ( λ = 0.75 )62.83/92.6082.99/61.5076.69/33.5574.1764.072.6
+ TWG68.86/88.7878.21/68.4169.17/32.1772.0864.823.6
+ FWG68.86/88.7878.21/68.7769.92/32.2972.3364.983.0
+ Prototype65.96/89.5579.70/66.9278.20/34.1074.6265.402.0
Table 6. Ablation study of loss components in the prototype-aware CLIP + Transformer (60) model. The best results are highlighted in bold.
L fusion L cls L proto L cont Recall/Precision, %UAR, %MF1, %Rank
HealthyDepr.PD
+64.17/89.7080.60/64.7577.44/33.6674.0764.525.6
+61.83/90.3882.09/61.2575.94/33.4473.2963.348.2
+71.65/82.3164.48/78.8367.67/29.0367.9362.7310.9
+72.21/62.4666.27/75.0365.41/70.0967.9663.129.1
++61.94/89.8182.39/61.0678.20/35.3774.1864.066.0
++65.51/88.8079.40/64.7272.18/32.8872.3763.9610.2
++65.96/89.5579.70/66.9278.20/34.1074.6265.404.1
++64.40/89.0480.30/64.0574.44/33.4573.0464.059.5
++69.08/86.6975.22/67.7475.19/35.9773.1765.616.1
++71.76/81.3963.28/79.1064.66/28.1066.5761.9211.5
+++64.62/89.4980.90/64.6875.19/33.5673.5764.456.6
+++65.62/89.0980.30/64.5176.69/35.5474.2165.235.1
+++62.95/88.8280.30/62.1273.68/33.1172.3163.1411.1
+++64.73/89.0980.30/64.2074.44/33.6773.1664.247.9
++++64.51/89.4781.19/64.6175.19/33.6773.6364.486.2
Table 7. Comparison of the proposed method with SOTA solutions evaluated on WSM. MT and ST refer to a multi-task and single-task learning type, respectively. NL refers to number of layers. The best results are highlighted in bold.
MethodMT/STNLRecall/Precision, %UAR, %MF1/WF1, %Rank
HealthyDepr./PD
Depression
CLIP + Transformer (60) + PrototypeMT582.11/87.2682.39/75.8282.2581.79/82.323.0
CLIP + Transformer (60) + PrototypeST574.59/83.0377.61/67.5376.1075.40/76.016.6
CLIP + Transformer (60)586.18/83.4674.93/78.6880.5580.78/81.543.9
CLIP + Transformer (60)482.52/84.4177.61/75.1480.0779.91/80.584.9
CLIP + Transformer (60)383.33/90.9187.76/78.1985.5584.83/85.231.4
CLIP + Transformer (60)281.50/85.8780.30/74.7280.9080.52/81.114.4
Correia et al. [32] (Audio)77.0076.90/–6.5
Dolgushin et al. [23]87.37/–80.84/–84.11–/83.381.8
Yoon et al. [22] (D-Vlog corpus, Visual)–/56.38
Yoon et al. [22] (D-Vlog corpus, Multimodal)–/63.50
Gimeno-Gómez et al. [17] (D-Vlog corpus, Multimodal)–/76.00
PD
CLIP + Transformer (60) + PrototypeMT555.45/88.5478.20/36.6266.8259.03/63.655.1
CLIP + Transformer (60) + PrototypeST560.15/90.0079.70/39.7069.9262.55/67.373.9
CLIP + Transformer (60)577.23/89.1471.43/50.8074.3371.07/76.973.0
CLIP + Transformer (60)478.96/91.6778.20/55.0378.5874.42/79.831.3
CLIP + Transformer (60)348.51/86.7377.44/33.1262.9854.31/58.306.6
CLIP + Transformer (60)269.80/87.3169.17/42.9969.4965.30/71.504.4
Correia et al. [32] (Audio)77.8077.80/–1.5
Dolgushin et al. [23]91.27/–40.00/–65.63–/71.884.0
Zhou et al. [24] (YouTubePD corpus, Visual)–/59.00
Zhou et al. [24] (YouTubePD corpus, Multimodal)–/61.00
Table 8. Comparison of multi-task (MT) and single-task (ST) model performances on the cleaned Test data. NL is the number of layers. The best results are highlighted in bold.
MethodMT/STNLClean.Recall/Precision, %UAR, %MF1/WF1, %Rank
HealthyDepr./PD
Depression
CLIP + Transformer (60) + PrototypeMT582.11/87.2682.39/75.8282.2581.79/82.323.57
CLIP + Transformer (60)ST383.33/90.9187.76/78.1985.5584.83/85.231.86
CLIP + Transformer (60) + PrototypeMT5+79.84/89.9787.50/75.5683.6782.85/83.143.29
CLIP + Transformer (60)ST3+81.68/95.4194.49/78.5988.0886.91/87.101.29
PD
CLIP + Transformer (60) + PrototypeMT555.45/88.5478.20/36.6266.8259.03/63.653.93
CLIP + Transformer (60)ST478.96/91.6778.20/55.0378.5874.42/79.831.93
CLIP + Transformer (60) + PrototypeMT5+75.29/93.3086.14/57.6280.7176.19/79.331.29
CLIP + Transformer (60)ST4+73.75/91.3982.18/54.9777.9673.75/77.202.86
Disclaimer/Publisher’s Note: The statements, opinions and data contained in all publications are solely those of the individual author(s) and contributor(s) and not of MDPI and/or the editor(s). MDPI and/or the editor(s) disclaim responsibility for any injury to people or property resulting from any ideas, methods, instructions or products referred to in the content.